Cell-type-specific control of basolateral amygdala neuronal circuits via entorhinal cortex-driven feedforward inhibition
- University of Colorado Anschutz Medical Campus, United States
Figures
Figure 1
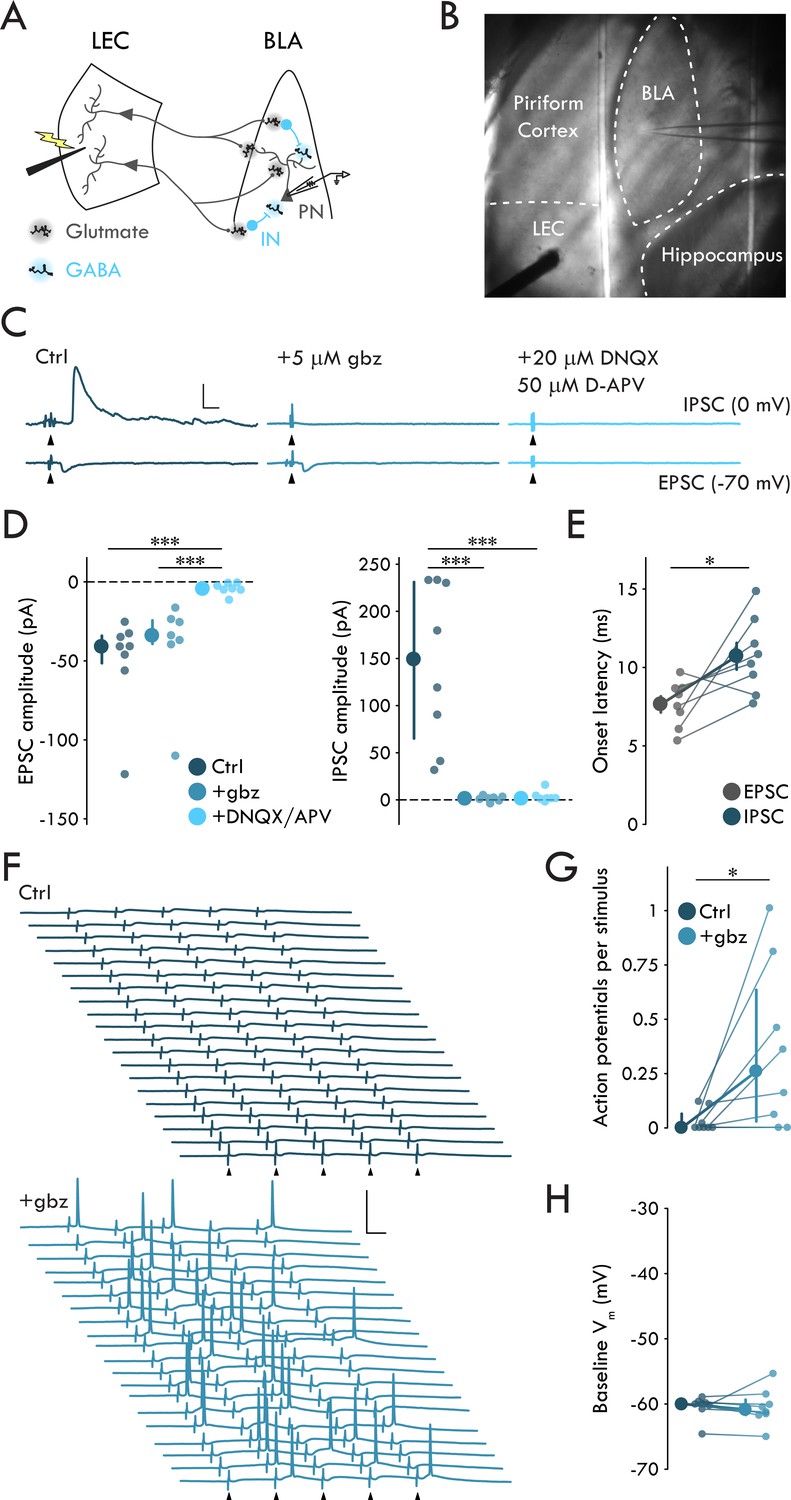
LEC afferents preferentially drive disynaptic FFI in BLA.
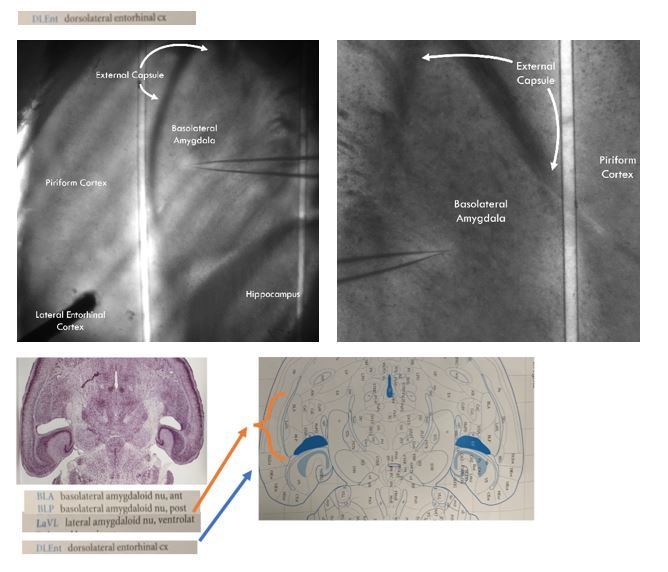
(A) Experimental schematic. (B) Representative image of experimental preparation. LEC and BLA as well as neighboring hippocampus and piriform cortex are labeled. The external capsule can be seen running laterally of BLA and forming its border with piriform cortex. Note the stimulation electrode positioned in LEC and recording pipette in BLA. (C) Representative traces of EPSCs and IPSCs in a BLA PN in response to LEC stimulation (top: control; middle: gbz, 5 μM; bottom: DNQX, 20 μM, D-APV, 50 μM). Arrowheads: stimulation (artifacts truncated). Scale bars: 100 pA, 10 ms. (D) EPSCs blocked by DNQX/APV (Kruskal-Wallis test: p = 6.72 × 10⁻⁴; ncontrol = 8, 4, ngbz = 7, 4, nDNQX/APV = 7, 4). IPSCs blocked by gbz and DNQX/APV (Kruskal-Wallis test: p = 6.45 × 10⁻⁴; ncontrol = 8, 4, ngbz = 7, 4, nDNQX/APV = 7, 4). (E) Onset latency of IPSC is delayed relative to the EPSC (paired t-test: p=0.023, n = 8, 4). (F) 20 voltage traces from a representative BLA PN (top: control; bottom: gbz) in response to 5 × stimulation of LEC at 20 Hz. Arrowheads: stimulation. Scale bars: 40 mV, 20 ms. (G) GABAA receptor blockade increases AP firing in BLA PNs in response to LEC stimulation (Wilcoxon signed-rank test: p=0.031, n = 8, 3). (H) Baseline Vm did not differ between control and gbz (Wilcoxon signed-rank test: p=0.38, n = 8, 3). Summary statistics in E presented as mean ± standard error of the mean (s.e.m.). Summary statistics in D, G, H presented as median with interquartile range (IQR). Individual data points presented adjacent to the summary statistics. *p < 0.05, ***p < 0.001. See Figure 1—source data 1 for a table with full details on all statistical tests used in this figure. See Figure 1—source data 2 for a table of all individual data points displayed in Figure 1.
-
Figure 1—source data 1
Table of statistical analyses used in Figure 1.
Normal data data presented as mean ± s.e.m. Non-normal data presented as median and [1st quartile/3rd quartile].
- https://cdn.elifesciences.org/articles/50601/elife-50601-fig1-data1-v2.xlsx
-
Figure 1—source data 2
Table of data included in Figure 1.
- https://cdn.elifesciences.org/articles/50601/elife-50601-fig1-data2-v2.xlsx
Figure 2 with 3 supplements
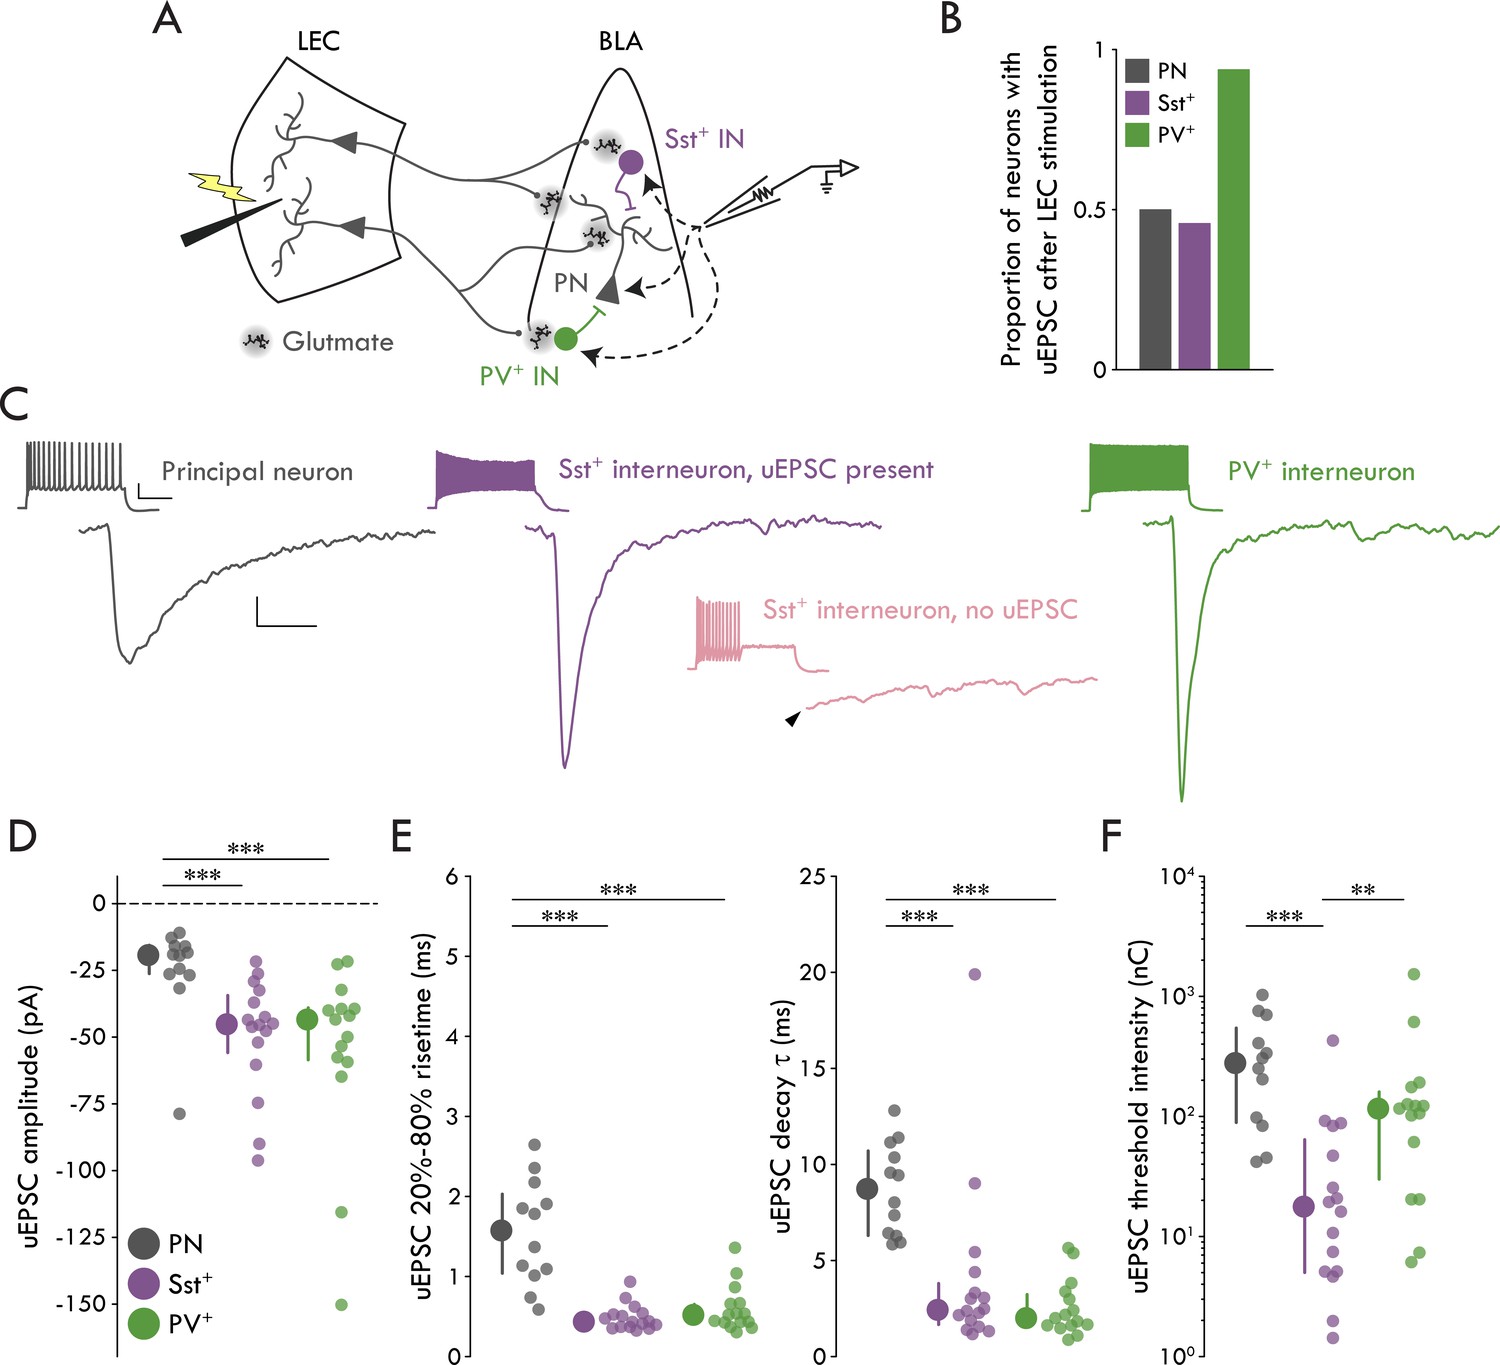
Cell type specificity of the LEC→BLA circuit.
(A) Experimental schematic. (B) Proportion of neurons with detectable uEPSCs following LEC stimulation. (C) Mean traces of uEPSC successes from representative neurons. Left to right: PN (gray), Sst+ IN with a detectable uEPSC (purple), PV+ IN (green). Lower middle: mean trace of lack of response in a representative Sst+ IN without a detectable uEPSC (pink). Arrowhead: truncated stimulus artifact. Scale bars: 5 pA, 5 ms. Insets: maximal firing to a current injection; scale bars: 20 mV, 200 ms. (D) uEPSC amplitude is larger in Sst+/PV+ INs compared to PNs (Kruskal-Wallis test: p = 5.55 × 10⁻⁴). (E) Left: uEPSC 20%-80% risetime is faster in Sst+/PV+ INs compared to PNs (Kruskal-Wallis test: p = 1.66 × 10⁻⁵). Right: uEPSC τDecay is faster in Sst+/PV+ INs compared to PNs (Kruskal-Wallis test: p = 2.18 × 10⁻⁵). (F) uEPSC threshold intensity is lower for Sst+ INs (Kruskal-Wallis test: p = 3.33 × 10⁻⁴). Summary statistics in D, E, and F presented as median with IQR. **p<0.01, ***p<0.001. For all statistical tests: nSst = 16, 8, nPV = 15, 5, nPN = 12, 8. See Figure 2—figure supplement 1 for example minimal stimulation experiments and data showing the glutamatergic nature of the LEC→BLA synapse. See Figure 2—figure supplement 2 for validation of the IN reporter mouse lines. See Figure 2—figure supplement 3 for additional characterization of the LEC→BLA circuit. See Figure 2—source data 1 for a table with full details on all statistical tests used in this figure. See Figure 2—source data 2 for a table of all individual data points displayed in Figure 2 and corresponding figure supplements.
-
Figure 2—source data 1
Table of statistical analyses used in Figure 2.
Non-normal data presented as median and [1st quartile/3rd quartile].
- https://cdn.elifesciences.org/articles/50601/elife-50601-fig2-data1-v2.xlsx
-
Figure 2—source data 2
Table of data included in Figure 2 and Supplements.
- https://cdn.elifesciences.org/articles/50601/elife-50601-fig2-data2-v2.xlsx
Figure 2—figure supplement 1
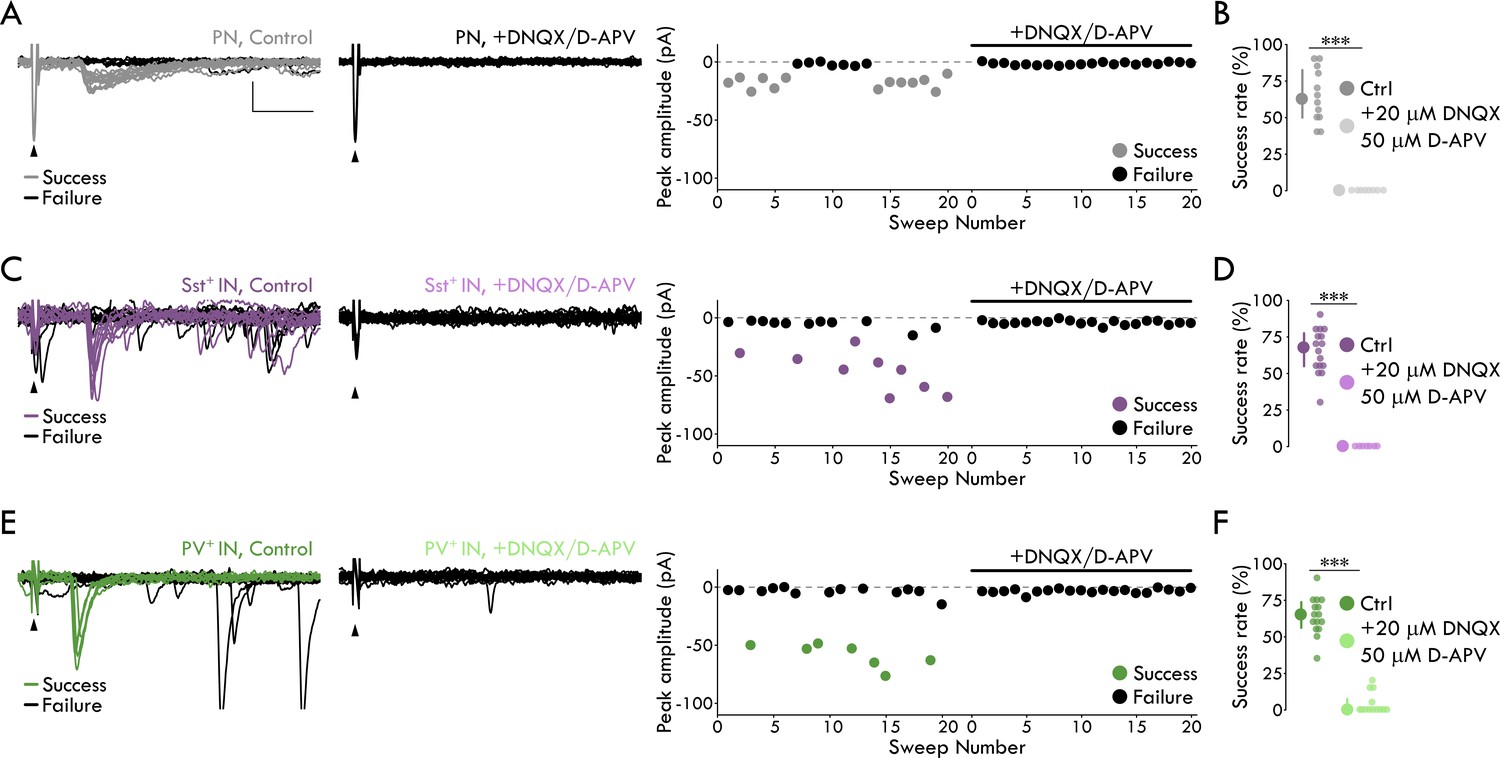
Representative minimal stimulation experiments and glutamatergic nature of responses to LEC afferents.
(A) Minimal stimulation experiment in a representative PN. Left: 20 overlaid sweeps in control conditions. Middle: 20 overlaid sweeps in the presence of 20 μM DNQX and 50 μM D-APV. Right: Trial by trial summary of peak amplitudes. Arrowheads denote stimulation artifacts. Scale bars: 25 pA, 10 ms. (B) Glutamate receptor blockade abolishes postsynaptic response in PNs (success rateCtrl = 62.50 [50.00/82.50] %, success rateDNQX/APV = 0.00 [0.00/0.00] %, p = 1.50 x 10⁻⁴, Mann-Whitney U test; nCtrl = 12 cells, 8 mice, nDNQX/APV = 8 cells, 7 mice; median [1st quartile/3rd quartile]). (C) As (A), but for a representative Sst+ IN. (D) As (B), but for Sst+ INs (success rateSCtrl = 67.5 [55.00/77.50] %, success rateDNQX/APV = 0.00 [0.00/0.00] %, p = 1.62 × 10⁻⁴, Mann-Whitney U test; nCtrl = 16 cells, 8 mice; nDNQX/APV = 7 cells, 6 mice). (E) As (A), but for a representative PV+ IN. (F) As (B), but for PV+ INs (success rateCtrl: 65 [56.25/73.75] %, success rateDNQX/APV = 0.00 [0.00/7.50] %, p = 5.33 × 10⁻⁶, Mann-Whitney U test, nCtrl = 15 cells, 5 mice, nDNQX/APV = 13 cells, 5 mice. In panels B, D, and F, data shown as median with IQR. ***p<0.001.
Figure 2—figure supplement 2
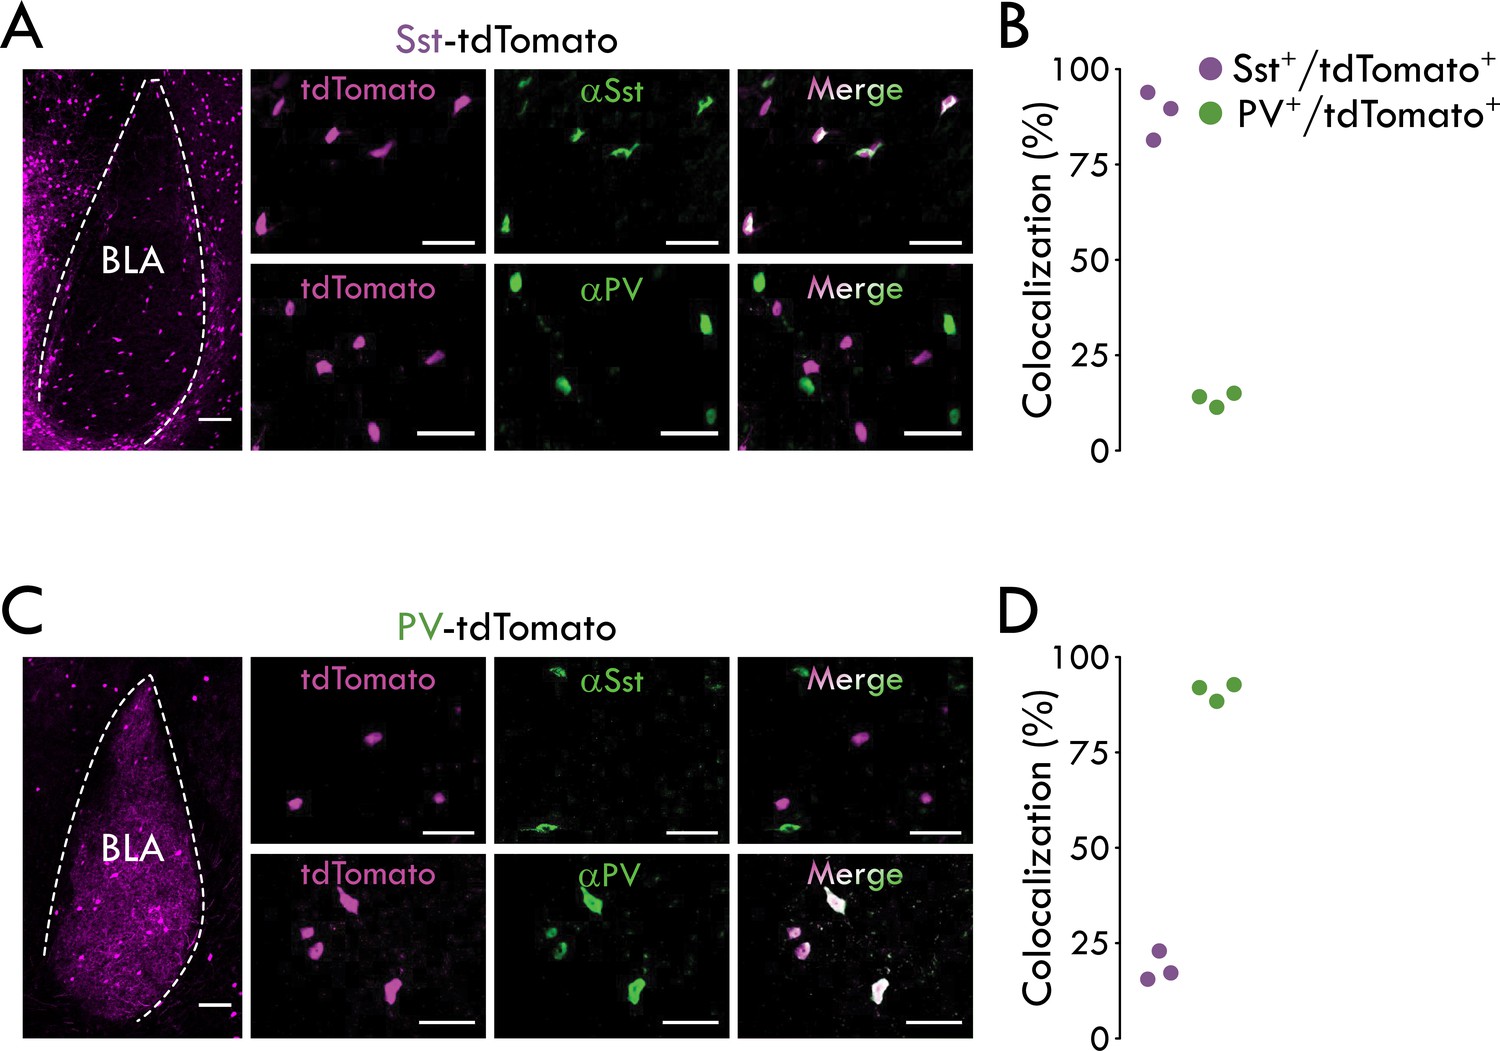
Validation of PV-tdTomato and Sst-tdTomato mouse lines.
(A) Left: Representative confocal image of tdTomato fluorescence in a coronal section from a Sst-tdTomato mouse containing BLA. Scale bar: 100 μm. Middle: Representative confocal images of colocalization experiment in a Sst-tdTomato mouse. Left panel, tdTomato fluorescence. Middle panel, αSst or αPV immunofluorescence. Right panel, merge. Scale bar: 50 μm. (B) Percent colocalization of αSst or αPV immunofluorescence with tdTomato fluorescence in Sst-tdTomato mice (88.09 ± 3.67% colocalization of αSst/tdTomato, 13.28 ± 1.11% colocalization of αPV/tdTomato, n = 3 mice; mean ± s.e.m.). (C) Left: Representative confocal image of tdTomato fluorescence in a coronal section from a PV-tdTomato mouse containing BLA. Scale bar: 100 μm. Middle: Representative confocal images of colocalization experiment in a PV-tdTomato mouse. Left panel, tdTomato fluorescence. Middle panel, αSst or αPV immunofluorescence. Right panel, merge. Scale bar: 50 μm. (D) Percent colocalization of αSst or αPV immunofluorescence with tdTomato fluorescence in PV-tdTomato mice (18.34 ± 2.24% colocalization of αSst/tdTomato, 90.82 ± 1.34% colocalization of αPV/tdTomato, n = 3 mice)..
Figure 2—figure supplement 3

Further characterization of the LEC→BLA circuit.
(A) Left: uEPSC latency does not differ across cell types (Sst+=8.66 ± 0.56 ms, PV+=7.72 ± 0.45 ms, PN = 8.67 ± 0.48 ms, one-way ANOVA: p=0.32). Right: uEPSC jitter does not differ across cell types (Sst+=1.14 ± 0.17 ms, PV+=1.35 ± 0.17 ms, PN = 1.40 ± 0.26 ms, one-way ANOVA: p=0.60). (B) No significant correlations between uEPSC amplitude and threshold stimulation intensity across cell types (rPN = 0.19, pPN = 0.56; rSst = 0.17, pSst = 0.52; rPV = 0.11, pPV = 0.71). Summary statistics in A presented as mean ± s.e.m. For all statistical tests: nSst = 16, 8, nPV = 15, 5, nPN = 12, 8..
Figure 3 with 2 supplements
A fast spiking phenotype distinguishes BLA Sst+ INs targeted by LEC afferents.
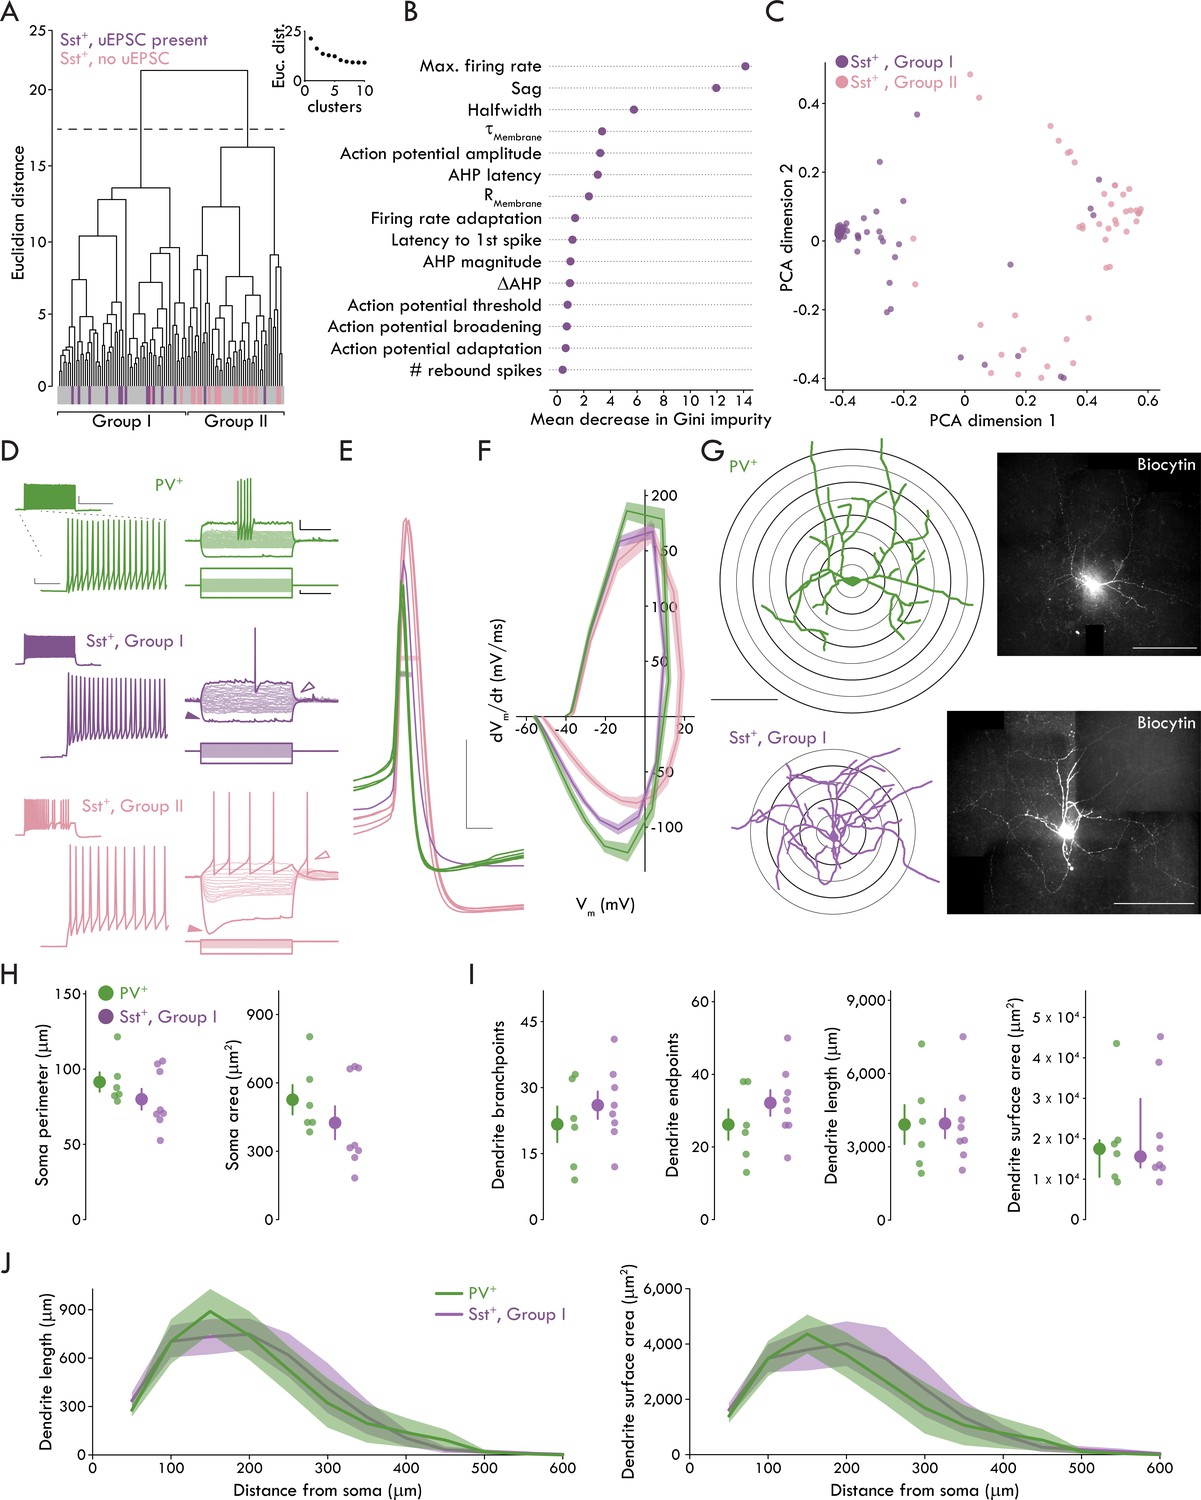
(A) Unsupervised clustering analysis revealed two clusters of Sst+ INs. Majority of Sst+ INs with a uEPSC present following LEC stimulation cluster in Group I (14/16, Sst+ INs with uEPSC; 60/105, all Sst+ INs). Majority of Sst+ INs with no response to LEC stimulation cluster in Group II (17/19, Sst+ INs without uEPSC; 45/105, all Sst+ INs). (B) Results of Random Forest model. Plot shows mean decrease in Gini impurity for each of the 15 parameters included in the model (nSst = 105, 23). Gini impurity measures how often a random Sst+ IN would be clustered incorrectly if labeled randomly according to the distribution of labels in the set. (C) First two dimensions of the principal components analysis (PCA) of the random forest proximity matrix (nSst = 105, 23). (D) Left: maximum AP firing from representative PV+ (top, green), Group I (middle, purple) and II (bottom, pink) Sst+ INs. Scale bars, main traces: 5 mV, 50 ms; inset: 20 mV, 400 ms. Right: voltage responses of the same neurons. Darker traces show responses to −200 pA and rheobase current injections. Lighter traces show responses to intermediate current injections were used to determine membrane resistance (−100 pA to sweep immediately before rheobase, Δ10 pA each sweep, +100 pA maximum current injection). Note lack of sag, rebound AP in Group I Sst+ IN (sag: closed arrowheads; rebound AP: open arrowheads). Scale bars: 10 mV, 200 ms; 50 pA, 200 ms. (E) APs of the same representative PV+ (green), Group I (purple), and II (pink) Sst+ INs at rheobase. Halfwidth: bar through width of AP. Scale bars: 20 mV, 1 ms. (F) Phase plots of PV+, Group I, and Group II Sst+ INs shows rate of voltage change for Group I and II APs at rheobase. Data presented as mean ± s.e.m. nPV = 52, 19, nSstI = 60, 23, nSstII = 45, 18. (G) Left: reconstructed soma and dendrites of a representative PV+ and Group I Sst+ INs (scale bar: 200 μm). Sholl rings shown beneath reconstruction. Right: confocal images of the biocytin filled PV+ and Group I Sst+ INs (scale bar: 200 μm). (H) No significant differences between PV+ and Group I Sst+ INs for soma perimeter (left; unpaired t-test: p=0.26) or area (right; Mann-Whitney U test: p=0.28). (I) No significant differences between PV+ and Group I Sst+ INs for (left to right) dendrite branchpoints (unpaired t-test: p=0.40), endpoints (unpaired t-test: p=0.30), length (unpaired t-test: p=0.97), or surface area (Mann-Whitney U test: p=0.95). (J) Results of Sholl analysis showing dendrite length (left) and surface area (right) as a function of distance from the soma in PV+ and Group I Sst+ INs. Data presented as mean ± s.e.m. nPV = 6, 4, nSstI = 8, 6. Summary statistics in H (perimeter) and I (branchpoints, endpoints, and length) presented as mean ± s.e.m. Summary statistics in H (area) and I (area) presented as median and IQR. For all statistical tests in (H) and (I): nPV = 6, 4, nSstI = 8, 6. See Figure 3—figure supplement 1 for decision tree data. See Figure 3—figure supplement 2 for data on Group II Sst+ IN morphology. See Figure 3—source data 1 for a table of summary data and statistical comparisons on all membrane properties studied for Group I and Group II Sst+ INs and PV+ INs. See Figure 3—source data 2 for a table with full details on all statistical tests used in this figure. See Figure 3—source data 3 for a table of the results of the hierarchical cluster analysis and used by the Decision Tree and Random Forest models to determine which membrane properties best distinguished the clusters (related to Figure 3A-C and Figure 3—figure supplement 1). See Figure 3—source data 4 for all individual data points of BLA IN membrane properties (related to Figure 3—source data 1). See Figure 3—source data 5 for all individual data points for phase plot in Figure 3F. See Figure 3—source data 6 for all individual data points on BLA IN morphology (related to Figure 3H-J).
-
Figure 3—source data 1
Differences in active and passive membrane properties among BLA Sst+ and PV+ INs.
Normal data are presented as mean ± s.e.m. with differences tested using a 1-way ANOVA with Tukey’s honestly significant difference post hoc test. Non-normal data are presented as median and IQR with differences tested using a Kruskal-Wallis (KW) test with Mann-Whitney U tests between groups as a post hoc. Multiple comparisons with the Mann-Whitney tests were corrected using the false discovery rate method where p < αFalseDiscoveryRate (FDR) was considered significant.
- https://cdn.elifesciences.org/articles/50601/elife-50601-fig3-data1-v2.xlsx
-
Figure 3—source data 2
Table of statistical analyses used in Figure 3.
Normal data presented as mean ± s.e.m. Non-normal data presented as median and [1st quartile/3rd quartile]. Data for I presented panel by panel from left to right.
- https://cdn.elifesciences.org/articles/50601/elife-50601-fig3-data2-v2.xlsx
-
Figure 3—source data 3
Table of results of hierarchical clustering.
- https://cdn.elifesciences.org/articles/50601/elife-50601-fig3-data3-v2.xlsx
-
Figure 3—source data 4
Table of membrane properties for all IN subtypes.
- https://cdn.elifesciences.org/articles/50601/elife-50601-fig3-data4-v2.xlsx
-
Figure 3—source data 5
Table of membrane voltage and derivative of membrane voltage, related to Figure 3F.
- https://cdn.elifesciences.org/articles/50601/elife-50601-fig3-data5-v2.xlsx
-
Figure 3—source data 6
Table of morphological data for Figure 3 and Supplements.
- https://cdn.elifesciences.org/articles/50601/elife-50601-fig3-data6-v2.xlsx
Figure 3—figure supplement 1
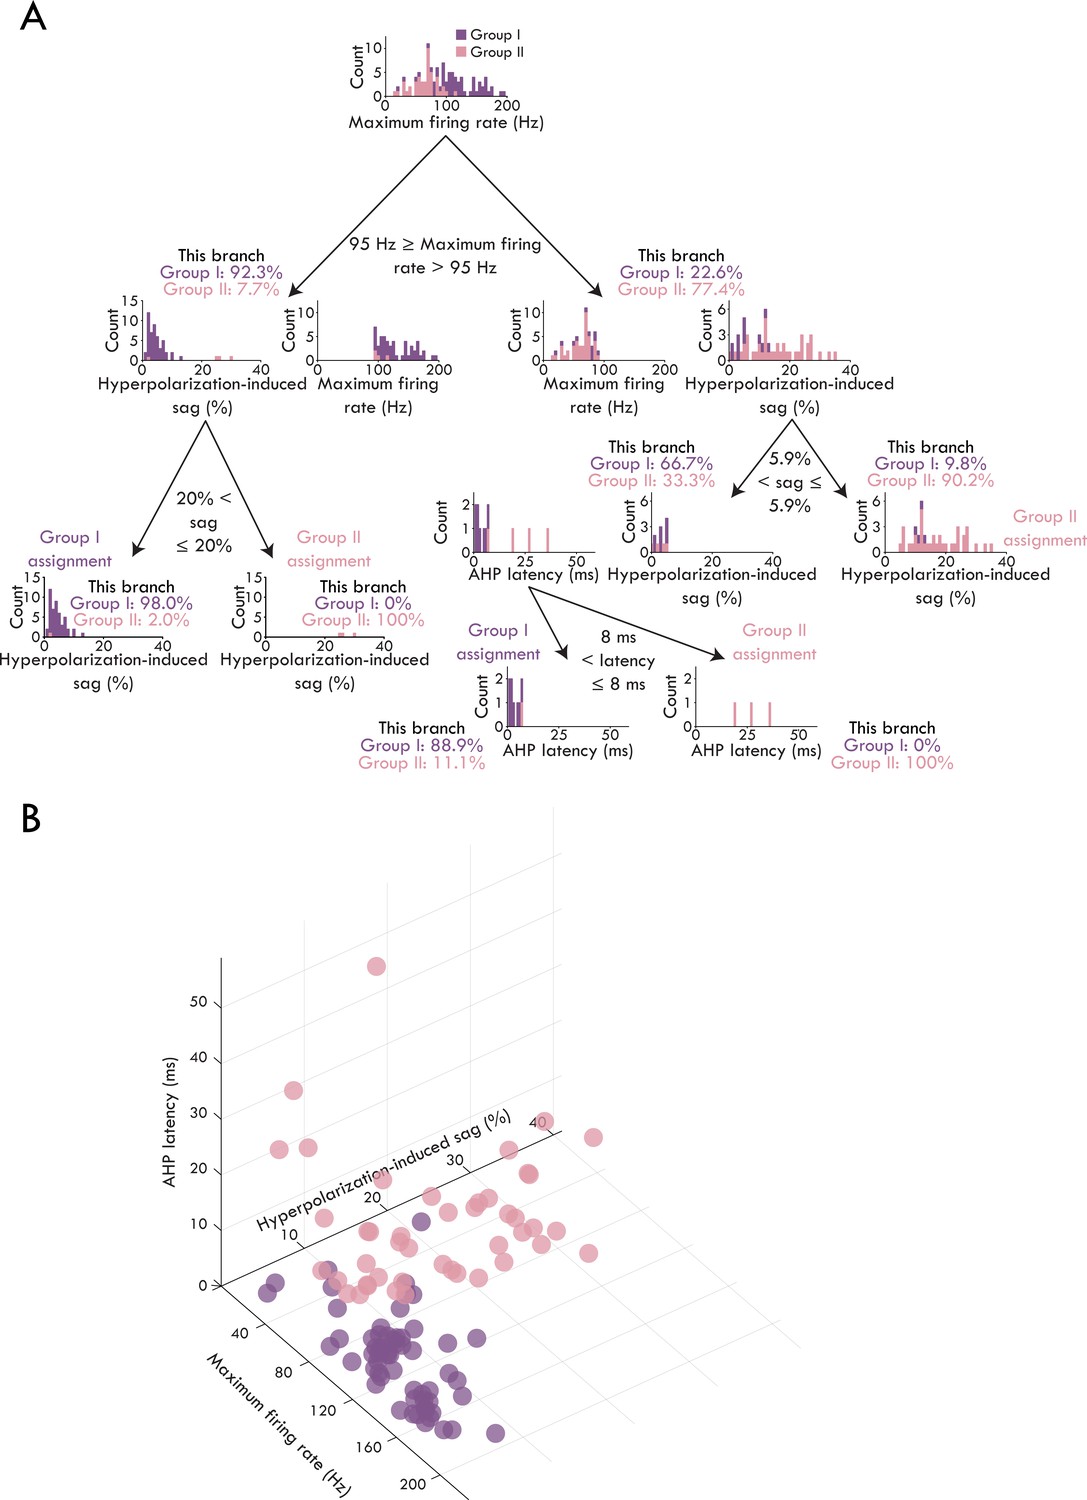
Decision tree analysis to determine most salient parameters that discriminate Group I and II Sst+ INs.
(A) Results of the decision tree model. The model returned maximum firing rate, hyperpolarization-induced sag, and AHP latency as the most salient parameters for separating Group I and Group II Sst+ INs. The tree shows the cut offs used to split the Sst+ INs. The histograms show the counts of the two Sst+ clusters at each branch of the decision tree (Group I: purple; Group II: pink). (B) Scatter plot showing Group I (purple) and Group II (pink) Sst+ IN maximum firing rates, hyperpolarization-induced sag, and AHP latency.
Figure 3—figure supplement 2
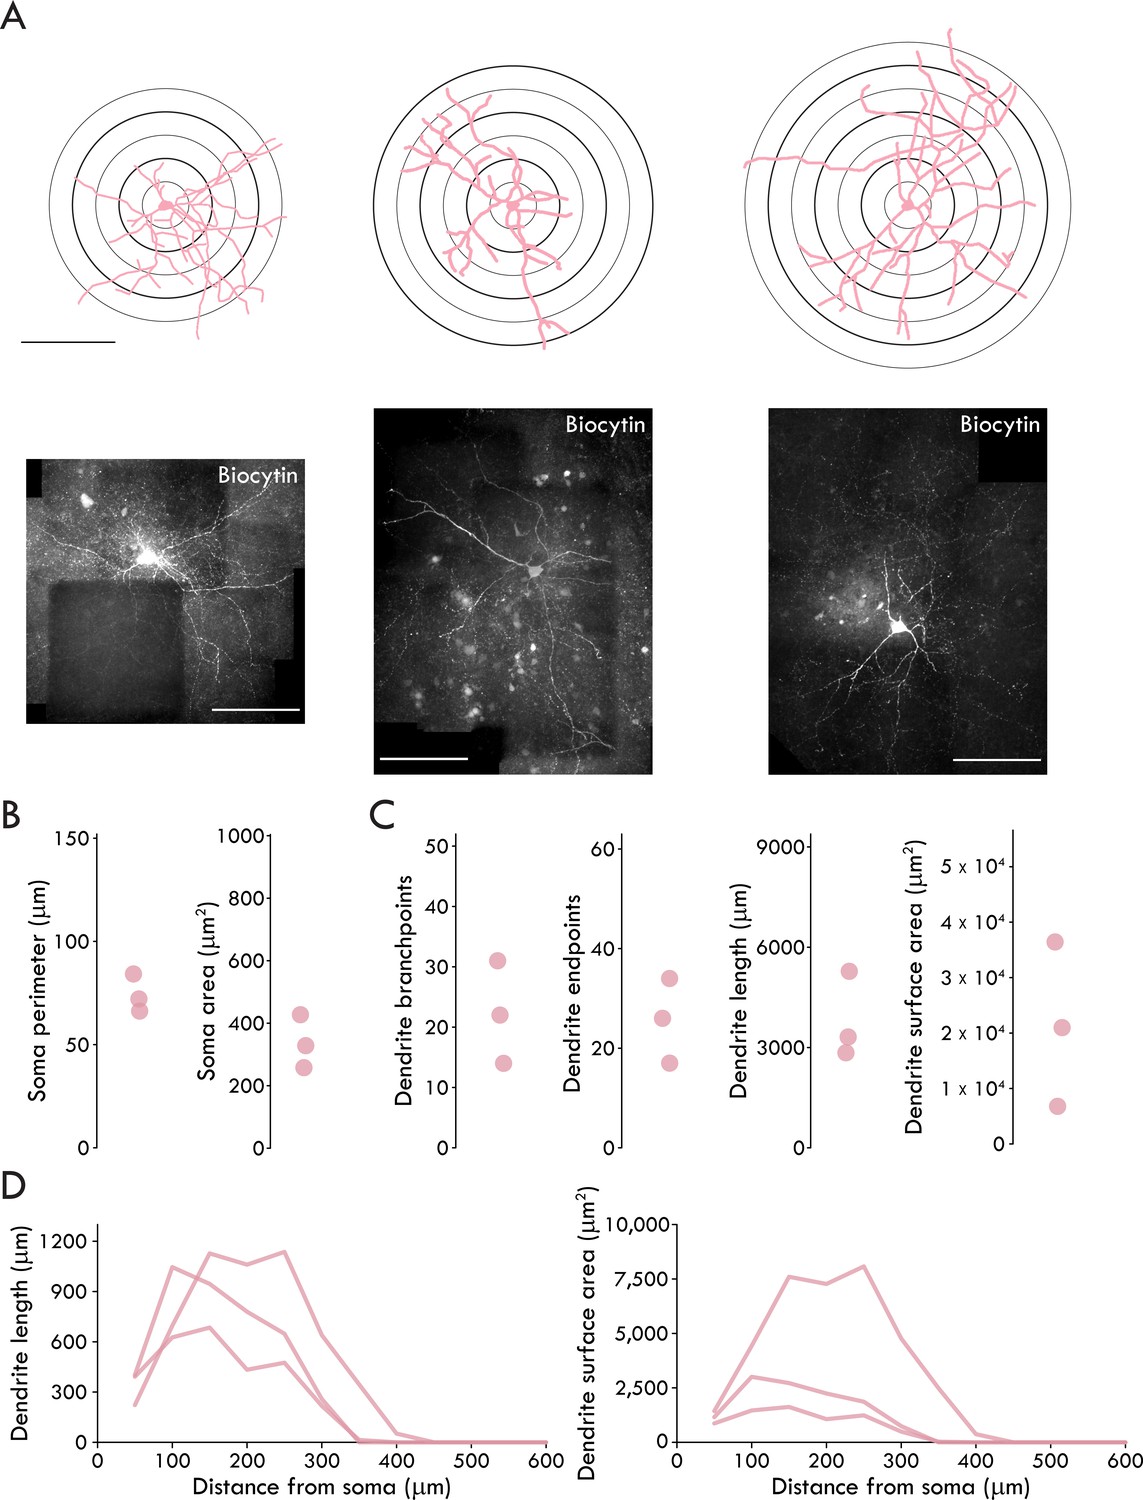
Group II Sst+ IN morphology properties.
(A) Top: reconstructed soma and dendrites of all recovered Group II Sst+ INs (scale bar: 200 μm). Sholl rings shown beneath reconstruction. Bottom: confocal images of the corresponding biocytin filled neurons (scale bar: 200 μm). (B) Soma morphology data for all recovered Group II Sst+ INs. (C) Dendrite morphology data for all recovered Group II Sst+ INs. (D) Sholl analysis of dendrite length (left) and surface area (right) as a function of distance from the soma in all recovered Group II Sst INs. n = 3, 2.
Figure 4 with 1 supplement
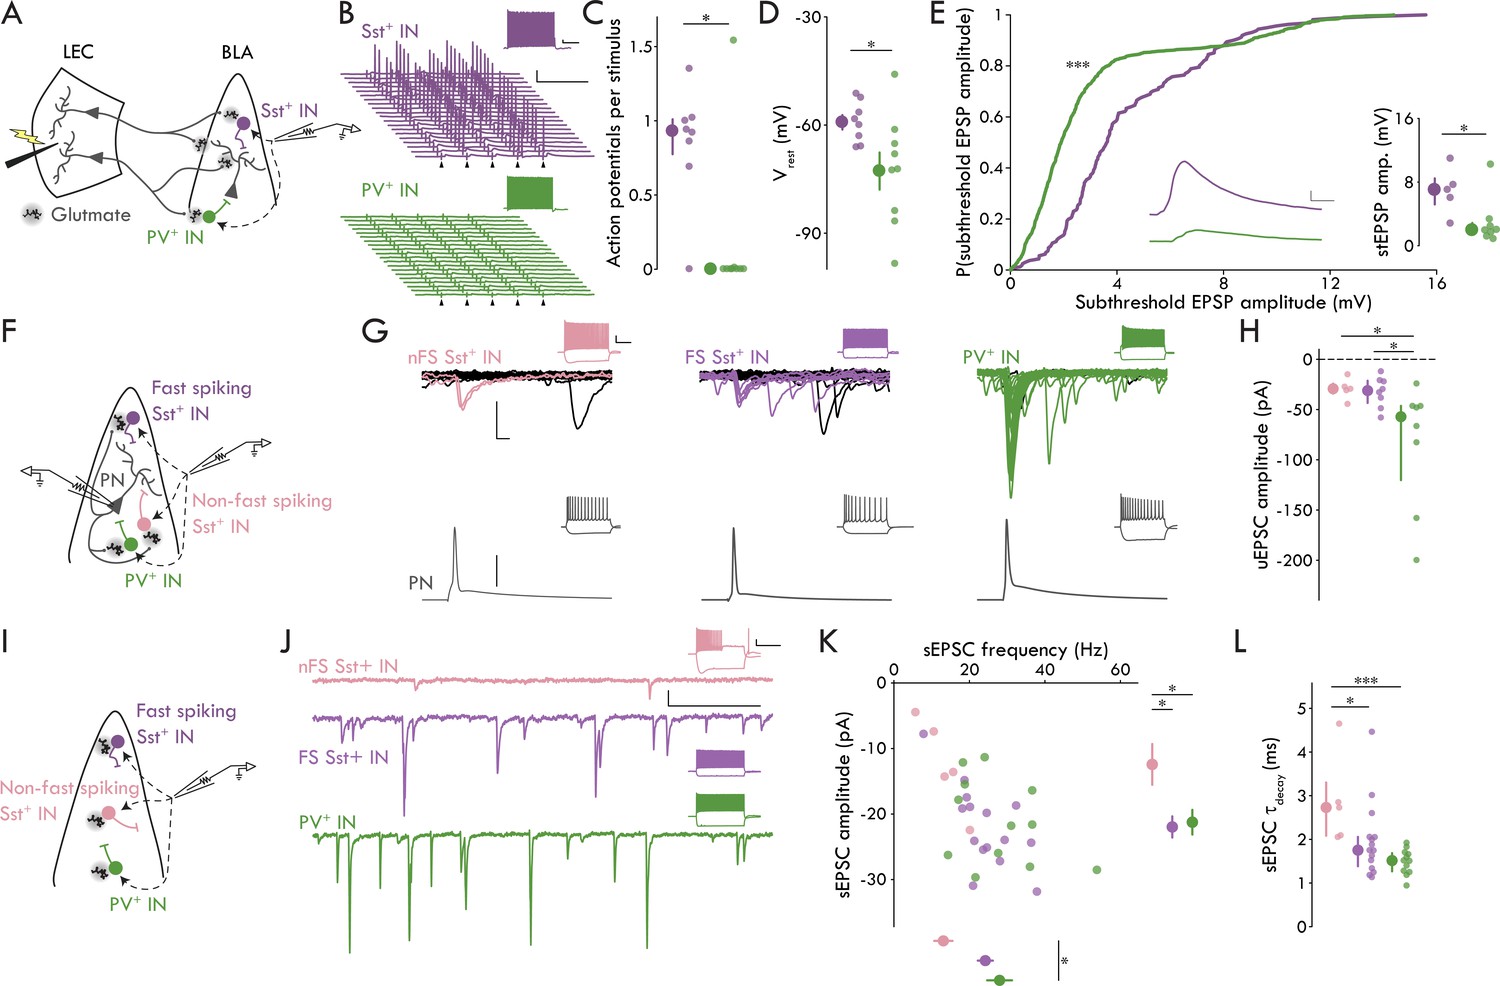
Distinct microcircuit functional roles for IN subtypes.
(A) Experimental schematic for B-E. (B) Representative Sst+ (top, purple) and PV+ (bottom, green) responses to LEC stimulation at 20 Hz (arrowhead: stimulation artifacts; scale bars: 25 mV, 100 ms). Insets show maximal firing frequency for the representative IN in response to a square current pulse (scale bars: 5 mV, 200 ms). (C) Sst+ INs fire more APs per stimulus compared to PV+ INs (Mann-Whitney U test: p=0.016; nSst = 8, 3; nPV = 9, 3). (D) Sst+ INs have a more depolarized Vrest compared to PV+ INs (unpaired t-test: p=0.034; nSst = 8, 3; nPV = 9, 3). (E) Cumulative probability distribution of all subthreshold EPSPs. Inset, middle: mean subthreshold EPSP from representative neurons in (A; Sst+: purple, PV+: green; scale bars: 1 mV, 5 ms; Kolmogorov-Smirnov test: p = 2.19 x 10⁻²¹, nSst = 161 events, nPV = 779 events; Mann-Whitney U test: p = 0.030, nSst = 5, 3, nPV = 8, 3). (F) Experimental schematic for G and H. (G) Representative paired recording experiments between BLA and INs (left to right: nFS Sst+, FS Sst+, PV+). Bottom: AP in BLA PN (scale bar: 40 mV). Top: overlaid current responses of BLA INs to PN AP (50 pA, 2 ms); successful trials shown in color. Insets show maximal firing frequency and response to a −200 pA current injection in the representative neurons (scale bars: 20 mV, 200 ms). (H) uEPSC amplitude is larger in PV+ compared to FS and nFS Sst+ INs (Kruskal-Wallis test test: p=0.025, nnFS-Sst = 5, 5, nFS-Sst = 8, 6, nPV = 8, 8) (I) Experimental schematic for J-L. (J) Representative sEPSC traces from BLA INs (top to bottom: nFS Sst+, FS Sst+, PV+; scale bars: 20 pA, 100 ms). Insets show maximal firing frequency and response to a −200 pA current injection in the representative neurons (scale bars: 20 mV, 300 ms). (K) Scatter plot of sEPSC frequency and amplitude. Right: nFS Sst+ INs have smaller amplitude sEPSCs compared to FS Sst+ and PV+ INs (one-way ANOVA: p=0.022). Bottom: PV+ INs have more frequent sEPSCs compared to nFS Sst+ INs (one-way ANOVA: p=0.022). (L) nFS Sst+ IN sEPSCs have slower decay kinetics compared to FS Sst+ and PV+ IN sEPSCs (Kruskal-Wallis test: p=0.0033). Summary statistics in D and K presented in color as mean ± s.e.m. and in C, E (inset), H, and L in color as median with IQR. *p < 0.05 or False Discovery Rate corrected significance threshold where applicable, ***p < 0.001. See Figure 4—figure supplement 1 for additional characterization of the BLA inhibitory microcircuitry. See Figure 4—source data 1 for a table with full details on all statistical tests used in this figure. See Figure 4—source data 2 for a table of all individual data points displayed in Figure 4 and corresponding figure supplements.
-
Figure 4—source data 1
Table of statistical analyses used in Figure 4.
Normal data presented as mean ± s.e.m. Non-normal data presented as median and [1st quartile/3rd quartile].
- https://cdn.elifesciences.org/articles/50601/elife-50601-fig4-data1-v2.xlsx
-
Figure 4—source data 2
Table of data included in Figure 4 and Supplements.
- https://cdn.elifesciences.org/articles/50601/elife-50601-fig4-data2-v2.xlsx
Figure 4—figure supplement 1
Further characterization of BLA inhibitory microcircuitry.
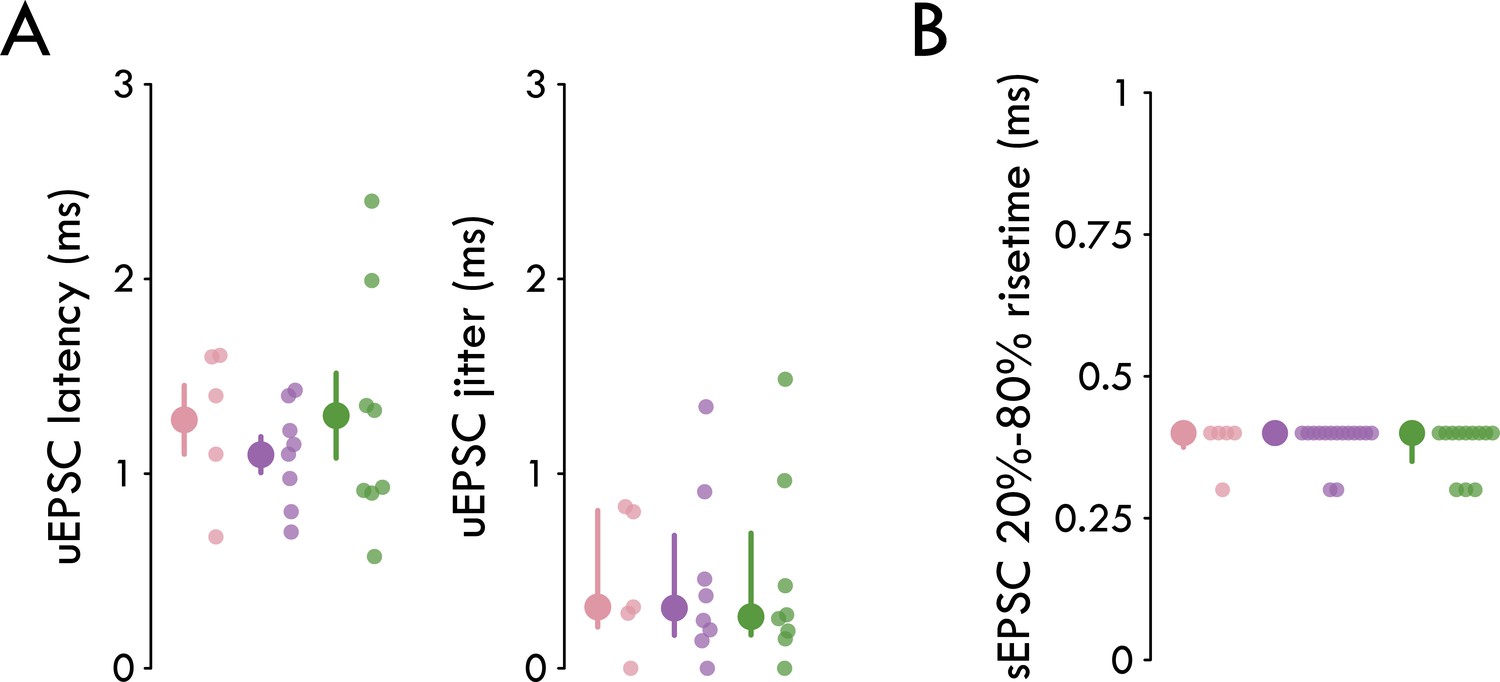
(A) No significant differences in uEPSC latency or jitter across IN subtypes (latency: nFS Sst+ = 1.28 ±0.18 ms, FS Sst+ = 1.10 ± 0.092 ms, PV+ = 1.29 ±0.22 ms, one-way ANOVA: p = 0.65, nnFS-Sst = 5, 5, nFS-Sst = 8, 6, nPV = 8, 8; jitter: nFS Sst+ = 0.31 [0.17/0.69] ms, FS Sst+ = 0.31 [0.17/0.68] ms, PV+ = 0.26 [0.21/0.81] ms, Kruskal-Wallis test: p = 0.97, nnFS-Sst = 5, 5, nFS-Sst = 8, 6, nPV = 8, 8). (B) No significant differences in sEPSC 20–80% risetime (nFS Sst+=0.40 [0.38/0.40] ms, FS Sst+=0.40 [0.40/0.40] ms, PV+=0.40 [0.35/0.40] ms, Kruskal-Wallis test: p=0.75). Summary statistics in A (left) presented in color as mean ± s.e.m. and in A (right) and B as in color as median with IQR.
Figure 5 with 1 supplement
Sst+ INs mediate LEC→BLA FFI.
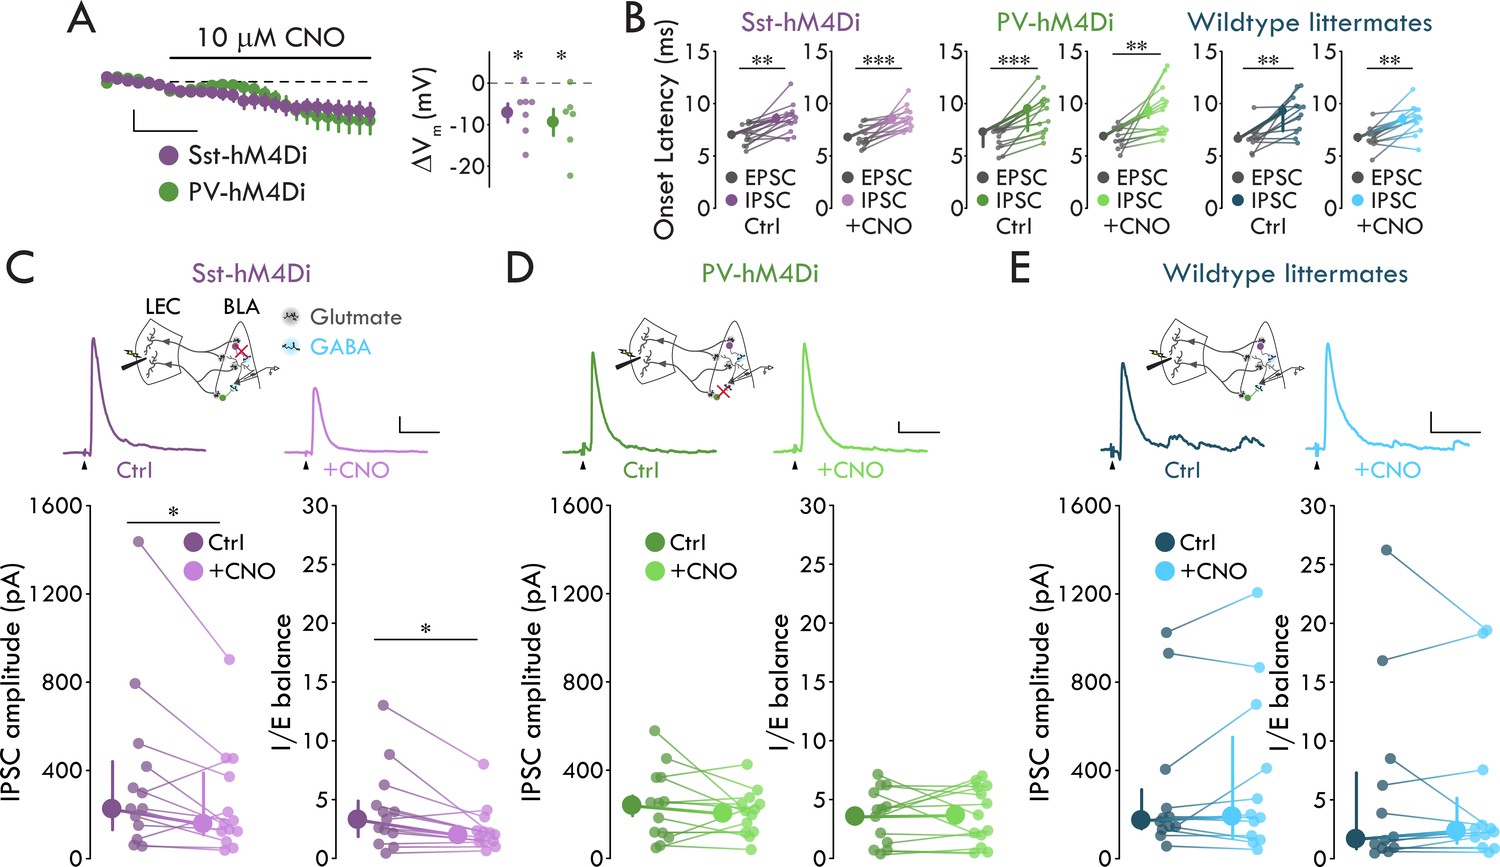
(A) Left: Effect of CNO on Vm. Scale bars: 5 mV, 3 min. Right: CNO hyperpolarizes mCitrine+ cells in both mouse lines (pSst = 0.017, pPV = 0.031, one-sample t-test, nSst = 7, 4, nPV = 6, 3). (B) IPSC is delayed relative to EPSC (paired t-tests: pSst-Ctrl = 0.0018, pSst-CNO = 8.80 x 10⁻⁴, pPV-CNO = 0.0042, pWT-CNO = 0.0012; Wilcoxon signed-rank tests: pPV-Ctrl = 2.44 x 10⁻⁴, pWT-Ctrl = 0.0024; nSst = 13, 6, nPV = 13, 7, nWT = 12, 6). (C) CNO- mediated Sst+ IN inactivation reduces FFI (Sst-hM4Di mouse line; Wilcoxon signed-rank tests: pIPSC = 0.040, pIE = 0.013, n = 13, 6). Top: Experimental schema, IPSC traces with and without CNO. Arrowheads: stimulation artifacts (truncated). Scale bars: 100 pA, 50 ms. (D) PV+ IN inactivation has no effect on FFI (paired t-tests: pIPSC = 0.35, pIE = 0.85, n = 13, 7). Display as for (C), but in PV-hM4Di mouse line. Scale bars: 25 pA, 50 ms. (E) CNO has no effect on FFI in wildtype littermates (Wilcoxon signed-rank tests: pIPSC = 0.73, pIE = 0.68, n = 12, 6). Display as for (C), but in hM4Di-/- littermates of Sst- and PV-hM4Di mice. Scale bars: 50 pA, 50 ms. Summary statistics in A, B (Sst-hM4Di both conditions, PV-hM4Di CNO condition, WT littermates CNO condition), and D in color as mean ± s.e.m. Summary statistics in B (PV-hM4Di and WT littermates control conditions), C, and E in color as median with IQR. *p < 0.05, **p < 0.01, ***p < 0.001. See Figure 5—figure supplement 1 for lack of effect of IN inactivation on EPSCs. See Figure 5—source data 1 for a table with full details on all statistical tests used in this figure. See Figure 5—source data 2 for a table of all individual data points displayed in Figure 5 and corresponding figure supplements.
-
Figure 5—source data 1
Table of statistical analyses used in Figure 5.
Normal data presented as mean ± s.e.m. Non-normal data presented as median and [1st quartile/3rd quartile].
- https://cdn.elifesciences.org/articles/50601/elife-50601-fig5-data1-v2.xlsx
-
Figure 5—source data 2
Table of data included in Figure 5 and Supplements.
- https://cdn.elifesciences.org/articles/50601/elife-50601-fig5-data2-v2.xlsx
Figure 5—figure supplement 1
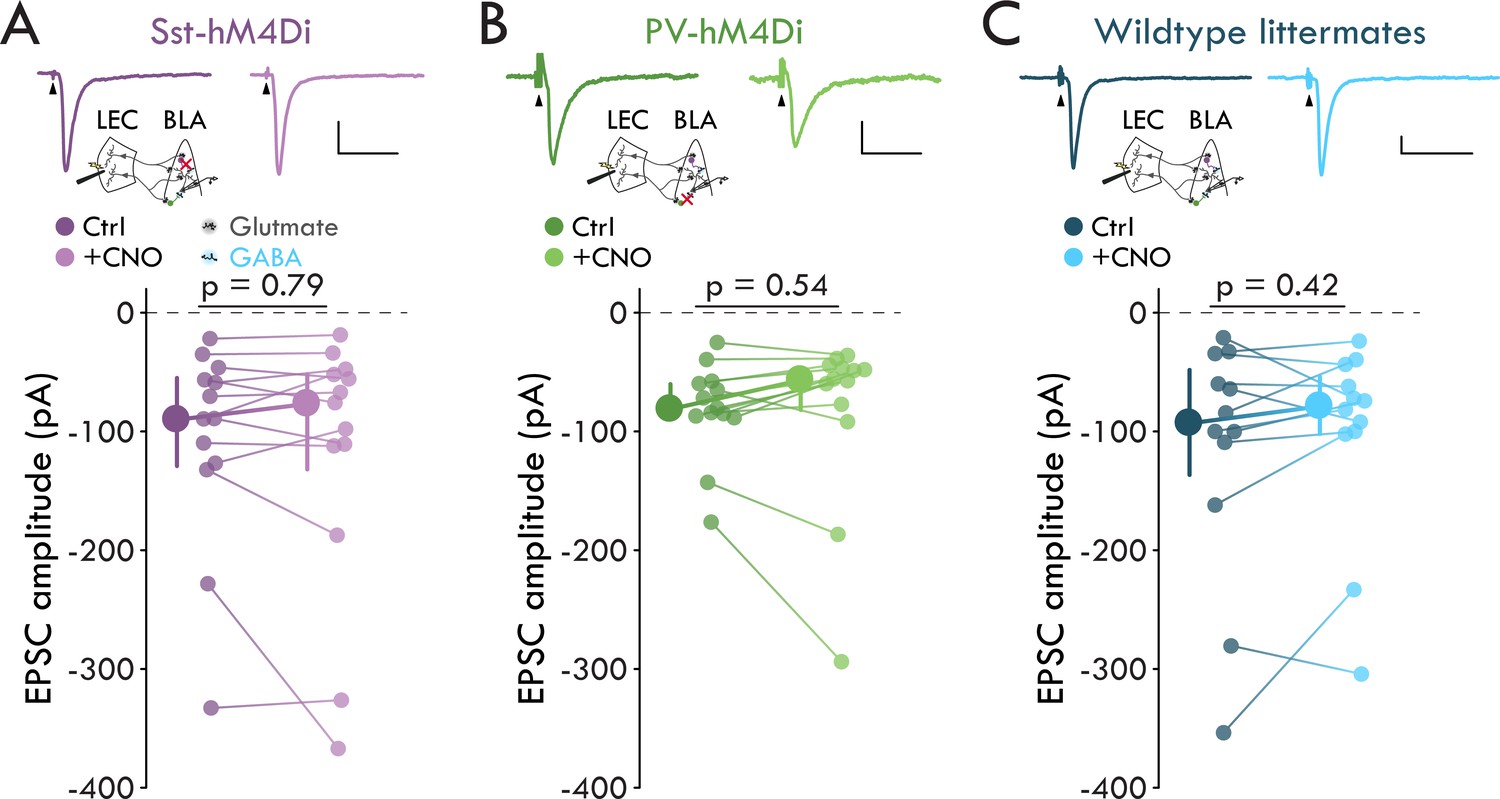
Lack of an effect of 10 μM CNO on evoked EPSC amplitude.
(A) Top: Mean EPSCs from a representative PN from a Sst-hM4Di mouse before and after bath application of CNO. Schematic of experiment below traces. Arrowheads denote stimulus artifacts (truncated). Scalebars: 100 pA, 50 ms. Bottom: Sst+ IN inactivation has no effect on EPSC amplitude (EPSCCtrl = −90.14 [-54.95 /- 129.09] pA, EPSCCNO = −76.80 [−51.94 /- 131.96] pA, p=0.79, Wilcoxon signed-rank test, n = 13 cells, six mice). (B) As for (A), but in the PV-hM4Di mouse line. Scalebars: 20 pA, 50 ms. PV+ IN inactivation has no effect on EPSC amplitude (EPSCCtrl = −81.14 [-60.18 /- 88.34] pA, EPSCCNO = −56.77 [−47.07 /- 81.82] pA, p=0.54 Wilcoxon signed-rank test, n = 13 cells, seven mice). (C) As for (A), but in wildtype littermates of the Sst- and PV-hM4Di mice. Scalebars: 50 pA, 50 ms. 10 μM CNO has no effect on EPSC amplitude in hM4Di-/- mice (EPSCCtrl = −93.18 [-48.19 /- 136.58] pA, EPSCCNO = −78.85 [−53.80 /- 102.11] pA, p=0.42, Wilcoxon signed-rank test, n = 12 cells, six mice). Summary statistics presented in color as median with IQR.
Figure 6

Schematic of findings.
(A) FS Sst+ INs (purple) fire APs in response to LEC input to drive FFI onto BLA PNs. nFS Sst+ INs (pink) do not respond to LEC input. PV+ INs (green) respond with a subthreshold excitatory response to LEC input. (B) Inactivation of FS Sst+ IN removes the feedforward inhibitory control over BLA PNs. PV+ INs receive large uEPSC input from local BLA PNs compared to both Sst+ IN subtypes.
Author response image 1
Tables
Key resources table
| Reagent type | Reagent or resource | Source | Identifier | Additional information |
|---|---|---|---|---|
| Antibody | Rat monoclonal anti-Sst | Millipore | Cat#MAB354; RRID: AB_2255365 | (1:100) |
| Antibody | Guinea pig polyclonal anti-PV | Synaptic Systems | Cat#195004; RRID:AB_2156476 | (1:500) |
| Antibody | Donkey polyclonal anti-rat Alexa Fluor 488 | Jackson ImmunoResearch | Cat#712-545-150 | (1:500) |
| Antibody | Donkey polyclonal anti-guinea pig Alexa Fluor 488 | Jackson ImmunoResearch | Cat#706-545-148 | (1:500) |
| Antibody | Streptavidin Conjugated Alexa Fluor 488 | ThermoFisher Scientific | Cat#S11223 | (1:500) |
| Commercial assay, kit | iFX-enhancer | Invitrogen | Cat#I36933 | |
| Chemical compound, drug | Picric acid | Electron Microscopy Sciences | Cat#I9556 | |
| Chemical compound, drug | Glutaraldehyde | Sigma | Cat#G-7651 | |
| Chemical compound, drug | Sucrose | Sigma-Aldrich | Cat#S7903 | |
| Chemical compound, drug | Glucose | Sigma-Aldrich | Cat#G8270 | |
| Chemical compound, drug | Sodium chloride | Sigma-Aldrich | Cat#S9888 | |
| Chemical compound, drug | Potassium chloride | Sigma-Aldrich | Cat#P9333 | |
| Chemical compound, drug | Sodium phosphate monobasic dihydrate | Sigma-Aldrich | Cat#71505 | |
| Chemical compound, drug | Sodium bicarbonate | Sigma-Aldrich | Cat#S6297 | |
| Chemical compound, drug | Calcium chloride | Sigma-Aldrich | Cat#21115 | |
| Chemical compound, drug | Magnesium chloride | Sigma-Aldrich | Cat#68475 | |
| Chemical compound, drug | Cesium methanesulfonate | Acros Organics | CAS: 2550-61-0 | |
| Chemical compound, drug | HEPES | Sigma-Aldrich | Cat#H3375 | |
| Chemical compound, drug | EGTA | Sigma-Aldrich | Cat#E3889 | |
| Chemical compound, drug | Sodium phosphocreatine | Sigma-Aldrich | Cat#P7936 | |
| Chemical compound, drug | QX-314 (Lidocaine N-ethyl bromide) | Sigma-Aldrich | Cat#L5783 | |
| Chemical compound, drug | Magnesium-ATP | Sigma-Aldrich | Cat#A9187 | |
| Chemical compound, drug | Sodium-GTP | Sigma-Aldrich | Cat#G8877 | |
| Chemical compound, drug | Potassium gluconate | Sigma-Aldrich | Cat#G4500 | |
| Chemical compound, drug | DNQX | Tocris | Cat#0189; CAS: 2379-57-9 | |
| Chemical compound, drug | D-APV | Tocris | Cat#0106; CAS: 79055-68-8 | |
| Chemical compound, drug | Gabazine (SR 95531 hydrobromide) | Tocris | Cat#1262; CAS: 104104-50-9 | |
| Chemical compound, drug | Clozapine-N-oxide | Enzo Life Sciences | Cat#BML-NS105 | |
| Chemical compound, drug | Phosphate Buffered Saline (PBS) Tablets, 100 mL | VWR | Cat#E404-200TABS | |
| Chemical compound, drug | Triton X-100 | VWR | Cat#0694–1L | |
| Chemical compound, drug | Normal Donkey Serum | Jackson Immuno-research Labs Inc | Cat#017-000 -121 | |
| Chemical compound, drug | Bovine Serum Albumin | Sigma-Aldrich | Cat#A9647-100G | |
| Commercial assay, kit | Prolong Gold antifade reagent | Invitrogen | Cat#P36934 | |
| Other | Nail Polish | Electron Microscope Sciences | Cat#72180 | |
| Chemical compound, drug | Biocytin | ThermoFisher | Cat#28022 | 0.2–0.5% |
| Other | Raw and analyzed data | This paper | Available on github and by request | https://github.com/emguthman/Manuscript-Codes (copy archived at https://github.com/elifesciences-publications/Manuscript-Codes) |
| Strain, strain background (Mus musculus) | Mouse: C57BL/6J | Jackson Lab | RRID: IMSR_JAX:000664 | All sexes used |
| Strain, strain background (Mus musculus) | Mouse: Ssttm2.1(cre)Zjh/J | Jackson Lab | RRID: IMSR_JAX:013044 | All sexes used |
| Strain, strain background (Mus musculus) | Mouse: B6;129P2-Pvalbtm1(cre)Arbr/J | Jackson Lab | RRID: IMSR_JAX:008069 | All sexes used |
| Strain, strain background (Mus musculus) | Mouse: B6;129S6-Gt(ROSA)26Sortm9(CAG-tdTomato)Hze/J | Jackson Lab | RRID: IMSR_JAX:007905 | All sexes used |
| Strain, strain background (Mus musculus) | Mouse: B6N.129-Gt(ROSA)26Sortm1(CAG-CHRM4*,-mCitrine)Ute/J | Jackson Lab | RRID: IMSR_JAX:026219 | All sexes used |
| Software, algorithm | pClamp 10.6 | Molecular Devices | RRID: SCR_011323 | |
| Software, algorithm | MATLAB_R2018a | Mathworks | RRID: SCR_001622 | |
| Software, algorithm | R | http://www.r-project.org/ | RRID: SCR_001905 | |
| Software, algorithm | Illustrator | Adobe | RRID: SCR_010279 | |
| Software, algorithm | Photoshop | Adobe | RRID: SCR_014199 | |
| Software, algorithm | SlideBook 6.0 | Intelligent Imaging Innovations (3i) | RRID: SCR_014300 | |
| Software, algorithm | Fiji | Fiji | RRID: SCR_002285 | |
| Software, algorithm | Grid/Collection Stitching | Fiji | RRID: SCR_016568 | |
| Software, algorithm | Neurolucida | MBF Biosciences | RRID: SCR_001775 |
Additional files
Download links
A two-part list of links to download the article, or parts of the article, in various formats.
Downloads (link to download the article as PDF)
Open citations (links to open the citations from this article in various online reference manager services)
Cite this article (links to download the citations from this article in formats compatible with various reference manager tools)
Cell-type-specific control of basolateral amygdala neuronal circuits via entorhinal cortex-driven feedforward inhibition
eLife 9:e50601.
https://doi.org/10.7554/eLife.50601


