Cerebellar nuclei excitatory neurons regulate developmental scaling of presynaptic Purkinje cell number and organ growth
- Sloan Kettering Institute, United States
- Weill Cornell Graduate School of Medical Sciences, United States
- The Rockefeller University, United States
Figures
Figure 1 with 3 supplements
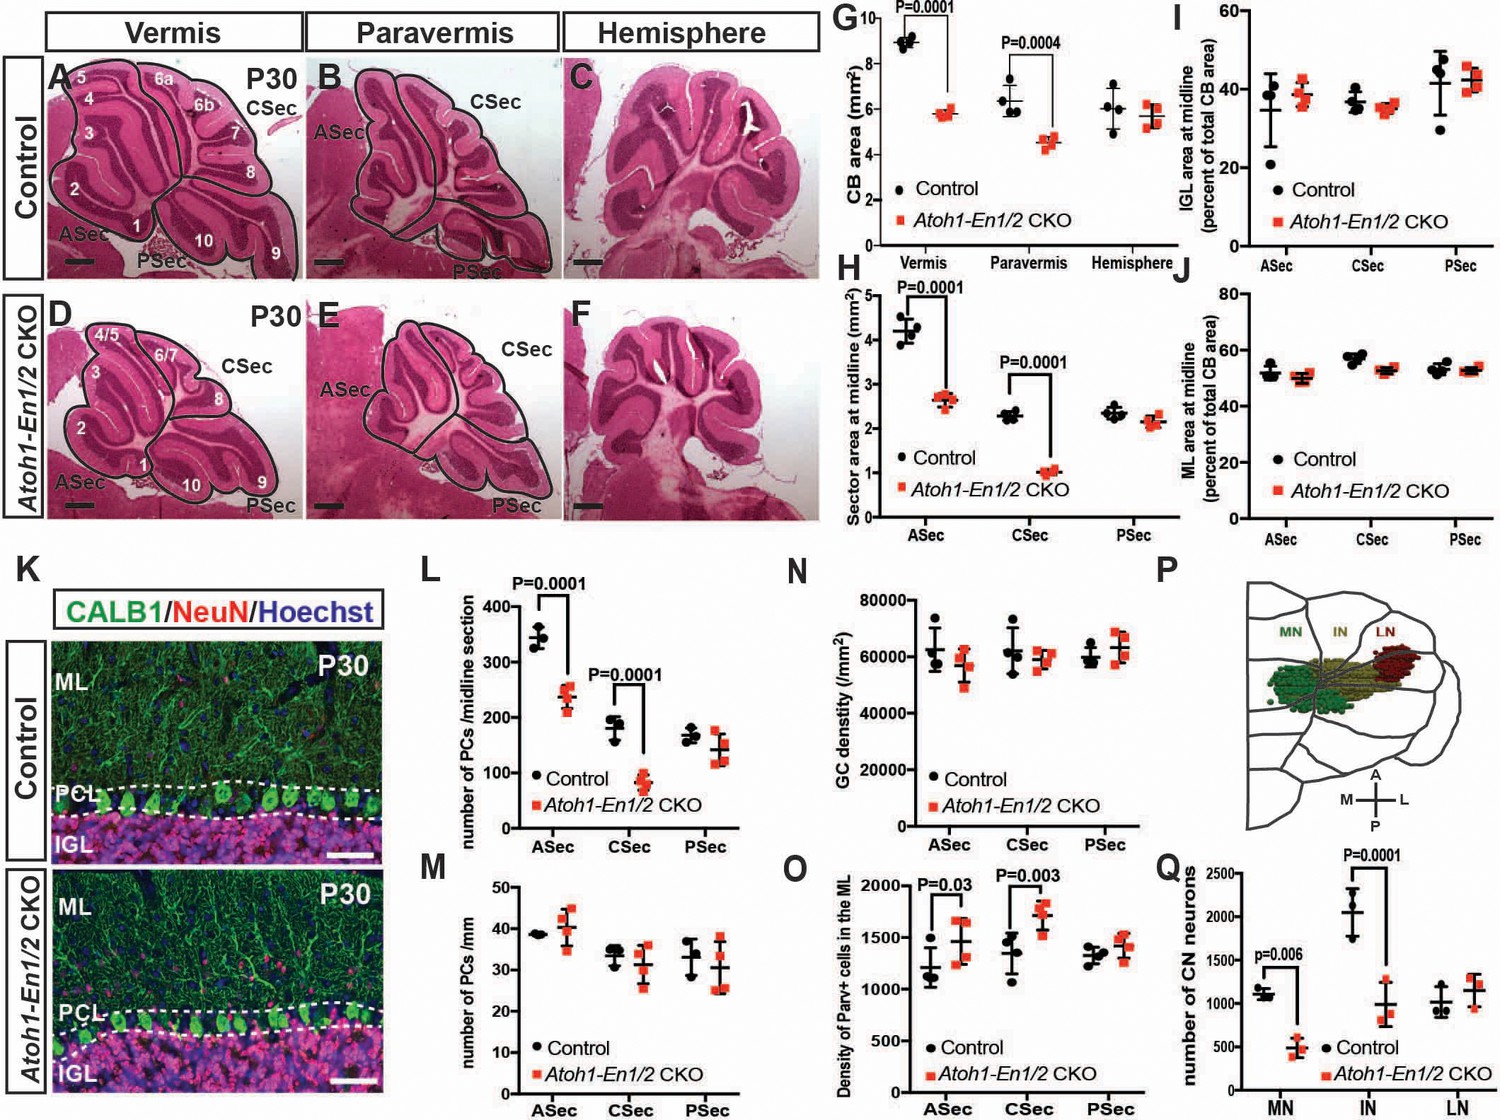
Loss of En1/2 in the rhombic lip-lineage results in reduced growth of the anterior and central vermis and paravermis with scaling of neuron numbers.
(A-F) H and E staining of sagittal sections from the midline (vermis), paravermis and hemispheres of P30 mutant and control cerebella showing reduction of the anterior and central sectors (ASec and CSec) and not the posterior sector (PSec) specifically in the vermis and paravermis. (G) Quantification of the total cerebellum area in the vermis, paravermis and hemisphere (n = 4 animals/condition, Two-way ANOVA, F(1,6)=43.14, p<0.0006). (H) Quantification of sector areas in the vermis of P30 control and Atoh1-En1/2 CKO animals (n = 4 animals/condition, Two-way ANOVA, F(1,9)=398.277, p<0.0001). (I–J) IGL (I) and molecular layer (J) sector area quantifications in the vermis as the percent of total average area showing no change in Atoh1-En1/2 CKOs compared to controls (n = 4 animals/condition). K) Immunofluorescence analysis of P30 cerebellar sections for the PC marker Calbindin1 (CALB1) and the pan-neuronal marker NeuN in a Atoh-En1/2 CKO (G) compared to a control. (L–M) Quantification of average PC numbers in each sector per midline sagittal section (L) showing reductions only in the ASec and CSec, whereas the density of PCs (M) is conserved (n = 3 for controls and n = 4 for Atoh1-En1/2 CKO, J: Two-way ANOVA, F(1,15)=72.52, p<0.0001). (N) Quantification of granule cell density in each vermal sector of mutants and controls (n = 4 for each genotype). O) Quantification of the density of ParV+ cells in the ML per sector of mutants compared to controls (n = 4 for each genotype, Two-way ANOVA, F(1,9)=28.4, p<0.0005). (P) Schematic representation of a half brain with a 3D reconstruction of the eCN in a normal cerebellum. (Q) Quantification of eCN neurons in the medial (MN), intermediate (IN) and lateral nuclei (LN) of the CN in one half of Atoh1-En1/2 CKO cerebella compared to littermate controls (n = 3 per genotype) (Two-way ANOVA, F(1,12)=32.29, p=0.0001). Significant post hoc comparisons are shown in the figure. CKO: conditional knockout, IGL: internal granule layer, ML: molecular layer, PCL: Purkinje cell layer, PC: Purkinje cell, GC: granule cell. Scale bars B: 500 μm, F-I: 100 μm. Lobule numbers are designated in Figure 1A.
-
Figure 1—source data 1
Summary of the statistics.
- https://cdn.elifesciences.org/articles/50617/elife-50617-fig1-data1-v2.pdf
Figure 1—figure supplement 1
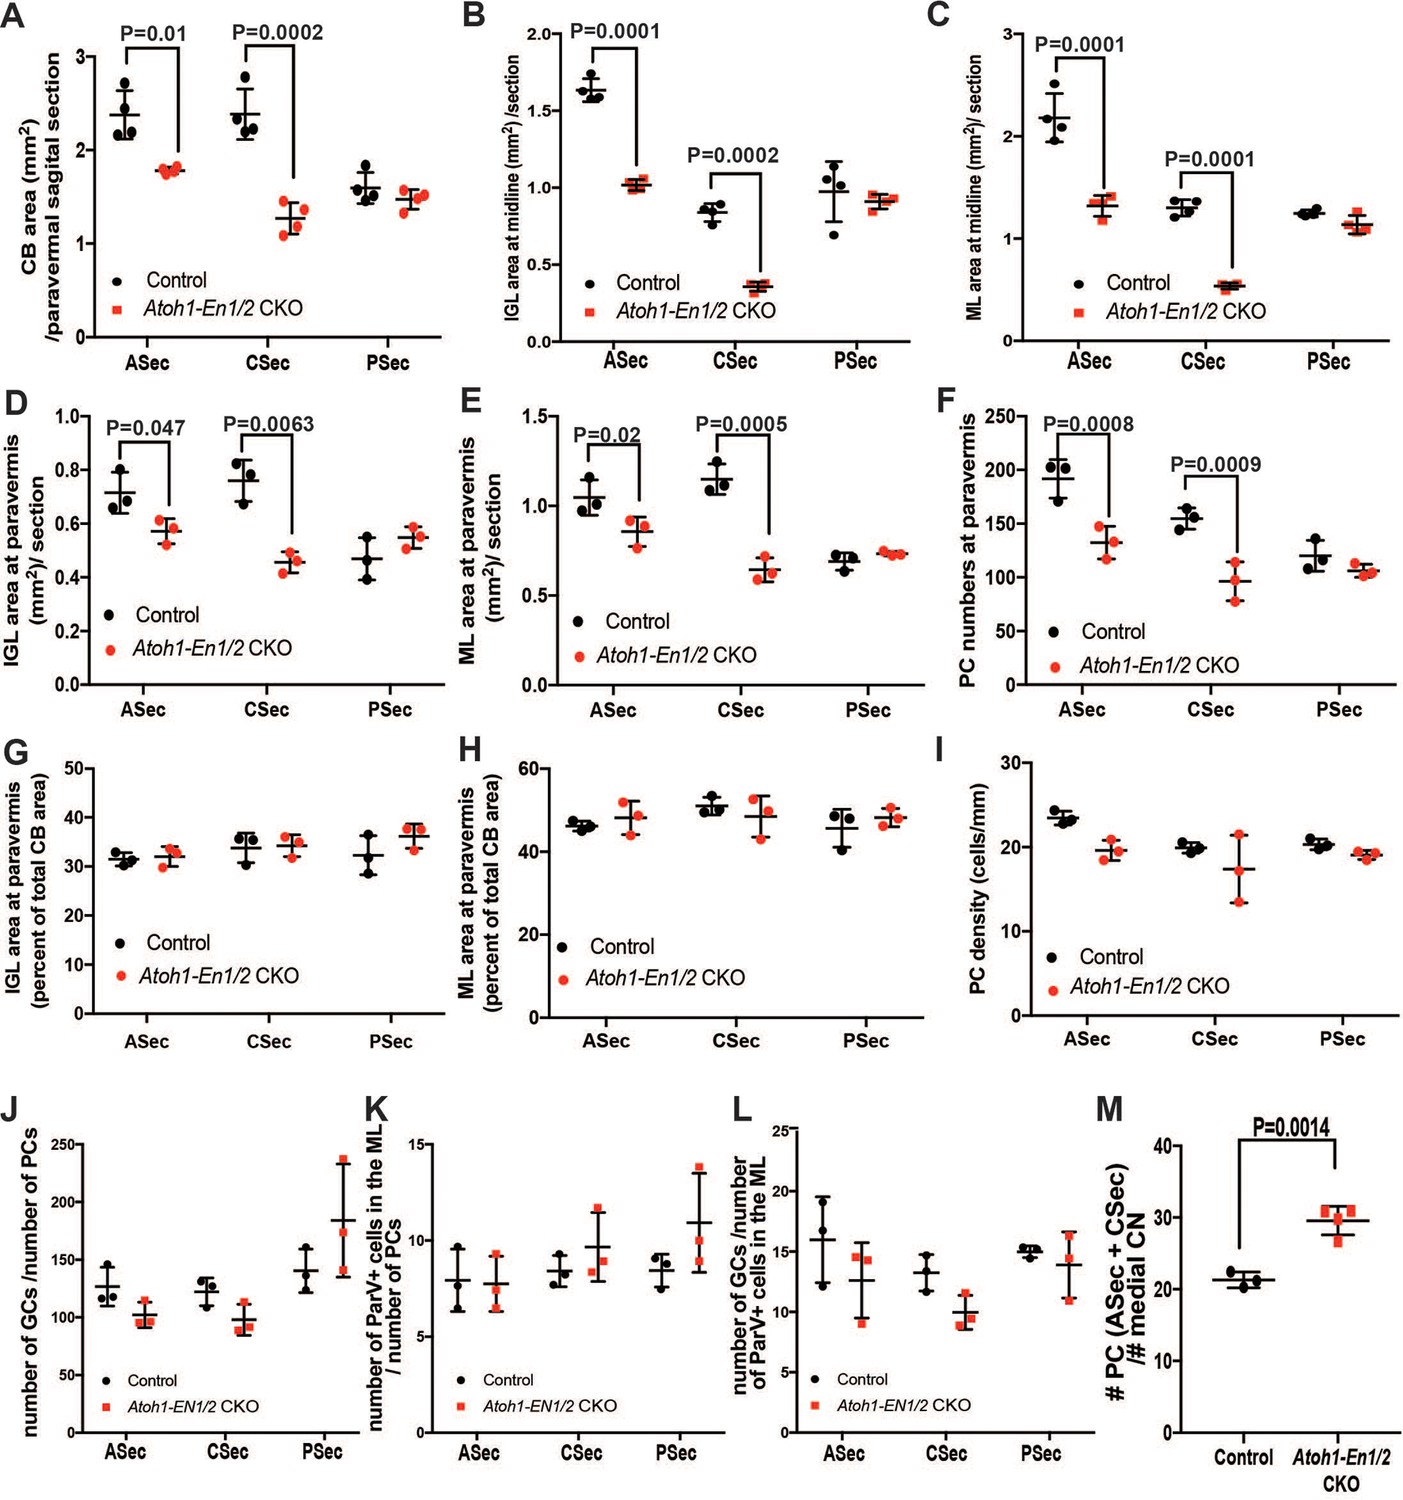
Atoh1-En1/2 CKOs have reduced area and PC numbers in the ASec and PSec in the vermis and paravermis but the densities and ratios of neurons remain similar to normal.
(A) Quantification of sector areas in the paravermis (n = 4/condition, Two-way ANOVA, F(1,9)=44.48, p=0.0001). (B–E) Quantifications of IGL (B,D) and ML (C,E) sector areas in Atoh1-En1/2 CKOs compared to controls in the vermis (B,C, n = 4/condition, Two-way ANOVA, IGL: F(1,9)=98.8, p=0.0001, ML: F(1,9)=278.3, p=0.0001) and paravermis (D,E, n = 3/condition, Two-way ANOVA, IGL: F(1,12)=17.32, p=0.0013, ML: F(1,12)=41.63, p=0.0001). (F) Quantifications of PC numbers in sectors (n = 3/condition, Two-way ANOVA, F(1,12)=42.43, p=0.0001). (G–H) IGL (G) and ML (H) sector areas in the paravermis as a percent of total average area (n = 3 animals/condition). (I) PC density in paravermis sectors. (J–L) Quantifications of the estimated ratios of the numbers of granule cells (GCs) to PCs (J), ParV+ cells in the in the ML to number of PCs (K) and the number of GCs to ParV+ cells (L) in the ML in sectors (n = 3/condition). (M) Estimated ratios of PCs (from ASec and PSec) to eCN in the medial nucleus as a measurement of PC-to-eCN neuron scaling in Atoh-En1/2 CKO animals (n = 4 for PCs and n = 3 for eCN) compared to controls (n = 3 for PCs and n = 3 for eCN, Student’s t-test). Significant post hoc comparisons are shown in the figure. MN: medial nucleus, IN: intermediate nucleus, LN: lateral nucleus.
Figure 1—figure supplement 2
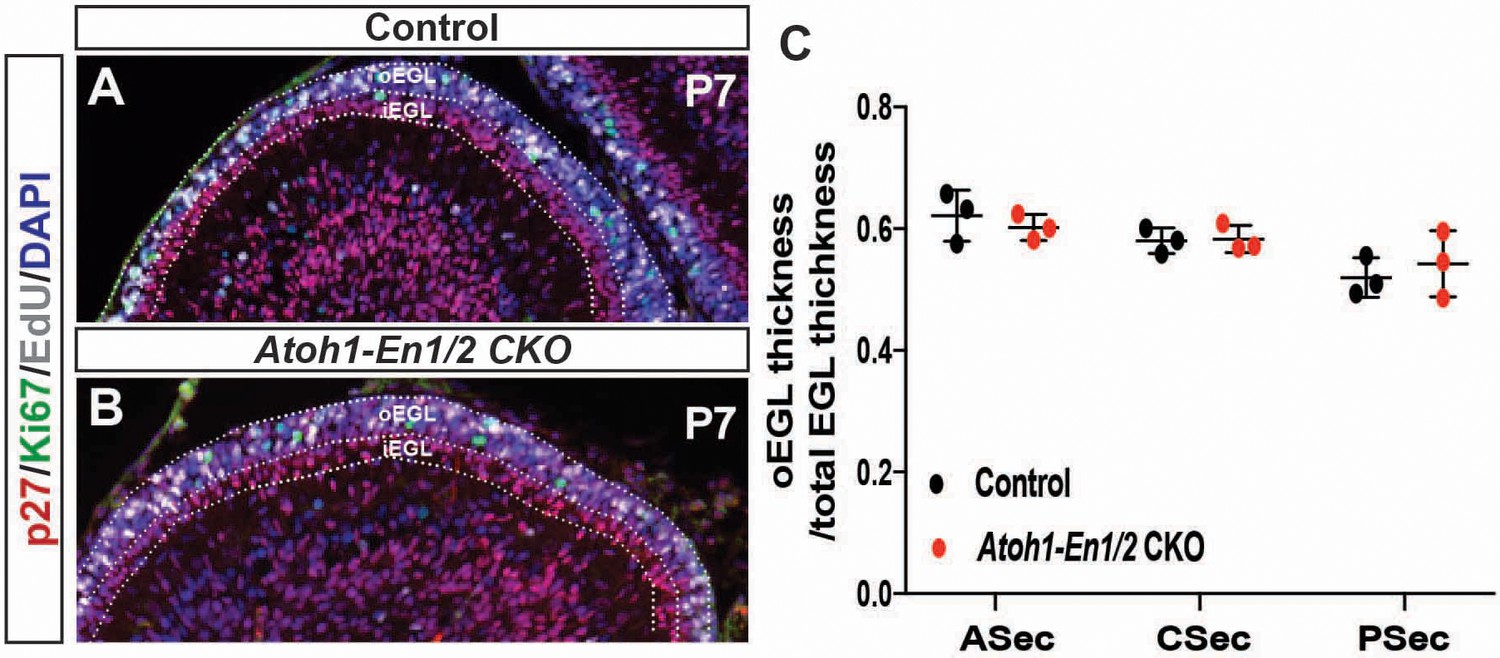
Proportion of EGL that contains proliferating GCPs to total EGL area is preserved in Atoh1-En1/2 CKO animals.
(A–B) P7 sections stained for EdU, Ki67 and p27 from animals injected with EdU 1 hr before sacrifice. Outer EGL (oEGL) contains proliferating GCPs (EdU+ or Ki67+), inner EGL (iEGL) contains differentiated granule cells (P27+). (C) Quantification of oEGL thickness (area/length) to total EGL thickness at P7 (n = 3/ genotype, Two-way ANOVA, F(1,12)=0.014, p=0.9).
Figure 1—figure supplement 3
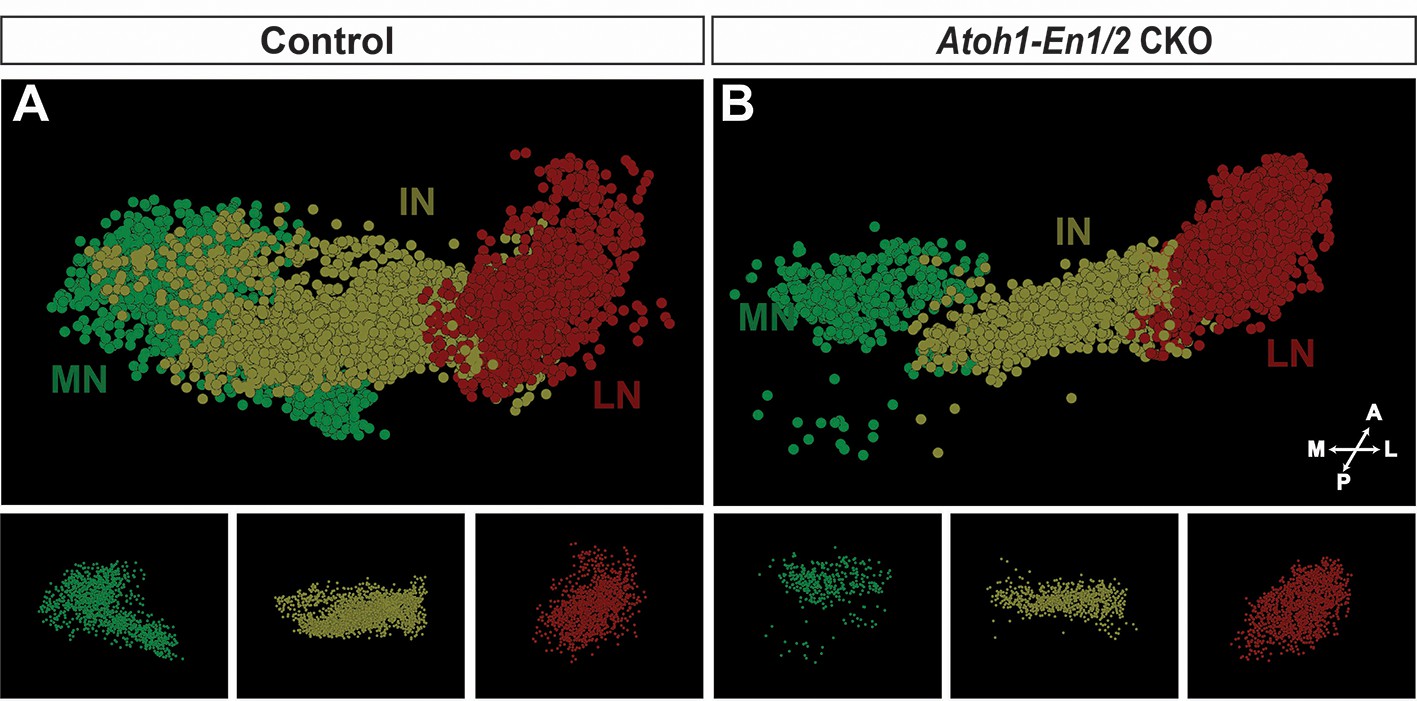
3D reconstructions of stereology of the eCN in Atoh1-En1/2 CKOs and controls.
(A–B) Stereology 3D reconstructions of the eCN in one half of the cerebellum from a control (A) and Atoh1-En1/2 CKO (B) showing the reduction in posterior medial and intermediate nuclei in the mutant.
Figure 2 with 1 supplement
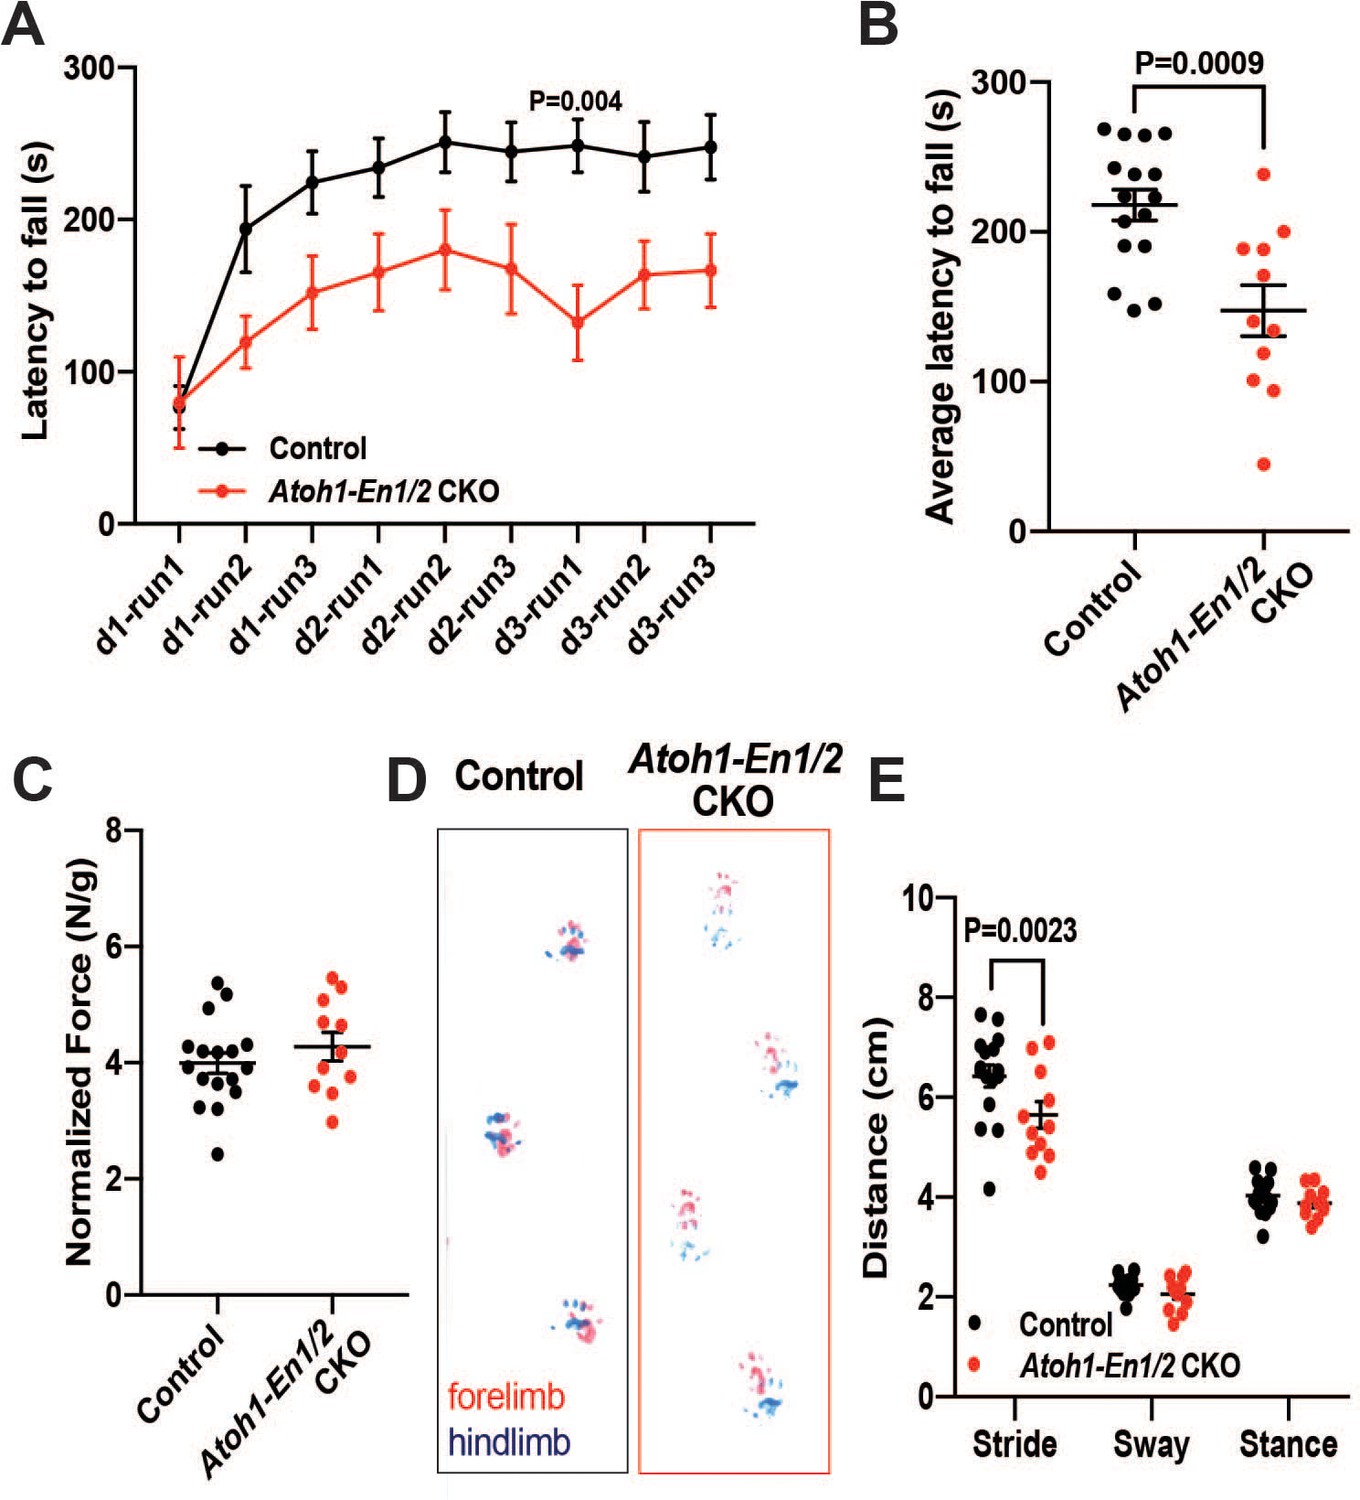
Atoh1-En1/2 CKO animals show motor behavior defects compared to control animals.
(A) Latency to fall from rotarod at each trial (Two-way ANOVA, F(1,25)=14.23, p=0.0009). (B) Average latency to fall for 12 week old control animals (n = 17) compared to Atoh1-En1/2 CKOs (n = 11) (Student’s t-test). (C) Quantification of grip strength analysis of Atoh1-En1/2 CKO animals (n = 11) compared to controls (n = 17) (Student’s t-test). (D–E) Representative images (D) and quantification (E) of footprint analysis performed on control (n = 17) and Atoh1-En1/2 CKO (or En1/2 CKO in B) (n = 11) animals (Two-way ANOVA, F(1,75)=8.227, p=0.005). Significant post hoc comparisons are shown in the figure.
Figure 2—figure supplement 1
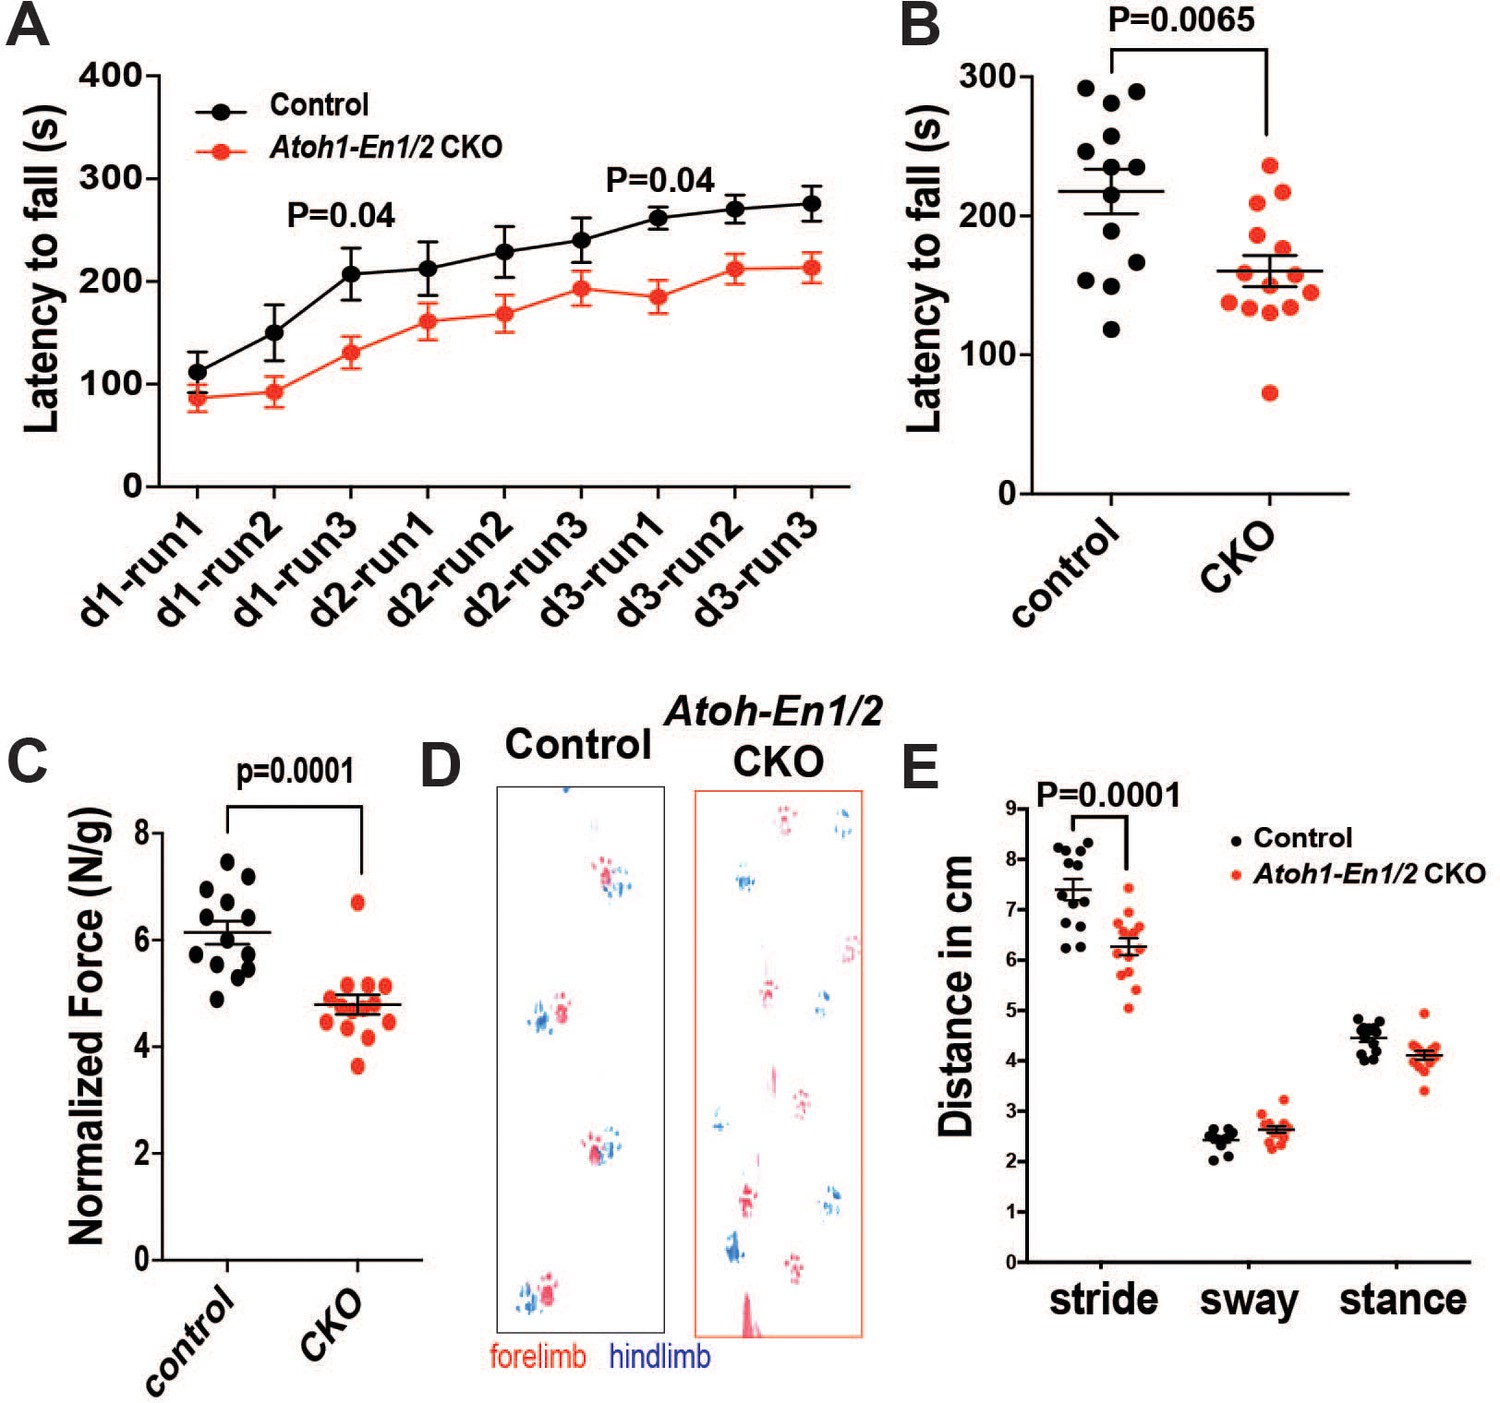
Atoh1-En1/2 CKO animals show motor behavior defects compared to control animals at P30.
(A-B) Latency to fall from a rotarod at each trial (A, Two-way ANOVA, F(1,225)=42.34, p=0.0001) and average (B, Student’s t-test) for control animals (n = 8) compared to Atoh1-En1/2 CKOs (n = 9) at P30. (C) Quantification of grip strength analysis of Atoh1-En1/2 CKO animals (n = 9) compared to controls (n = 8) (Student’s t-test). (D-E) Representative images (D) and quantification (E, Two-way ANOVA, F(1,75)=16.97, p=0.0001) of footprint analysis performed on control (n = 8) and Atoh1-En1/2 CKO (n = 9) animals. Significant post hoc comparisons are shown in the figure.
Figure 3
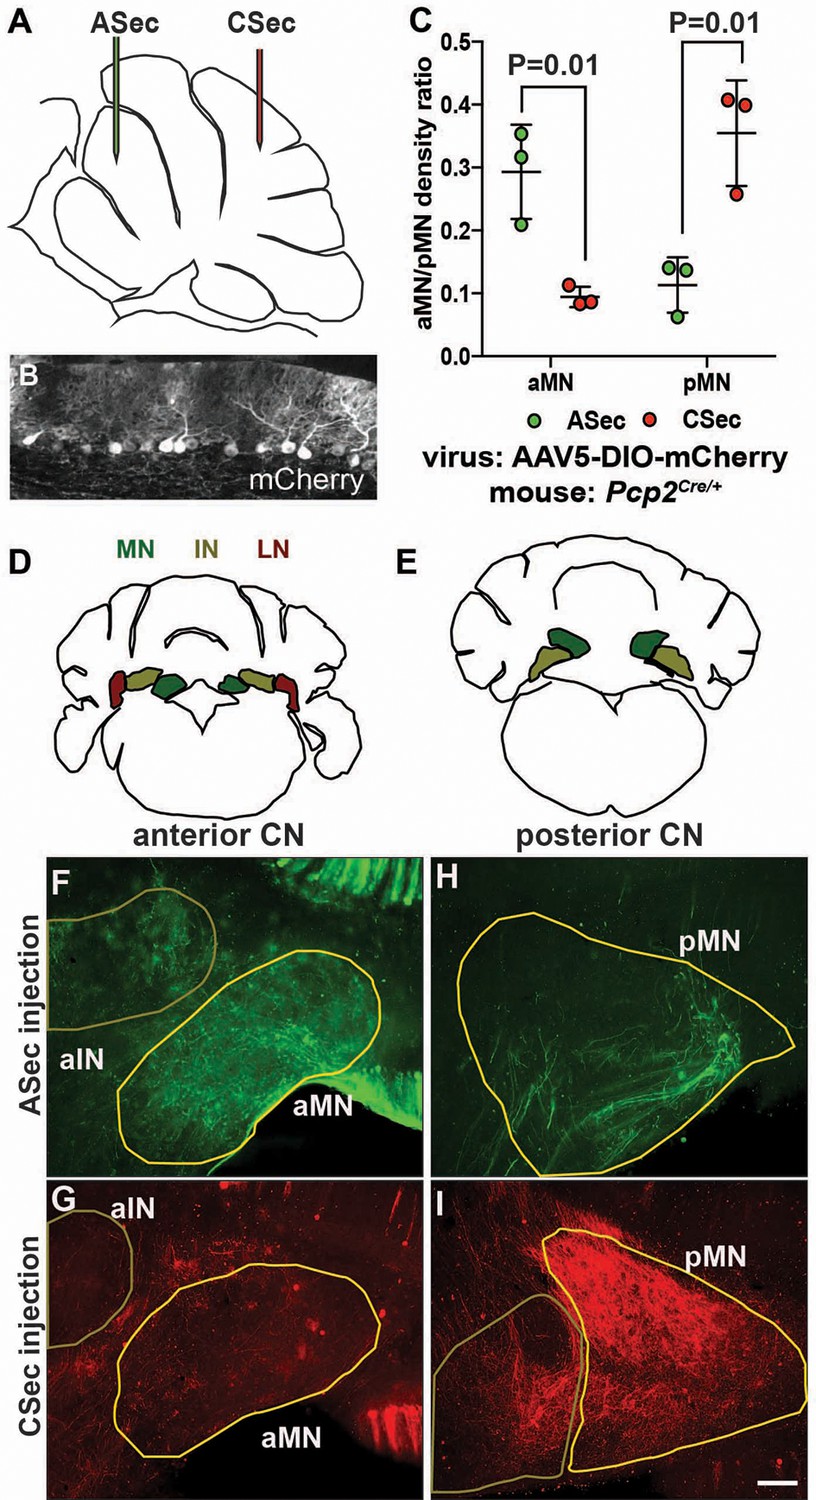
The anterior and central sectors of the vermis preferentially innervate different subregions of the medial CN.
(A) Diagram of scheme used for stereotaxic injection of AAV-DIO-mCherry reporter virus to label PC axons projecting to the CN from the ASec or CSec of Pcp2Cre/+ animals. (B) Sagittal section the PC layer of a Pcp2Cre/+ mouse injected with AAV-DIO-mCherry showing successful targeting of PCs. (C) Quantification of fluorescence signal density in the anterior medial nucleus (aMN) and posterior medial nucleus (pMN) in animals injected with virus in the ASec or CSec showing that the ASec PCs preferentially innervate the aMN (n = 3, Student’s t-test) and CSec labeled PCs preferentially innervate the pMN (n = 3, Student’s t-test). (D–E) Schematic representations of the anterior (D) and posterior (E) CN. (F–I). Immunofluorescent analysis showing the preferential labeling of the aMN or pMN in mice injected to trace axons projecting from PCs in the ASec (F–G) or CSec (H–I), respectively. ASec injections and CSec are pseudo-colored in green and red, respectively. Scale bars: 150 μm.
Figure 4 with 3 supplements
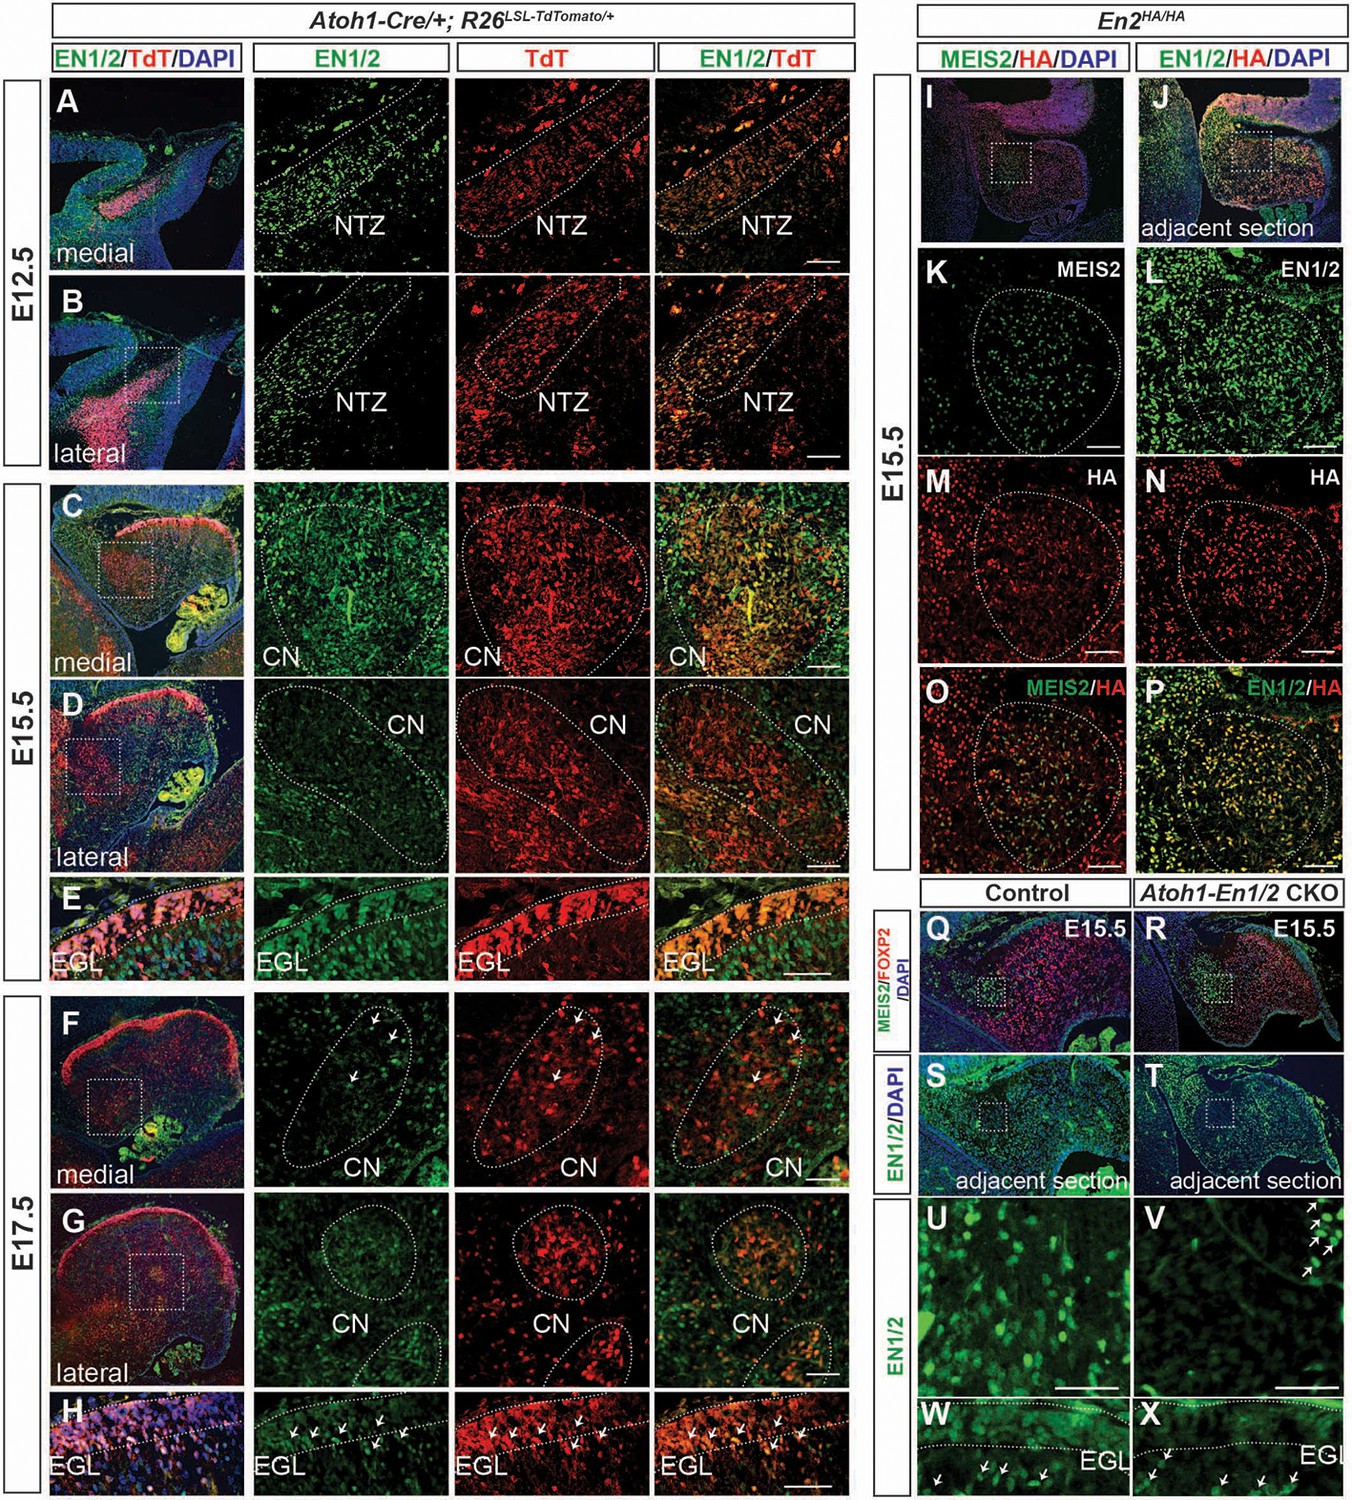
EN1/2 are dynamically expressed in the rhombic lip-lineage during embryonic development.
(A–B) Immunofluorescent analysis using a pan-EN antibody on sections of E12.5 Atoh1-Cre/+; R26LSL-TdTom/+ embryos showing EN1/2 expression in the TdTomato-expressing (TdT+) cells in the nuclear transitory zone (NTZ) through the mediolateral axis of the developing cerebellum. (C–D) Immunofluorescent analysis of E15.5 sections showing EN1/2 expression is mainly in a subset of TdT+ eCN in the medial cerebellum, with scattered expression in lateral TdT+ cells. (E) Immunofluorescent analysis of EN1/2 expression in the EGL at E15.5. (F–G) Immunofluorescent analysis showing that by E17.5 the majority of the TdT+ cells in the CN no longer express EN1/2 except for a subset of eCN (arrows) in the medial/intermediate eCN. (H) Immunofluorescent analysis of the EGL at E17.5 showing higher nuclear expression of EN1/2 in the inner EGL (arrows). (I–P) EN1/2 expression was confirmed using an En2HA/HA mouse line expressing 3xHA-tagged EN2 protein at E15.5 and co-staining sections with pan-EN and anti-HA antibodies. The eCN area was identified using immunofluorescent analysis of adjacent sections for MEIS2. (Q–X) Immunofluorescent analysis of sections from E15.5 Atoh1-En1/2 CKOs and their littermate controls showing loss of EN1/2 expression in the eCN (insets: U,V) and EGL (W,X). EN1/2 expression in the PCs is not affected as expected (arrows). MEIS2 and FOXP2 staining of adjacent sections were used to identify eCN and PCs. EGL outlines were determined based on DAPI staining. Scale bars: 100 μm.
Figure 4—figure supplement 1
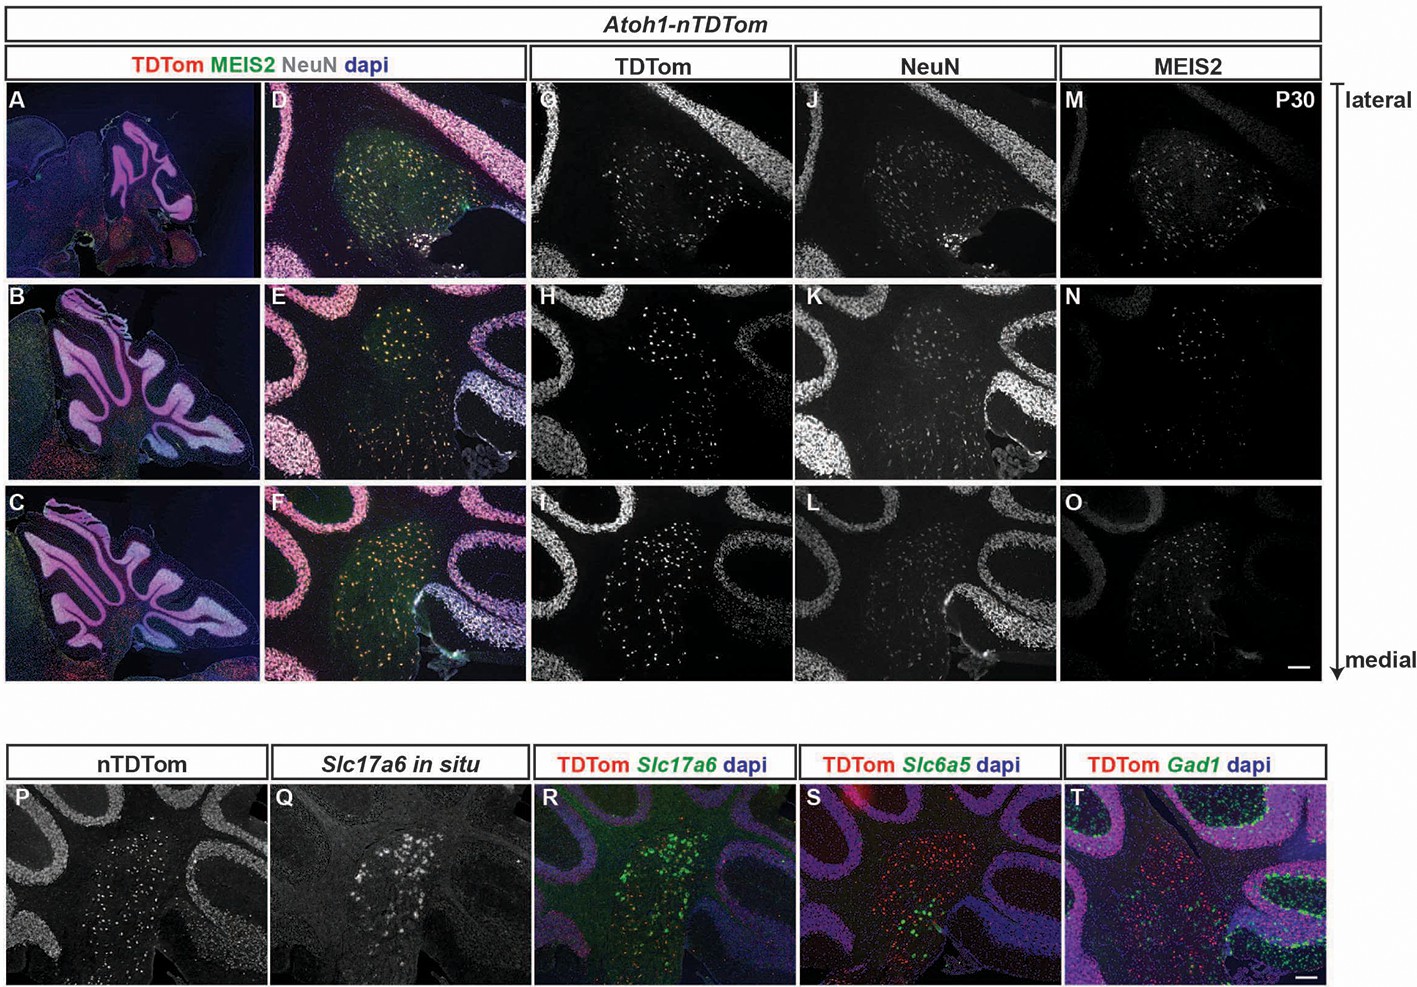
Atoh1-Cre marked cells expressing TDTom also express eCN markers (MEIS2 and Slc17a6) and a pan neuronal marker (NeuN) but not a glycinergic (Slc6a5) or GABAergic (Gad1) neuron marker.
(A-C) Low power images of sagittal sections from the lateral (top) to medial (bottom) cerebellum of an Atoh1-nTDTom illustrating the level the images in (D-O). (D-O) Co-labeling of TDTom, MEIS2 and NeuN showing that all TDTom+ cells (G-I) express NeuN (J-L) and the majority express MEIS2 (M-O) with the least at intermediate levels. (P-R) In situ hybridization of Slc17a6 (Vglut2) showing that almost all TDTom+ cells express Slc17a6, although the levels of expression vary between cells. (S-T) In situ hybridization analysis showing that only rare TDTom+ cells (<1 cell per section) express Slc6a5 RNA (glycinergic neuron marker) (S) or Gad1 RNA (inhibitory neurons) (T). In situ hybridization images were pseudocolored in Green. Scale bars: 100 μm.
Figure 4—figure supplement 2
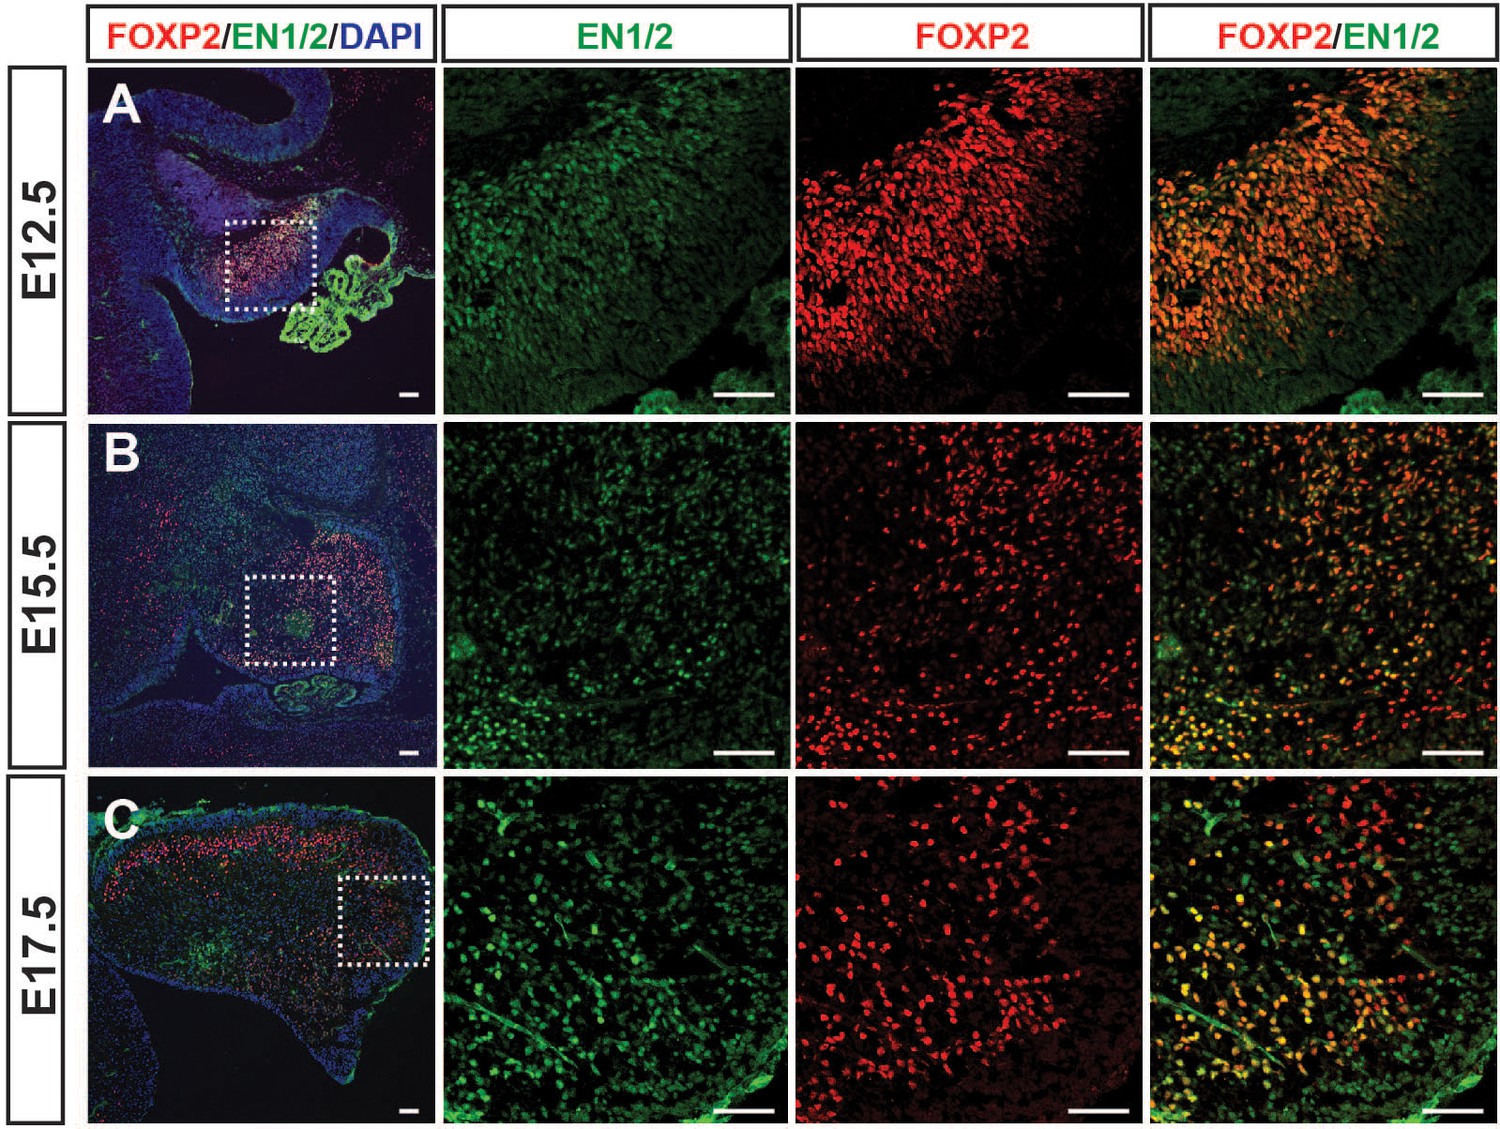
Dynamic embryonic expression of EN1/2 in PCs during development.
(A-C) Immunofluorescent analysis of sagittal sections from wild type embryos showing expression of EN1/2 in FOXP2+ PCs at E12.5 (A), E15.5 (B) and E17.7 (C). Scale bars: 100 μm.
Figure 4—figure supplement 3
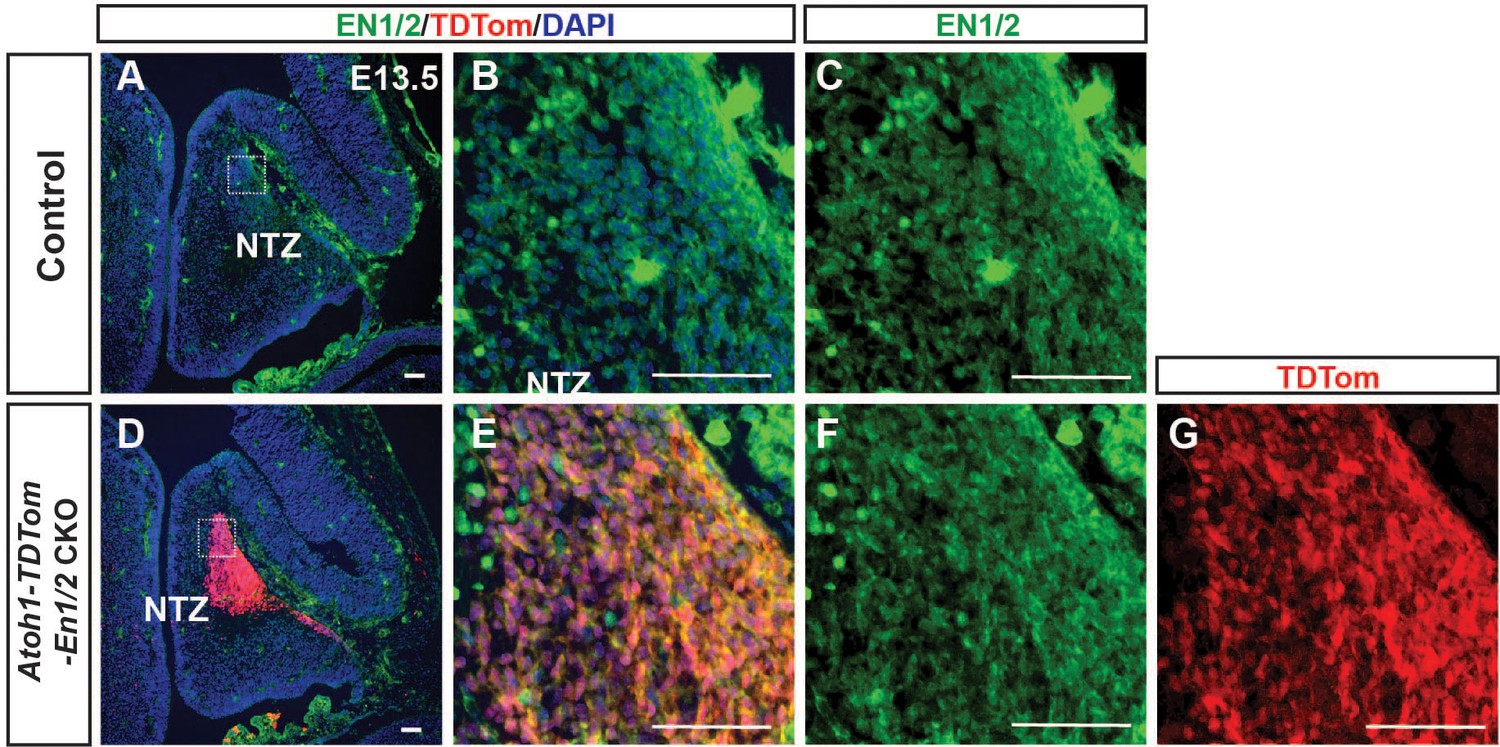
Analysis of EN1/2 expression at E13.5 in Atoh1-TDTom-En1/2 CKOs and their littermate control embryos.
(A-G) EN1/2 expression is not decreased in the nuclear transitory zone (NTZ) (TDTom+ cells in mutants) in Atoh1-TDTom-EN1/2 CKOs (D-G) compared to their littermate controls at E13.5 (A-C, n = 3 embryos/condition). Scale bars: 100 μm.
Figure 5 with 3 supplements
En1/2 are required in the eCN but not GCPs for growth of the cerebellar cortex.
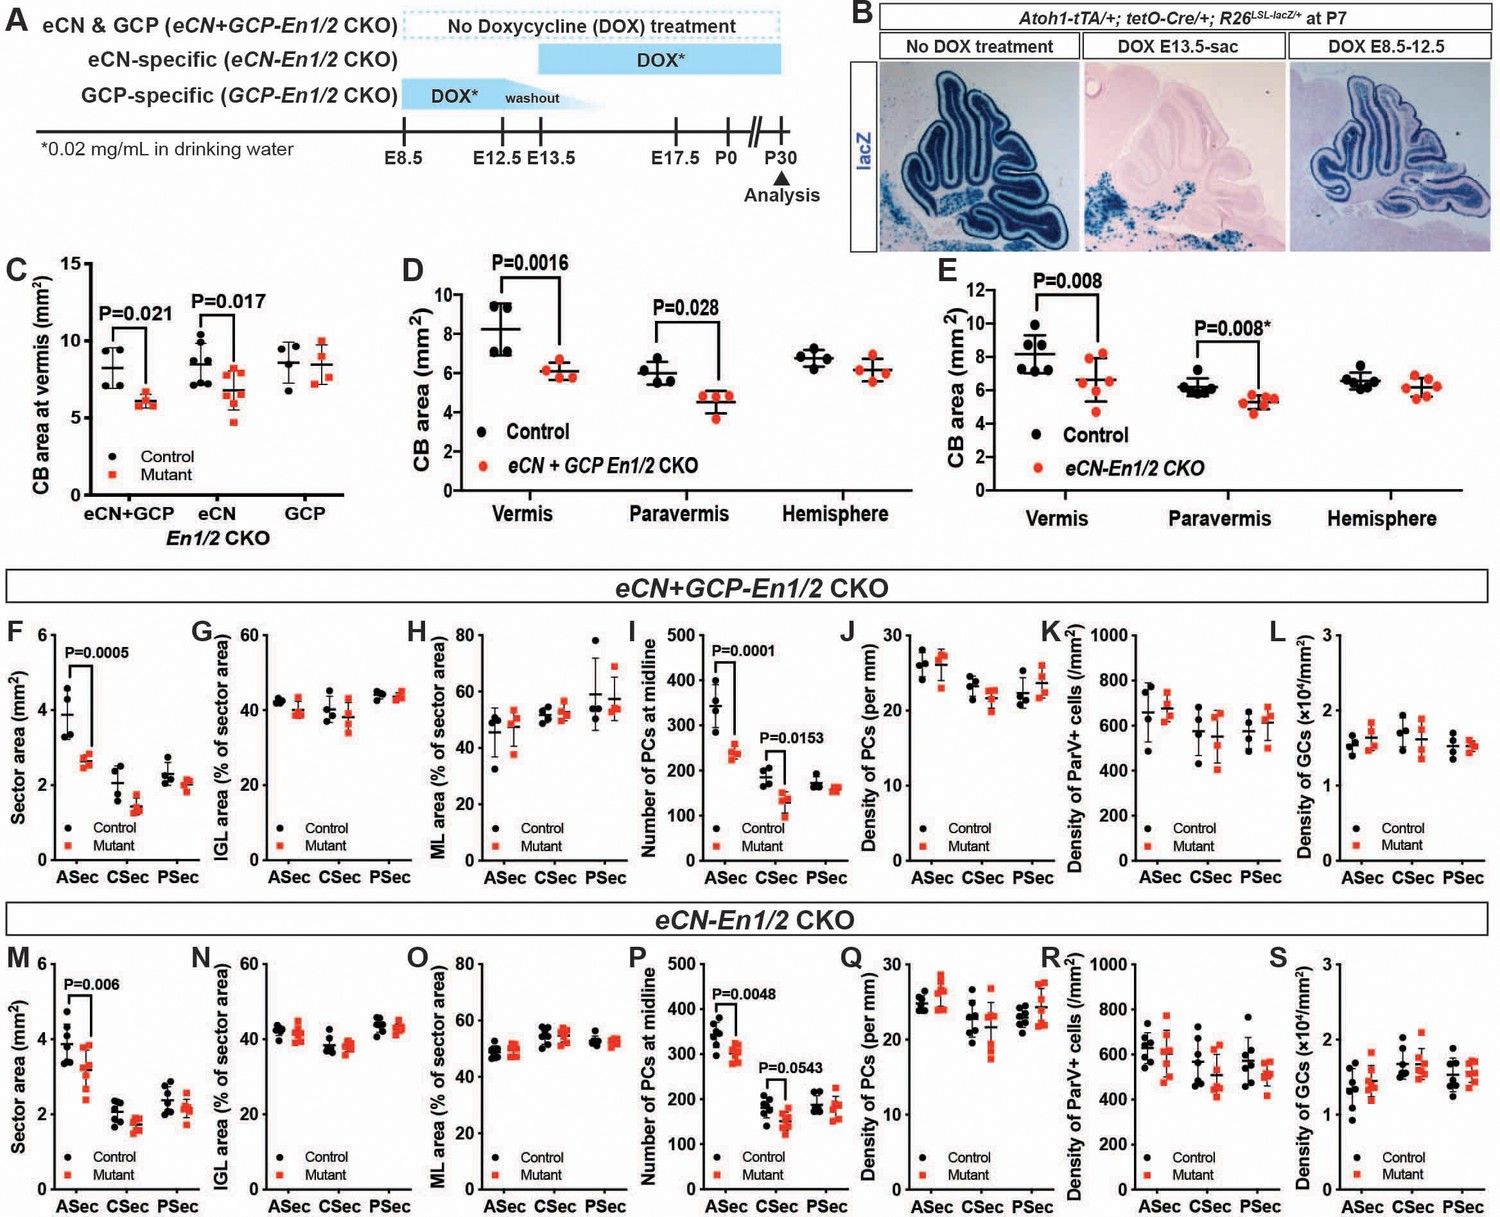
(A) Schematic explaining genetics used to delete En1/2 in the eCN and/or GCPs. Atoh1-tTA; tetO-Cre; En1lox/lox; En2lox/lox animals were treated with Dox from either E13.5 until sacrifice to specifically knockout En1/2 in eCN (eCN-En1/2 CKO) or between E8.5 and E12.5 to knockout En1/2 in GCPs (GCP-En1/2 CKO). No Dox was given to knockout En1/2 in both cell types in the cerebellum (eCN+GCP-En1/2 CKO). (B) Staining for lacZ activity on sections of Atoh1-tTA; tetO-Cre; R26LSL-LacZ/+ animals at P7 showing the specificity of the Dox regimens. (C) Quantification of cerebellum area in the vermis showing reduction only in eCN+GCP- and eCN-En1/2 CKOs compared to their littermate controls at P30 (n = 4 animals/condition, Two-way ANOVA, F(1,24)=8.042, p=0.009). (D,E) Quantification of cerebellum area based on location showing the area is only reduced in the vermis and paravermis, but not in the hemispheres at P30 in eCN+GCP-En1/2 CKOs (D, n = 4 animals/condition Two-way ANOVA, F(1,6)=12.88, p=0.011) and eCN-En1/2 CKOs (E, n = 6 animals/condition, Two-way ANOVA, F(1,10)=8.34, p=0.016, *Student’s t-test in the paravermis). (F–S) Quantifications by sector in the vermis for: overall area (F,M), for IGL (G,N) or ML (H, O) area relative to total sector area, for PC numbers (I,P) and for density of PCs (J,Q), or ML interneurons (K,R) or GCs (L, S) in eCN+GCP-En1/2 CKOs and eCN-En1/2 CKOs. A reduction in the ASec area is seen in both mutants (eCN+GCP-En1/2 CKO: Two-way ANOVA, F(1,18)=22.07, p=0.0002, eCN-En1/2 CKOs: Two-way ANOVA, F(1,36)=12.4, p=0.0012) and PC numbers in the ASec (eCN+GCP-En1/2 CKO: Two-way ANOVA, F(1,18)=32.51, p<0.0001, eCN-En1/2 CKOs: Two-way ANOVA, F(1,36)=13.5, p=0.0008), however, cell densities are preserved. Significant post hoc comparisons are shown in the figure.
Figure 5—figure supplement 1
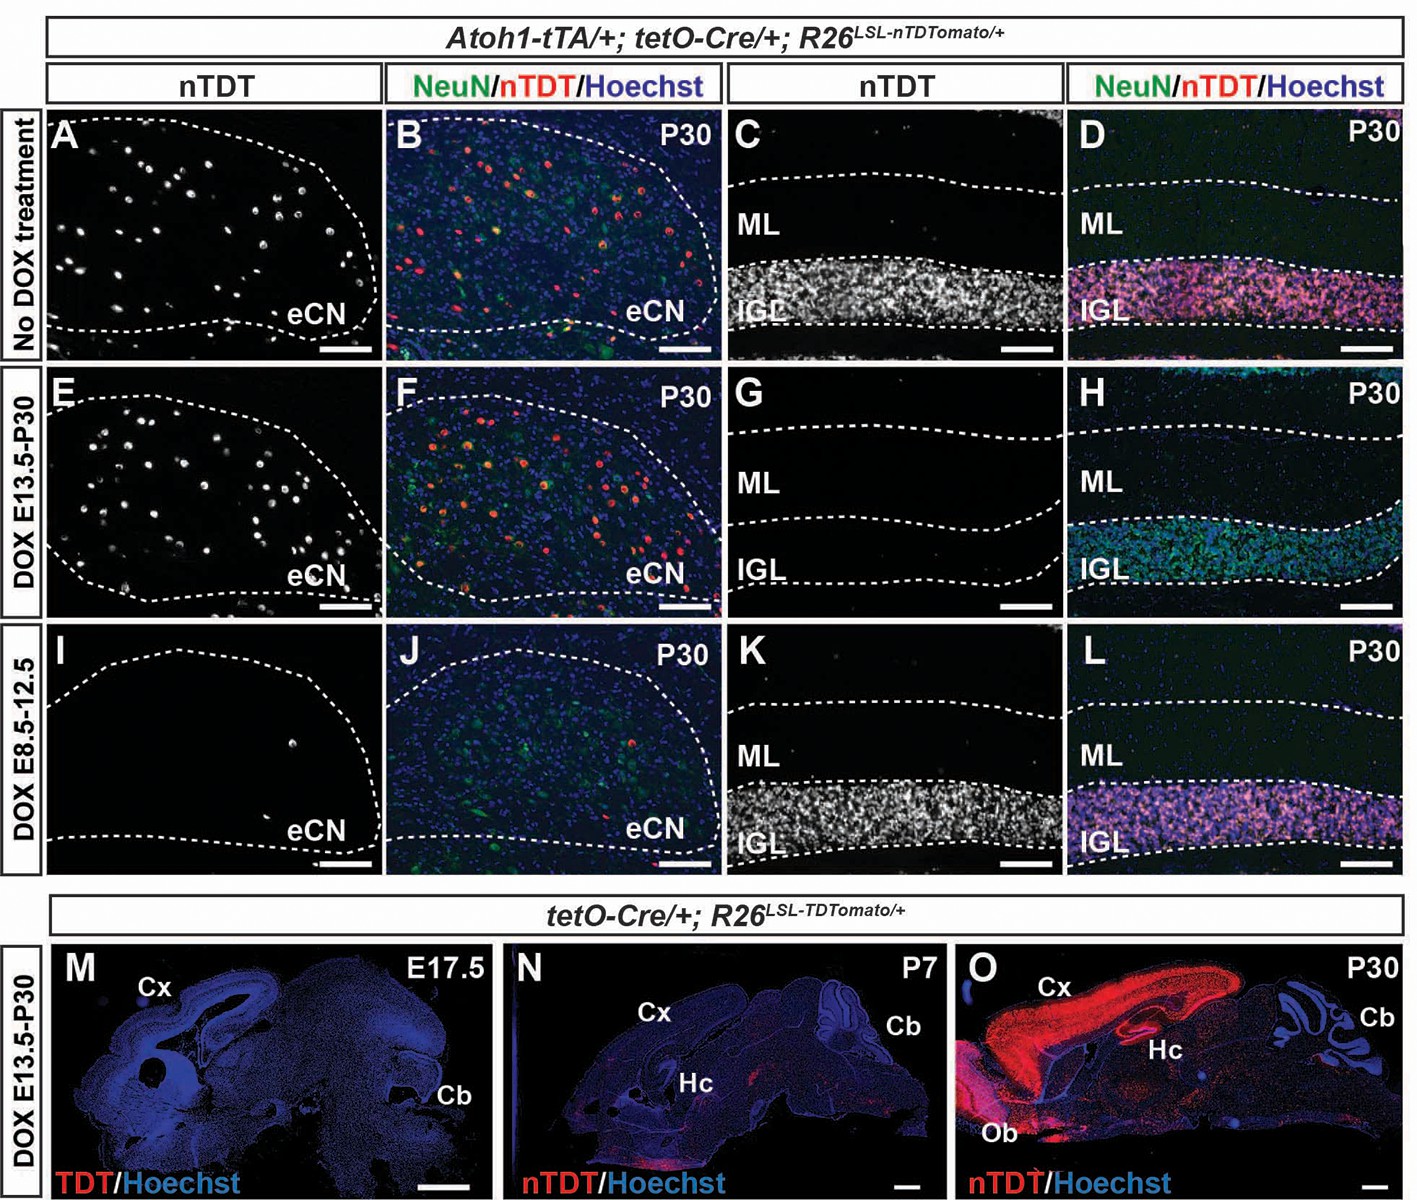
Cell-type specific fate mapping in Atoh1-tTA; tetO-Cre; R26LSL-nTDTom/+ mice.
(A-L) Immunohistochemical staining for nTDT and NeuN on cerebellar sections through the CN (A,B,E,F,I,J) and IGL (C,D,G,H,K,L) from ~P30 eCN+GCP-nTDTom (A-D), eCN-nTDTom (E-H) and GCP-TDTom (I-L) mice shows the specificity of the Dox regimens for selectively labeling eCN and/or GCs. (M-O) Brain sections stained for nTDT showing recombination in tetO-Cre/+ R26LSL-TDTom animals throughout the forebrain and in some CSec and PSec PCs at P30 but not P7. nTDT: nuclear TDTomato. Cx: cortex, Hc: hippocampus, Cb: cerebellum, Ob: olfactory bulb. Scale bars: A-L: 100 μm, M-O: 500 μm.
Figure 5—figure supplement 2
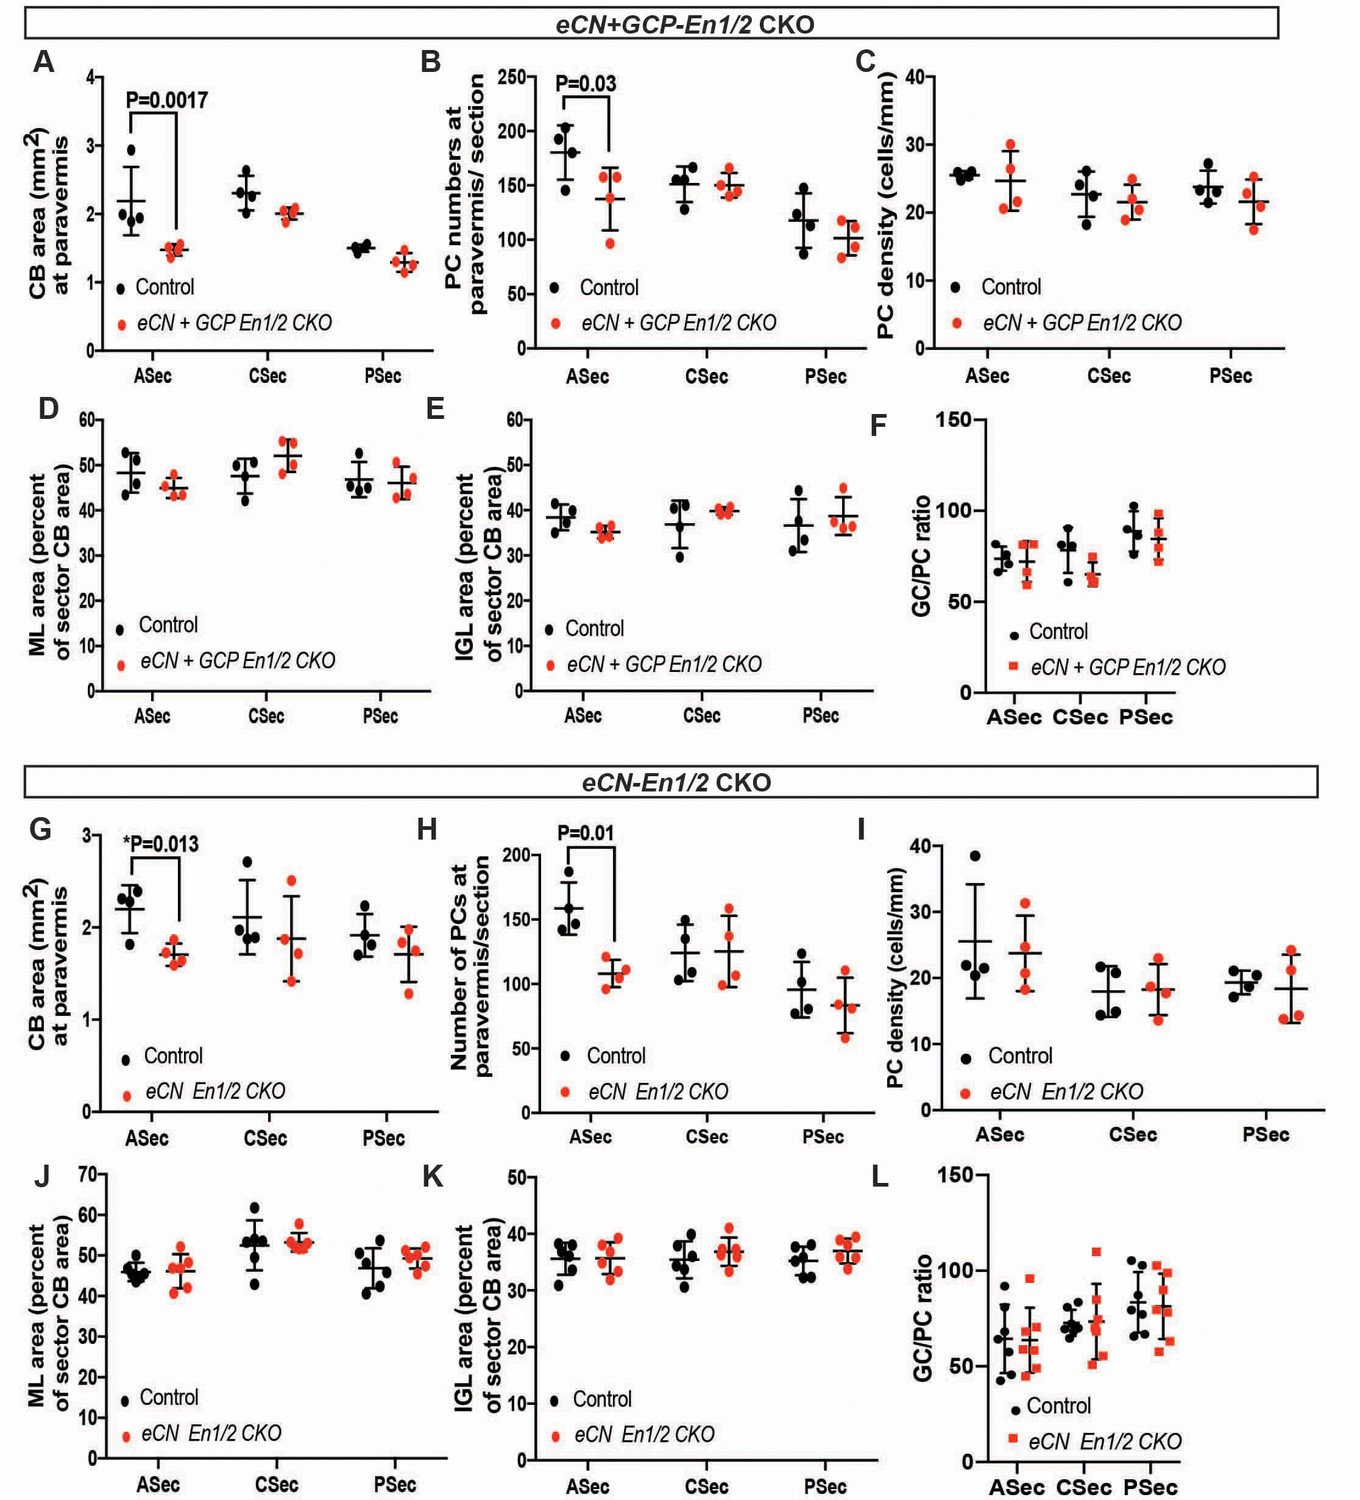
En1/2 CKOs involving the eCN have reduced area and PC numbers in the paravermis but the densities and ratios of neurons remain similar to normal.
(A-J) Quantification of the P30 paravermal for sector CB area (A, G), PC numbers (B,H), PC density (C,I), and ML (D,J) and IGL (E,K) areas relative to total sector areas (n = 4 animals/condition, ASec area: eCN+GCP-En1/2 CKO: Two-way ANOVA, F(1,6)=17.56, p=0.0057, eCN-En1/2 CKOs: Two-way ANOVA, F(1,18)=5.080, p=0.026, * indicates Student’s t-test, and ASec PC numbers: eCN+GCP-En1/2 CKO: Two-way ANOVA, F(1,18)=5.284, p=0.034, eCN-En1/2 CKOs: Two-way ANOVA, F(1,18)=5.633, p=0.029). (F,L) GC to PC ratios were preserved in both eCN+GCP-En1/2 CKOs and eCN-En1/2 CKOs compared to their control littermates. Significant post hoc comparisons are shown in the figure.
Figure 5—figure supplement 3
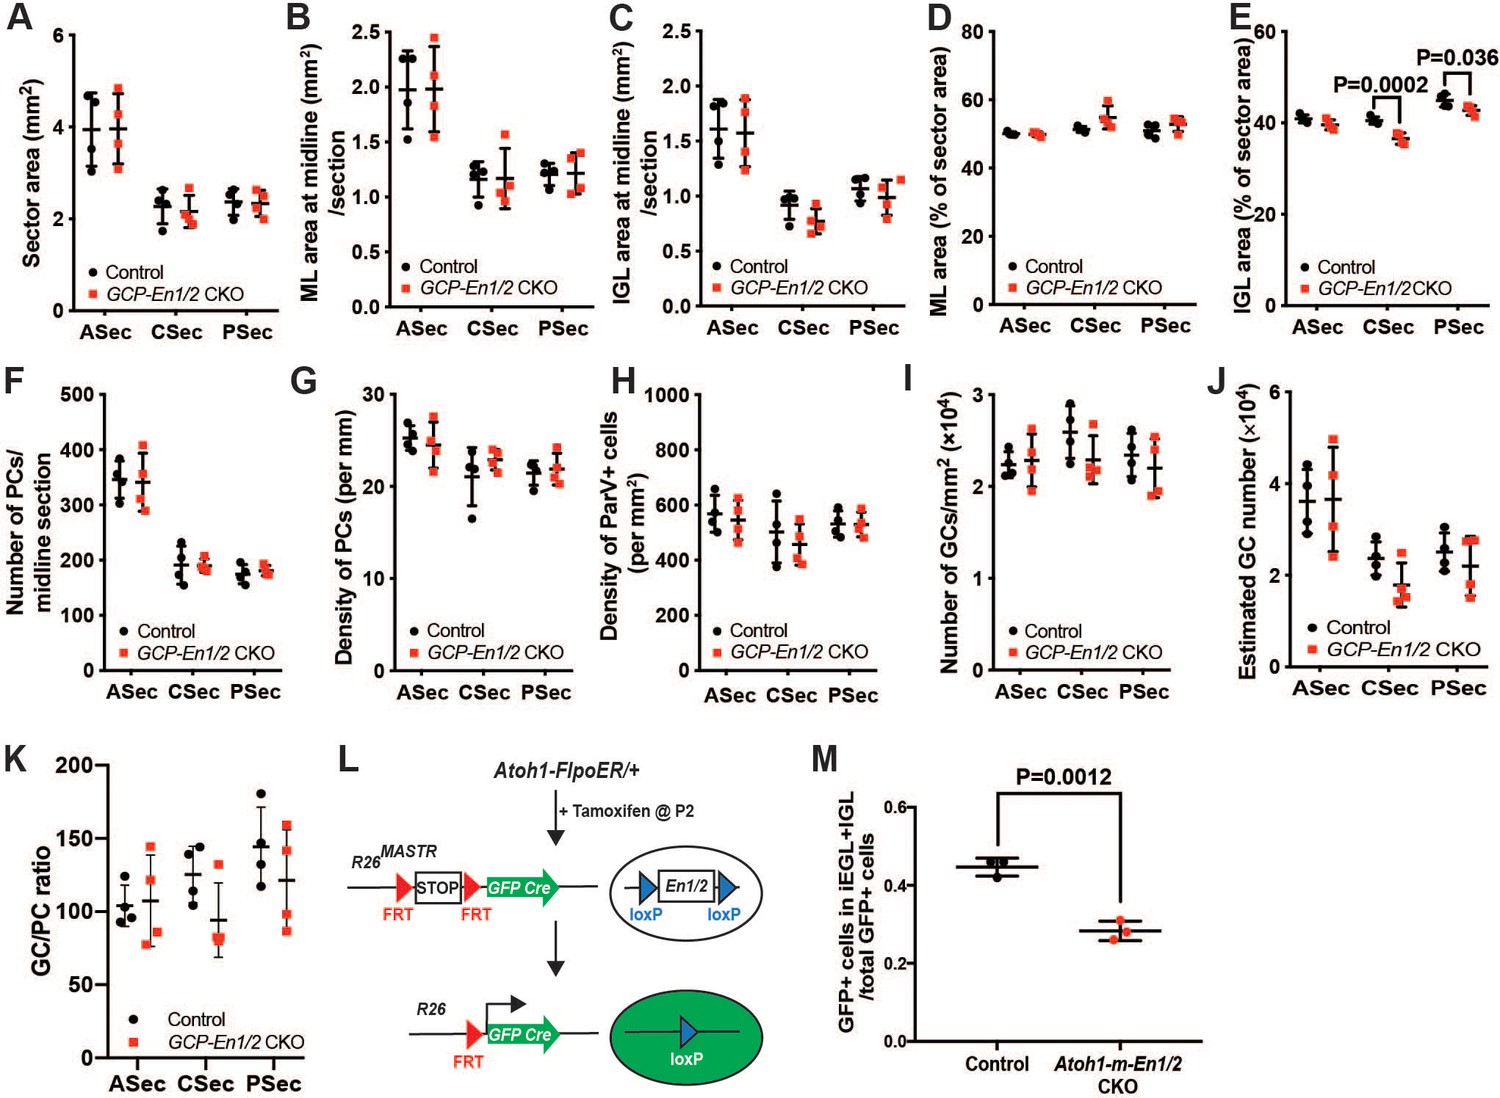
GCP-En1/2 CKOs do not show a major cerebellar growth defect and En1/2 promote differentiation of granule cells.
(A-J) Quantification of the vermal CB area (A), ML and IGL areas (B,C) and their relative proportions to total sector areas (D,E), PC numbers (F) and densities (G), densities of Pvalb+ ML interneurons (H) and estimated GC numbers and densities (I,J) (n = 4 animals/condition, Two-way ANOVA, F(1,18)=30.22, p=0.0001). Significant post hoc comparisons are shown in the figure. (K) GC to PC ratios are not changed in GCP-En1/2 CKOs compared to their control littermates. (L) Schematic describing the mosaic mutant analysis with spatial and temporal control of recombination (MASTR) technique used. Atoh1-FlpoER/+; R26MASTR/+; En1flox/flox; En2flox/flox (Atoh1-m-En1/2 CKO) pups and controls (Atoh1-FlpoER/+; R26MASTR/+) were injected with Tamoxifen at P2 and sacrificed at P8. (M) Quantification of the relative proportion of the number of post mitotic GFP+ granule cells in the iEGL+IGL compared to the total number of GFP+ cells (GCPs+granule cells)(n = 3/condition, Student’s t-test).
Figure 6 with 1 supplement
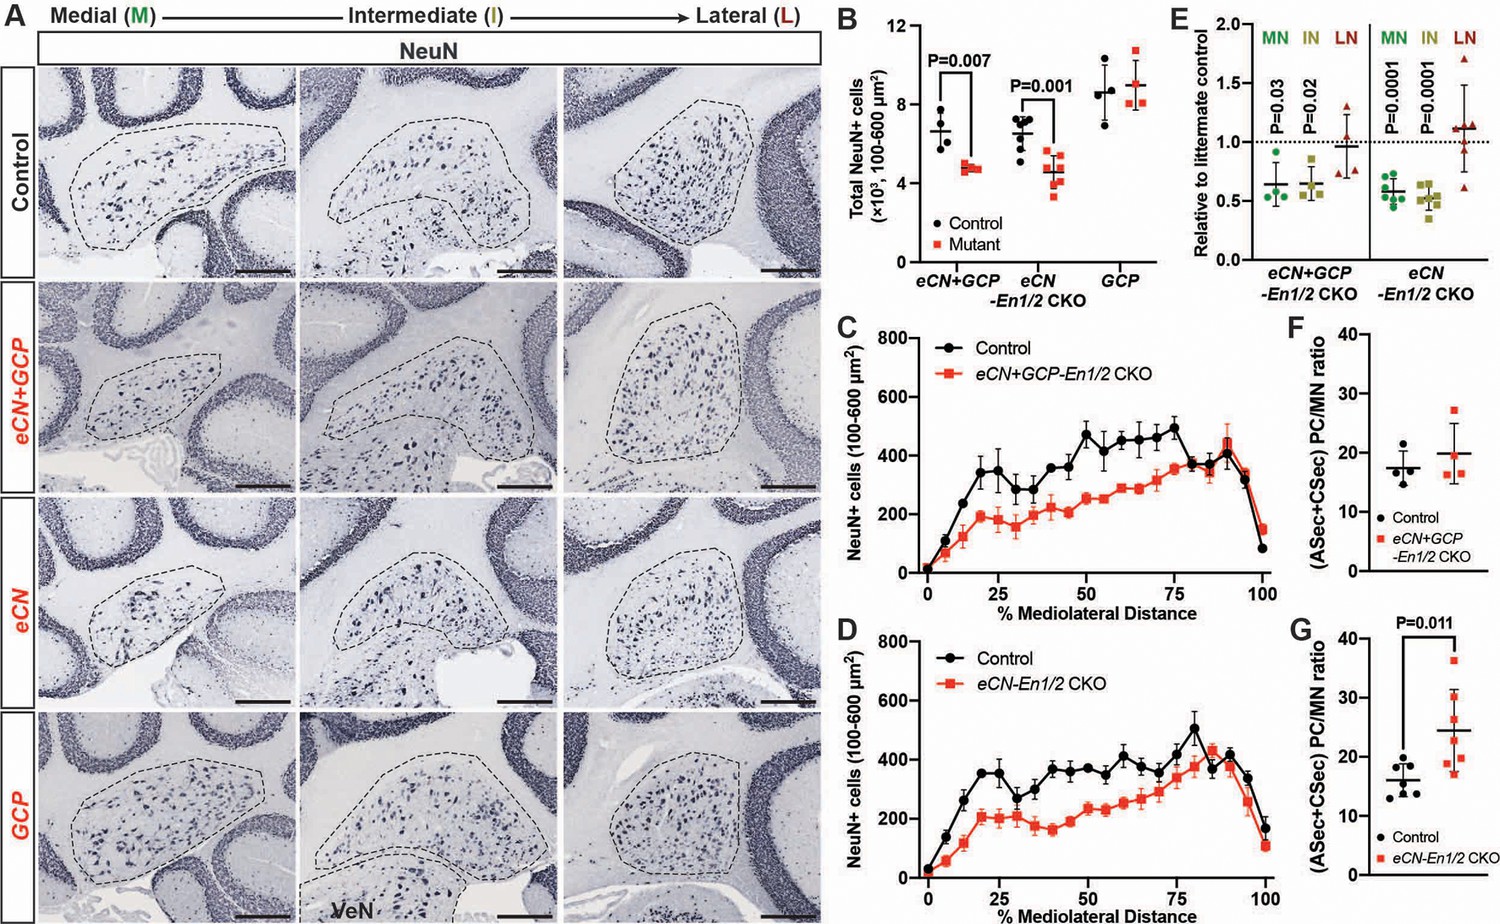
eCN numbers are reduced in eCN+GCP-En1/2 and eCN-En1/2 CKOs but not in GCP-En1/2 CKOs at P30.
(A) Representative immunohistochemistry for NeuN in all Dox regimens from midline (left) to lateral (right) cerebellum of P30 control and each of the cell specific En1/2 CKOs. (B) Quantification of NeuN+ cells that are 100–600 um2 (eCN size range) showing reduction in eCN+GCP- and eCN-En1/2 CKOs compared to controls, but not in GCP-En1/2 CKOs (Two-way ANOVA, F(1,24)=10.26, p=0.0038). (C,D) Mediolateral distribution of 100–600 um2 NeuN+ cells in eCN+GCP- and eCN-En1/2 CKO mutants showing a loss in medial and intermediate eCN compared to controls. eCN counts are plotted as bins of 5% percent of the mediolateral distance. (eCN+GCP-En1/2 CKO: Two-way ANOVA, F(1,120)=63.33, p=0.0001; eCN-En1/2 CKO: Two-way ANOVA, F(1,240)=104.4, p=0.0001) (E) Quantification of eCN in each nucleus of mutants relative to littermate controls (medial, MN; intermediate, IN; lateral, LN) showing a significant decrease in the MN and IN in eCN-En1/2 CKO (one-sample t-test per nucleus; MN: p=0.03, IN: p=0.02, LN: p=0.80) and eCN+GCP-En1/2 CKO mutants (one-sample t-test per nucleus; MN: p<0.0001, IN: p<0.001, LN: p=0.437). (F,G) Quantification of the ratio of PCs (from anterior and central sectors) to eCN in the medial nucleus in eCN+GCP- (F) and eCN-En1/2 CKOs (G), compared to the control littermates (Student’s t-test). Significant post hoc comparisons are shown in the figure. Scale bar = 250 μm. VeN = vestibular nuclei.
Figure 6—figure supplement 1
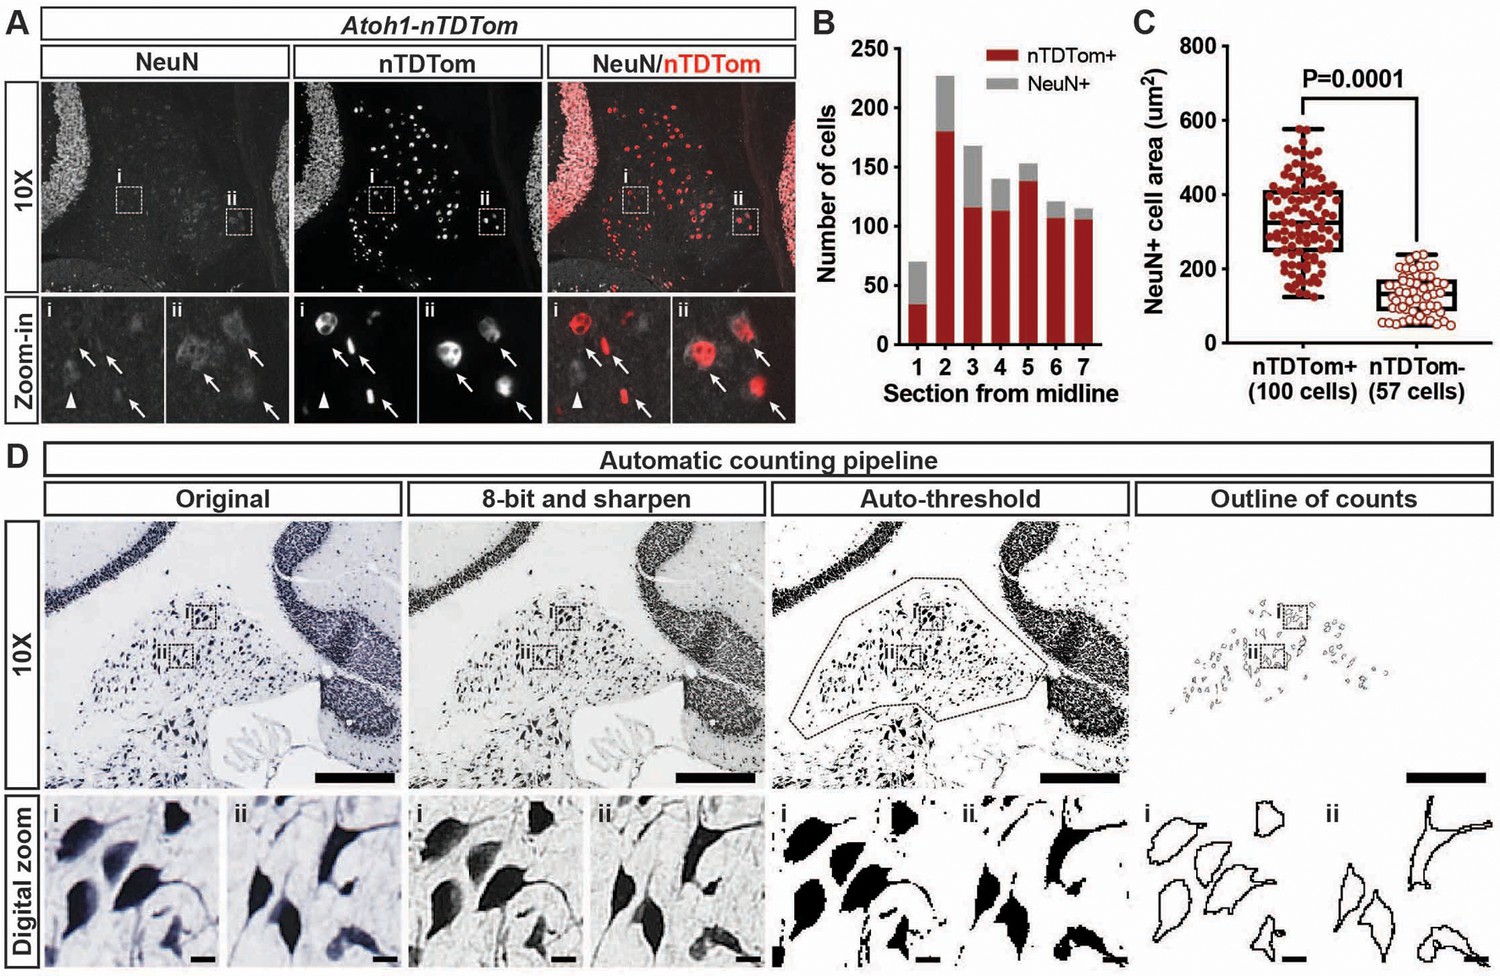
Semi-automated eCN counting methodology.
(A) NeuN immunofluorescence in sections of the CN from Atoh1-nTDTom mice. Digital zoom of the staining (i and ii) showing neurons that are NeuN+/nTDTom+ (arrows) or NeuN+/nTDTom- (arrowhead). (B) Quantification of the number of nTDTom+/NeuN+ cells and total number of NeuN+ cells from seven sections that encompass the mediolateral span of the CN in half a cerebellum. (C) NeuN+ cell body area was manually measured on seven sections collected from one Atoh1-nTDTom mouse using the free-hand tool in Fiji in either nTDTom+ or nTDTom- neurons. The size of the NeuN+/nTDTom+ (eCN neurons) ranged from approximately 125 um2 to 576 um2, whereas nTDTom- (CN interneurons) ranged from approximately 50 um2 to 240 um2. Quantification shows that the size of nTDTom+ cells is significantly larger than nTDTom- cells (Student’s t-test). (D) Example images of the steps in the image modifications used to enhance contrast and detect cell bodies using auto-threshold in Fiji. Digital zoom-in of NeuN immunohistochemistry (i and ii) for each image processing step shows reliable detection of NeuN+ neurons.
Figure 7 with 2 supplements
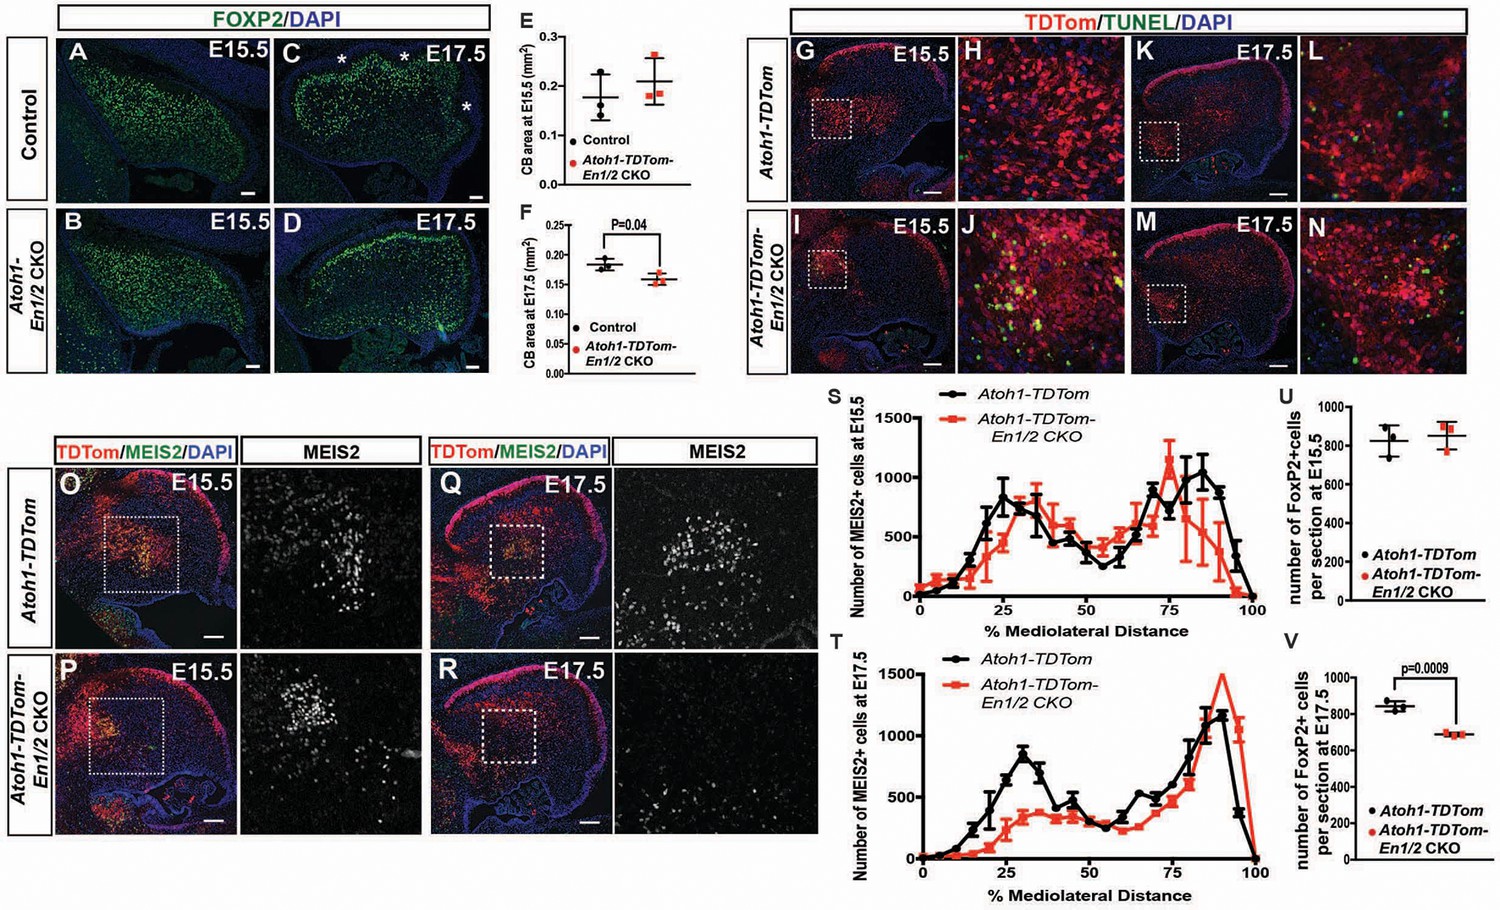
En1/2 are required for the survival of the medial eCN and maintenance of PC numbers.
(A–F) Immunofluorescent analysis and quantification of the cerebellar area using DAPI at E15.5 (A,B) and E17.5 (C,D) showing a significant reduction in area at E17.5 (F; Student’s t-test) but not at E15.5 (E; Student’s t-test) in Atoh1-En1/2 CKOs compared to littermate controls (n = 3/condition). A slight delay in foliation was also observed at E17.5 (* base of folds). (G–N) Immunofluorescent analysis of TDTom and TUNEL on sagittal sections from a Atoh1-TDTom (G–H, K–L) and Atoh1-TDTom-En1/2 CKO (I–J, M–N) embryo showing that apoptosis is increased in the precursors of the medial and intermediate eCN of mutants at E15.5 (I–J) and at E17.5 (G–L). (O–R) Representative images of sagittal sections at the level of the intermediate CN in (S,T) stained for MEIS2 and TDTom in Atoh1-TDTom (O,P) and Atoh-TDTom-En1/2 CKOs (Q,R). (S,T) Quantification of the average number of MEIS2+ eCN cells in every second sagittal section along the medial-lateral axis at E15.5 and E17.5 in Atoh1-TDTom compared to Atoh-TDTom-En1/2 CKOs (n = 3 for each genotype) showing reduction in the medial/intermediate eCN at E17.5. eCN counts are plotted as bins of 5% percent of the mediolateral distance (E15.5: Two-way ANOVA F(1,42)=2.182, p=0.1471, E17.5: Two-way ANOVA, F(1,42)=23.67, p<0.0001). (U,V) Quantification of PCs (FOXP2+ cells, see A-D) showing reduced PC numbers in Atoh1-En1/2 CKOs compared to controls (n = 3 each genotype) at E17.5 (V) but not at E15.5 (U) (E15.5: Student’s t-test, p=0.88). Scale bars: 100 μm.
Figure 7—figure supplement 1
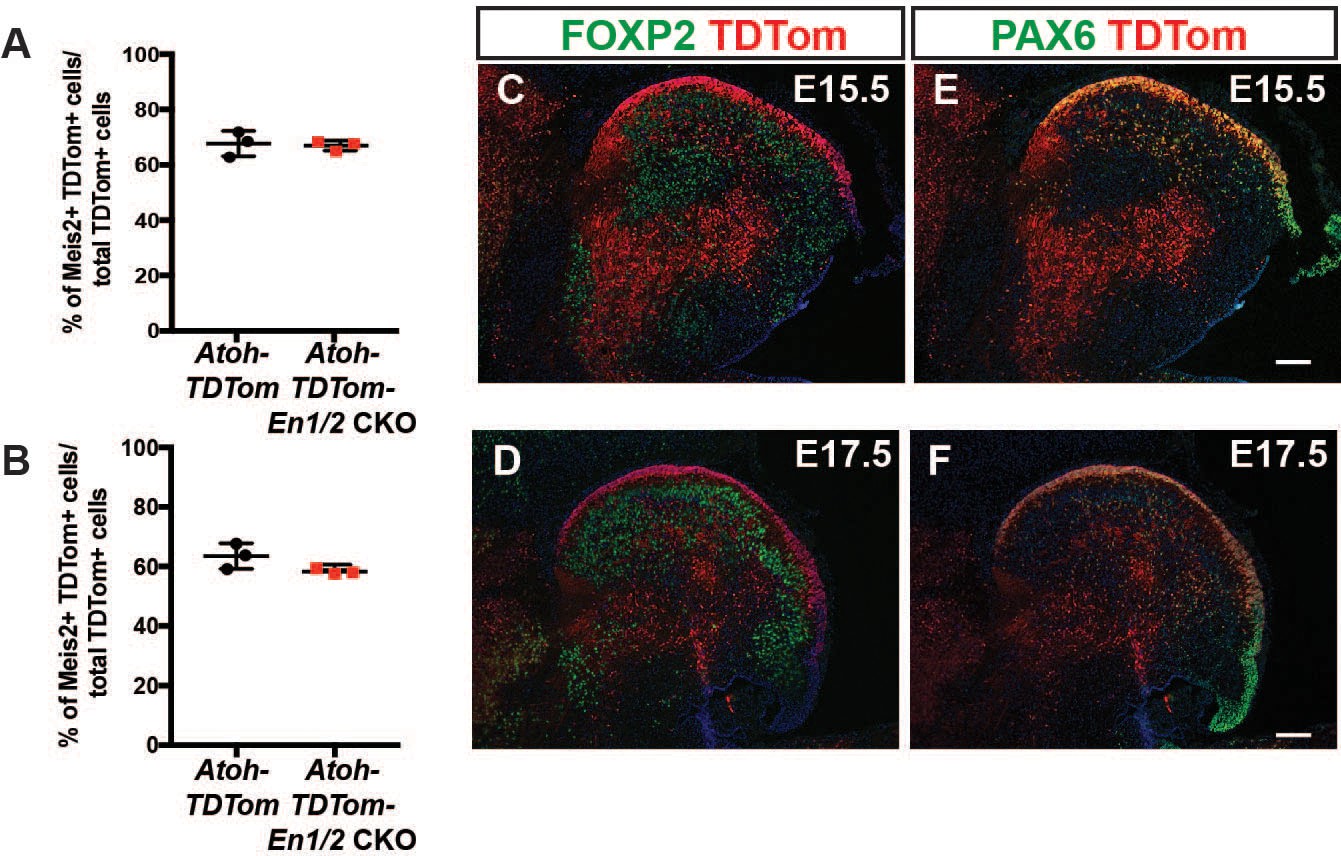
Atoh1-Cre marks the rhombic lip lineage but not PCs.
(A-B) Quantification of the percentage of Atoh1-Cre-derived cells (TDTom+) in Atoh1-TDTom mice that express MEIS2 showing no significant differences between Atoh1-En1/2 CKO mutants compared to controls at E15.5 (A) and E17.5 (B). (C-F) Immunofluorescent analysis showing TDTom+ cells (red) in the EGL and a few cells in the cortex express PAX6 (orange, granule cell lineage) at E15.5 (C) and E17.5 (D), and no TDTom+ cells express the PC maker FOXP2+ (E-F) at either age. Scale bars: 100 μm.
Figure 7—figure supplement 2
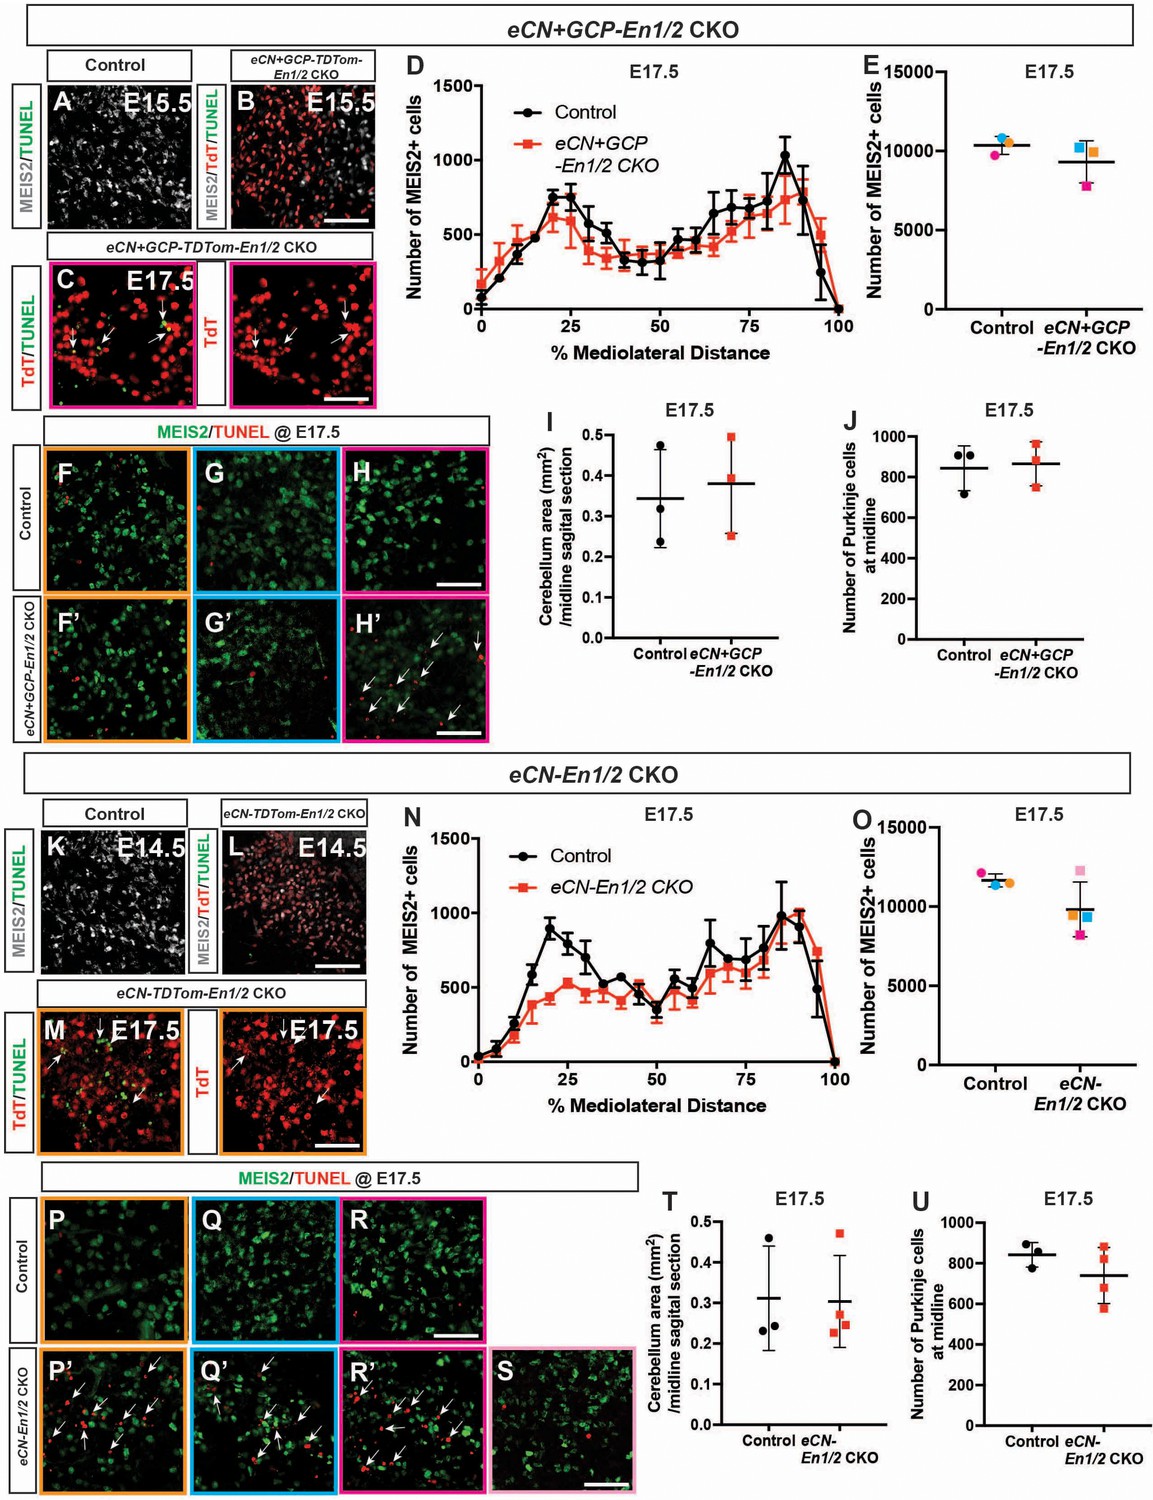
eCN in both eCN+GCP-En1/2 CKOs and eCN-En1/2 CKOs begin to die at E17.5.
(A-C) Immunofluorescence analysis using TUNEL showing no difference in cell death between eCN+GCP-En1/2 CKOs (B) and littermate controls (A) at E15.5, however TUNEL+ TdTom+ cells are present in the medial eCN by E17.5 in one eCN+GCP-En1/2 CKO (C, same mutant as in H’). (D) Quantification of the average number of MEIS2+ eCN cells in every second sagittal section along the medial-lateral axis at E17.5 in eCN+GCP-En1/2 CKOs compared to littermate controls (n = 3 for both genotypes). eCN counts are plotted as bins of 5% percent of the mediolateral distance (Two-way ANOVA, F(1, 84)=1.62. p=0.2067). (E) Quantification of the total number of MEIS2+ cells at E17.5 in eCN+GCP-En1/2 CKOs compared to littermate controls (Student’s t-test). Littermates are represented by dots of the same color. (F-H’) Immunofluorescence analysis using TUNEL showing increased apoptosis in the medial/intermediate eCN in a mutant with a reduced eCN number (H’) compared to its littermate control (H). (I) Quantification of cerebellar area at the midline in eCN+GCP-En1/2 CKOs and littermate controls at E17.5 (Student’s t-test). (J) Quantification of FOXP2+ cells between eCN+GCP-En1/2 CKOs and littermate controls at E17.5 (Student’s t-test). (K-M) Immunofluorescence analysis using TUNEL showing no difference in cell death in eCN-En1/2 CKOs (L) compared to littermate controls (K) at E14.5, however TUNEL+ TdTom+ cells are present in the medial eCN by E17.5 in eCN-En1/2 CKOs (M, same mutant as in P’). (N) Quantification of eCN cells in every second sagittal section along the medial-lateral axis at E17.5 in eCN-En1/2 CKOs compared to littermate controls (n = 3 for controls, n = 4 for mutants) showing reduction in the medial/intermediate eCN at E17.5. eCN counts are plotted as bins of 5% percent of the mediolateral distance (Two-way ANOVA, F(1, 105)=6.27, p=0.0138). (O) Quantification of the total number of MEIS2+ cells at E17.5 in eCN-En1/2 CKOs compared to littermate controls (Student’s t-test). Littermates are represented by dots of the same color (light pink and dark pink mutants are from the same litter). (P-S) Immunofluorescence analysis using TUNEL showing increased cell death in the medial/intermediate eCN of mutants with reduced eCN numbers (P’, Q’, R’) compared to littermate controls (P, Q, R). (T) Quantification of cerebellar area at the midline at E17.5 (Student’s t-test). (U) Quantification of FOXP2+ cells at E17.5 (Student’s t-test). Arrows indicate TUNEL particles. Scale bars = 50 μm.
Figure 8
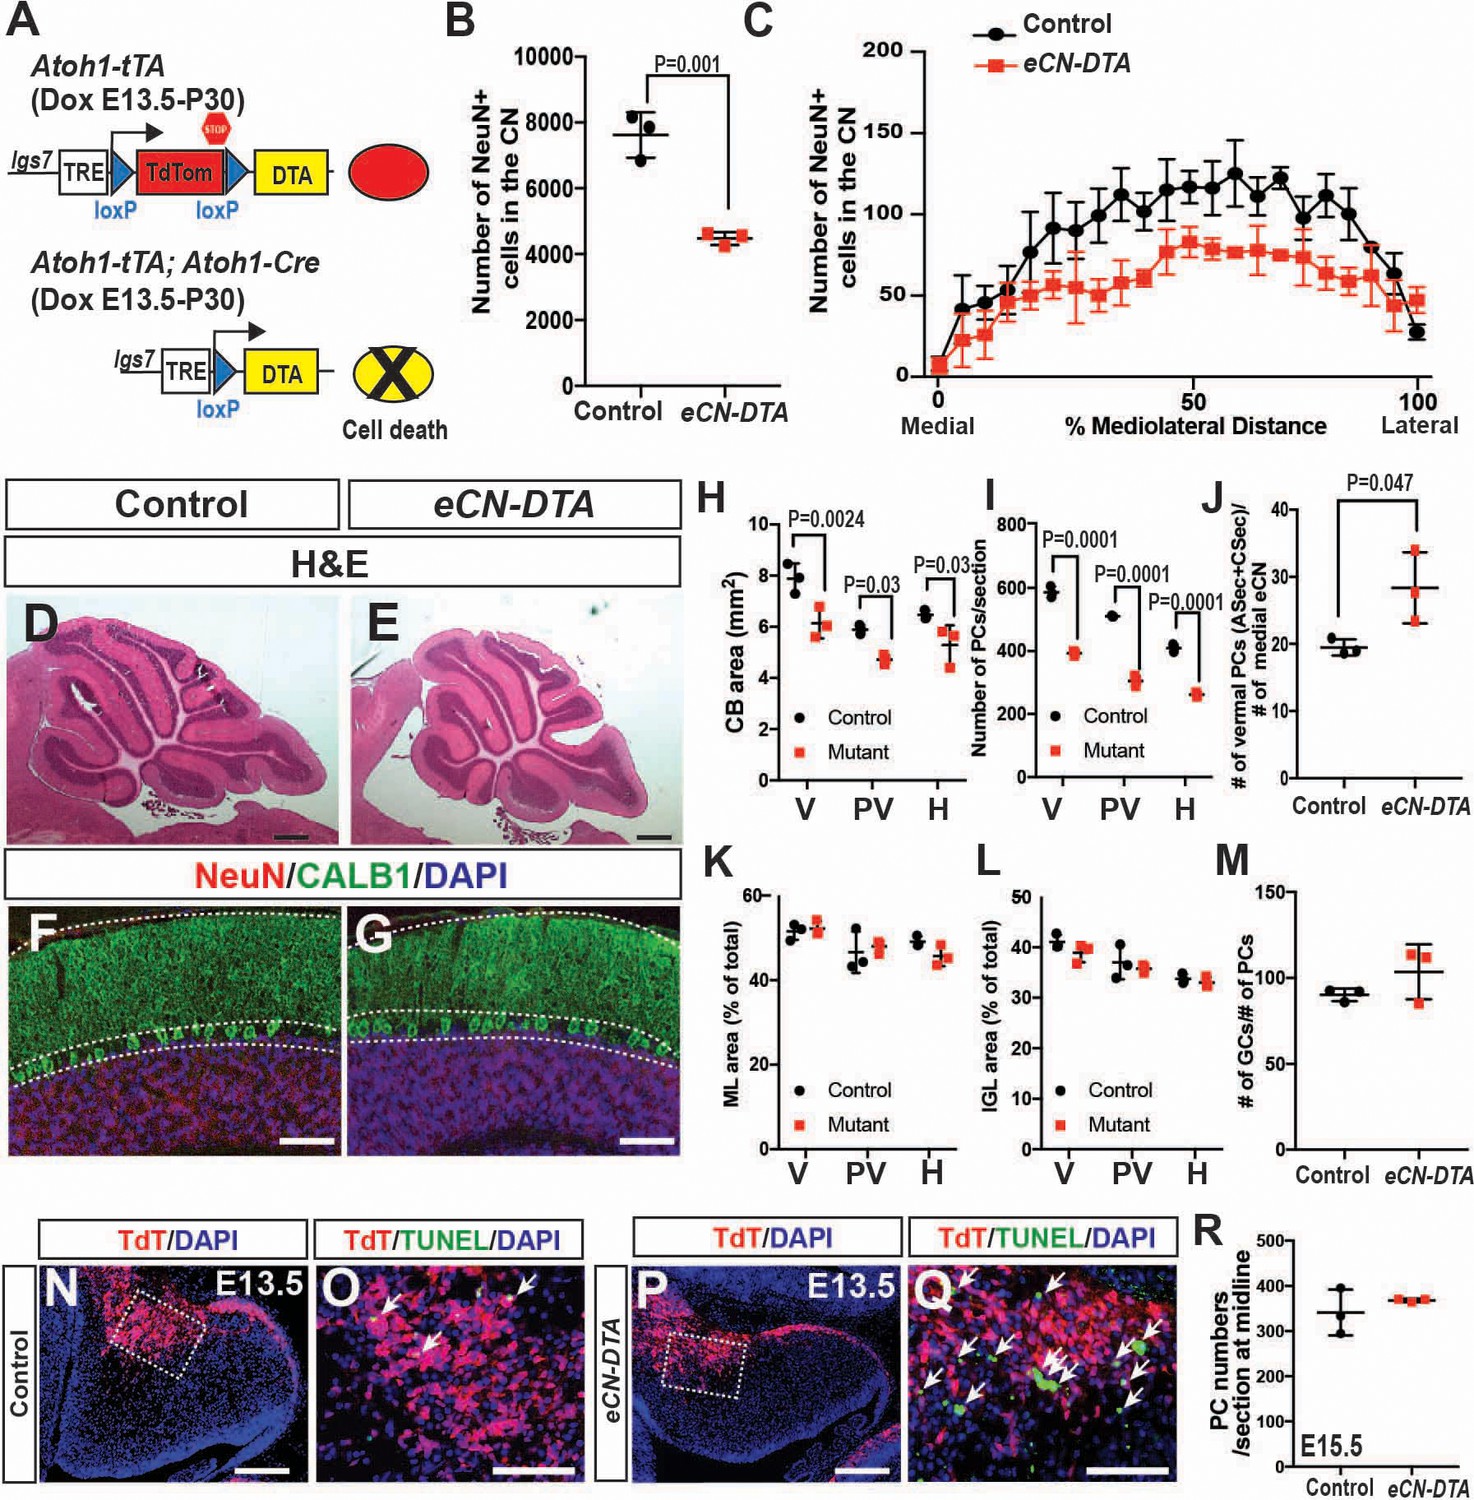
Genetic killing of embryonic eCN results in subsequent loss of PCs and reduced growth of the cerebellar cortex.
(A) Schematic explaining the genetics used to kill PCs in all three CN. Dox-controlled and recombinase activated gene overexpression (DRAGON) allele was used in combination with the Atoh1-tTA and Atoh1-Cre to enable embryonic killing of eCN via mis-expression of DTA (Dox given from E13.5 until sacrifice). (B) Semi-automated quantification of the large NeuN+ cells in the eCN on every second slide showing significant reduction in eCN-DTA animals at P30 compared to their littermate controls (n = 3 animals/genotype, Student’s t-test). (C) Cell loss was similar across the mediolateral axis (Two-way ANOVA, F(1,88)=52.48, p=0.0001). (D–G) H and E analysis (D,E) and immunofluorescent analysis (F,G) of PCs (CALB1+) and GCs in the IGL (NeuN+) on midsagittal sections showing reduction in cerebellar area but conserved cytoarchitecture. (H–I) Quantification of cerebellum area (H) and PC numbers (I) showing a significant reduction at all mediolateral levels at P30 in eCN-DTA animals compared to control littermates (cerebellum area: Two-way ANOVA, F(1,4)=19.47, p=0.0116, PC numbers: Two-way ANOVA, F(1,4)=38.86, p=0.0034) (V: vermis, PV: paravermis, H: hemispheres). (J) Estimated ratio of vermal ASec+CSec PCs to the medial eCN showing it is increased in the eCN-DTA animals compared to control littermates (n = 3/genotypes, Student’s t-test). (K–M) Quantification showing relative ratios of ML (K) and IGL (L) area compared to total sector area and the ratio of the number of GCs to PC (M, data quantified in the vermis) are unchanged. (N–Q) TUNEL staining for cell death showing an increase in the nuclear transitory zone at E13.5 in eCN-DTA animals compared to controls (n = 3). (R) Quantification of PC numbers (FOXP2+) at E15.5 on midsagittal sections showing that PCs are produced at a normal number in eCN-DTA animals (n = 3). Significant post hoc comparisons are shown in the figure. DTA: diphtheria toxin fragment A. Scale bars: D-E: 500 μm, F-H and N-Q 100 μm.
Figure 9 with 1 supplement
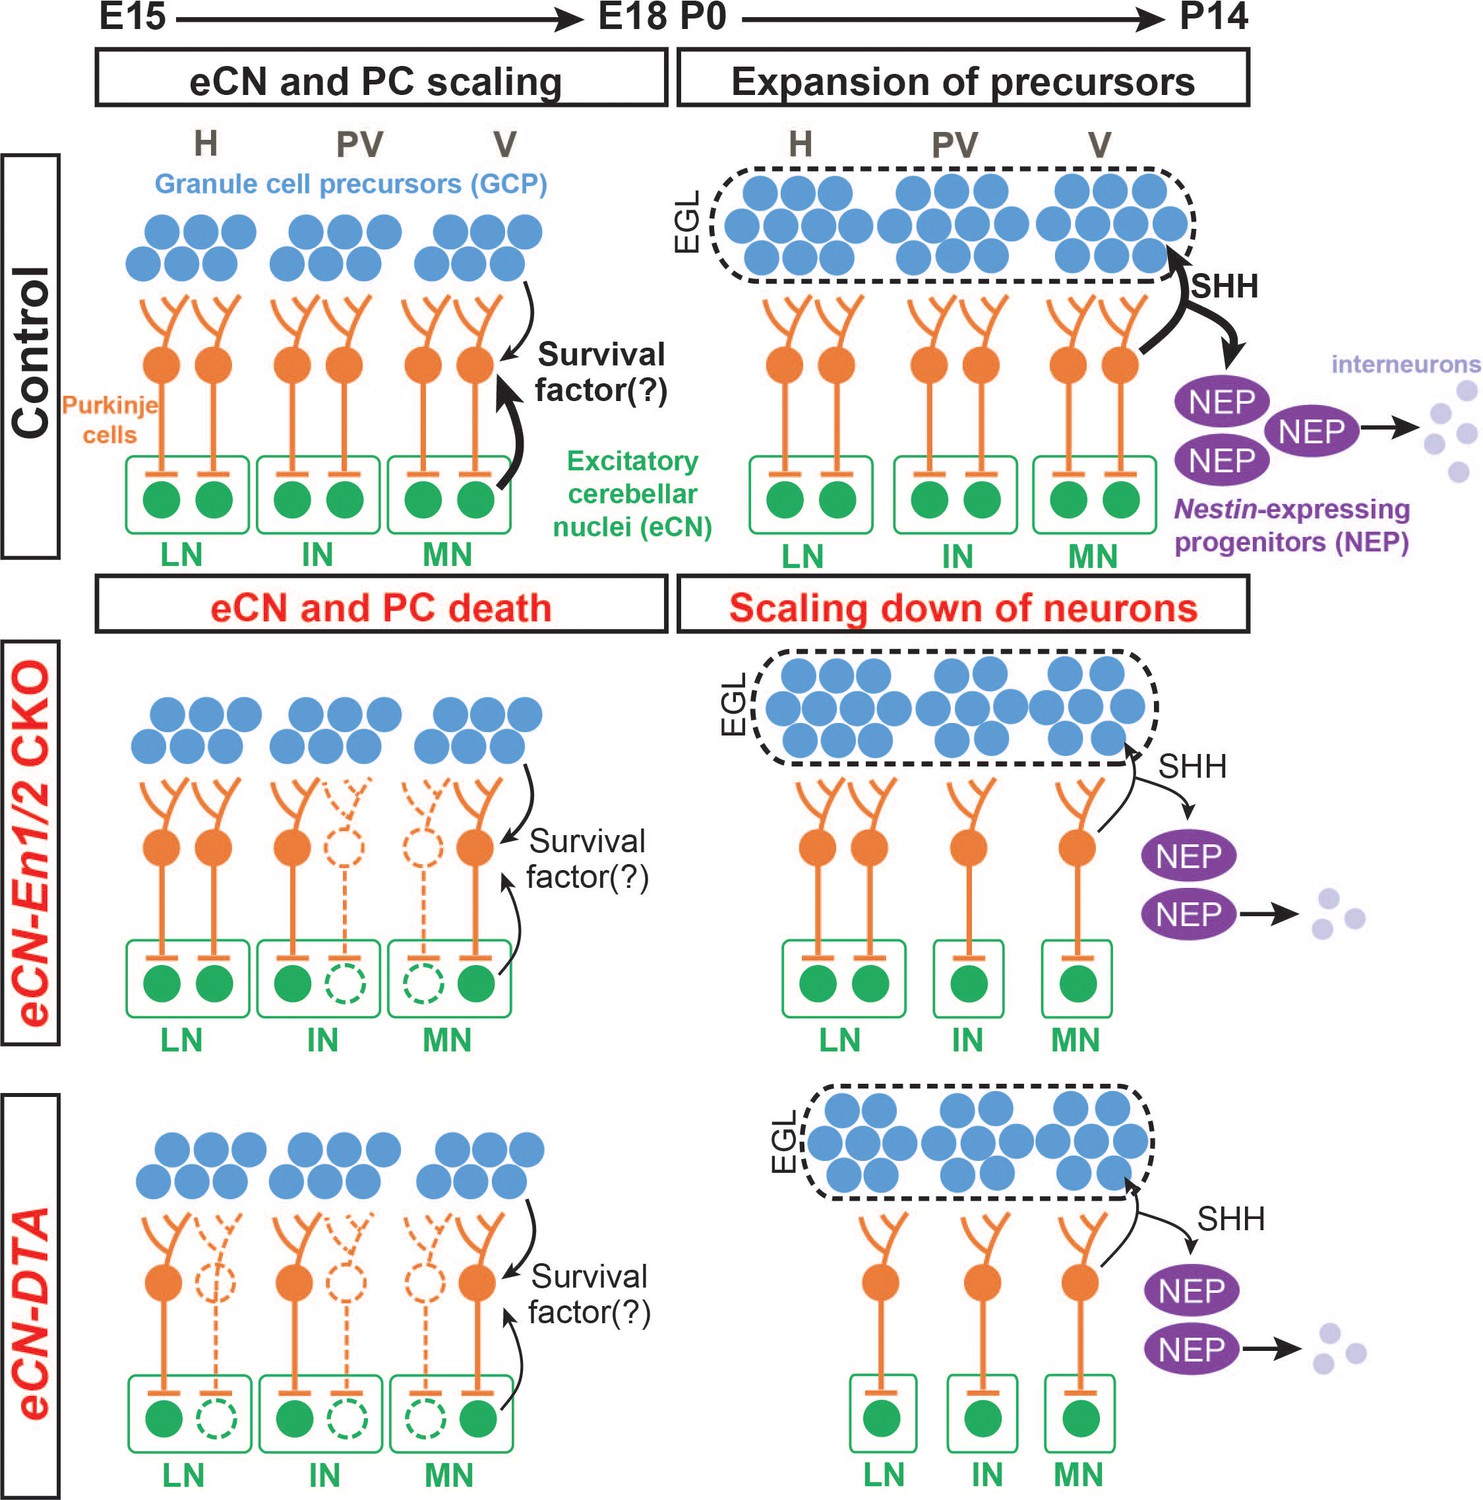
Schematic representation of the proposed mechanisms for scaling of neuron numbers in the cerebellum.
In normal conditions, the first born cerebellar neurons, the eCN, determine the number of their presynaptic partner PCs based on expression of a survival factor. PCs then in turn regulate the number of GCPs and nestin-expressing progenitors (NEPs) that generate the GCs and interneurons, respectively through expression of SHH. In eCN-En1/2 CKOs involving the eCN, eCN specifically in the medial and intermediate CN die after E15.5 and then their presynaptic partner PCs are lost, resulting in a smaller vermis and paravermis while preserving scaling of neuron numbers in the cortex. In eCN-DTA animals, eCN in all nuclei are killed and therefore growth of all regions of the cerebellum is reduced but cortex neurons are scaled. H: hemisphere, PV: paravermis, V: vermis, LN: lateral nucleus, IN: intermediate nucleus, MN: medial nucleus.
Figure 9—figure supplement 1
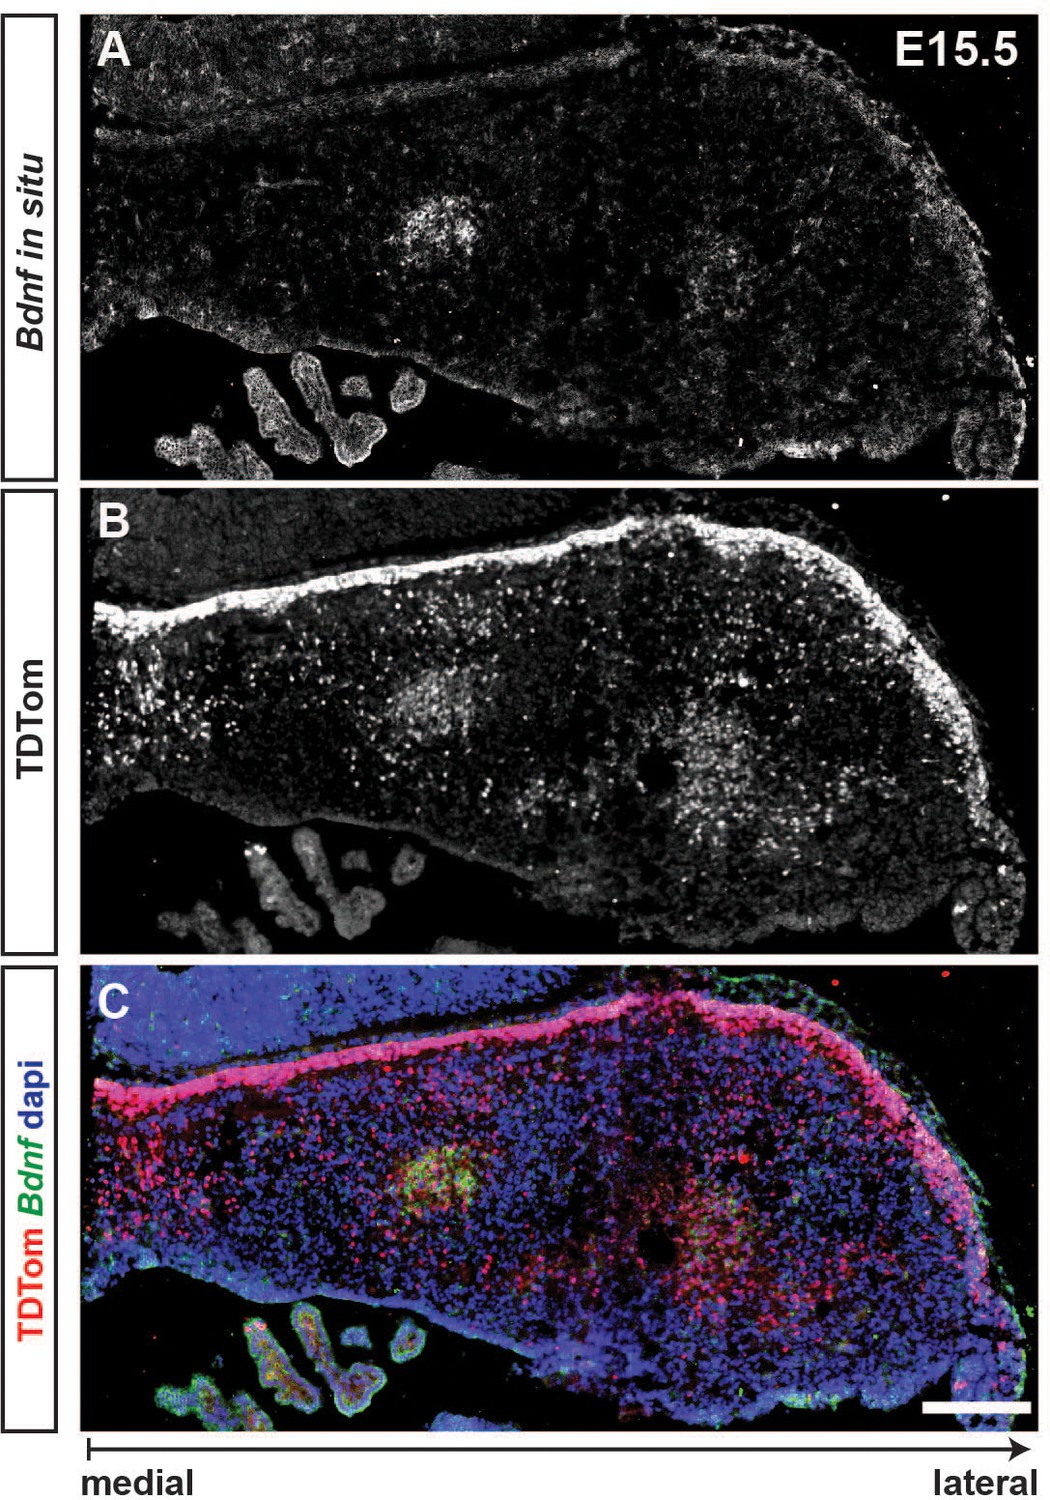
RNA in situ hybridization of Bdnf shows expression in a subpopulation of eCN at E15.5.
(A-C) In situ hybridization of Bdnf on coronal sections from a Atoh1-TDTom E15.5 embryo showing that a subpopulation of TDTom+ cells in the precursors of intermediate eCN express Bdnf. In situ hybridization images were pseudocolored in Green. Scale bar: 200 μm.
Author response image 1
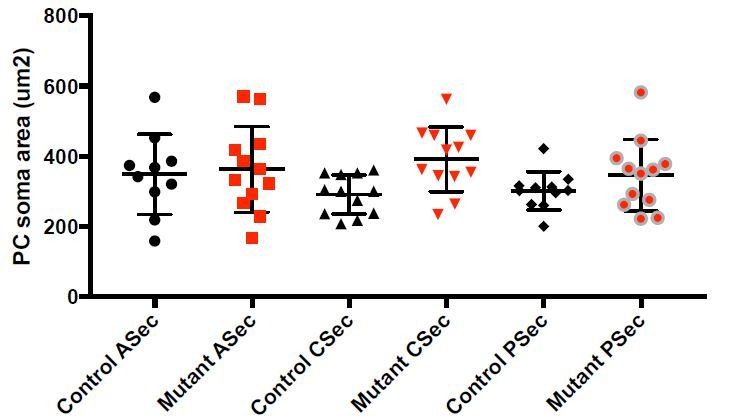
Quantification of PC soma size in Atoh1-En1/2 CKOs.
No overall signficiant difference between mutant and control PCs (One-way ANOVA, p>0.1).
Videos
Video 1
Stereology 3D reconstruction of a half cerebellum from a control animal at P30.
Green: medial CN, yellow: Intermediate CM, red: Lateral CN.
Video 2
Stereology 3D reconstruction of a half cerebellum from a Atoh-EN1/2 CKO animal at P30.
Green: medial CN, yellow: Intermediate CM, red: Lateral CN.
Tables
Key resources table
| Reagent type (species) or resource | Designation | Source or reference | Identifiers | Additional information |
|---|---|---|---|---|
| Genetic reagent (M. musculus) | En1lox | Sgaier et al., 2007 | Jackson Labs stock no: 007918 RRID:MGI:3789091 | |
| Genetic reagent (M. musculus) | En2lox | Cheng et al., 2010 | Jackson Labs stock no: 007925 RRID:MGI:3831084 | |
| Genetic reagent (M. musculus) | Atoh1-Cre | Matei et al., 2005 | Jackson Labs stock no: 011104 RRID:MGI:3775845 | |
| Genetic reagent (M. musculus) | R26LSL-TDTom (ai14) | Madisen et al., 2010 | Jackson Labs stock no: 007909 RRID:MGI:3809524 | |
| Genetic reagent (M. musculus) | R26LSL-nTDTom (ai75D) | Jackson Labs stock no. 025106 RRID:MGI:5603432 | ||
| Genetic reagent (M. musculus) | R26LSL-lacZ | Jackson Labs stock no. 002073 RRID:MGI:1861932 | ||
| Genetic reagent (M. musculus) | Pcp2Cre | Zhang et al., 2004 | Made by H. Saito and N. Suzuki, provided by P. Faust. | |
| Genetic reagent (M. musculus) | TetO-Cre | Perl et al., 2002 | Jackson Labs stock no. 006234 RRID:MGI:3770672 | |
| Genetic reagent (M. musculus) | Atoh1-tTA | described here | See Materials and methods | |
| Genetic reagent (M. musculus) | En2-HA | described here | See Materials and methods | |
| Genetic reagent (M. musculus) | Igs7TRE-LtSL-DTA/+ | To be described elsewhere, modified from Roselló-Díez et al. (2018) | ||
| Antibody | Rabbit anti-MEIS2 (K846) | Mercader et al., 2005 | Gift from Dr. Miguel Torres (CNIC, Spain) | 1:3000 for embryonic tissue, 1:2000 for adult tissue |
| Antibody | Goat anti-FOXP2 | Everest Biotech | EB05226 RRID:AB_2107112 | 1:1000 |
| Antibody | Rabbit anti-panEN | Davis et al., 1991 | 1:500 | |
| Antibody | Rabbit anti-Calbindin | Swant Inc | CB38 RRID:AB_2721225 | 1:1000 |
| Antibody | Mouse anti-Calbindin | Swant Inc | 300 RRID:AB_10000347 | 1:500 |
| Antibody | Mouse anti-NeuN | Millipore | MAB377 RRID:AB_2298772 | 1:1000 |
| Antibody | mouse anti-Parvalbumin | Millipore | MAB1572 RRID:AB_2174013 | 1:500 |
| Antibody | rat anti-HA | Sigma | 11867423001 | 1:1000 |
| Recombinant DNA reagent | AAV5-EF1a-DIO-mCherry | UNC Chapel Hill Vector Core | ||
| Commercial assay/Kit | In situ Cell Death Detection Kit | Roche (via Sigma) | 11684795910 | |
| Chemical compound/Drug | Doxycycline hyclate | Sigma | D9891 | 0.02 mg/mL in drinking water |
Additional files
Download links
A two-part list of links to download the article, or parts of the article, in various formats.
Downloads (link to download the article as PDF)
Open citations (links to open the citations from this article in various online reference manager services)
Cite this article (links to download the citations from this article in formats compatible with various reference manager tools)
Cerebellar nuclei excitatory neurons regulate developmental scaling of presynaptic Purkinje cell number and organ growth
eLife 8:e50617.
https://doi.org/10.7554/eLife.50617


