Activation of a nucleotide-dependent RCK domain requires binding of a cation cofactor to a conserved site
- Universidade do Porto, Portugal
Figures
Figure 1 with 1 supplement
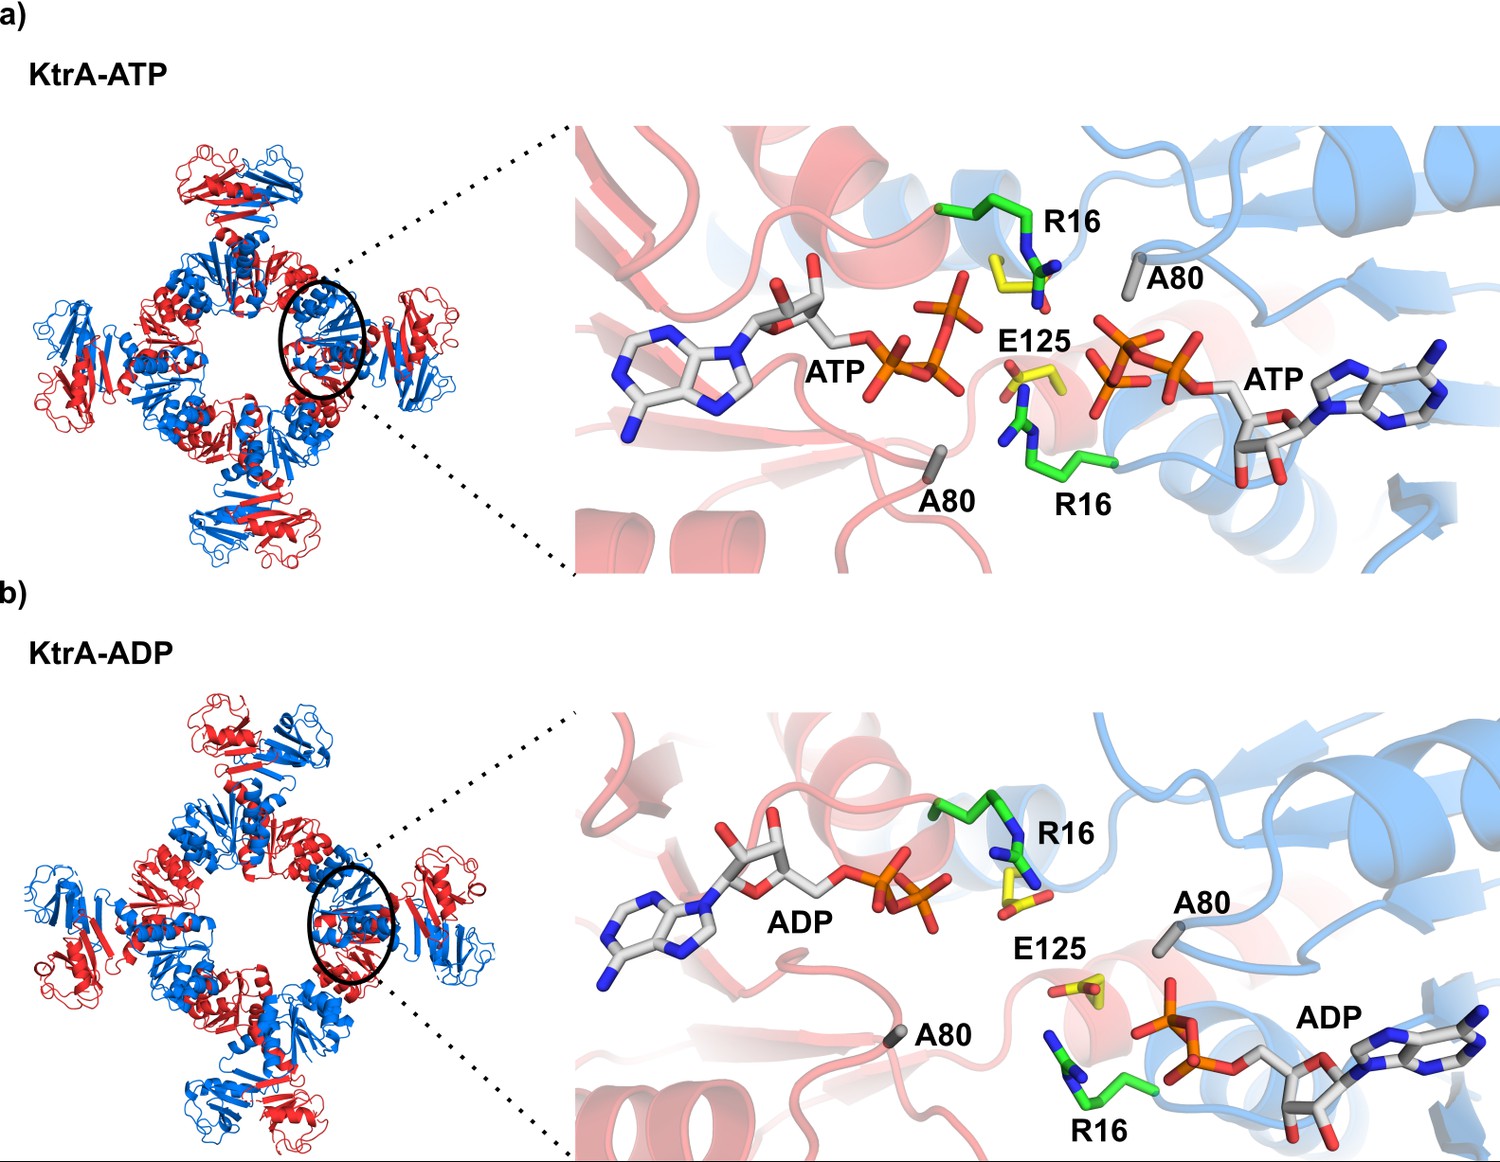
KtrA bound to ATP and ADP.
(a) Left - square conformation of the KtrA octameric ring bound to ATP. Right- view of the ATP binding pockets in a KtrA dimer showing dimer subunits and nucleotides positioned close together. (b) Left- non-square conformation of the KtrA octameric ring bound to ADP. Right - view of the ADP binding pockets showing dimer subunits and nucleotides positioned farther apart relative to a). Intra-dimer interface residues discussed in the main text are shown as stick and labeled. KtrA octameric ring subunits are colored alternately blue and red. See also Figure 1—figure supplement 1.
Figure 1—figure supplement 1
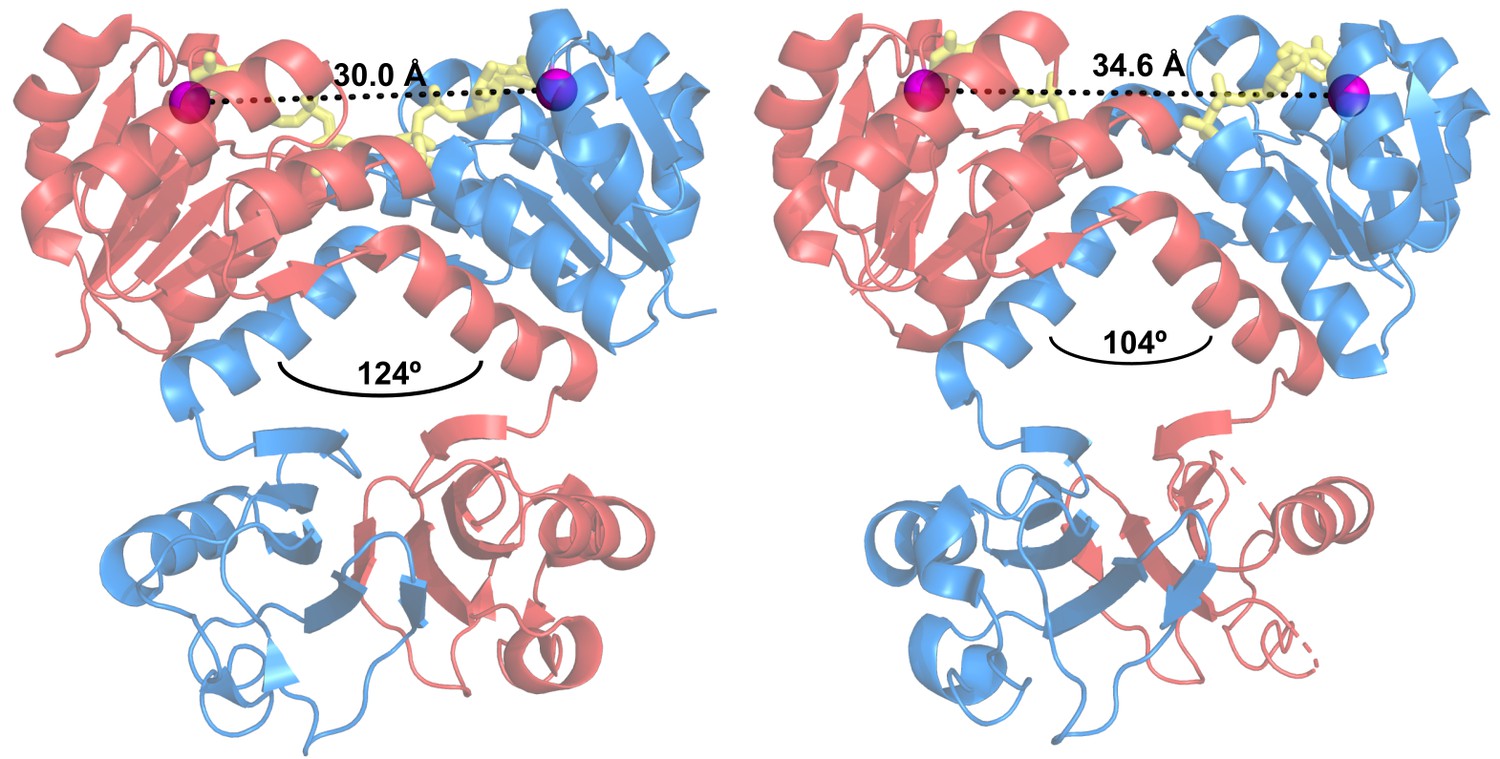
Intra-dimer hinge angle in wild-type KtrA.
Cartoon representation of ATP-bound (left) and ADP-bound (right) KtrA dimers, depicting the intra-dimer hinge angle measured between αF helices (black arc) and the D36-D36 intra-dimer distances. Dimer subunits are colored blue and red, D36 Cα are shown as purple spheres and nucleotides as yellow stick.
Figure 2 with 1 supplement
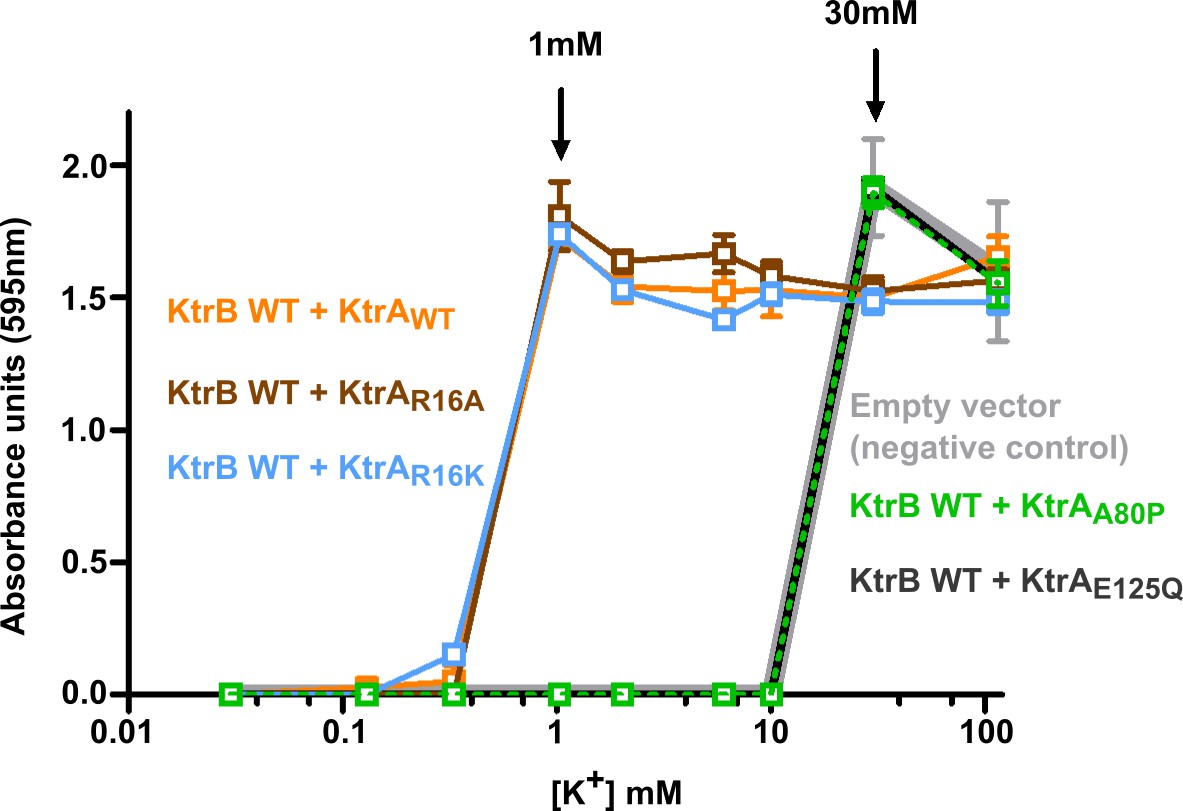
Functional impact of KtrA intra-dimer interface residues.
Optical density of overnight E. coli TK2420 cultures (expressing different KtrAB constructs) as a function of K+ concentration in the growth media. Mean ± SD (n = 6) from two independent experiments. See also Figure 2—figure supplement 1.
Figure 2—figure supplement 1
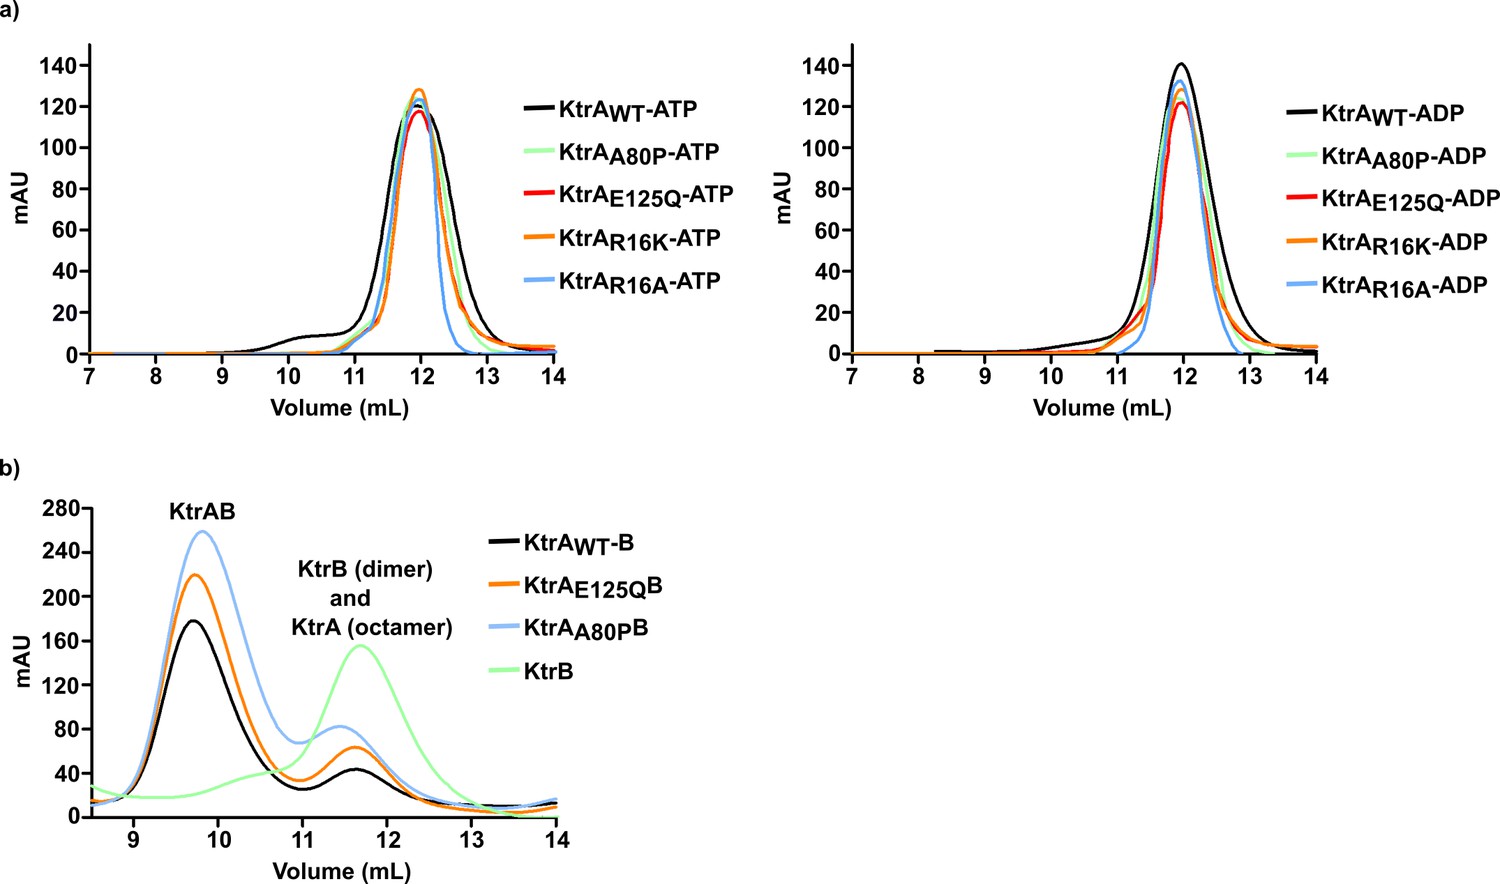
Size-exclusion chromatography elution profiles of KtrA and KtrAB proteins.
(a) Elution profiles of KtrA proteins bound to ATP (left) and ADP (right). (b) Elution profiles of KtrB and KtrAB complexes assembled with wild-type or mutant KtrA in the presence of ATP.
Figure 3 with 1 supplement
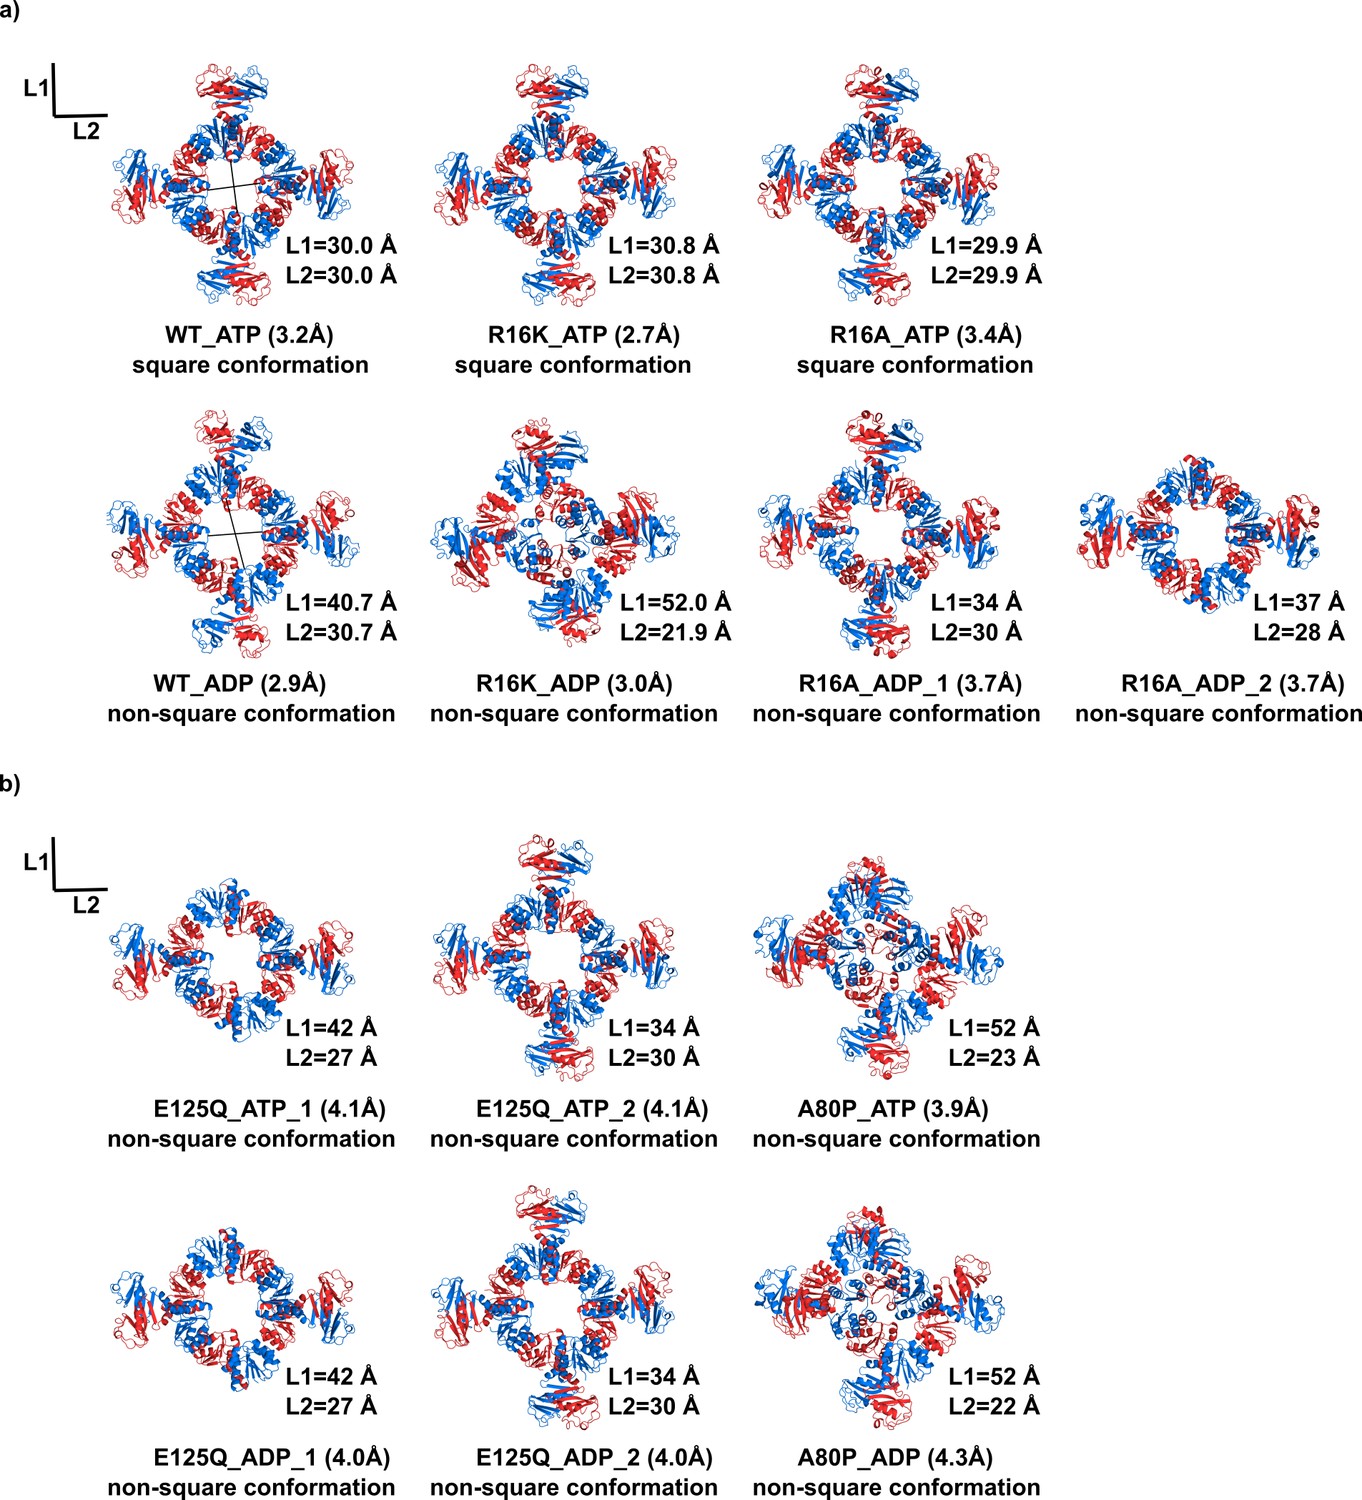
KtrA ring structures.
Views of crystal structures of wild-type and mutant KtrA that are (a) functional or (b) not functional in the TK2420 phenotype rescue assay. Top rows show structures with bound ATP and bottom rows show structures with bound ADP. KtrA octameric rings are displayed with subunits colored alternately blue and red. L1 and L2 are the pair of distances between the Cα of N38 residues located in opposite subunits across the ring. In three of these rings (R16A_ADP_2, E125Q_ATP_1 and E125Q_ADP_1), poor electron-density prevented modelling of C-terminal domains. See also Figure 3—figure supplement 1.
Figure 3—figure supplement 1
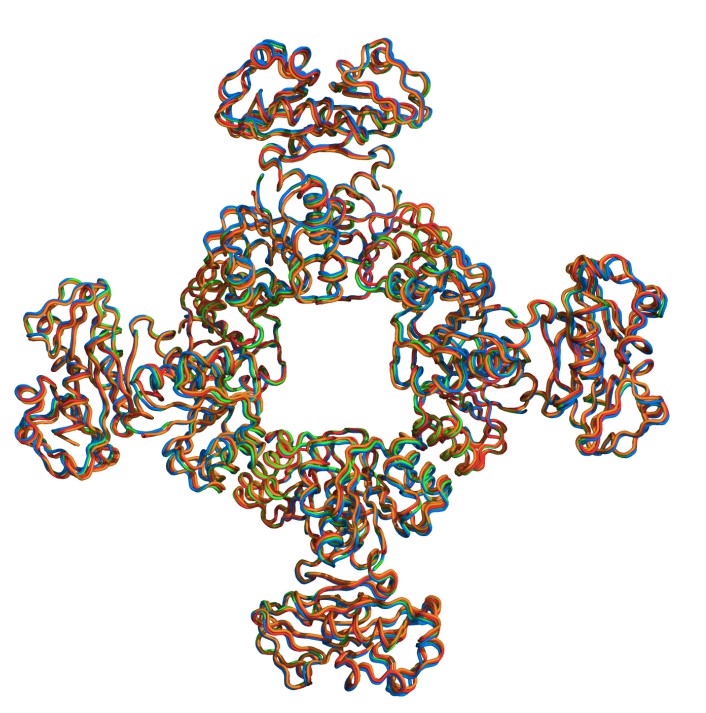
Square conformation in KtrA mutants.
Superposition of KtrA-ATP octameric rings that adopt the square conformation. KtrAWT (red), KtrAR16K (marine), KtrAR16A (orange), KtrAWT with bound calcium (green).
Figure 4
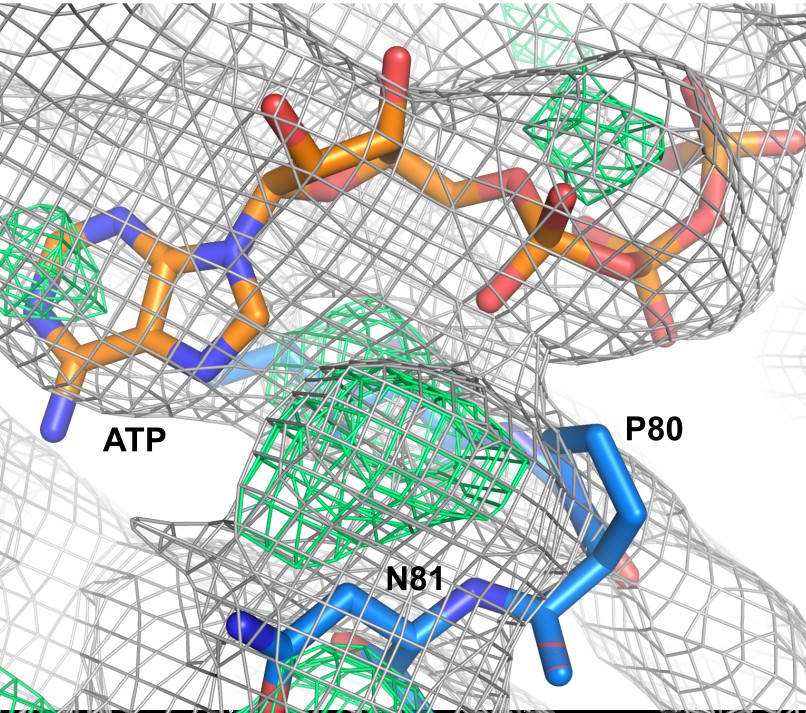
Nucleotide-binding site of the ATP-bound KtrA A80P mutant.
Electron density maps 2Fo-Fc (in gray) and Fo-Fc (in green), contoured at 1.0 and 3.0σ, respectively, are shown in mesh. ATP and two residues are shown as sticks. Residue P80 is outside the electron density in the eight KtrA subunits in the asymmetric unit.
Figure 5
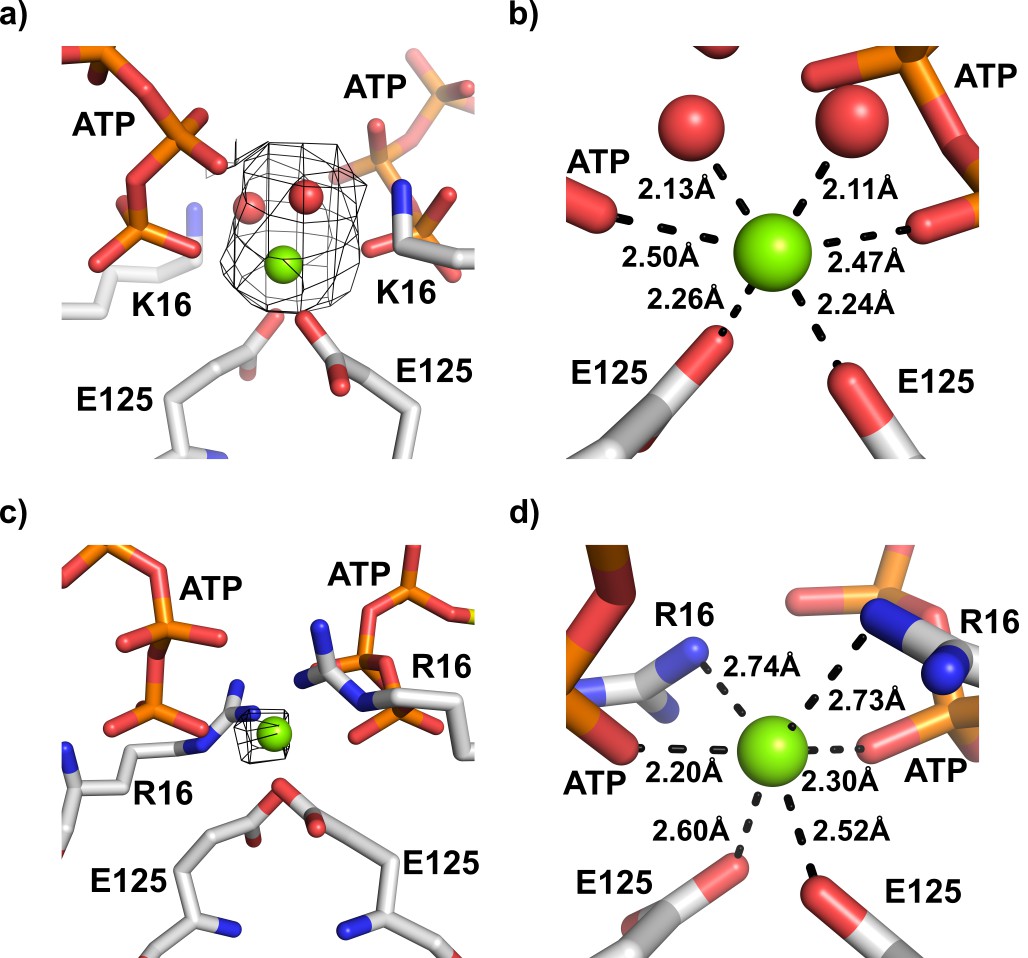
Magnesium ion binding site in the interface of KtrA dimers.
(a) View of the intra-dimer interface of R16K-ATP with unexplained electron density in Fo-Fc map (contoured at 3.0σ and calculated at a refinement stage when the structural model did not yet include Mg2+ or coordination waters) superposed on final refined model. (b) Close-up of the magnesium binding site depicted in a), showing the octahedral geometry of cation coordination. (c) View of the intra-dimer interface of wild-type KtrA-ATP (PDB:4J90) with Fo-Fc electron density (contoured at 3.0σ and calculated from deposited structure which does not include Mg2+) superposed on refined model. (d) Close-up of the magnesium binding site shown in c), highlighting the interactions established by the cation. Magnesium ion and water molecules are shown as green and red spheres, respectively. Residues and nucleotides coordinating ions are shown as stick with coordination distances indicated.
Figure 6 with 2 supplements
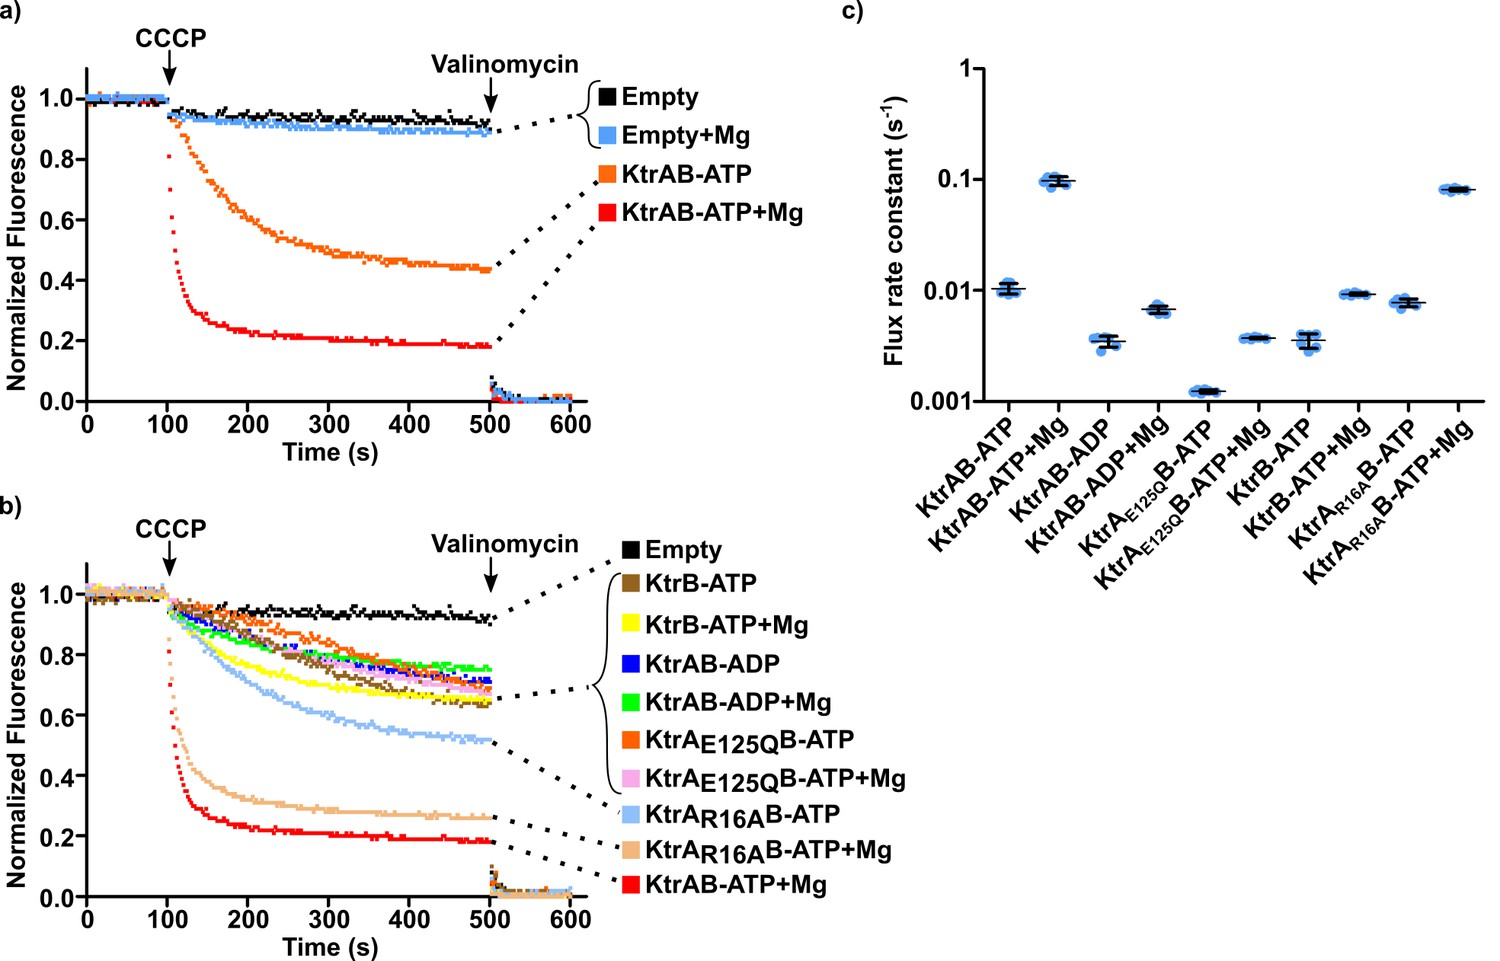
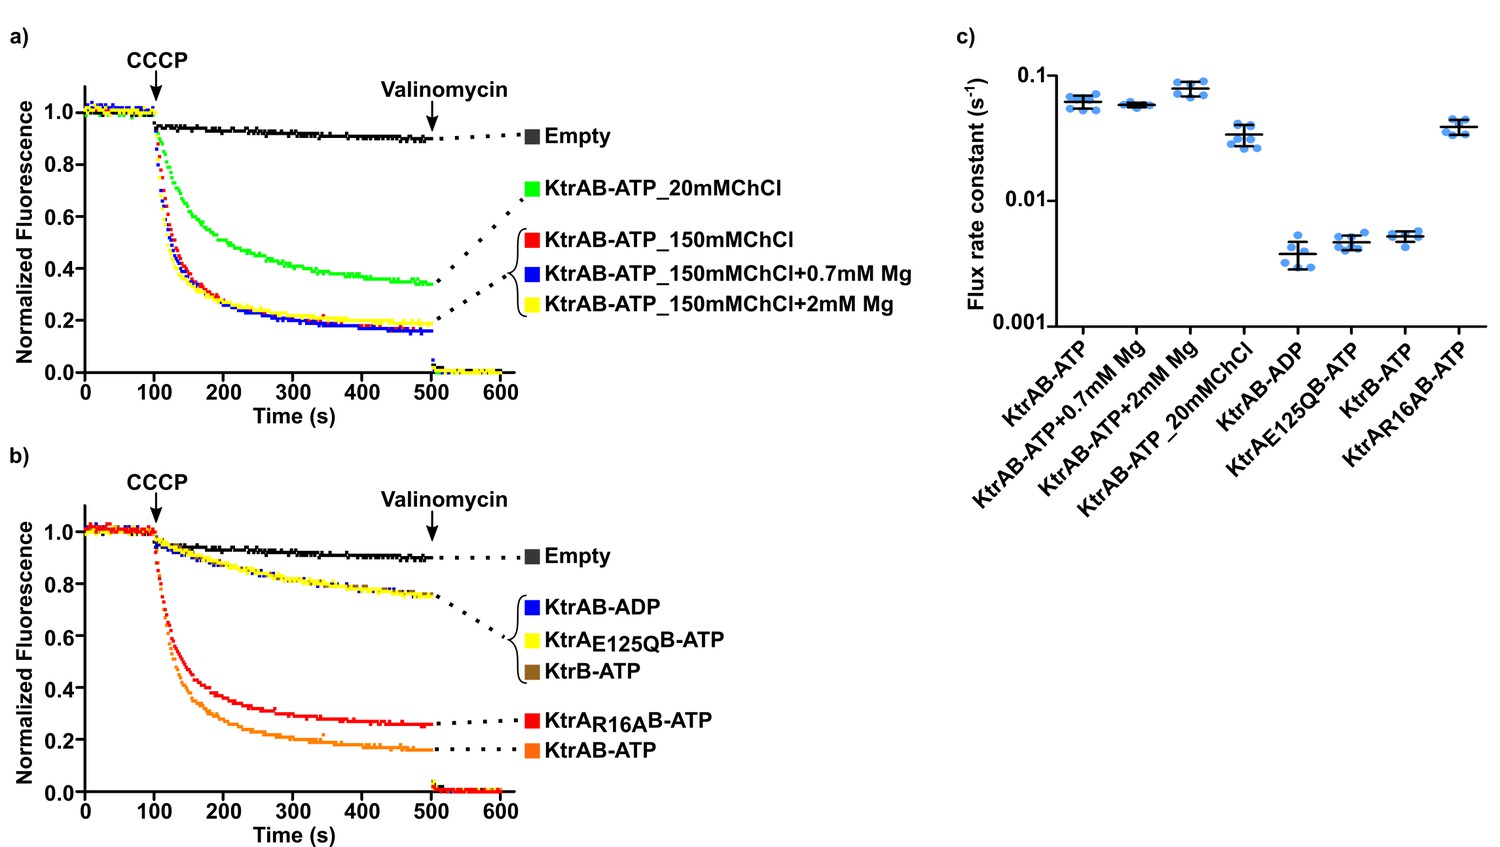
Impact of magnesium ion on KtrAB activity.
(a and b) Proteoliposome flux assay performed with KtrB and wild-type and mutant KtrAB with ATP or ADP, in the presence or absence of 2 mM magnesium, as indicated. All assays were performed with sorbitol in the external solution. Panels show representative fluorescence quenching curves. Empty liposomes were used as control. (c) Plot of flux rate constants for conditions in a) and b). Mean ± SD as well as individual rate constants (blue dots) are shown for n = 6–7 from at least two different proteoliposome preparations. See also Figure 6—figure supplement 1, Figure 6—figure supplement 2 and Figure 6—source data 1.
-
Figure 6—source data 1
Flux rate constants shown in Figure 6c.
- https://cdn.elifesciences.org/articles/50661/elife-50661-fig6-data1-v2.xlsx
Figure 6—figure supplement 1
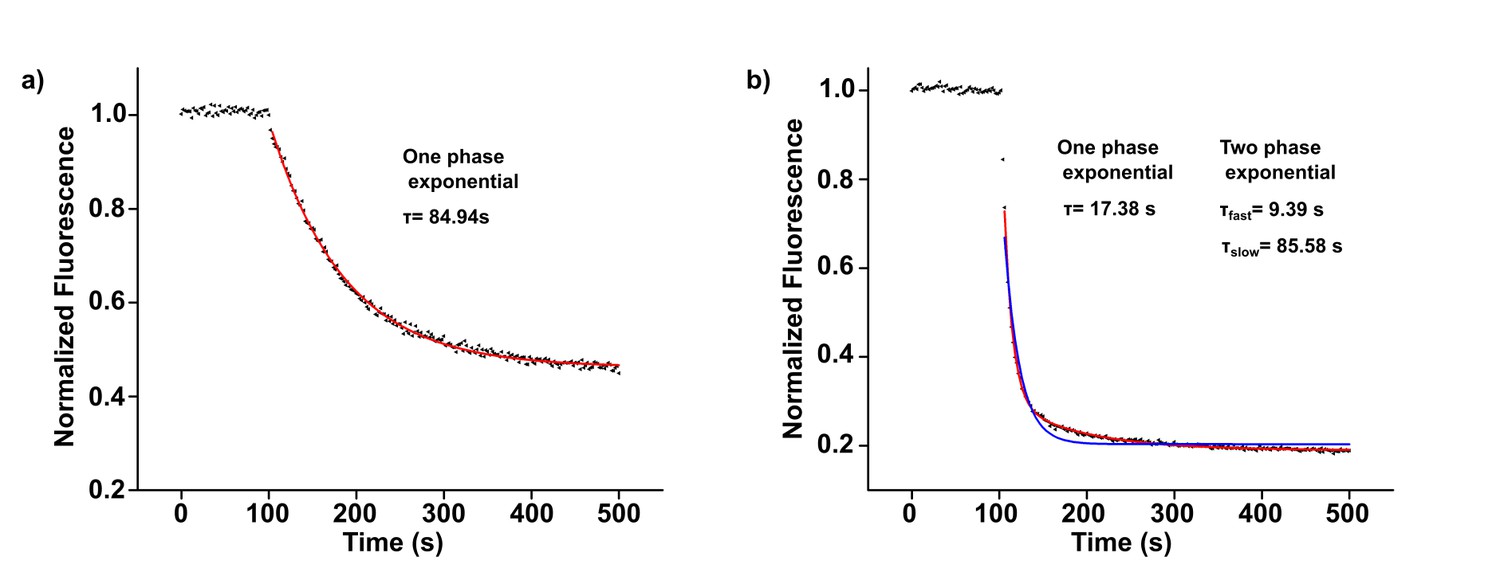
Examples of fluorescence quenching fits with exponential equations.
(a) KtrAB-ATP flux assay representative curve with sorbitol in the external solution. Fit was performed using a one-phase exponential equation: (red line). (b) KtrAB-ATP flux assay representative curve with sorbitol in the external solution and in the presence of 2 mM magnesium. Fit was performed using a two-phase exponential equation: + (red line). Attempt of fitting with a one phase exponential equation is shown as a blue line.
Figure 6—figure supplement 2
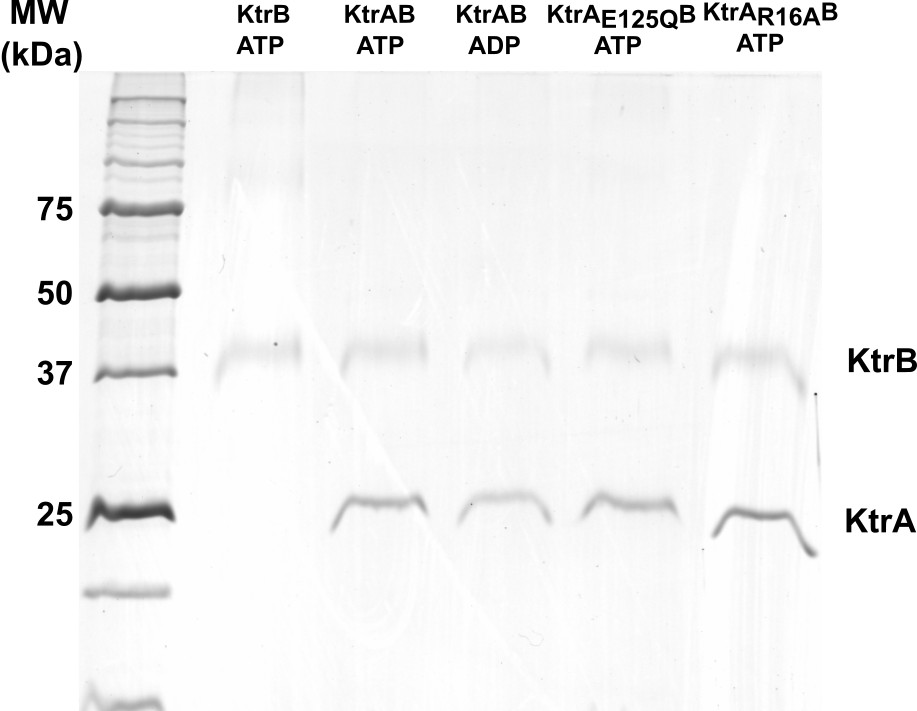
SDS-PAGE gel analysis of proteoliposomes.
5 µl of proteoliposomes reconstituted with KtrB or KtrAB assemblies were loaded in each well. Molecular weight markers (MW) are shown on the left. Bands corresponding to KtrB and KtrA are indicated.
Figure 7
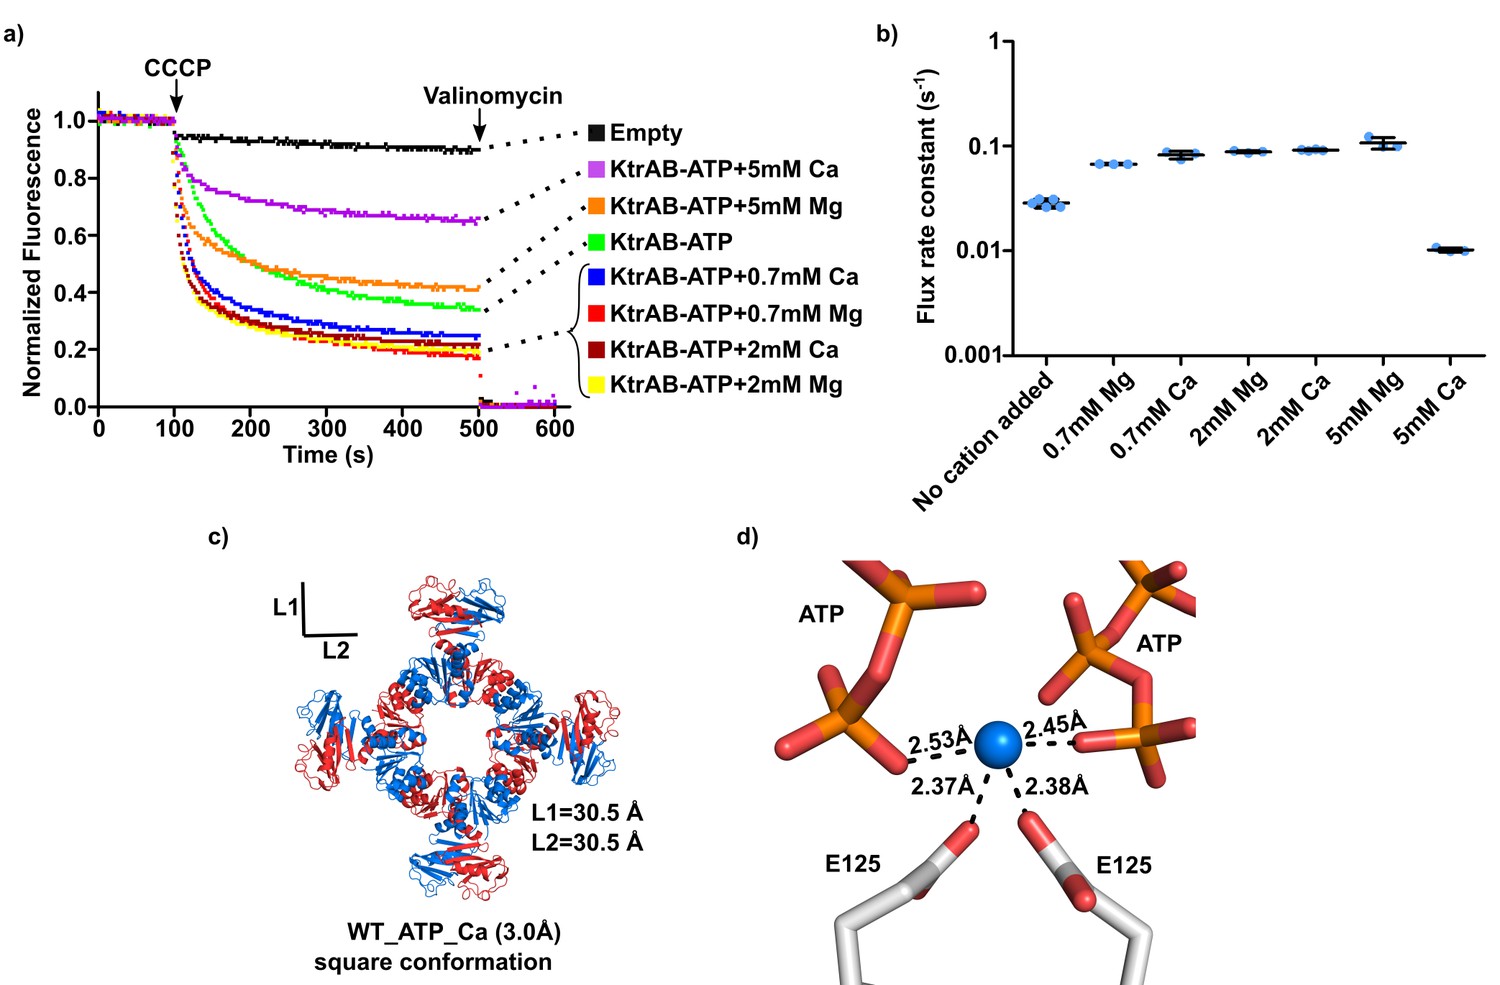
Impact of calcium ion on KtrAB activity.
(a) Proteoliposome flux assay with KtrAB-ATP in an external solution with 20 mM choline chloride and sorbitol. The panel shows representative fluorescence quenching curves. Empty liposomes were used as control. (b) Plot of flux rate constants for conditions shown in a). Mean ± SD as well as individual flux rate constants (blue dots) are shown with n = 3–5 of the same proteoliposome preparation. For KtrAB-ATP + 5 mM Mg2+ the amplitude of the fast component in the double-exponential fit is slightly lower than of the slow component. Nevertheless, we plotted the rate constant of the fast component as it represents the initial decay phase of the curve, allowing comparison with other rate constants (see Supplementary file 5). (c) Structure of wild-type KtrA octameric ring with bound ATP supplemented with 5 mM CaCl2. Subunits of the octameric ring are colored alternately blue and red. L1 and L2 correspond to the distances between the Cα of N38 residues located in opposite subunits across the ring. d) Calcium-binding site showing cation coordination. Calcium ion is shown as blue sphere. Residues and nucleotides coordinating calcium are shown as stick with coordination distances indicated. See also Figure 7—source data 1.
-
Figure 7—source data 1
Flux rate constants shown in Figure 7b.
- https://cdn.elifesciences.org/articles/50661/elife-50661-fig7-data1-v2.xlsx
Figure 8 with 1 supplement
Impact of choline on KtrAB flux.
(a and b) Proteoliposome flux assay performed with KtrB and wild type and mutant KtrAB with ATP or ADP with choline chloride (ChCl) in the external solution. Panels show representative fluorescence quenching curves. Empty liposomes were used as control. (c) Plot of flux rate constants for conditions shown in a) and b). Mean ± SD as well as individual flux rate constants (blue dots) are shown for n = 5–9 from at least two different proteoliposome preparations. Conditions correspond to 150 mM choline chloride external solution except where stated otherwise. See also Figure 8—figure supplement 1 and Figure 8—source data 1.
-
Figure 8—source data 1
Flux rate constants shown in Figure 8c.
- https://cdn.elifesciences.org/articles/50661/elife-50661-fig8-data1-v2.xlsx
Figure 8—figure supplement 1
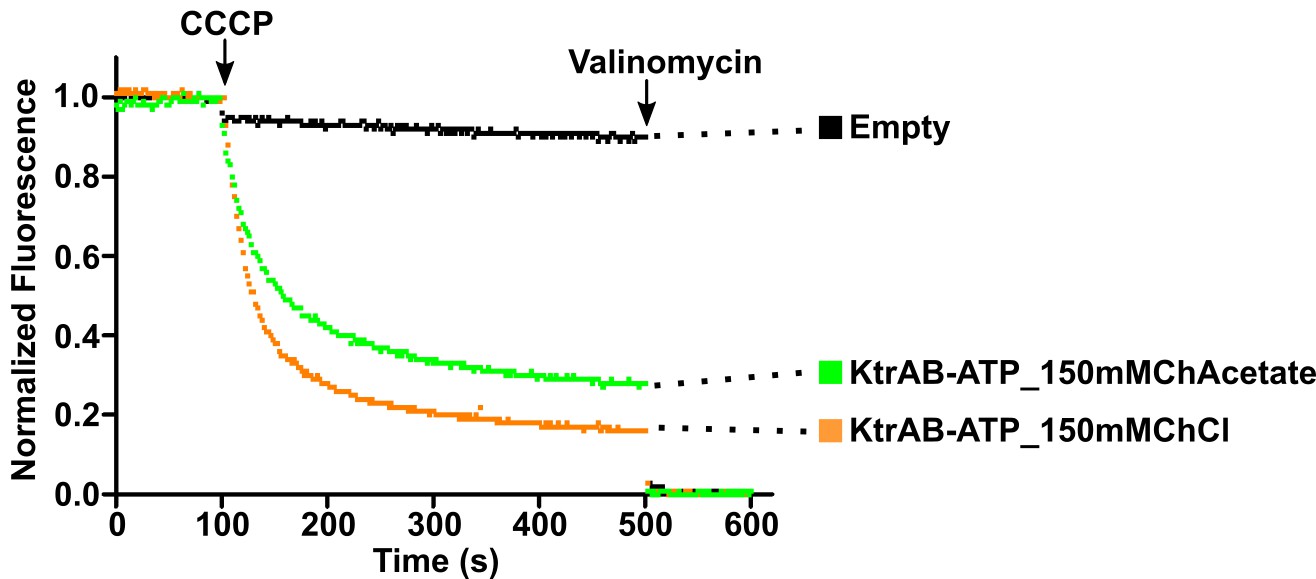
Impact of chloride ion on KtrAB activity.
KtrAB-ATP proteoliposome flux assays with choline chloride or choline acetate in the external solution. Representative fluorescence quenching curves obtained for each condition. Empty liposomes were used as controls.
Figure 9
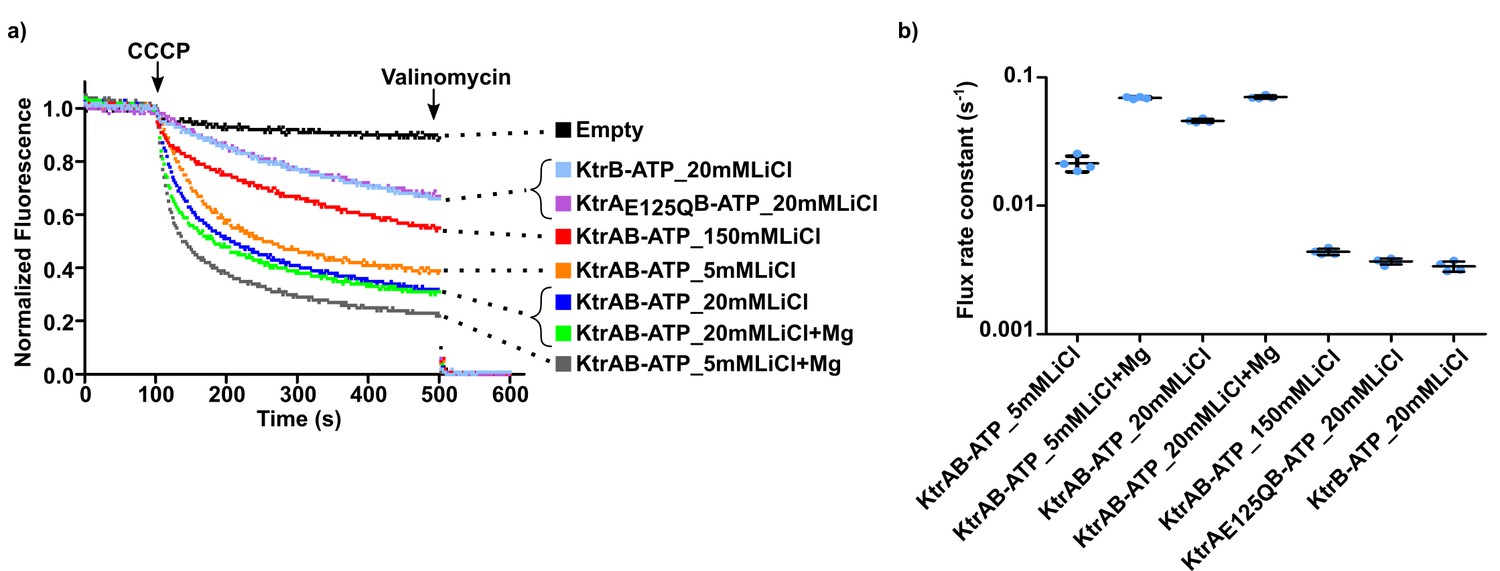
Impact of Li+ on KtrAB flux.
(a) Proteoliposome flux assay performed with KtrB and wild-type and mutant KtrAB with ATP with lithium chloride (LiCl) in the external solution. Osmolarity differences were partially compensated with inclusion of sorbitol in the solution. Panels shows representative fluorescence quenching curves. Empty liposomes were used as control. (b) Plot of flux rate constants for conditions shown in a). Mean ± SD as well as individual flux rate constants (blue dots) are shown for n = 4 from one proteoliposome preparation. For conditions in 20 mM Li+ (with and without Mg2+) and in 5 mM (Li+ (without Mg2+) the amplitude of the fast component of the double-phase exponential fit is either equal or smaller than of the slow component. However, we plot the ‘fast’ rate constant as it represents the initial decay phase of the curve, allowing comparison with other rate constants (see Supplementary file 5). See also Figure 9—source data 1.
-
Figure 9—source data 1
Flux rate constants shown in Figure 9b.
- https://cdn.elifesciences.org/articles/50661/elife-50661-fig9-data1-v2.xlsx
Figure 10 with 2 supplements
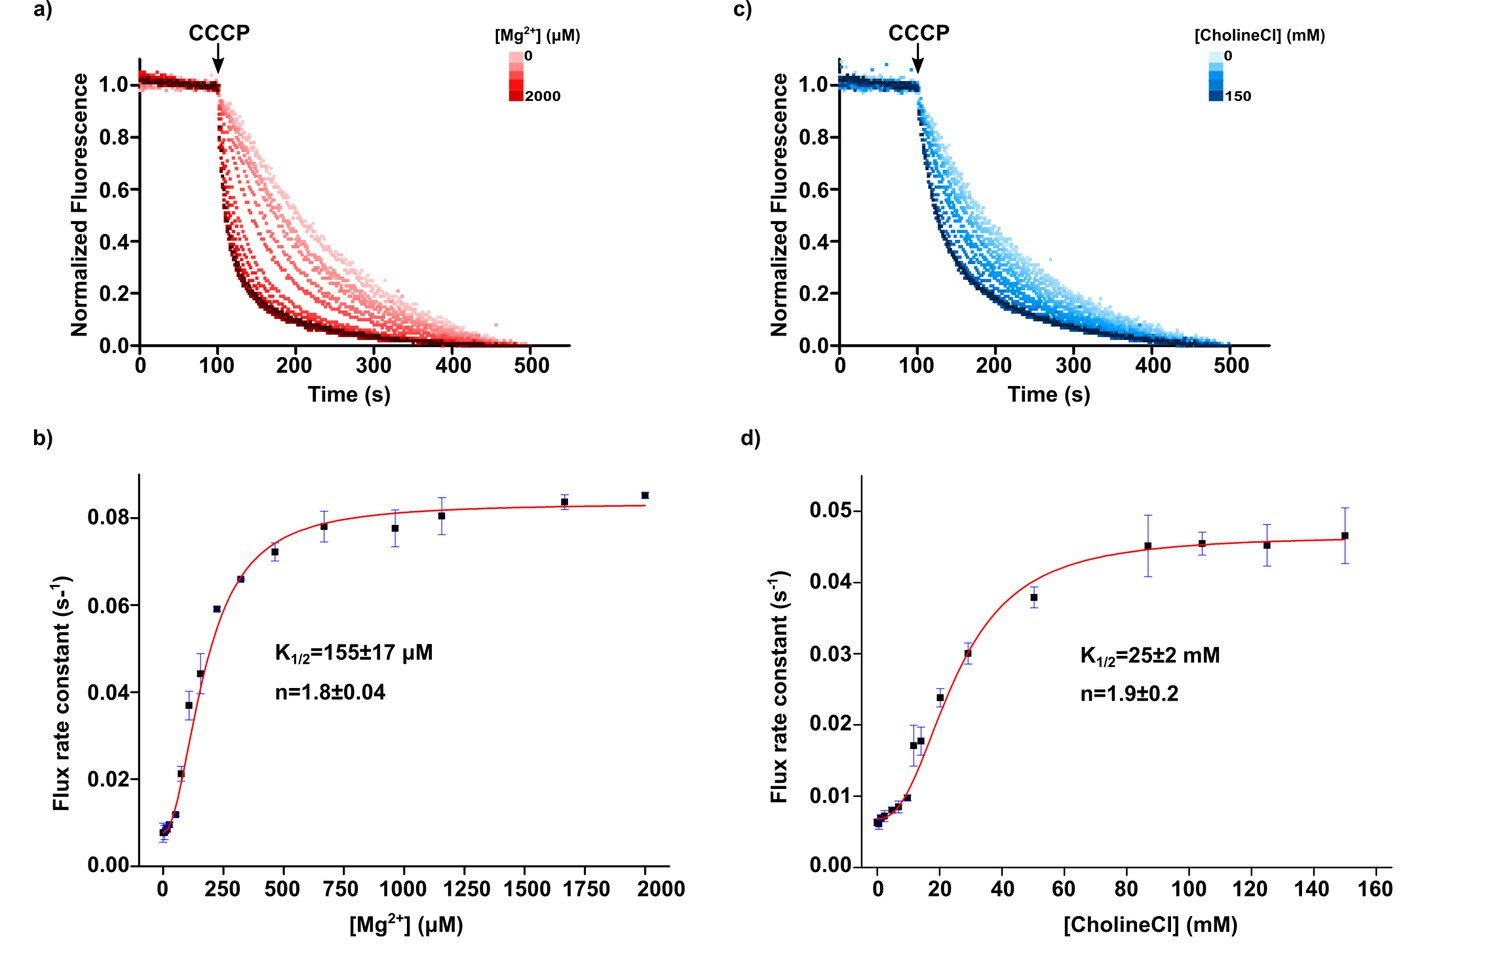
Mg2+ and Choline titrations.
(a) Magnesium ion titration of KtrAB-ATP using a proteoliposome flux assay performed with increasing amounts of MgCl2 added to a 300 mM sorbitol external solution. Panel shows representative fluorescence quenching titration curves normalized to their steady-state. Magnesium ion concentration increases with red color intensity from 0 to 2000 µM (b) Plot of flux rate constants (mean ± SD, from three separate titrations) as a function of magnesium ion concentration. (c) Choline titration of KtrAB-ATP using a proteoliposome flux assay performed with increasing amounts of choline chloride in the external solution while compensating the change in osmolarity with sorbitol. Panel shows representative fluorescence quenching titration curves normalized to their steady-state. Choline chloride concentration increases with blue color intensity from 0 to 150 mM (d) Plot of flux rate constants (mean ± SD, from three separate titrations) as a function of choline concentration. Titrations were fitted with a Hill equation, . Mean ± SD of K1/2 and of Hill coefficients (n) determined from fits to separate titrations are shown. EDTA was not added to the external solution in these assays. See also Figure 10—figure supplement 1 and Figure 10—figure supplement 2.
Figure 10—figure supplement 1
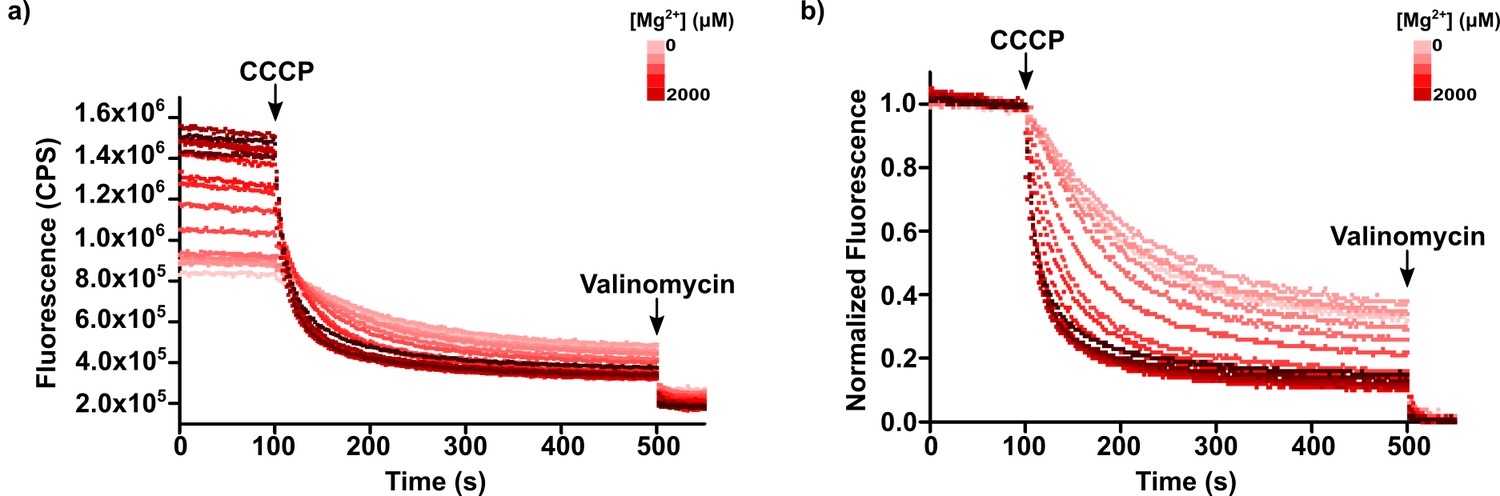
Fluorescence raw and normalized data from Mg2+ titration.
(a) Raw fluorescence data from representative titration. (b) Same data after normalization to valinomycin quenching. Magnesium ion concentration increases with red color intensity from 0 to 2000 µM. In many of the manuscript figures depicting flux assay experiments, the steady-state levels of fluorescence quenching curves are different from each other, as shown in b), when it would be expectable to have the same level. In most cases this resulted from the impact of the external solution conditions on the initial fluorescence value (before addition of CCCP), as shown in a), and from normalization using the fluorescence values after valinomycin addition, which change little across different experiments. We do not fully understand the reason for the differences in initial fluorescence but it appears that ACMA fluorescence is sensitive to the ionic strength of bathing solutions.
Figure 10—figure supplement 2
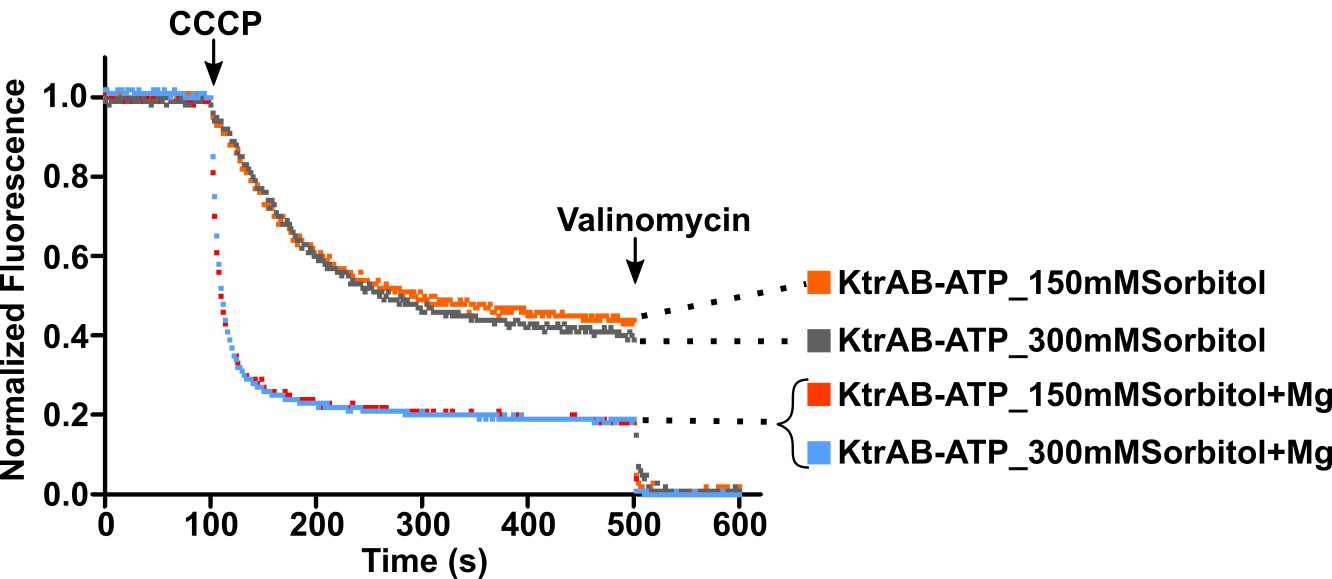
Effect of osmolarity in KtrAB flux.
KtrAB-ATP proteoliposome flux assays with sorbitol at 150 or 300 mM (matching the osmolarity of a 150 mM choline chloride solution) in the external solution, showing little impact of the osmolarity change on the function of KtrAB-ATP.
Figure 11 with 7 supplements
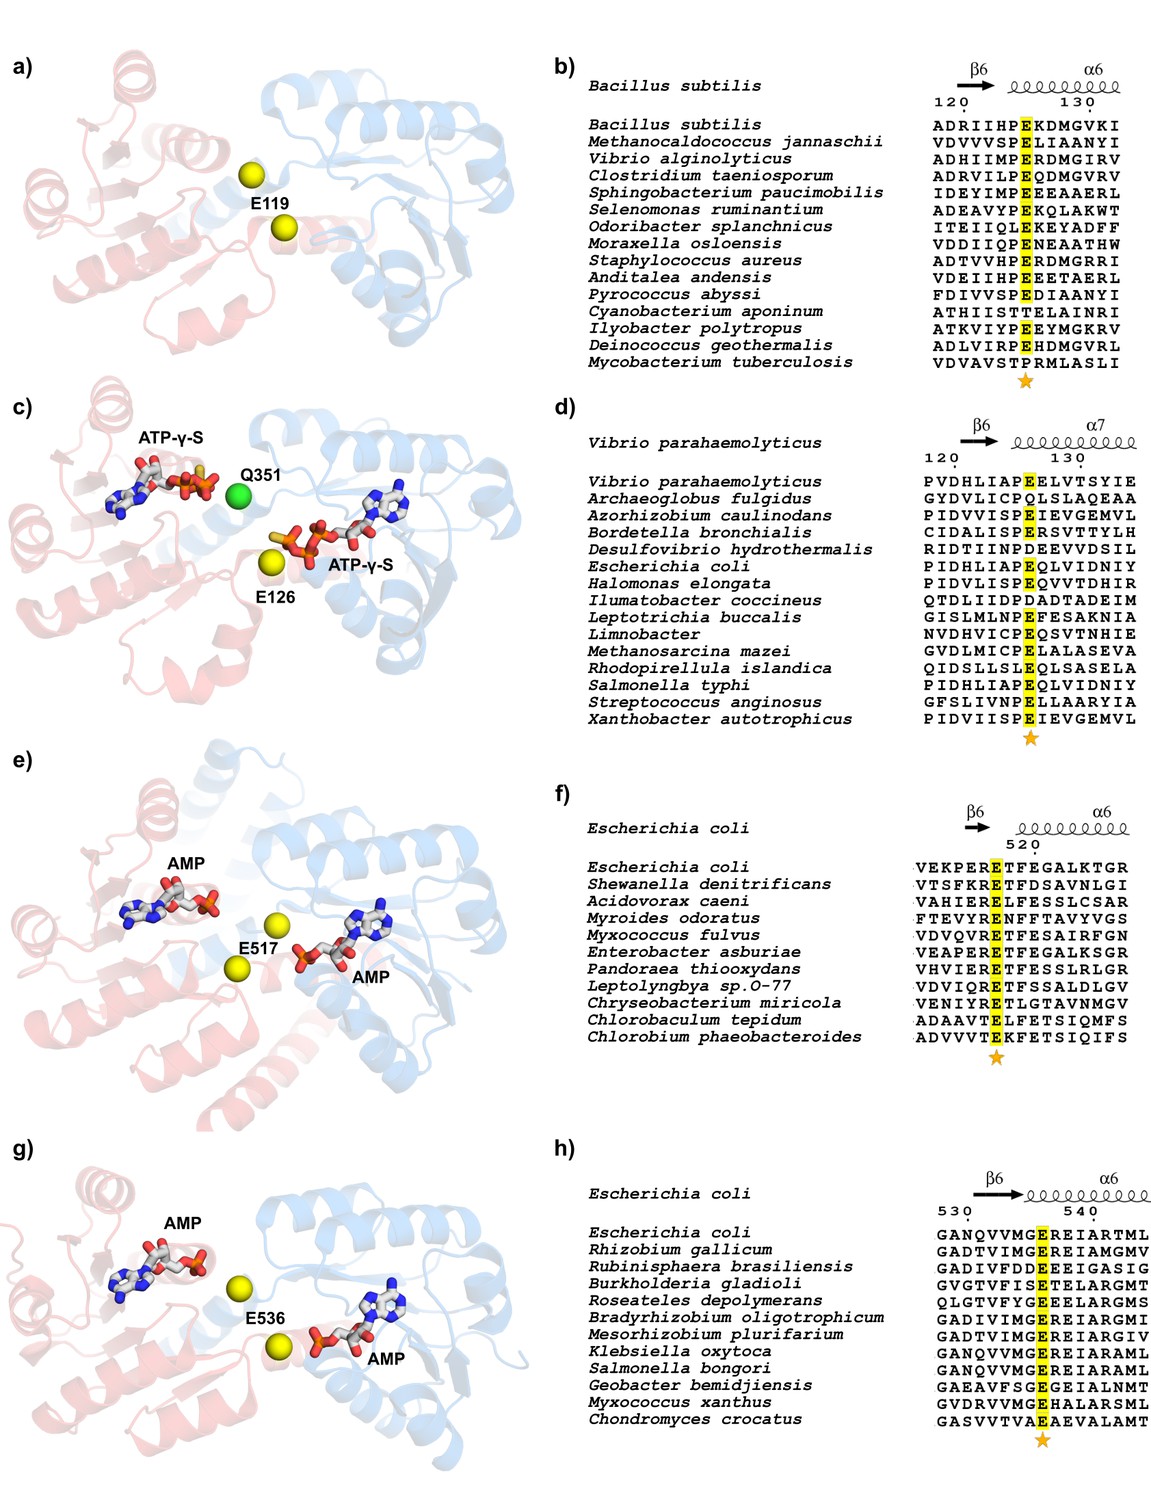
Conservation of glutamate residue in the intra-dimer interface of nucleotide-dependent RCK domains.
(a) View of nucleotide binding sites in M.jannaschii KtrA dimer (PDB:1LSS). (b) Partial view of sequence alignment of KtrA orthologs with conserved glutamate in yellow. Numbering and secondary structure elements are from B. subtilis KtrA. (c) View of nucleotide binding sites in V. parahaemolyticus TrkA pseudo-dimer (PDB:4J9V). The RCK2 glutamine in an equivalent position to KtrA E125 is shown as a green sphere. (d) Partial view of sequence alignment of TrkA orthologs with conserved glutamate in RCK1 in yellow. Numbering and secondary structure elements are from the V.parahaemolyticus TrkA. (e) View of nucleotide binding sites in E.coli KefC C-terminal dimer (PDB:3L9W). (f) Partial view of sequence alignment of Kef orthologs with conserved glutamate in yellow. Numbering and secondary structure elements are from the E.coli KefC C-terminal. (g) View of nucleotide binding sites in E.coli YbaL C-terminal dimer (PDB:3FWZ). (h) Partial view of sequence alignment of YbaL orthologs with conserved glutamate in yellow. Numbering and secondary structure elements are from the E.coli YbaL C-terminal. Dimer subunits are colored red and blue and conserved glutamates are shown as yellow spheres. Sequence alignments were obtained with MEGA software (Tamura et al., 2013) and figures made using ESPript (Robert and Gouet, 2014). In all alignments, the position corresponding to KtrA E125 or equivalent is marked with a star. See also Figure 11—figure supplement 1, Figure 11—figure supplement 2, Figure 11—figure supplement 3, Figure 11—figure supplement 4, Figure 11—figure supplement 5, Figure 11—figure supplement 6 and Figure 11—figure supplement 7.
Figure 11—figure supplement 1
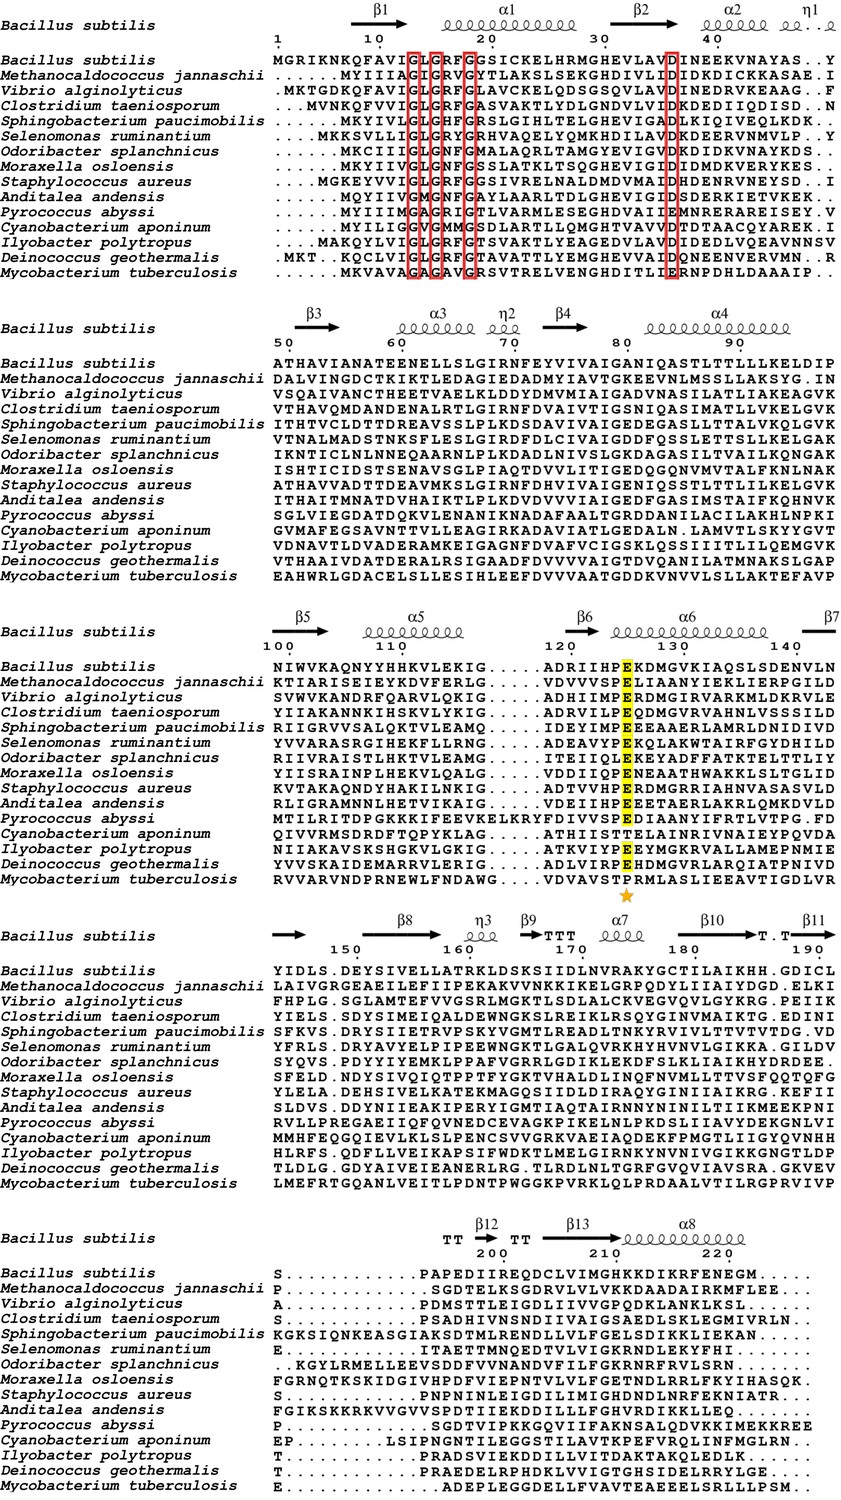
Sequence alignment of KtrA orthologs.
Numbering and secondary structure features are from the first protein in the alignment. The position corresponding to the KtrA E125 is marked with a star. Conserved glutamates are highlighted in yellow and nucleotide binding motif positions are boxed in red.
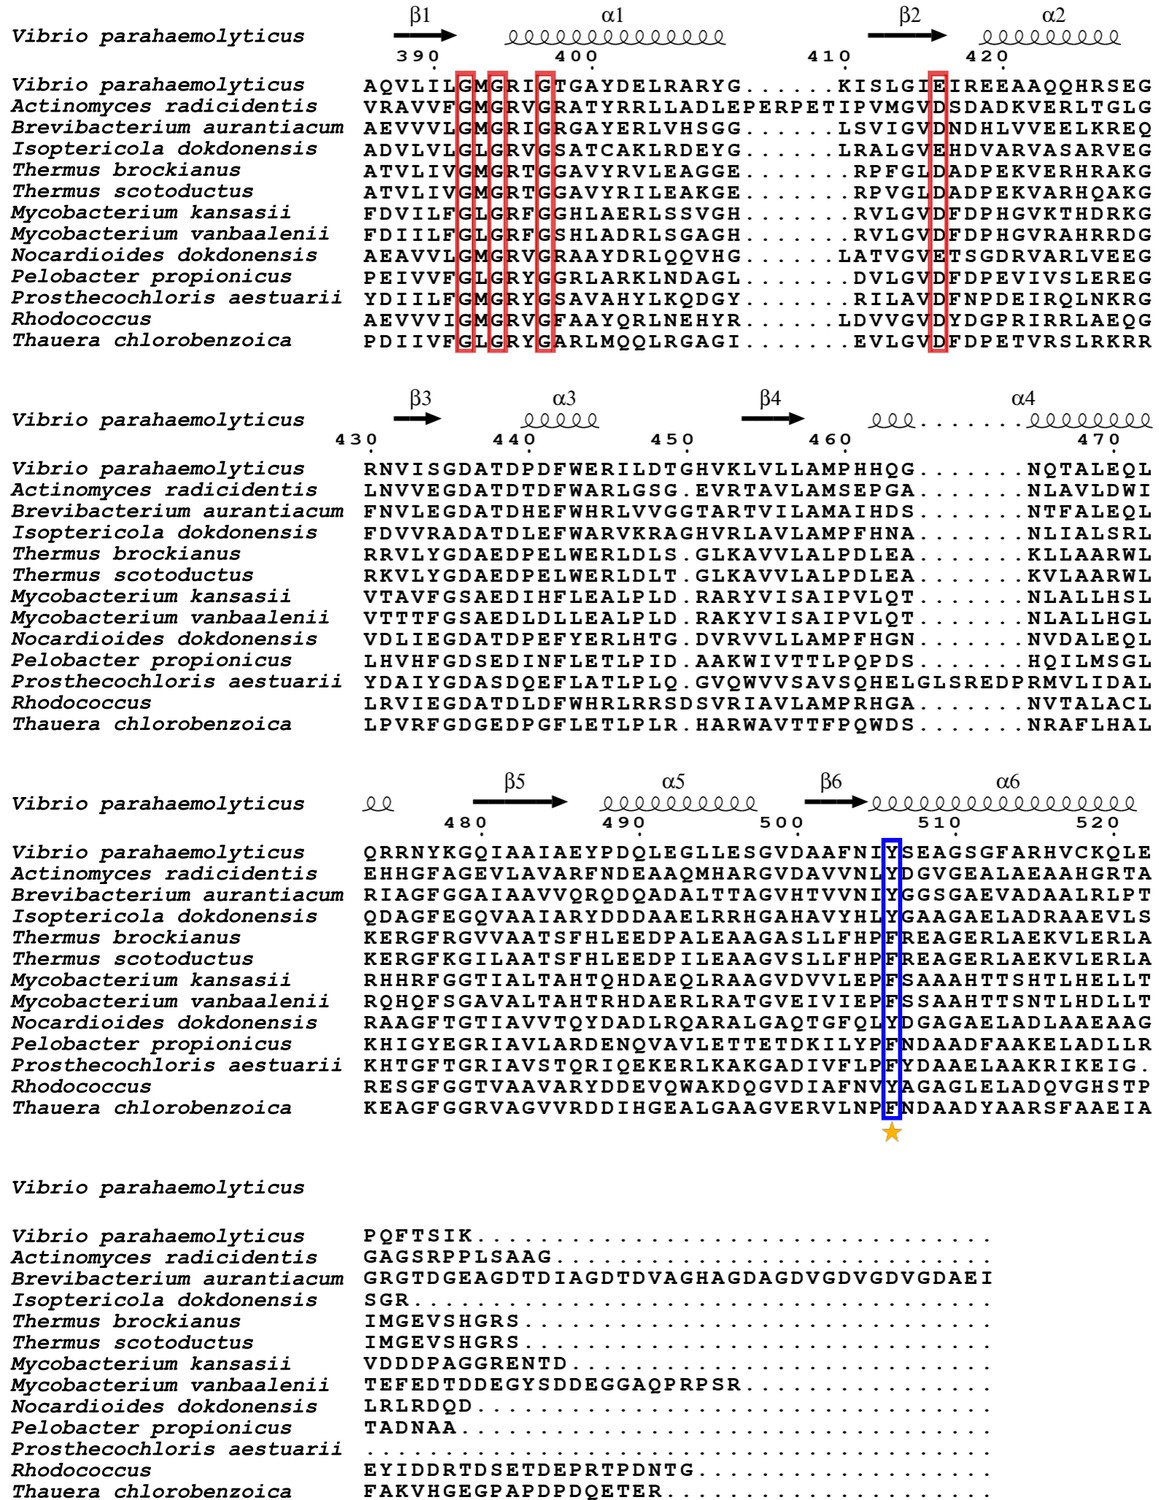
Figure 11—figure supplement 2
Sequence alignment of RCK1 domains from TrkA orthologs.
Numbering and secondary structure features are from the first protein in the alignment. The position corresponding to the equivalent of KtrA E125 is marked with a star. Conserved glutamates are highlighted in yellow and nucleotide binding motif positions are boxed in red.
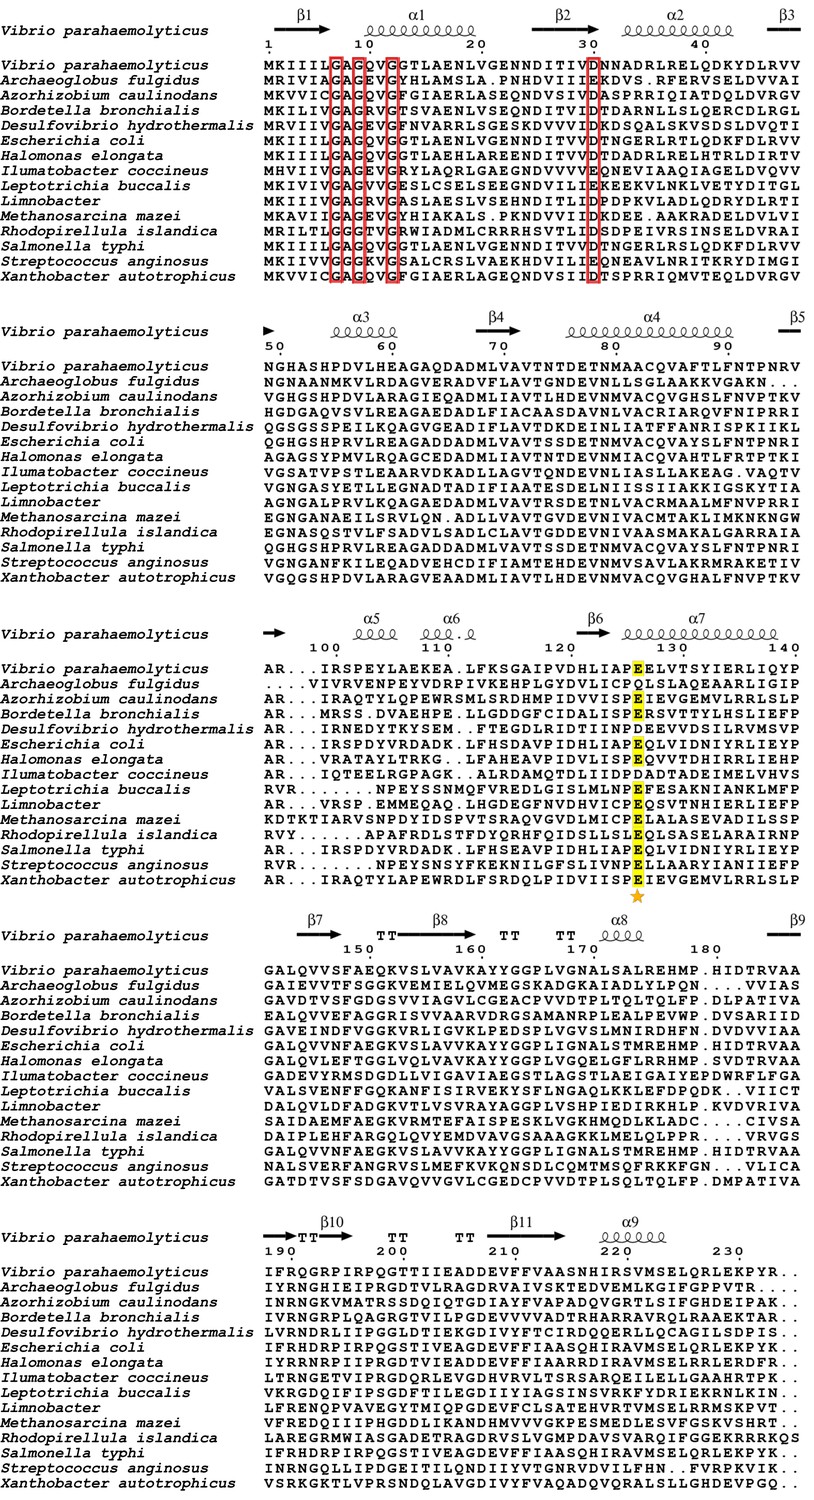
Figure 11—figure supplement 3
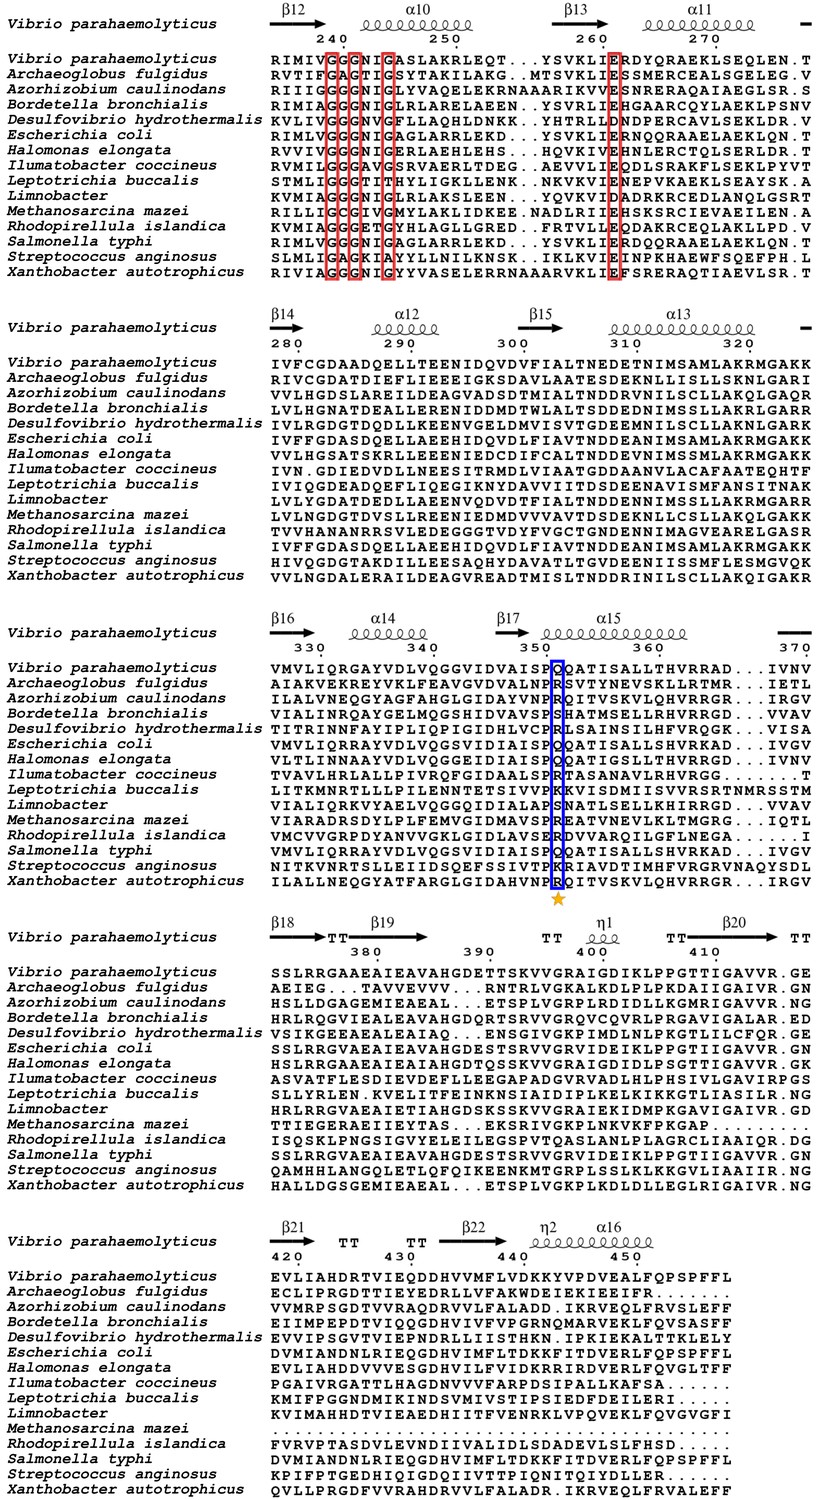
Sequence alignment of RCK2 domains from TrkA orthologs.
Numbering and secondary structure features are from the first protein in the alignment. The position corresponding to the equivalent of KtrA E125 is marked with a star. Positions without conserved glutamates are boxed in blue and nucleotide binding motif positions are boxed in red.
Figure 11—figure supplement 4
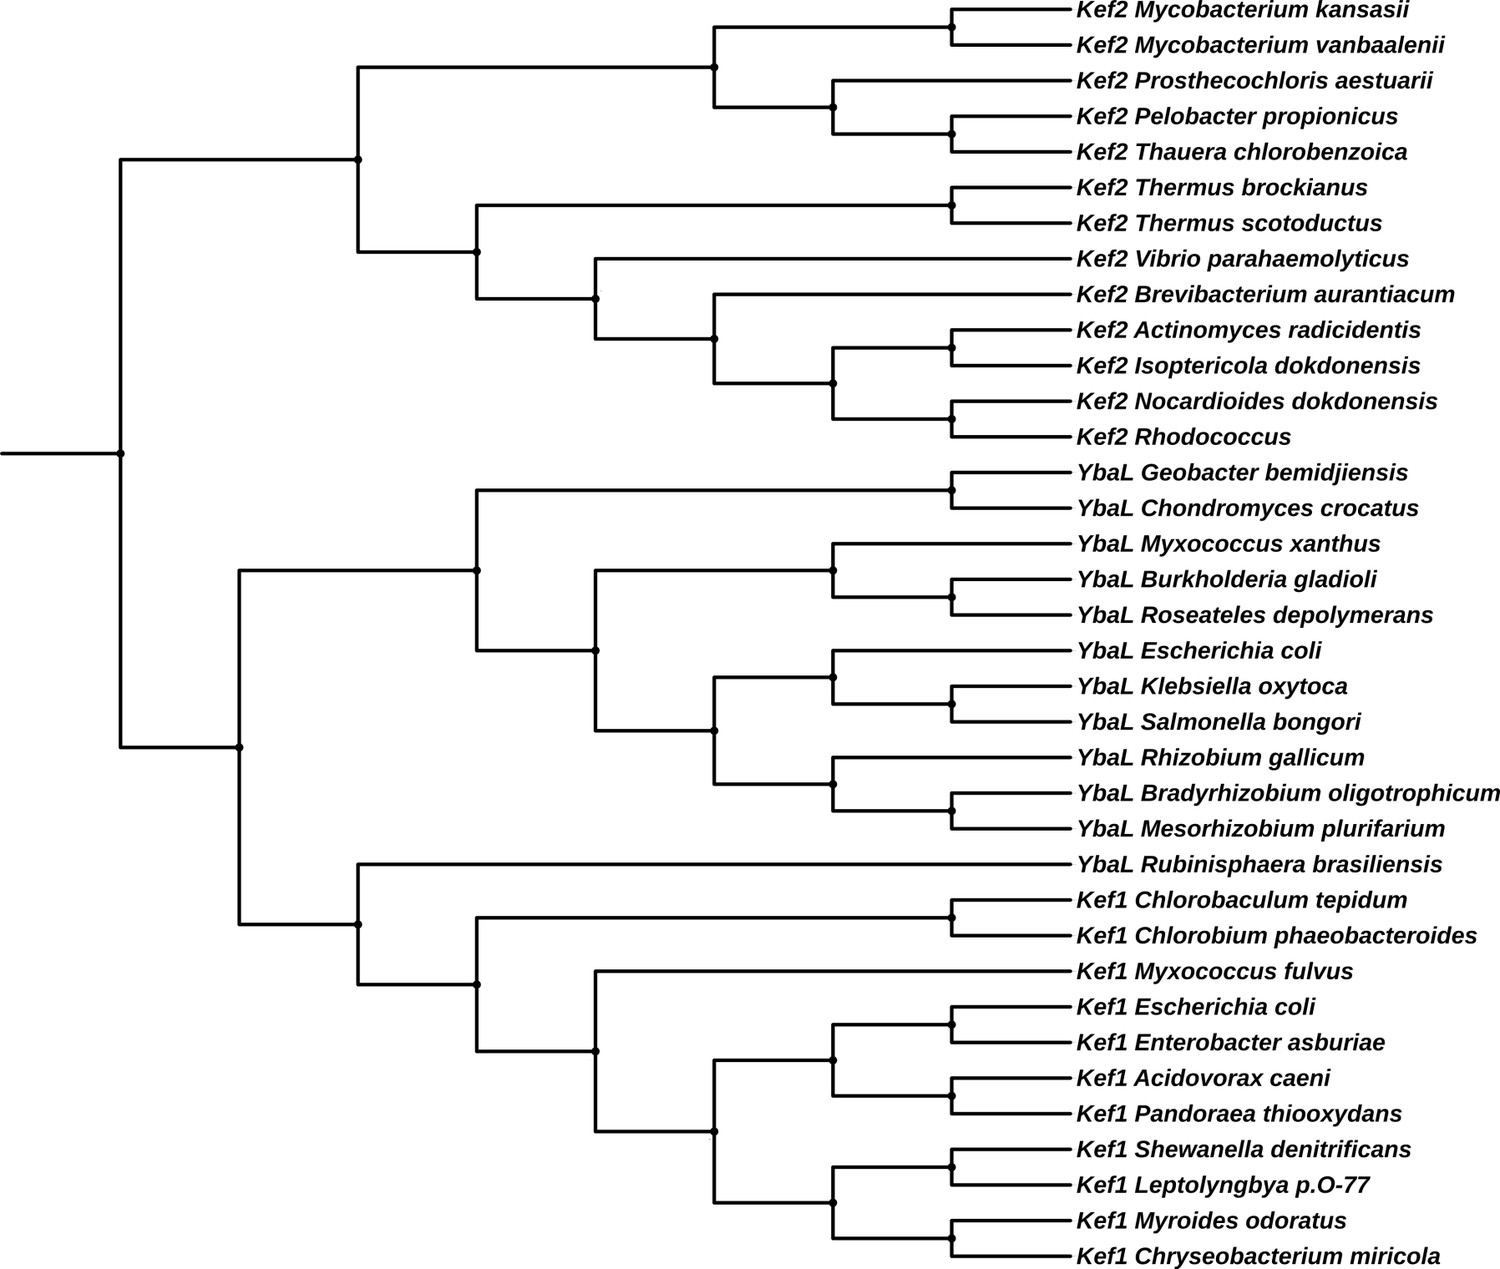
Phylogenetic tree of Kef-related proteins.
Maximum-likelihood tree of sequence alignment of Kef-related proteins. The tree reveals three groups: Kef1 corresponds to KefC proteins, with at least 580 amino acids; Kef2 corresponds to KefC-like proteins, with less than 580 amino acids; and YbaL orthologs. Tree was generated using MEGA software (Tamura et al., 2013).
Figure 11—figure supplement 5
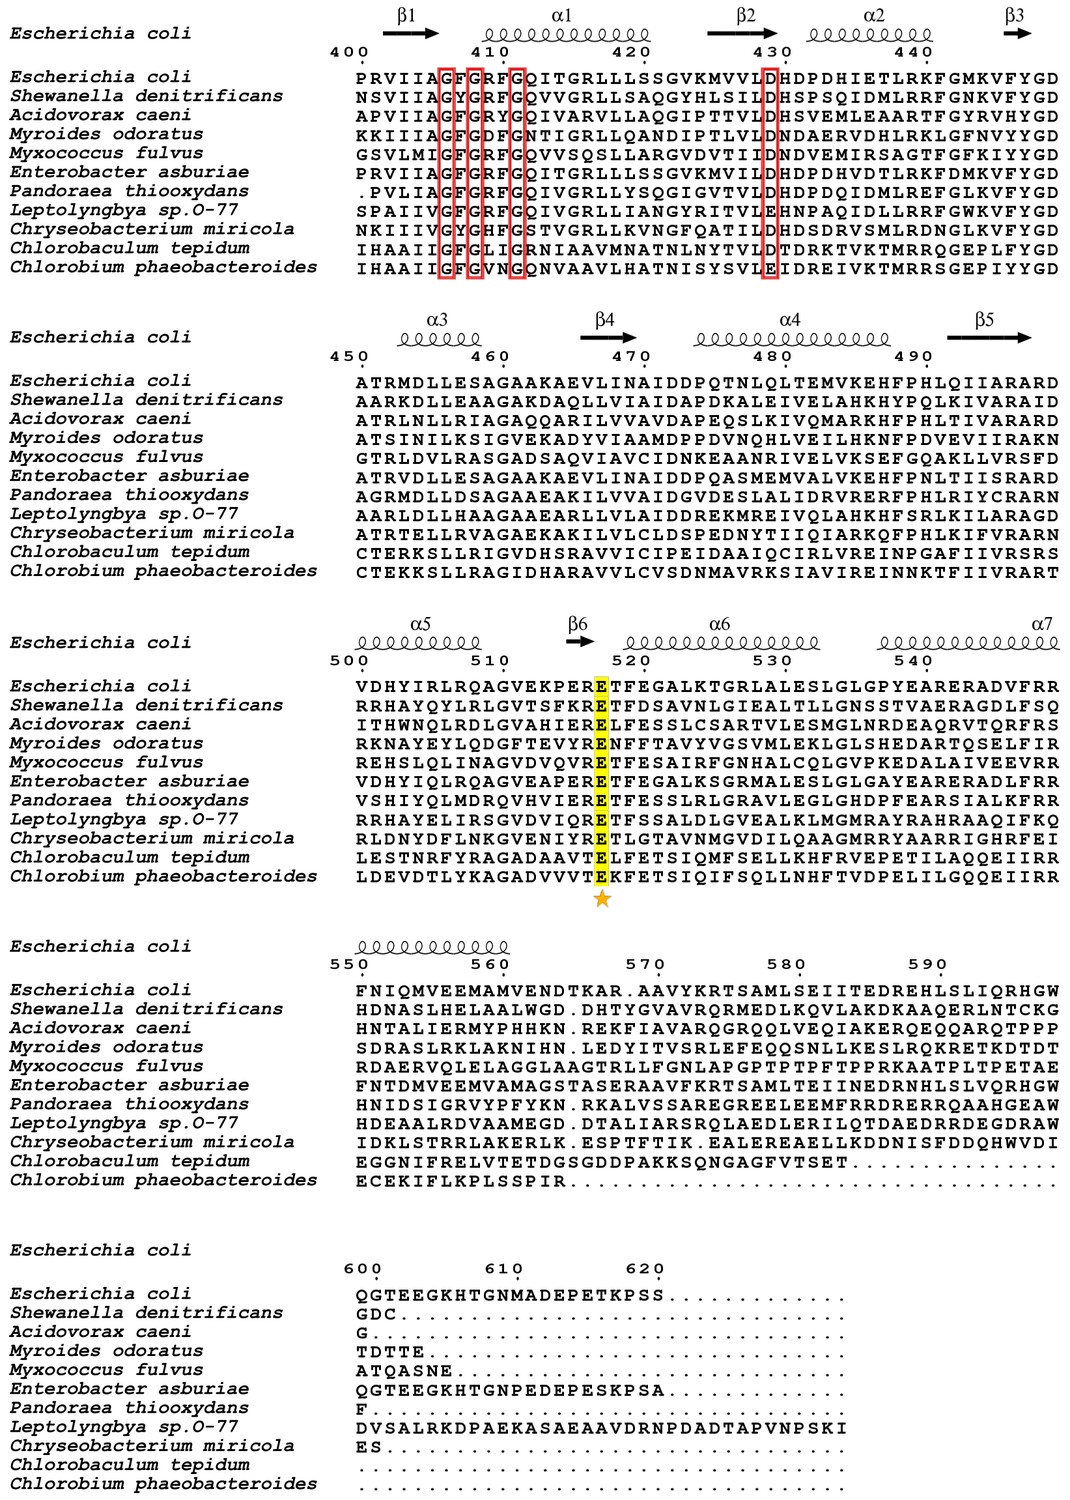
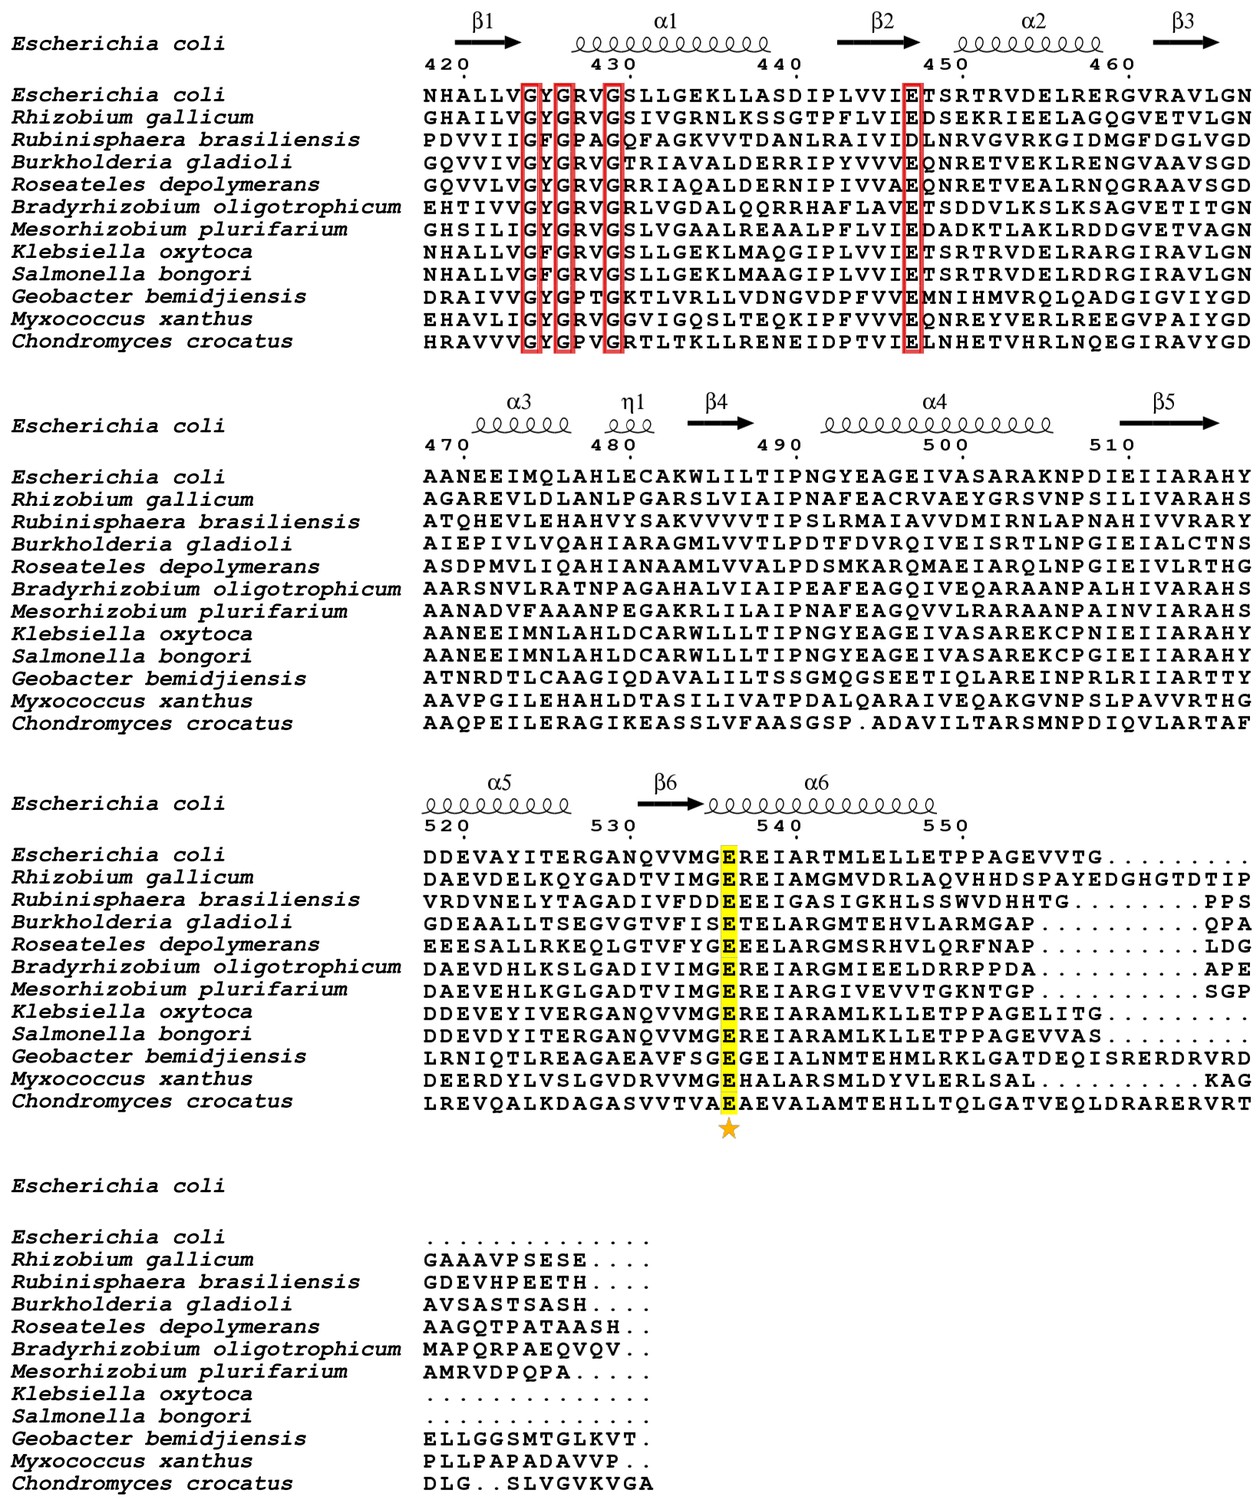
Sequence alignment of C-terminal domains from KefC orthologs.
Numbering and secondary structure features are from the first protein in the alignment. The position corresponding to the equivalent of KtrA E125 is marked with a star. Conserved glutamates are highlighted in yellow and nucleotide binding motif positions are boxed in red.
Figure 11—figure supplement 6
Sequence alignment of C-terminal domains from KefC-like orthologs.
Numbering and secondary structure features are from the first protein in the alignment. The position corresponding to the equivalent of KtrA E125 is marked with a star. Positions without conserved glutamates are boxed in blue and nucleotide binding motif positions are boxed in red.
Figure 11—figure supplement 7
Sequence alignment of C-terminal domains from YbaL orthologs.
Numbering and secondary structure features are from the first protein in the alignment. The position corresponding to the equivalent of KtrA E125 is marked with a star. Conserved glutamates are highlighted in yellow and nucleotide binding motif positions are boxed in red.
Tables
Table 1
Data collection and refinement statistics.
| Data collection statistics | ||||
|---|---|---|---|---|
| PDB ID | 6S2J | 6S5B | 6S5D | 6S7R |
| Crystal | R16K_ATP | R16K_ADP | R16A_ATP | R16A_ADP |
| Space group | I4 | P212121 | I4 | P1 |
| Unit-cell dimensions a, b, c (Å) α, β, γ (°) | 123.3, 123.3, 84.4 90, 90, 90 | 85.8, 137.4, 202.6 90, 90, 90 | 121.6, 121.6, 83.7 90, 90, 90 | 93.0, 97.9, 144.6 90.4, 97.1, 110.3 |
| Protomers in the asymmetric unit | 2 | 8 | 2 | 16 |
| Wavelength (Å) | 0.954240 | 0.979480 | 0.978570 | 0.978570 |
| Resolution (Å) | 46.16–2.67 (2.80–2.67) | 49.51–3.05 (3.16–3.05) | 45.60–3.39 (3.66–3.39) | 48.80–3.73 (3.86–3.73) |
| No. of reflections (measured/unique) | 85203/17872 | 383771/46032 | 76213/8535 | 161349/46426 |
| Multiplicity | 4.8 (4.5) | 8.3 (4.2) | 8.9 (8.5) | 3.5 (3.0) |
| Completeness (%) | 99.0 (96.5) | 99.2 (91.6) | 99.8 (99.0) | 94.0 (51.2) |
| Rmerge (all I) (%) | 5.5 (86.8) | 14.8 (47.4) | 4.7 (182.9) | 9.5 (96.6) |
| Rmeasure (all I) (%) | 6.2 (98.1) | 15.8 (53.8) | 5.0 (194.6) | 11.2 (116.0) |
| Mean I / σ(I) | 13.9 (1.7) | 15.9 (0.2) | 17.1 (1.3) | 7.4 (1.1) |
| CC1/2 | 0.999 (0.541) | 0.995 (0.886) | 1.000 (0.573) | 0.996 (0.494) |
| Refinement statistics | ||||
| Resolution range (Å) | 46.16–2.67 | 48.17–3.05 | 45.60–3.39 | 48.80–3.73 |
| Rwork/Rfree (%) | 18.96/23.57 | 20.93/24.29 | 23.83/27.90 | 24.57/30.04 |
| No. of reflections | 17870 | 46032 | 8535 | 46426 |
| Total No. of atoms | 6969 | 13784 | 3459 | 25028 |
| No. of waters | 2 | - | 2 | - |
| No. of ATP | 2 | - | 2 | - |
| No. of ADP | - | 8 | - | 16 |
| No. of Mg | 1 | - | 1 | - |
| Wilson B factor(Å2) | 90.2 | 97.4 | 194.2 | 152.9 |
| r.m.s.d. bond lengths (Å) | 0.013 | 0.003 | 0.003 | 0.003 |
| r.m.s.d. bond angles (°) | 1.086 | 0.760 | 0.745 | 0.824 |
| Ramachandran plot | ||||
| Residues in favored/allowed regions (%) | 98/2 | 99/1 | 97/3 | 98/2 |
| Data collection statistics | ||||
| Crystal | E125Q_ATP | E125Q_ADP | A80P_ATP | A80P_ADP |
| PDB ID | 6S5N | 6S5O | 6S5E | 6S5G |
| Space group | C2221 | C2221 | P212121 | P212121 |
| Unit-cell dimensions a, b, c (Å) α, β, γ (°) | 109.1, 156.5, 286.4 90, 90, 90 | 108.2, 155.2, 285.9 90, 90, 90 | 85.7, 133.9, 205.1 90, 90, 90 | 85.3, 132.9, 203.3 90, 90, 90 |
| Protomers in the asymmetric unit | 8 | 8 | 8 | 8 |
| Wavelength (Å) | 0.978570 | 0.978570 | 0.978570 | 0.978570 |
| Resolution (Å) | 48.24–4.09 (4.48–4.09) | 48.07–3.98 (4.36–3.98) | 49.63–3.89 (4.20–3.89) | 49.28–4.33 (4.84–4.33) |
| No. of reflections (measured/unique) | 131430/19704 | 274868/20970 | 146620/22230 | 100662/14674 |
| Multiplicity | 6.7 (6.8) | 13.1 (13.0) | 6.6 (6.6) | 6.9 (4.7) |
| Completeness (%) | 99.5 (98.3) | 99.4 (97.9) | 99.5 (98.0) | 91.9 (79.1) |
| Rmerge (all I) (%) | 12.7 (113.5) | 11.2 (132.6) | 8.1 (133.9) | 19.1 (56.8) |
| Rmeasure (all I) (%) | 13.7 (122.9) | 11.7 (138.1) | 8.8 (145.4) | 20.5 (62.9) |
| Mean I / σ(I) | 9.5 (1.7) | 12.0 (1.9) | 10.3 (1.3) | 7.9 (2.6) |
| CC1/2 | 0.999 (0.835) | 0.999 (0.771) | 0.999 (0.830) | 0.995 (0.873) |
| Refinement statistics | ||||
| Resolution range (Å) | 48.24–4.09 | 47.66–3.98 | 47.88–3.89 | 49.28–4.33 |
| Rwork/Rfree (%) | 27.91/31.99 | 24.96/28.62 | 26.02/31.72 | 25.37/31.43 |
| No. of reflections | 19704 | 20970 | 22230 | 14674 |
| Total No. of atoms | 12594 | 12426 | 13912 | 13744 |
| No. of waters | - | - | - | - |
| No. of ATP | 8 | - | 8 | - |
| No. of ADP | - | 8 | - | 8 |
| No. of Mg | - | - | - | - |
| Wilson B factor(Å2) | 183.9 | 201.8 | 188.6 | 135.7 |
| r.m.s.d. bond lengths (Å) | 0.003 | 0.003 | 0.003 | 0.003 |
| r.m.s.d. bond angles (°) | 0.804 | 0.791 | 0.883 | 0.729 |
| Ramachandran plot | ||||
| Residues in favored/allowed regions (%) | 98/2 | 97/3 | 98/2 | 97/3 |
| Data collection statistics | ||||
| Crystal | WT_ATP_Ca | |||
| PDB ID | 6S5C | |||
| Space group | I4 | |||
| Unit-cell dimensions a, b, c (Å) α, β, γ (°) | 122.7, 122.7, 84.0 90, 90, 90 | |||
| Protomers in the asymmetric unit | 2 | |||
| Wavelength (Å) | 0.978570 | |||
| Resolution (Å) | 45.94–3.00 (3.18–3.00) | |||
| No. of reflections (measured/unique) | 123606/12614 | |||
| Multiplicity | 9.8 (9.8) | |||
| Completeness (%) | 99.8 (98.9) | |||
| Rmerge (all I) (%) | 4.3 (141.8) | |||
| Rmeasure (all I) (%) | 4.6 (149.6) | |||
| Mean I / σ(I) | 24.5 (1.6) | |||
| CC1/2 | 0.999 (0.658) | |||
| Refinement statistics | ||||
| Resolution range (Å) | 37.81–3.00 | |||
| Rwork/Rfree (%) | 20.70/25.88 | |||
| No. of reflections | 12614 | |||
| Total No. of atoms | 3475 | |||
| No. of waters | - | |||
| No. of ATP | 2 | |||
| No. of ADP | - | |||
| No. of Ca | 1 | |||
| Wilson B factor(Å2) | 135.1 | |||
| r.m.s.d. bond lengths (Å) | 0.004 | |||
| r.m.s.d. bond angles (°) | 0.697 | |||
| Ramachandran plot | ||||
| Residues in favored/allowed regions (%) | 98/2 | |||
-
Rmsd: root-mean-square deviation; values in parenthesis correspond to the highest resolution shell.
Key resources table
| Reagent type (species) or resource | Designation | Source or reference | Identifiers | Additional information |
|---|---|---|---|---|
| Strain, strain background (Escherichia coli) | TK2420 | other | Δ(kdpFAB)5 Δ(trkA-mscL’) trkD1 | |
| Software, algorithm | XDS | doi: 10.1107/S0907444909047337 | RRID:SCR_015652 | http://xds.mpimf-heidelberg.mpg.de |
| Software, algorithm | Aimless | doi: 10.1107/S0907444910045749 | RRID: SCR_015747 | http://www.ccp4.ac.uk/html/aimless.html |
| Software, algorithm | Phaser | doi: 10.1107/S0021889807021206 | RRID: SCR_014219 | https://www.phenix-online.org/documentation/reference/phaser.html |
| Software, algorithm | Coot | doi: 10.1107/S0907444910007493 | RRID: SCR_014222 | https://www2.mrc-lmb.cam.ac.uk/personal/pemsley/coot/ |
| Software, algorithm | Phenix | doi: 10.1107/S0907444909052925 | RRID: SCR_014224 | http://phenix-online.org/ |
| Software, algorithm | Pymol | PyMOL Molecular Graphics System, Schrödinger, LLC | RRID: SCR_000305 | http://www.pymol.org/ |
| Software, algorithm | GraphPad Prism | GraphPad Software | RRID: SCR_015807 | https://www.graphpad.com |
| Software, algorithm | Origin | OriginLab | RRID: SCR_014212 | https://www.originlab.com/index.aspx?go=PRODUCTS/Origin |
| Software, algorithm | MEGA software | doi: 10.1093/molbev/mst197 | RRID: SCR_000667 | https://www.megasoftware.net |
| Software, algorithm | ESPript | doi: 10.1093/nar/gku316 | RRID: SCR_006587 | http://espript.ibcp.fr/ESPript/ESPript/ |
| Chemical compound, drug | ACMA | Sigma-Aldrich | Cat#: A5806 | |
| Chemical compound, drug | CCCP | Sigma-Aldrich | Cat#: 21855 | |
| Chemical compound, drug | Valinomycin | Sigma-Aldrich | Cat#: V0627 | |
| Chemical compound, drug | Choline Chloride | Sigma-Aldrich | Cat#: C7017 | |
| Chemical compound, drug | Sorbitol | Sigma-Aldrich | Cat#: S1876 | |
| Chemical compound, drug | N-Methyl-D-glucamine (NMG) | Sigma-Aldrich | Cat#: 66930 | |
| Chemical compound, drug | E. coli Polar Lipid Extract | Avanti Polar Lipids | Cat#: 100600C CAS Number: 1240502-50-4 | |
| Chemical compound, drug | Bio-Beads SM-2 Adsorbents | Bio-Rad | Cat#: 1523920 |
Additional files
-
Supplementary file 1
PDB structures of prokaryotic proteins containing RCK domains.
- https://cdn.elifesciences.org/articles/50661/elife-50661-supp1-v2.docx
-
Supplementary file 2
Cα D36-D36 intra-dimer distances in KtrA octameric rings.
$ R16A-ADP, E125Q-ATP and E125Q-ADP have two different octameric rings in the crystal, indicated by (1) or (2).
- https://cdn.elifesciences.org/articles/50661/elife-50661-supp2-v2.docx
-
Supplementary file 3
Cα N38 distances (L1/L2) in KtrA octameric rings.
*Distances measured on the two faces of the ring are slightly different and we have named the front face as the one with the larger individual distance value. Values mentioned in the main text correspond to front face. # Non-square conformations were clustered in four groups according to L1/L2. $ R16A-ADP, E125Q-ATP and E125Q-ADP have two different octameric rings in the crystal, indicated by (1) or (2).
- https://cdn.elifesciences.org/articles/50661/elife-50661-supp3-v2.docx
-
Supplementary file 4
B factors of divalent cation and coordinating atoms in R16K-ATP and WT-ATP KtrA structures after refinement with magnesium or calcium.
- https://cdn.elifesciences.org/articles/50661/elife-50661-supp4-v2.docx
-
Supplementary file 5
Parameters extracted from fits of fluorescence quenching curves with one-phase (τ) or two-phase exponential equations (τfast and τslow).
Values shown are the mean ± SD values calculated from parameters from individual fits. Rate constants referred to in the main-text and figures were calculated as the mean of the inverse of τ extracted from individual fits. * For KtrAE125QB-ATP in 150 mM sorbitol the plateau had to be fixed during fitting since the signal is closer to a linear decay.
- https://cdn.elifesciences.org/articles/50661/elife-50661-supp5-v2.docx
-
Transparent reporting form
- https://cdn.elifesciences.org/articles/50661/elife-50661-transrepform-v2.docx
Download links
A two-part list of links to download the article, or parts of the article, in various formats.
Downloads (link to download the article as PDF)
Open citations (links to open the citations from this article in various online reference manager services)
Cite this article (links to download the citations from this article in formats compatible with various reference manager tools)
Activation of a nucleotide-dependent RCK domain requires binding of a cation cofactor to a conserved site
eLife 8:e50661.
https://doi.org/10.7554/eLife.50661


