Lactate-mediated epigenetic reprogramming regulates formation of human pancreatic cancer-associated fibroblasts
- Albert Einstein College of Medicine, Montefiore Medical Center, United States
- University of Michigan, United States
- Rutgers University, United States
- UT MD Anderson Cancer Center, United States
- Cleveland Clinic, United States
- University of Nebraska Medical Center, United States
- Johns Hopkins, United States
- GenomeRxUs LLC, United States
Figures
Figure 1

Widespread epigenetic and transcriptomic alterations are seen in pancreatic cancer associated fibroblasts.
(A) Unsupervised clustering of cytosine methylation profiles from seven primary patient-derived pancreatic cancer associated fibroblasts (CAFs) and four healthy controls (Hst: Hepatic stellate cells, Hdf: Human dermal fibroblasts, Hsf: Human skin fibroblasts) shows that CAFs are epigenetically distinct (B) Volcano plot shows that majority of differentially methylated loci in primary patient-derived CAFs are hypomethylated when compared to controls (C) Unsupervised clustering of gene expression profiles shows transcriptomic differences between CAFs and controls (D) Three independent MSCs were exposed to PANC-1 conditioned media (CM) for 21 days and analyzed for α-SMA (ACTA1) and Fibroblast activation protein (FAP) expression. (T-test, p<0.05). (E) Unsupervised clustering based on cytosine methylation shows epigenomic differences between MSCs and de novo generated CAFs. Two independent experiments shown. (F) Volcano plot shows that the majority of differentially methylated loci in in vitro generated CAFs are hypomethylated (G) The differentially methylated regions in de novo generated CAFs are distributed throughout the genome as shown in the circos plot. H:Differentially methylated regions between MSC and de novo generated CAFs are present throughout the genome and mirror the distribution of HpaII sites in the genome. Hypo refers to Hypomethylated DMRs in CAFs. Hyper refers to Hypermethylated DMRs in CAFs when compared to MSCs. Genome refers to distribution of HpaII loci in the genome.
Figure 2 with 1 supplement

CXCR4 is demethylated and overexpresed in CAFs and increases pancreatic cancer invasiveness.
(A) A set of 120 transcripts are commonly hypomethylated in primary patient-derived CAFs and de novo generated CAFs and includes CXCR4. (B,C) The CXCR4 promoter is demethylated in primary patient-derived CAFs as seen by the HELP assay (B) and quantitative MassArray Epityper analysis (C). (D - F) CXCR4 knockdown in de novo CAFs leads to abrogation of the increased invasion of Panc1 cells on co-culture. (N = 3, p value<0.05) (G) Co-culture with de novo CAFs leads to increased transwell invasion by Panc-1 cells, that is abrogated after treatment of CAFs with CXCR4 inhibitor AMD-3100 (N = 3, p value<0.05) H: Gene expression profiling of CAFs with CXCR4 knockdown reveals signficantly downregulated (left panel) and upregulated (right panel) transcripts. Salient examples of downregulated transcripts include interleukins IL-8 and IL-33 and the chemokine CCL2.
Figure 2—figure supplement 1
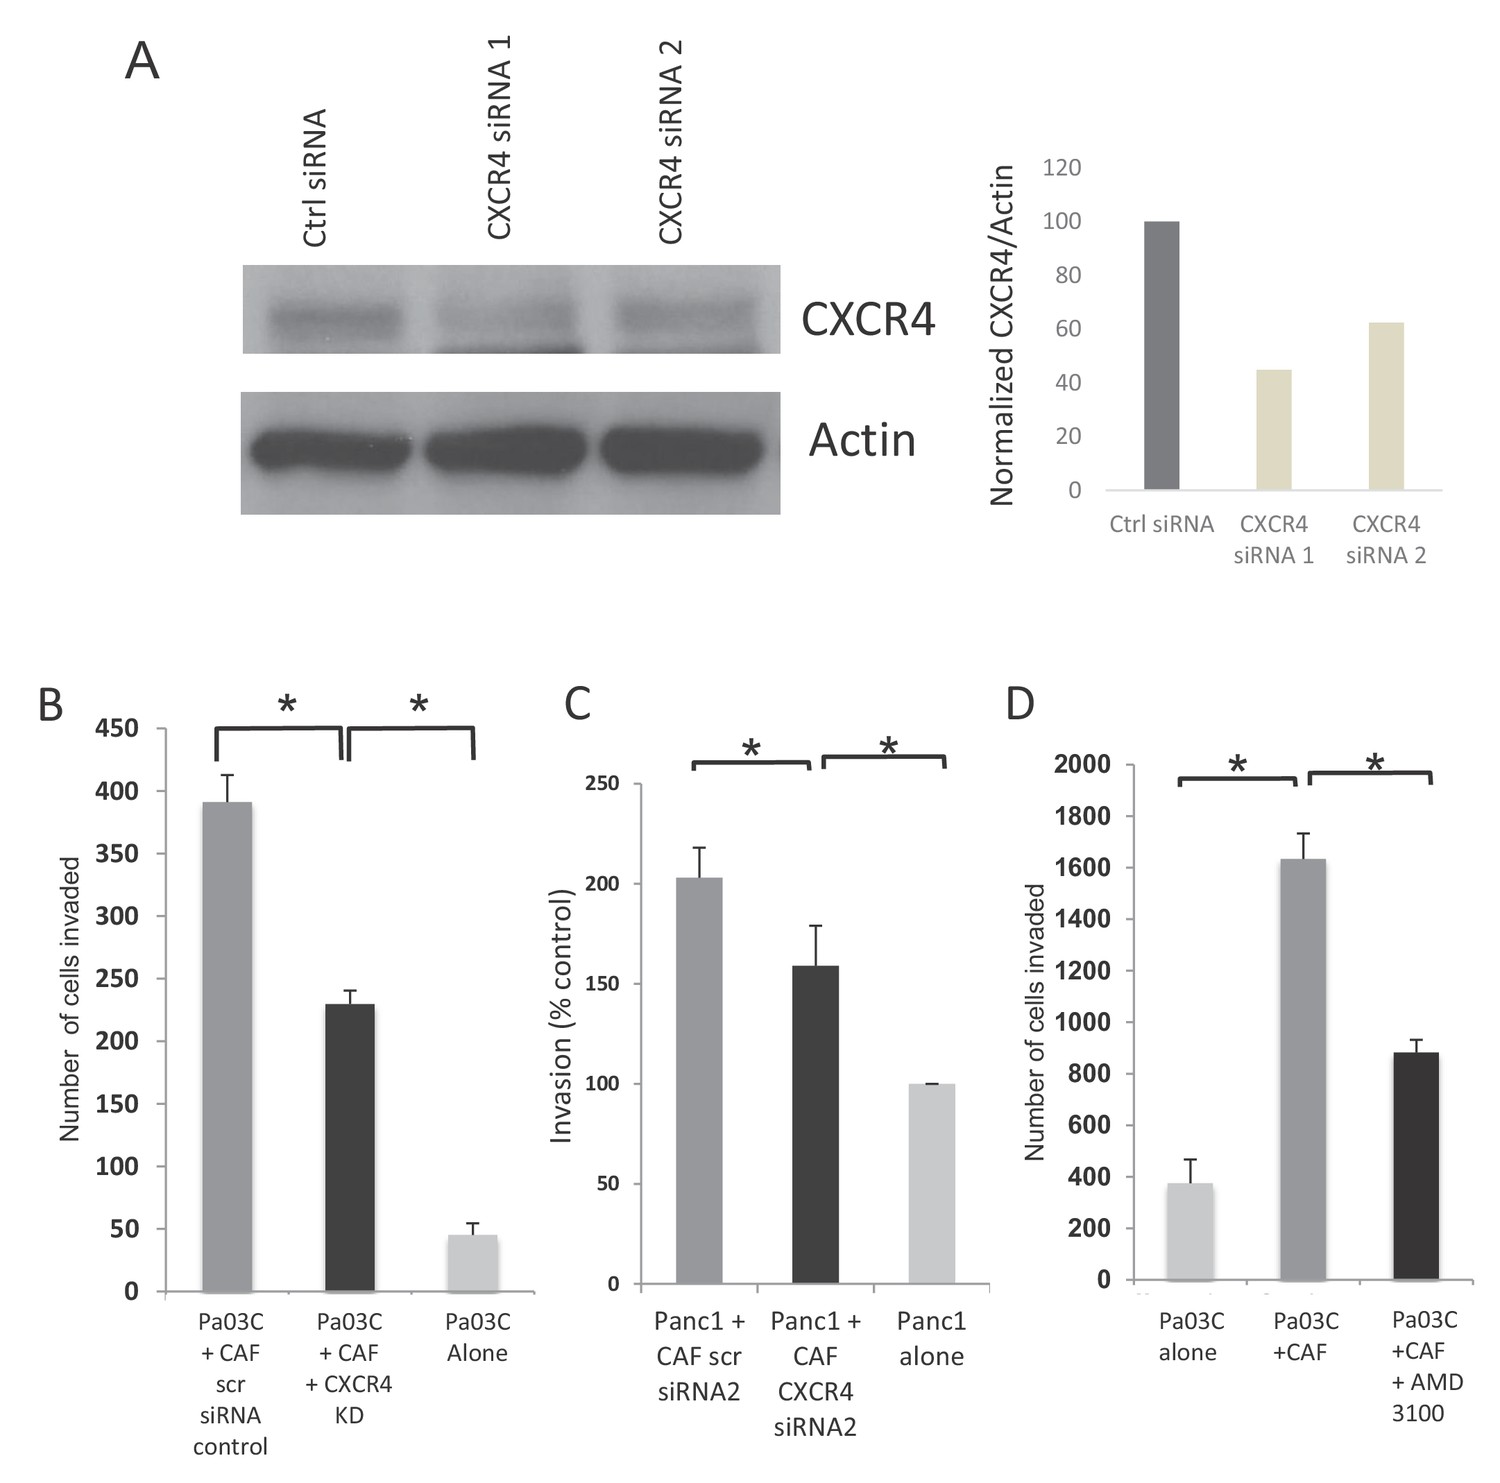
Inhibition of CXCR4 reduces PDAC cell invasion in de novo generated CAFs.
(A) CXCR4 siRNAs lead to knockdown of protein in CAFs when compared to control siRNAs. Western blot and image intensity is shown. (B) CXCR4 knockdown in dn-CAFs leads to abrogation of the increased invasion of Pa03C PDAC cells obseerved on co-culture. (N = 3, p value<0.05) (C) CXCR4 knockdown using a second set of siRNAs in dn-CAFs leads to abrogation of the increased invasion of Panc1 PDAC cells observed on co-culture. (N = 3, p value<0.05) (D) Co-culture with dn-CAFs leads to increased transwell invasion by Pa03C PDAC cells, which is abrogated after treatment of dn-CAFs with CXCR4 inhibitor AMD-3100 (N = 3, p value<0.05).
Figure 3 with 2 supplements
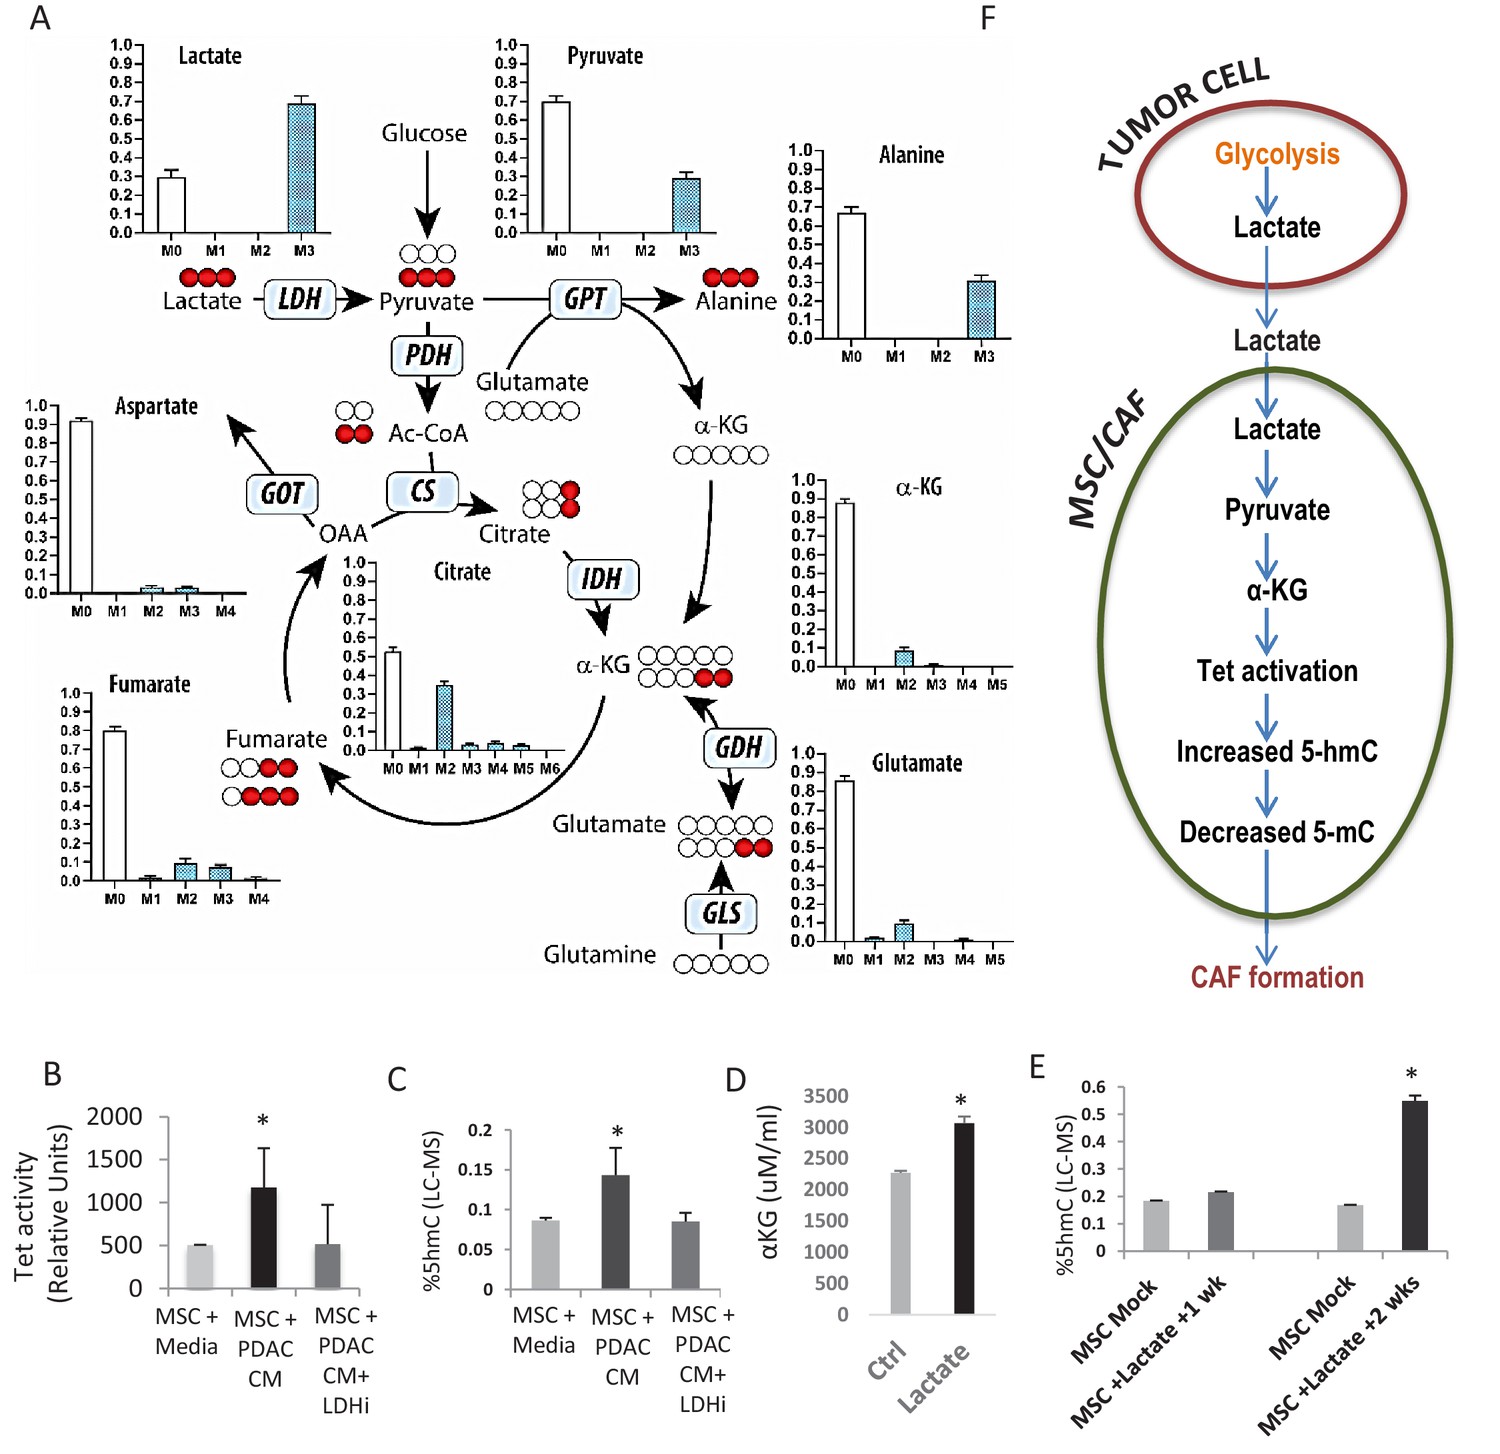
Increased 5hmC is seen in de novo CAFs generated from MSCs and is regulated by a paracrine lactate mediated metabolic flux.
(A) Mapping of carbon atoms transition using U-13C3-lactate. Mass isotopomer distribution (MID) shows uptake of labelled lactate by MSCs cultured in α-MEM leading to the generation of α-KG (M2 αKG) via the Krebs cycle. (B) Conditioned media (CM) from mock treated and LDH inhibitor (FX11) treated Panc-1 (PDAC) cells was collected. MSCs were exposed to media alone, control conditioned media (PDAC CM), or LDH inhibitor treated conditioned media for 14 days in order to generate de novo CAFs (dn-CAF). TET enzymatic activity increases in dn-CAFs after exposure to PDAC CM and is abrogated after exposure to CM from LDH inhibitor treated Panc-1 cells (N = 2, p<0.05). (C) Quantitative analysis of 5-hMC levels by LC-MS demonstrates significant increase within dn-CAFs after treatment with Panc-1 CM, that is abrogated after exposure to CM from LDH inhibitor treated Panc-1 cells (N = 2, p<0.05). (D) CAFs were exposed to exogenous lactate and α-KG levels were analysed by ELISA. (N = 2, p<0.05) (E) 5hmC analysed in the resulting dn-CAFs by LC-MS. After a 2 week exposure to exogenous lactate, significantly increased 5hmC is observed in the dn-CAFs (N = 2, p<0.05). (F) Schematic model of lactate flux from tumor cells to MSCs during CAF differentiation, leading to aKG generation, TET activation and conversion of 5mC into 5hmC.
Figure 3—figure supplement 1
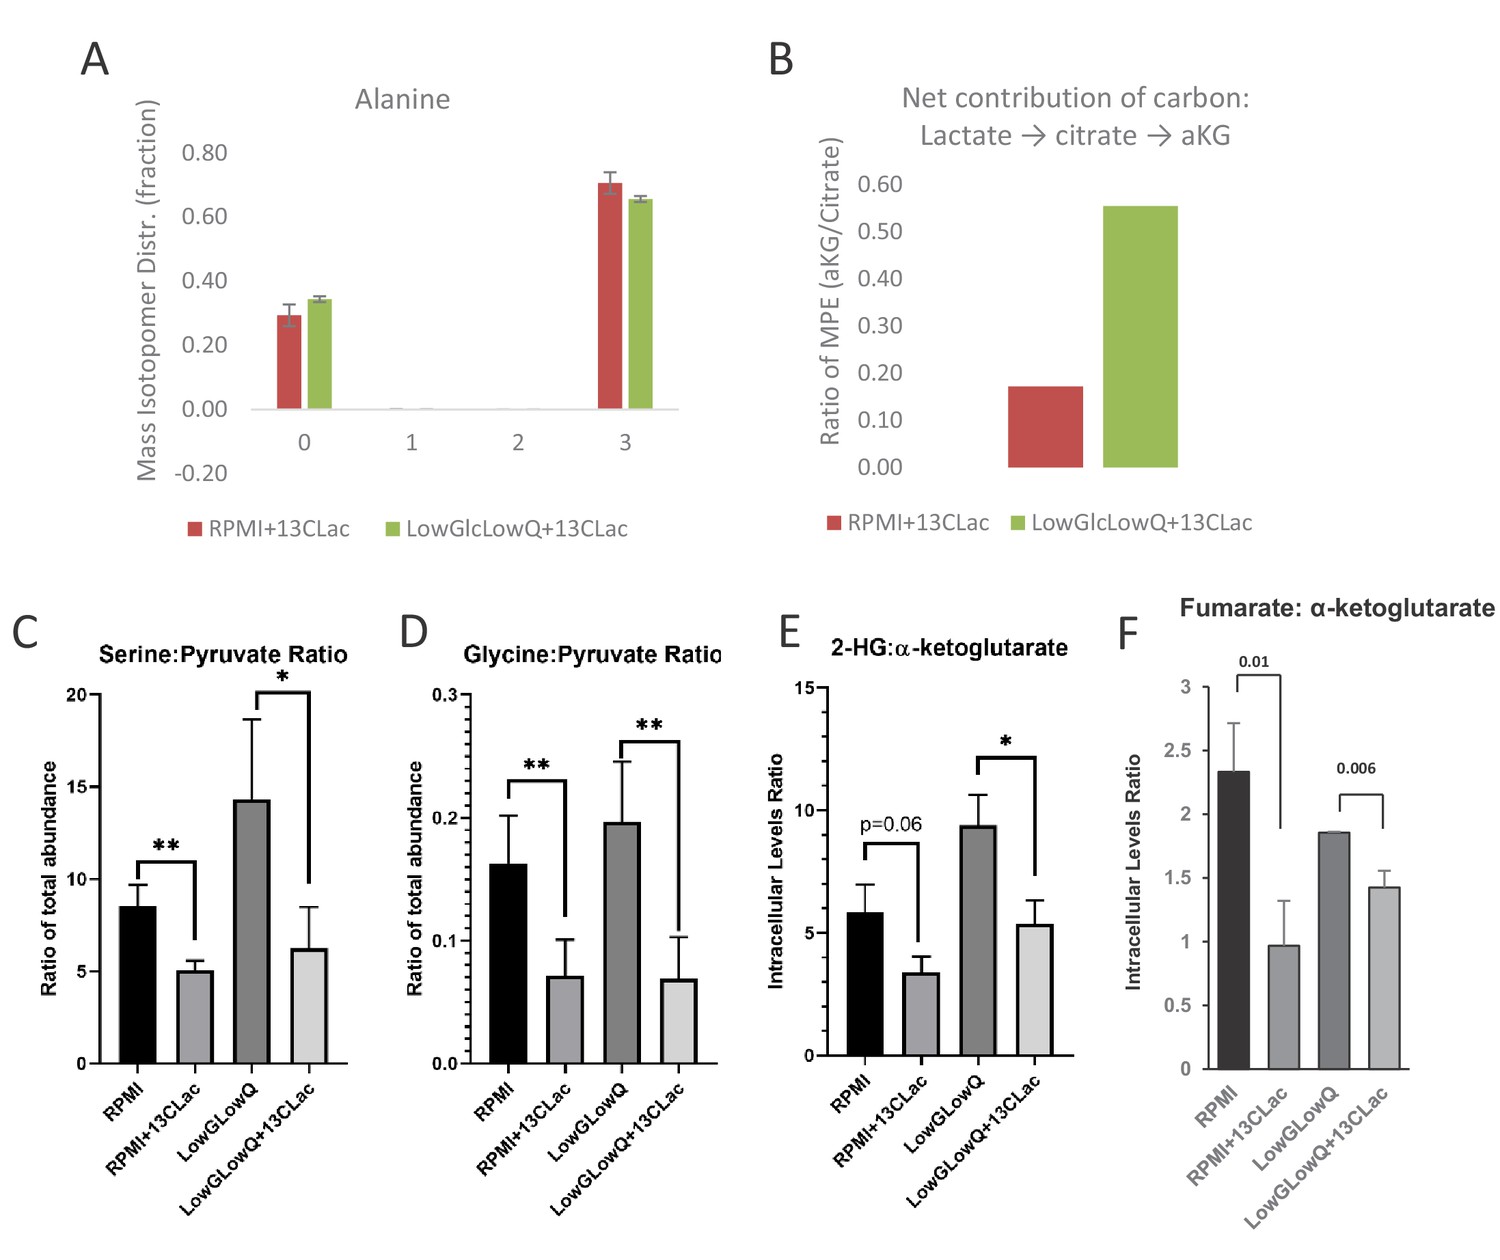
Metabolite tracking in CAF cells.
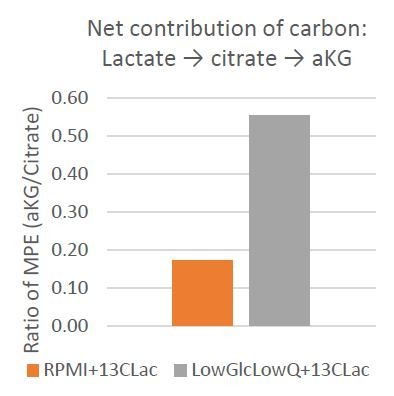
(A) Mass Isotopologue Distribution of Alanine from U-13C-Lactate tracing experiments indicate that lactate-derived carbon contributes significantly to de novo alanine synthesis. These experiments were performed in RPMI 1640 media, which does not contain alanine to highlight the de novo alanine synthesis. (B) Mole percent enrichment ratio of a-ketoglutarate to citrate indicates a net carbon contribution of lactate to a-ketoglutarate. This effect is significantly increased in culture conditions where glucose and glutamine are limited. (C, D) Ratio of intracellular levels of serine to pyruvate (left) and glycine to pyruvate (right) represent the contribution of lactate derived carbon to the serine-glycine one-carbon metabolism and subsequently to SAM cycle. In the presence of lactate, this glycolytic flux to SAM cycle is decreased. *, p<0.05; **, p<0.01 Statistical significance tested using unpaired one-tailed t-test (E) Ratio of intracellular levels of 2-hydroxyglutarate to a-ketoglutarate were previously found to be an indicator of TET activity. Lower ratios in presence of lactate in the culture media indicate an increase in TET activity. *, p<0.05; **, p<0.01 Statistical significance tested using unpaired one-tailed t-test (F) Higher ratio of intracellular levels of fumarate to a-ketoglutarate was previously found to inhibit TET activity. Lower ratios in presence of lactate in the culture media indicate an decrease in TET inhibition. *, p<0.05; **, p<0.01 Statistical significance tested using unpaired one-tailed t-test.
Figure 3—figure supplement 2
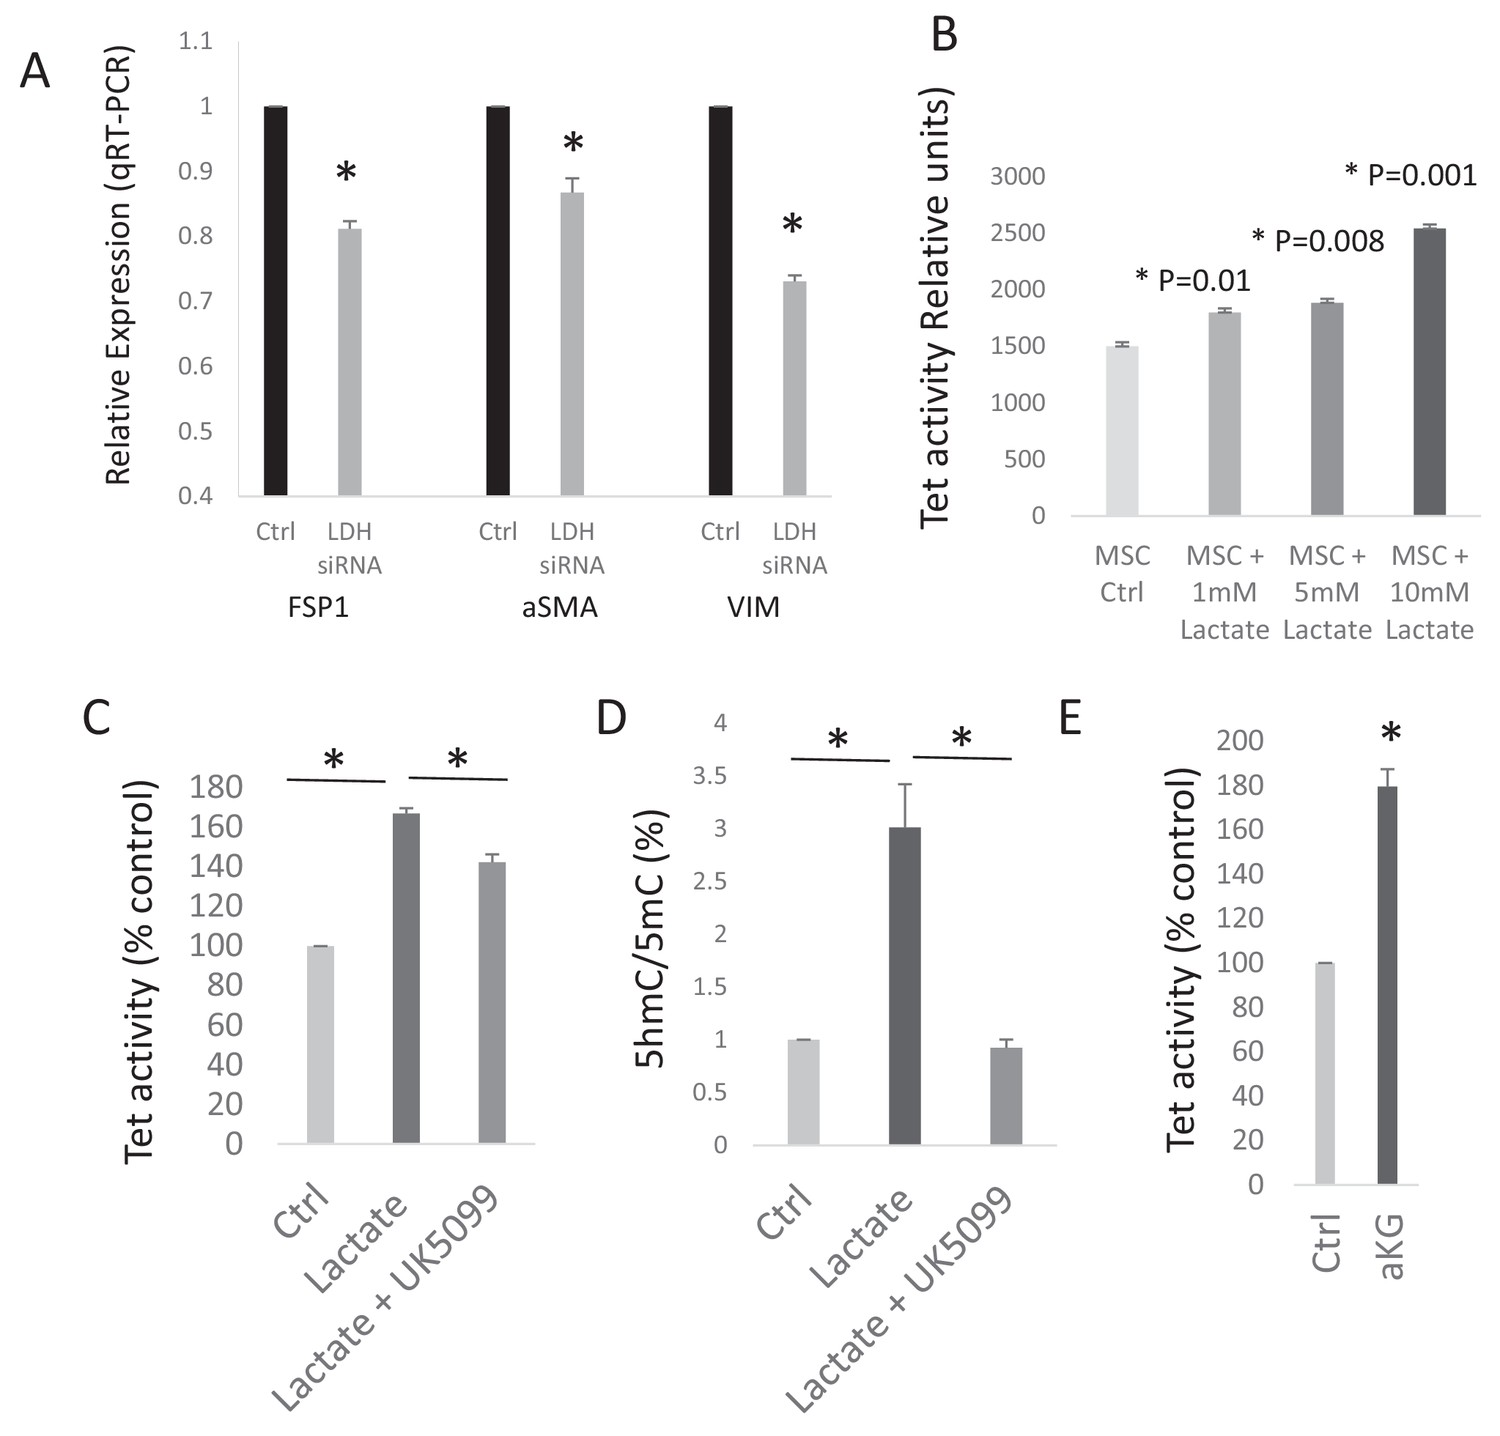
Lactate increases TET activity in CAFs.
(A) Conditioned media from ctrl and LDH siRNA mediated knockdown PANC-1 (PDAC) cells was collected. MSCs were exposed to control conditioned media (ctrl), or LDH knockdown conditioned and used to measure expression of CAF related genes (Fibroblasts specific protein, FSP1 (S100A4); alpha smooth muscle actin (αSMA (ACTA1)); and vimentin (VIM) by qRTPCR. (N = 3, p<0.05). (B) TET activity was analysed in MSCs exposed to exogenous lactate in dose dependant fashion (1 mM to 10 mM). (N = 3, p<0.05). (C) TET activity was analysed in CAFs exposed to exogenous lactate (10 mM) with and without Pyruvate carrier inhibitor UK5099 (5 uM). (N = 3, p<0.05). (D) 5hmC and 5mC was analysed by ELISA in CAFs exposed to exogenous lactate with and without Pyruvate carrier inhibitor UK5099 (5 uM). (N = 2, p<0.05). E: TET activity was analysed in CAFs exposed to exogenous cell permeable αKG (2 mM). (N = 2, p<0.05).
Figure 4
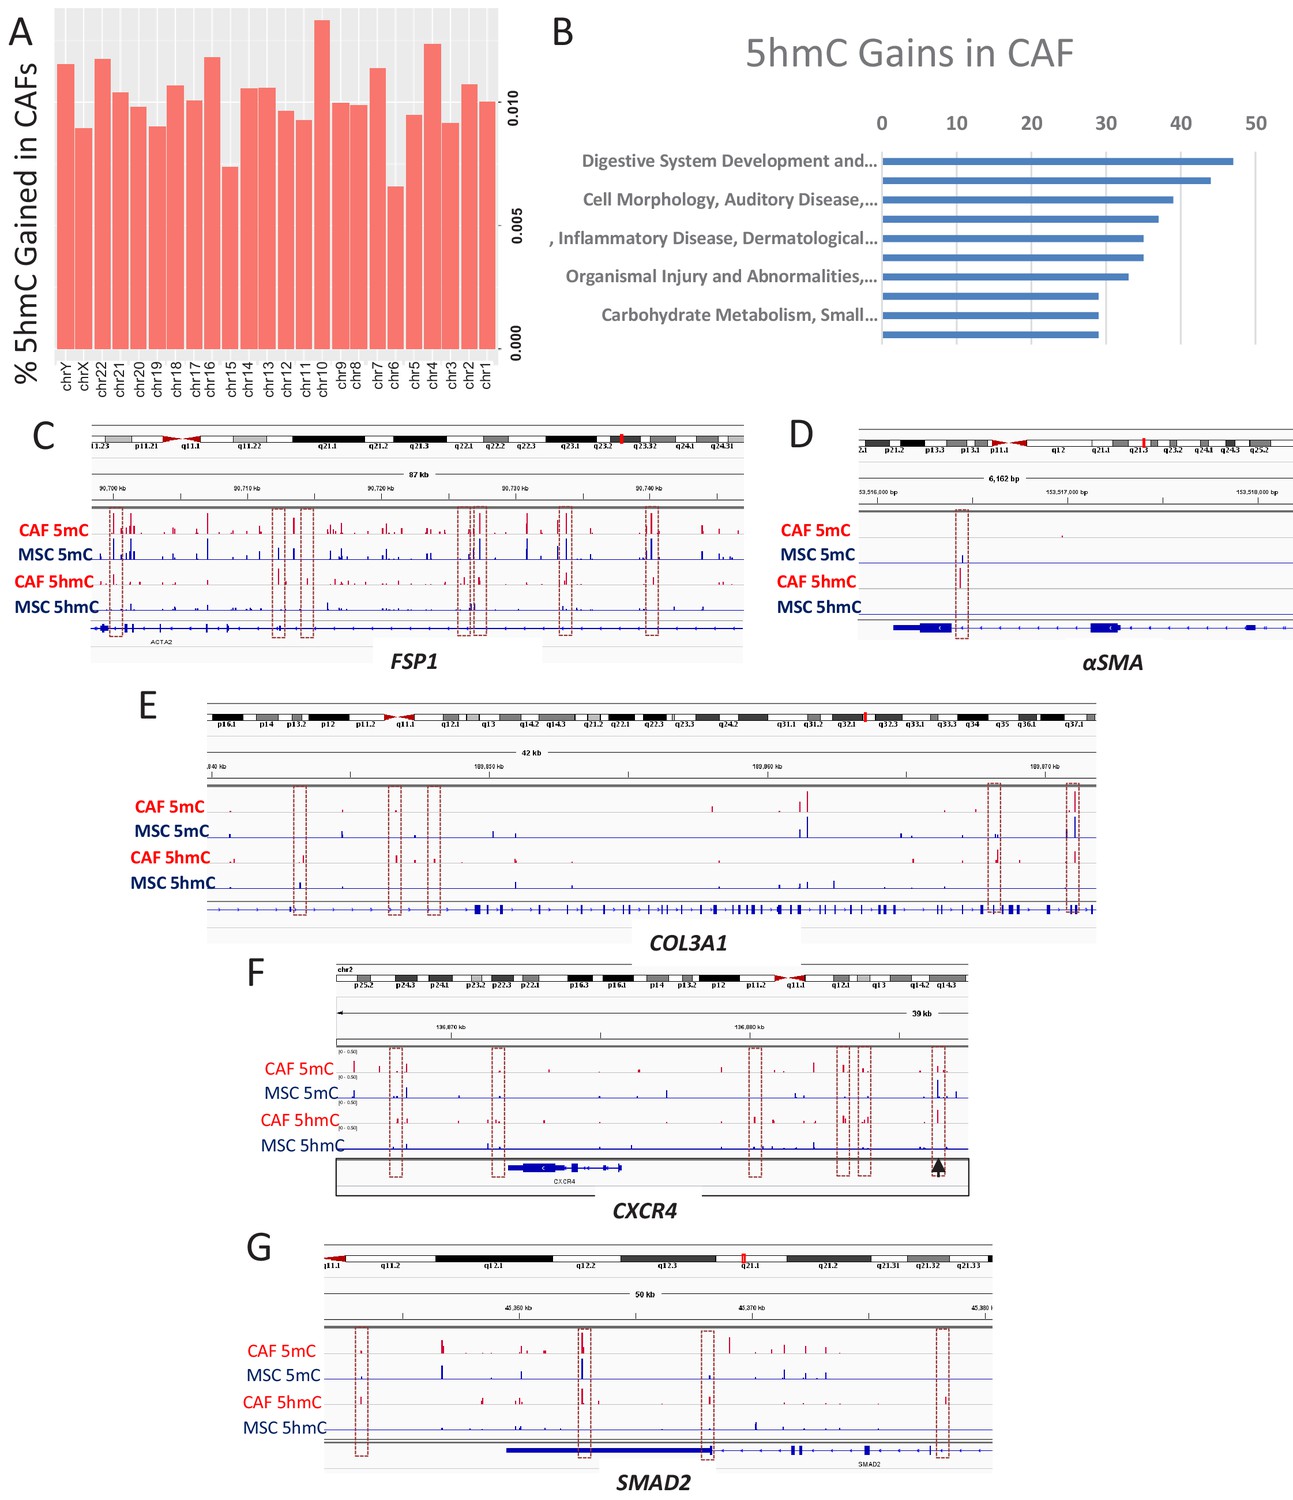
5hmC gains are seen during MSC to CAF conversion and occur at gene associated with cancer associated fibroblasts.
(A) Genome wide 5hmC analysis was done by OXBS in MSCs and converted CAFs. 5hmC gains are depicted as percentage gained (CAF/MSC) and were seen to occur throughout the genome (B) 5hmC gains in CAFs were seen to occur at important genetic pathways C-G: 5hmC gains occurred with corresponding decrease in 5mC at genes related to CAF conversion (FSP1 (S100A4), aSMA (ACTA1)); Collagen production (COL3A1), CXCR4, and the SMAD2.
Figure 5
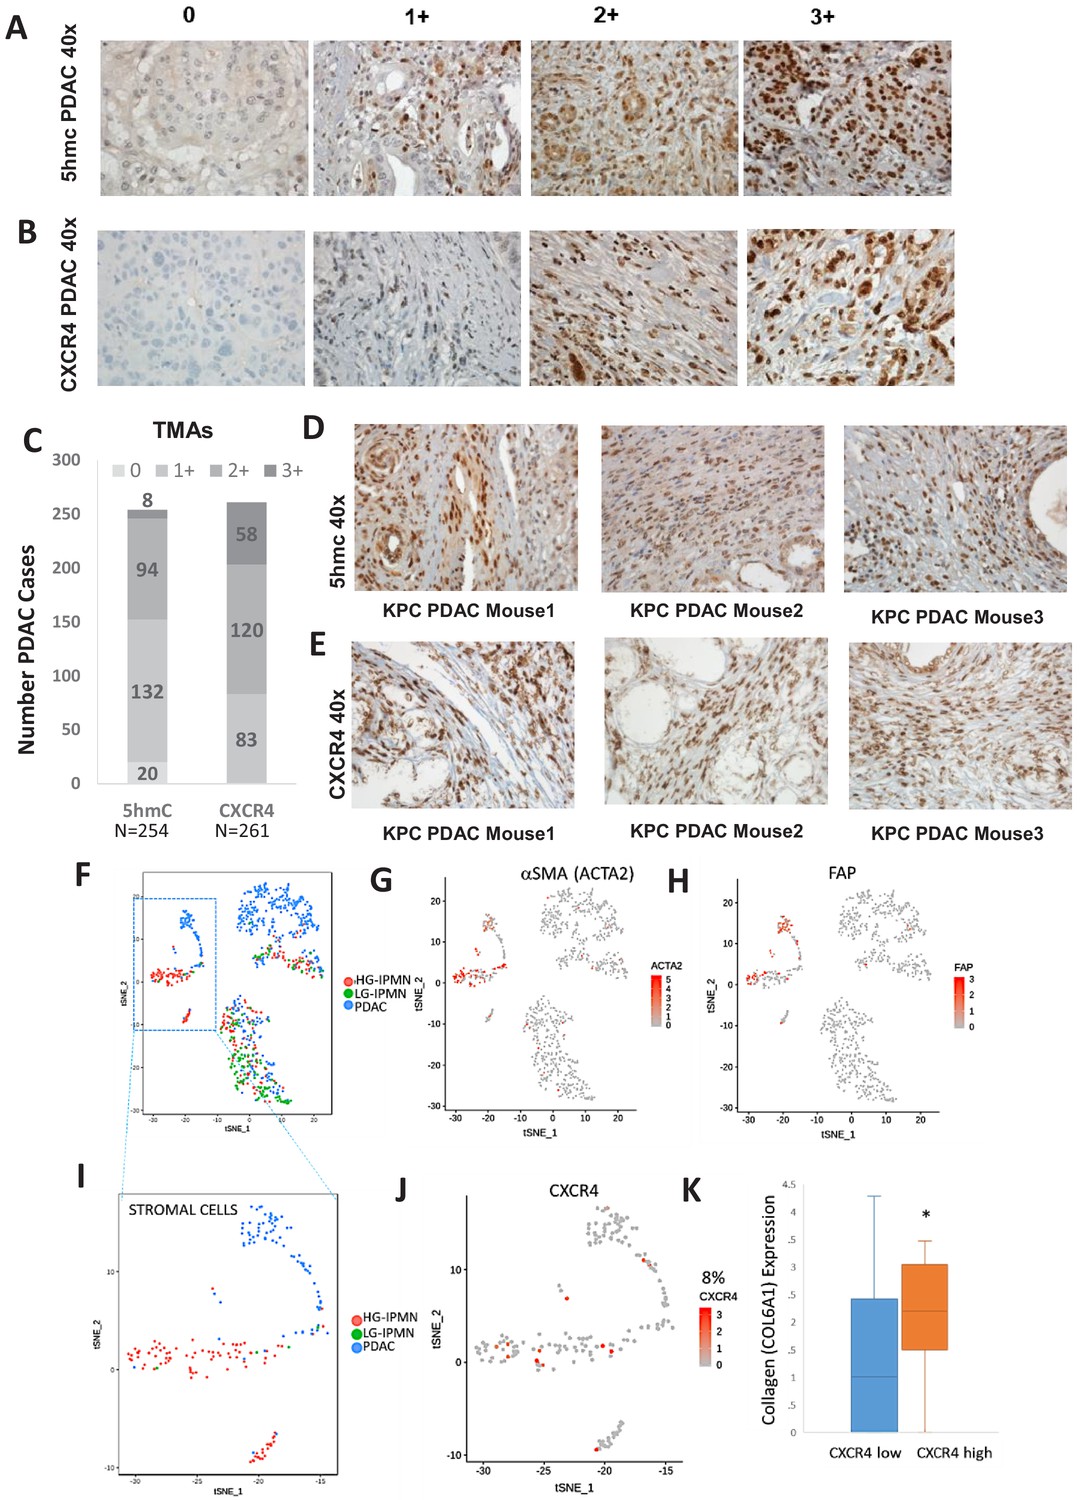
Increased 5hmC and CXCR4 expression is seen in primary human PDAC and murine KPC PDAC tumors.
(A, B) 5hmC (A) and CXCR4 (B) immunohistochemical staining was done on human PDAC TMAs and grading of intensity of stain in the tumor stromal CAFs was estimated. (C) Most CAF like cells in PDAC samples were positive for 5hmC and CXCR4 (1+ to 3+ intensity). Total PDAC samples examined for 5hmC were 254 and for CXCR4 were 261. (D,E) 5hmC (D) and CXCR4 (E) immunohistochemical staining was done on mouse PDAC tumors obtained from 3 KPC mice. CAF like stromal cells were positive for 5hmC and CXCR4. (F) Single cell RNA-seq from low grade intraductal papillary mucinous neoplasm (LG IPMN), high grade intraductal papillary mucinous neoplasm (HG IPMN) and frank pancreatic ductal adenocarcinoma (PDAC) was conducted and shown in tSne plot. (G,H) Stromal cell populations cluster distinctly and are positive for α-SMA (ACTA1) and fibroblast activated protein. (I) Most of the stromal cells are seen in High grade IPMN and PDAC samples J,K: CXCR4 expression is seen in 14/181 (8%) stromal cells and correlates with cells with higher collagen expression, seen in activated CAF phenotypes (T-Test, P Vccal = 0.02).
Figure 6
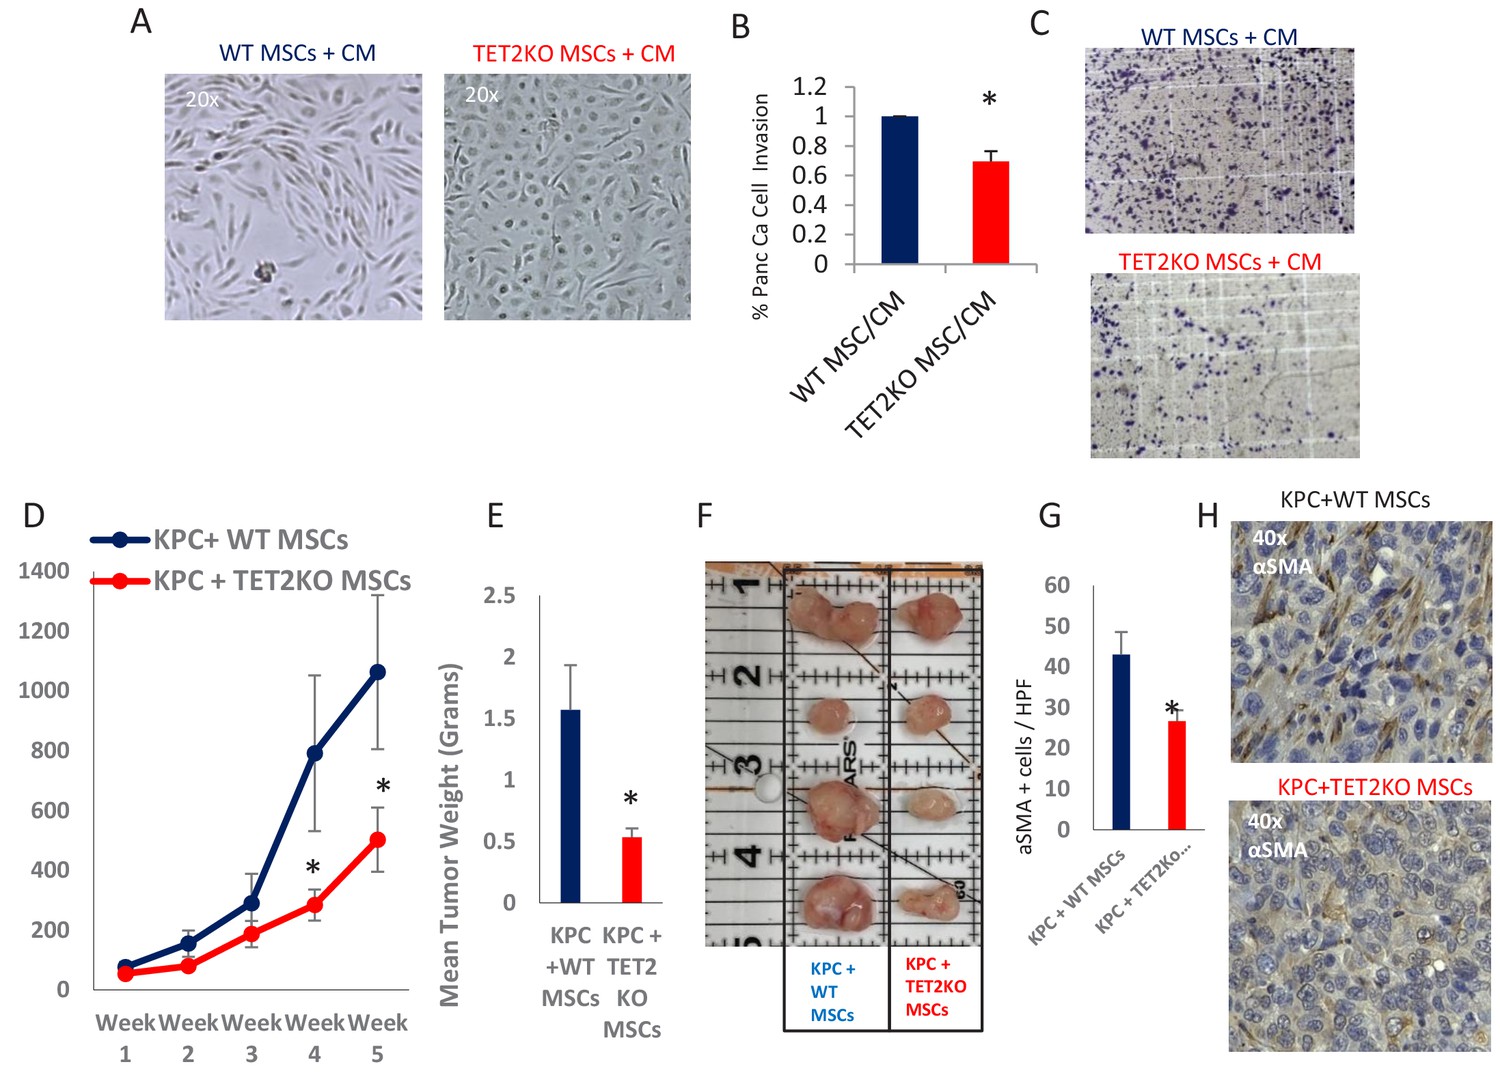
TET2 inactivation in MSCs leads to reduced tumor growth and inefficient CAF conversion in vivo.
(A) Wildtype and TET2 KO MSCs were exposed to conditioned media from KPC PDAC cells for 14 days. TET2 KO MSCs demonstrated decreased fibroblastic appearance when compared to wildtype controls. (B,C) MSCs from TET2 KO treated with conditioned media from KPC PDAC cells led to significantly less KPC invasion in matrigel assays when compared with wildtype controls (N = 3 independent experiments, p value<0.05) (D) MSCs from TET2 KO mice and WT controls were co-injected subcutaneously with KPC PDAC cells in NSG mice. Tumor growth was significantly reduced in mice injected with TET2 KO stromal cells (N = 9 (TET2 KO/KPC) and N = 7 (WT/KPC), P Value < 0.05) (E,F) Tumor sizes (B) and weights (C) are significantly reduced from KPC allografts co-injected with TET2KO MSCs (P Value < 0.05) G,H: Number of aSMA (ACTA1) positive cancer associated fibroblasts are reduced in KPC allografts co-injected with TET2KO stromal cells when compared to KPC allografts co-injected with control MSCs (N = 4 in each group, p value<0.01).
Author response image 1
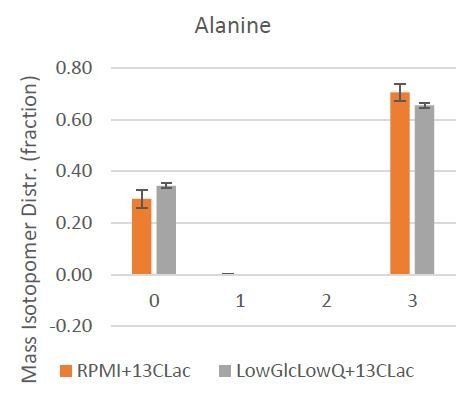
Mass Isotopologue Distribution of Alanine from U-13C-Lactate tracing experiments indicate that lactate-derived carbon contributes significantly to de novo alanine synthesis.
Author response image 2
Tables
Table 1
Transcription factor sites that are enriched around 5hmC gains during CAF conversion.
https://doi.org/10.7554/eLife.50663.009| Rank | Name | P-value | q-value (Benjamini) | # Target Sequences with Motif | % of Targets Sequences with Motif | # Background Sequences with Motif | % of Background Sequences with Motif | Motif |
|---|---|---|---|---|---|---|---|---|
| 1 | Atf3(bZIP)/GBM-ATF3-ChIP-Seq(GSE33912)/Homer | 1.00E-07 | 0 | 344 | 7.86% | 2593.1 | 5.81% |  |
| 2 | AP-1(bZIP)/ThioMac-PU.1-ChIP-Seq(GSE21512)/Homer | 1.00E-06 | 0 | 383 | 8.75% | 2995.7 | 6.71% |  |
| 3 | Jun-AP1(bZIP)/K562-cJun-ChIP-Seq(GSE31477)/Homer | 1.00E-05 | 0.0003 | 112 | 2.56% | 722.1 | 1.62% |  |
| 4 | BMAL1(bHLH)/Liver-Bmal1-ChIP-Seq(GSE39860)/Homer | 1.00E-05 | 0.0003 | 857 | 19.57% | 7567 | 16.95% |  |
| 5 | Fosl2(bZIP)/3T3L1-Fosl2-ChIP-Seq(GSE56872)/Homer | 1.00E-05 | 0.0003 | 149 | 3.40% | 1040.8 | 2.33% |  |
| 6 | BATF(bZIP)/Th17-BATF-ChIP-Seq(GSE39756)/Homer | 1.00E-05 | 0.0003 | 322 | 7.35% | 2570.8 | 5.76% |  |
| 7 | Fra1(bZIP)/BT549-Fra1-ChIP-Seq(GSE46166)/Homer | 1.00E-04 | 0.0006 | 266 | 6.07% | 2089.9 | 4.68% |  |
| 8 | Smad2(MAD)/ES-SMAD2-ChIP-Seq(GSE29422)/Homer | 1.00E-04 | 0.0011 | 652 | 14.89% | 5725.2 | 12.83% |  |
| 9 | NPAS2(bHLH)/Liver-NPAS2-ChIP-Seq(GSE39860)/Homer | 1.00E-04 | 0.0026 | 543 | 12.40% | 4734.1 | 10.61% |  |
| 10 | Smad4(MAD)/ESC-SMAD4-ChIP-Seq(GSE29422)/Homer | 1.00E-03 | 0.003 | 655 | 14.96% | 5819.3 | 13.04% |  |
| 11 | Smad3(MAD)/NPC-Smad3-ChIP-Seq(GSE36673)/Homer | 1.00E-03 | 0.0035 | 1238 | 28.27% | 11533 | 25.84% |  |
| 12 | Usf2(bHLH)/C2C12-Usf2-ChIP-Seq(GSE36030)/Homer | 1.00E-03 | 0.0042 | 200 | 4.57% | 1574.5 | 3.53% |  |
| 13 | HIF2a(bHLH)/785_O-HIF2a-ChIP-Seq(GSE34871)/Homer | 1.00E-03 | 0.0066 | 178 | 4.06% | 1393.5 | 3.12% |  |
| 14 | CEBP:CEBP(bZIP)/MEF-Chop-ChIP-Seq(GSE35681)/Homer | 1.00E-03 | 0.0141 | 107 | 2.44% | 789.3 | 1.77% |  |
| 15 | MafA(bZIP)/Islet-MafA-ChIP-Seq(GSE30298)/Homer | 1.00E-02 | 0.023 | 315 | 7.19% | 2709.1 | 6.07% |  |
| 16 | Bach2(bZIP)/OCILy7-Bach2-ChIP-Seq(GSE44420)/Homer | 1.00E-02 | 0.023 | 86 | 1.96% | 622.7 | 1.40% |  |
| 17 | Brachyury(T-box)/Mesoendoderm-Brachyury-ChIP-exo(GSE54963)/Homer | 1.00E-02 | 0.0326 | 134 | 3.06% | 1056.7 | 2.37% |  |
| 18 | USF1(bHLH)/GM12878-Usf1-ChIP-Seq(GSE32465)/Homer | 1.00E-02 | 0.0387 | 190 | 4.34% | 1574.4 | 3.53% |  |
| 19 | n-Myc(bHLH)/mES-nMyc-ChIP-Seq(GSE11431)/Homer | 1.00E-02 | 0.0511 | 272 | 6.21% | 2354.1 | 5.27% |  |
| 20 | Fli1(ETS)/CD8-FLI-ChIP-Seq(GSE20898)/Homer | 1.00E-02 | 0.0528 | 439 | 10.03% | 3953.7 | 8.86% |  |
Additional files
-
Supplementary file 1
Pathways that are overexpressed and demethylated in pancreatic cancer associated fibroblasts.
- https://doi.org/10.7554/eLife.50663.012
-
Supplementary file 2
Common sets of genes epigenetically altered in primary and de novo generated CAFs.
- https://doi.org/10.7554/eLife.50663.013
-
Supplementary file 3
Differentially expressed transcripts after CXCR knockdown in CAF cells.
- https://doi.org/10.7554/eLife.50663.014
Download links
A two-part list of links to download the article, or parts of the article, in various formats.
Downloads (link to download the article as PDF)
Open citations (links to open the citations from this article in various online reference manager services)
Cite this article (links to download the citations from this article in formats compatible with various reference manager tools)
Lactate-mediated epigenetic reprogramming regulates formation of human pancreatic cancer-associated fibroblasts
eLife 8:e50663.
https://doi.org/10.7554/eLife.50663


