A polyomavirus peptide binds to the capsid VP1 pore and has potent antiviral activity against BK and JC polyomaviruses
- Novartis Institutes for BioMedical Research, United States
Figures
Figure 1 with 1 supplement
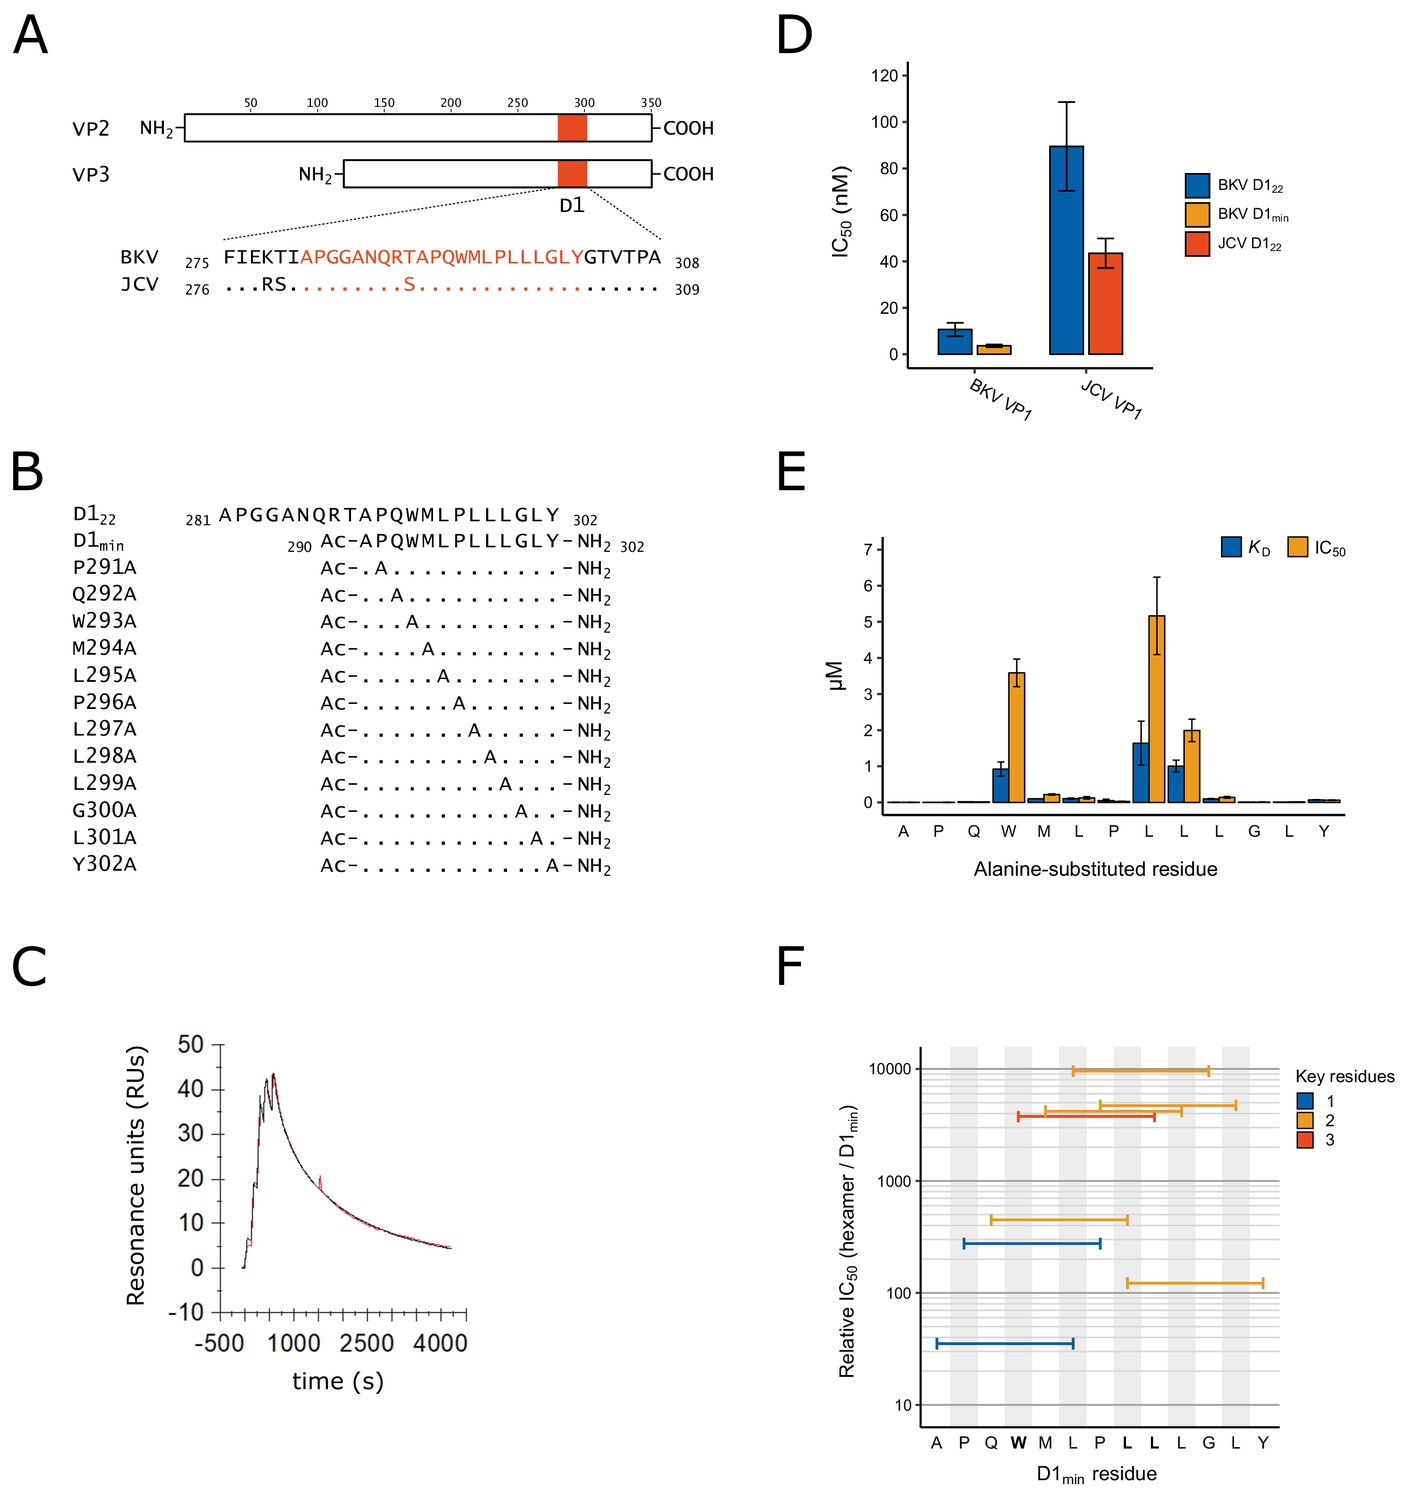
Identification of D1min peptide and key residues contributing to interaction with VP1.
(A) Multiple sequence alignment of VP2/3 D1 region and flanking sequence. BKV: BK polyomavirus; JCV: JC polyomavirus. (B) Sequence and index within BKV VP2 of peptides used in this study, highlighting alanine-scanning mutagenesis. Ac: acetyl group (C) Representative surface plasmon resonance (SPR) sensorgram of single-cycle kinetic experiment showing association of D1min with VP1 pentamer. Multiple (five) injections are shown, and dissociation of the peptide starts at peak response. Experimental data (red) and the 1:1 model of responses (black) are shown. (D) Results of AlphaScreen competitive binding assay. Displacement of carboxy-terminal biotinylated D122 peptide from either BKV or JCV VP1 was assayed using D122 (BKV and JCV) or D1min (BKV only), with IC50 concentration determined (mean ± SD, n = 3 for BKV VP1, n = 2 for JCV VP1). (E) SPR-measured VP1 binding affinity (KD) and AlphaScreen displacement assay results (IC50; mean ± SD, n = 3) for single-site alanine-substitutions in D1min. (F) AlphaScreen displacement assay IC50 values for D1min hexamer peptides (mean of n = 3). Color indicates the number of key residues (W293, L297, or L298) present in the hexamer.
Figure 1—figure supplement 1
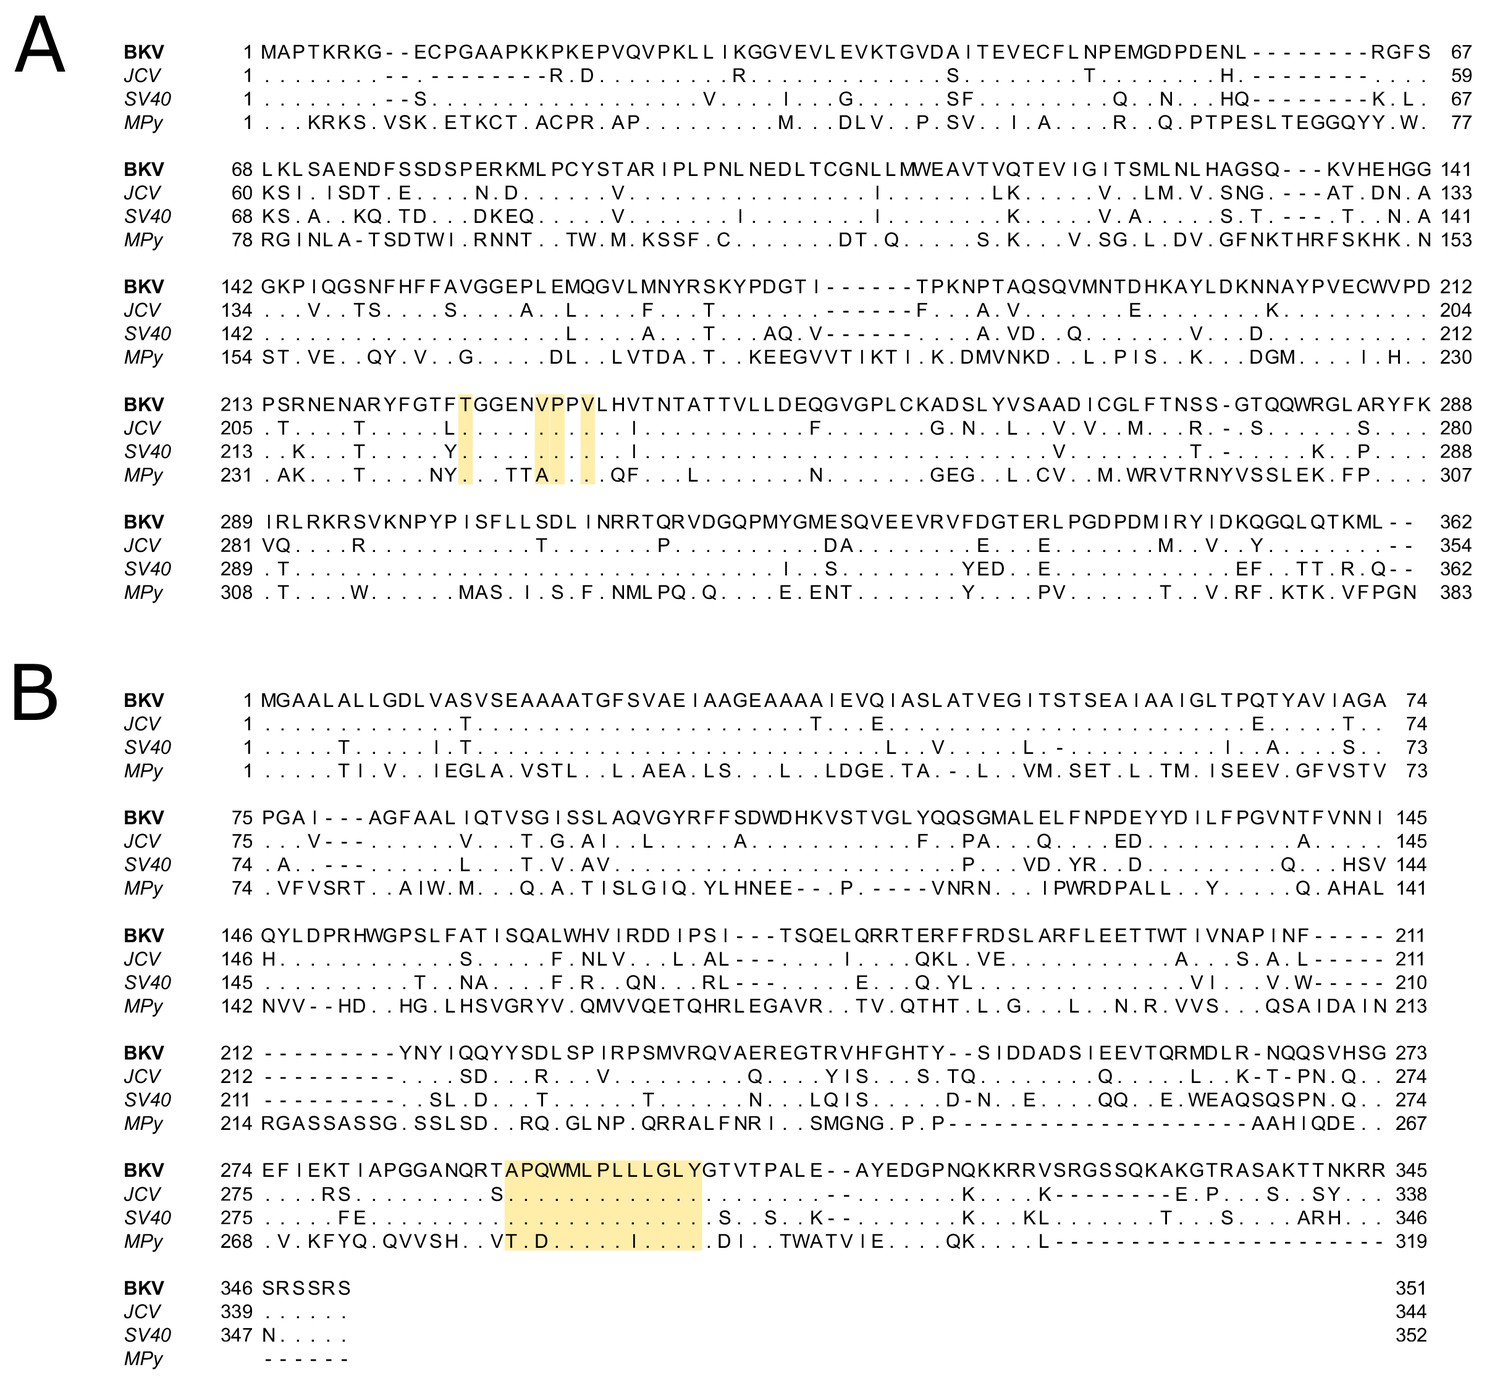
Multiple sequence alignments of polyomavirus VP1 and VP2.
(A) Multiple sequence alignment of VP1 protein from BKV (P03088), JCV (P03089), SV40 (P03087), and murine polyomavirus (MPy; P03090). VP1 pore residues that are proximal to D1min peptide-binding region are highlighted. Dots indicate conserved sequence, relative to BKV. (B) Multiple sequence alignment of VP2 proteins (BKV: P03094, JCV: P03095, SV40: P03093, MPy: P03096). Sequence from which D1min is derived is highlighted. Alignment was performed using Clustal Omega (Madeira et al., 2019).
Figure 2 with 2 supplements
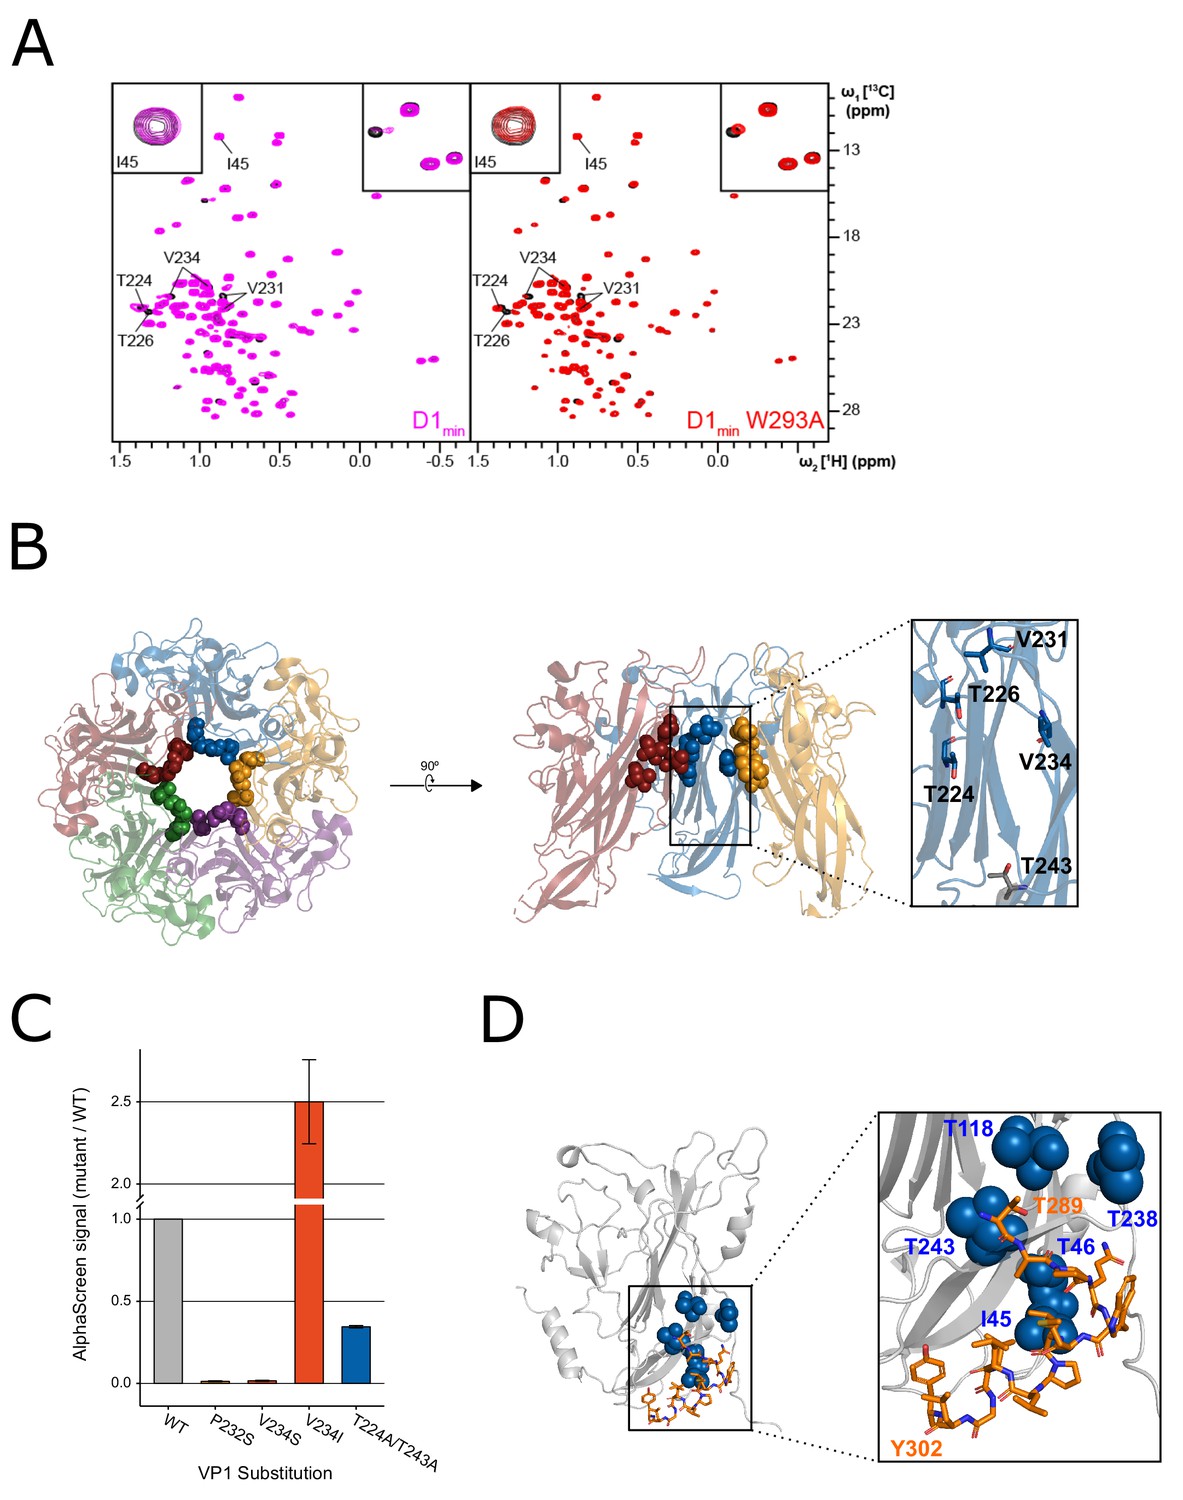
NMR characterization of the VP1-D1min interaction.
(A) 1H,13C-HMQC spectra showing peptide (12.5 µM) induced perturbations of tr-VP1 (125 µM; black) ILVT methyl signals. Left: the wild-type D1min peptide (magenta) causes CSPs and line broadening of peaks clustered in the upper pore of the target protein. The disappearance of peaks indicates slow exchange kinetics and thus, strong (usually sub-micromolar) binding (see inset in upper right corner). At sub-stoichiometric peptide concentrations no binding to a second site is observed as there are no changes of I45 (see inset in upper corner). Right: alanine-substituted W293A peptide (red) induces the same CSP pattern as the wild-type peptide, however, exchange kinetics are fast and no line broadening is observed. There is also no second site binding observed at low peptide concentrations. (B) VP1 residues highlighted in (A) overlaid on X-ray structure of VP1 pentamer, looking down into the pore (left) and a cutaway side-view of three VP1 monomers (right). Spheres highlight VP1 residues that exhibit CSPs upon peptide binding (T224, T226, V231, and V234). Residue T243 is lower in the pore (shown in gray) and does not exhibit perturbations upon peptide binding (PDB: 4MJ1; Neu et al., 2013). (C) Relative binding affinities of D122 peptide to wild-type VP1 protein or VP1 containing pore residue substitutions using AlphaScreen detection method. Values are normalized to wild-type VP1 (mean ± SD). (D) Overlay of ‘second-site’ VP1 residues (I45, T46, T118, T238, T243; blue) on cryo-EM model of BKV VP1 (gray) and VP2 (orange) (adapted from PDB 6ESB, Hurdiss et al., 2018).
Figure 2—figure supplement 1

Chemical shift pertubations induced by D1min binding to VP1.
(A) 1H,13C-HMQC spectra showing peptide (100 µM) induced perturbations of tr-VP1 (125 µM protein + 25 µM peptide; black) ILVT methyl signals. Left: the wild-type peptide (magenta) induces secondary CSPs (e.g. I45, see inset in upper corner), indicating micromolar binding to a second site. The affected residues are clustered in the lower pore. Right: in contrast to the wild-type D1min, the W293A alanine-substituted peptide (red) hardly induces secondary chemical shifts. This observation suggests that secondary binding is very weak (millimolar KD). (B) 1H,13C-HMQC spectra showing an inset of tr-VP1-I45V (100 µM; red) and wild-type tr-VP1 (100 µM; black) Ile methyl signals. The isoleucine signal at 0.84 ppm (1H)/12.80 ppm (13C) disappears when I45 gets mutated, making it possible to assign the residue. (C) 1H,13C-HMQC spectra showing peptide (200 µM) induced perturbations of tr-VP1 (125 µM protein + 25 µM peptide; black) ILVT methyl signals. Left: most of the VP1 peaks affected by the second site binding of the wild-type peptide (magenta) show severe line broadening at 200 µM ligand concentration (see inset in upper corner). This effect may be caused by specific or unspecific binding of multiple copies of the peptide to the lower pore. Right: the W293A alanine-substituted peptide (red) does not induce super-stoichiometric line broadening as its affinity for the secondary binding site is very low. (D–E) Highlighting primary binding site (green) and secondary binding site (yellow) VP1 residues that show peptide induced CSPs (PDB: 4MJ1; Neu et al., 2013).
Figure 2—figure supplement 2
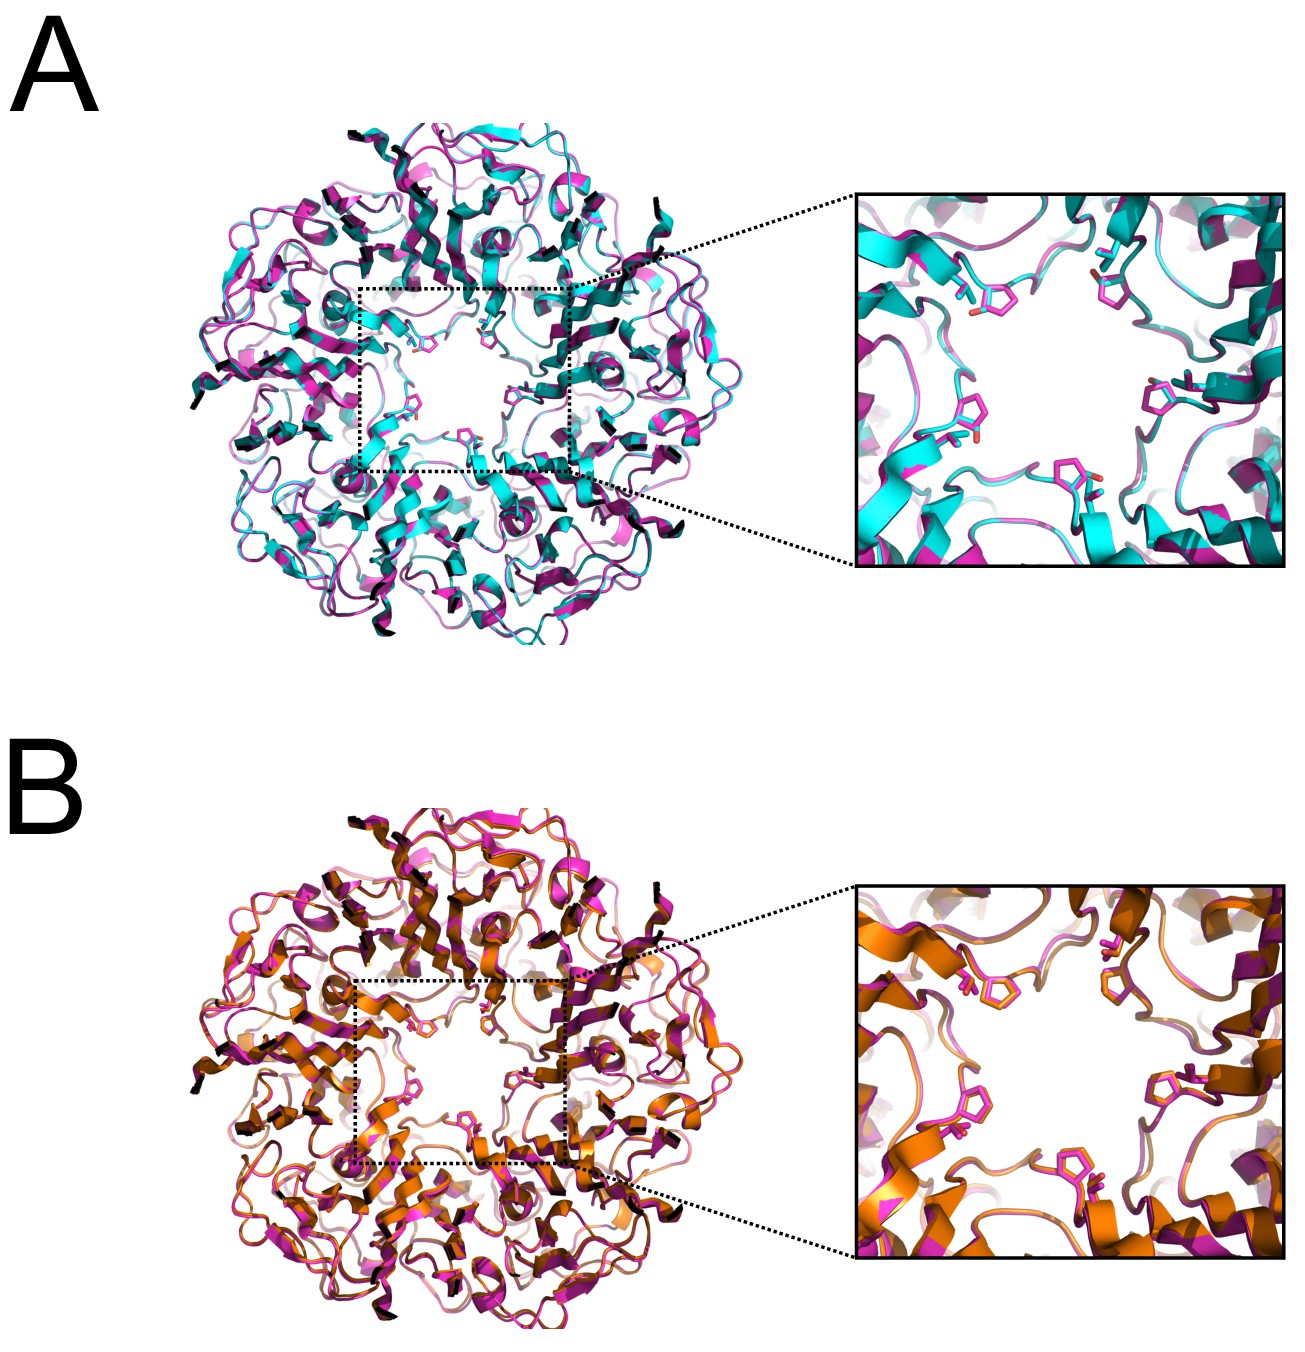
Structural comparison of wild-type BKV VP1 with pore residue substitution variants.
(A) Overlay of X-ray crystal structures from wild-type (magenta) or P232S (cyan) VP1 pentamer. (B) Overlay of X-ray crystal structures from wild-type (magenta) or V234S (bronze) VP1 pentamer.
Figure 3 with 1 supplement
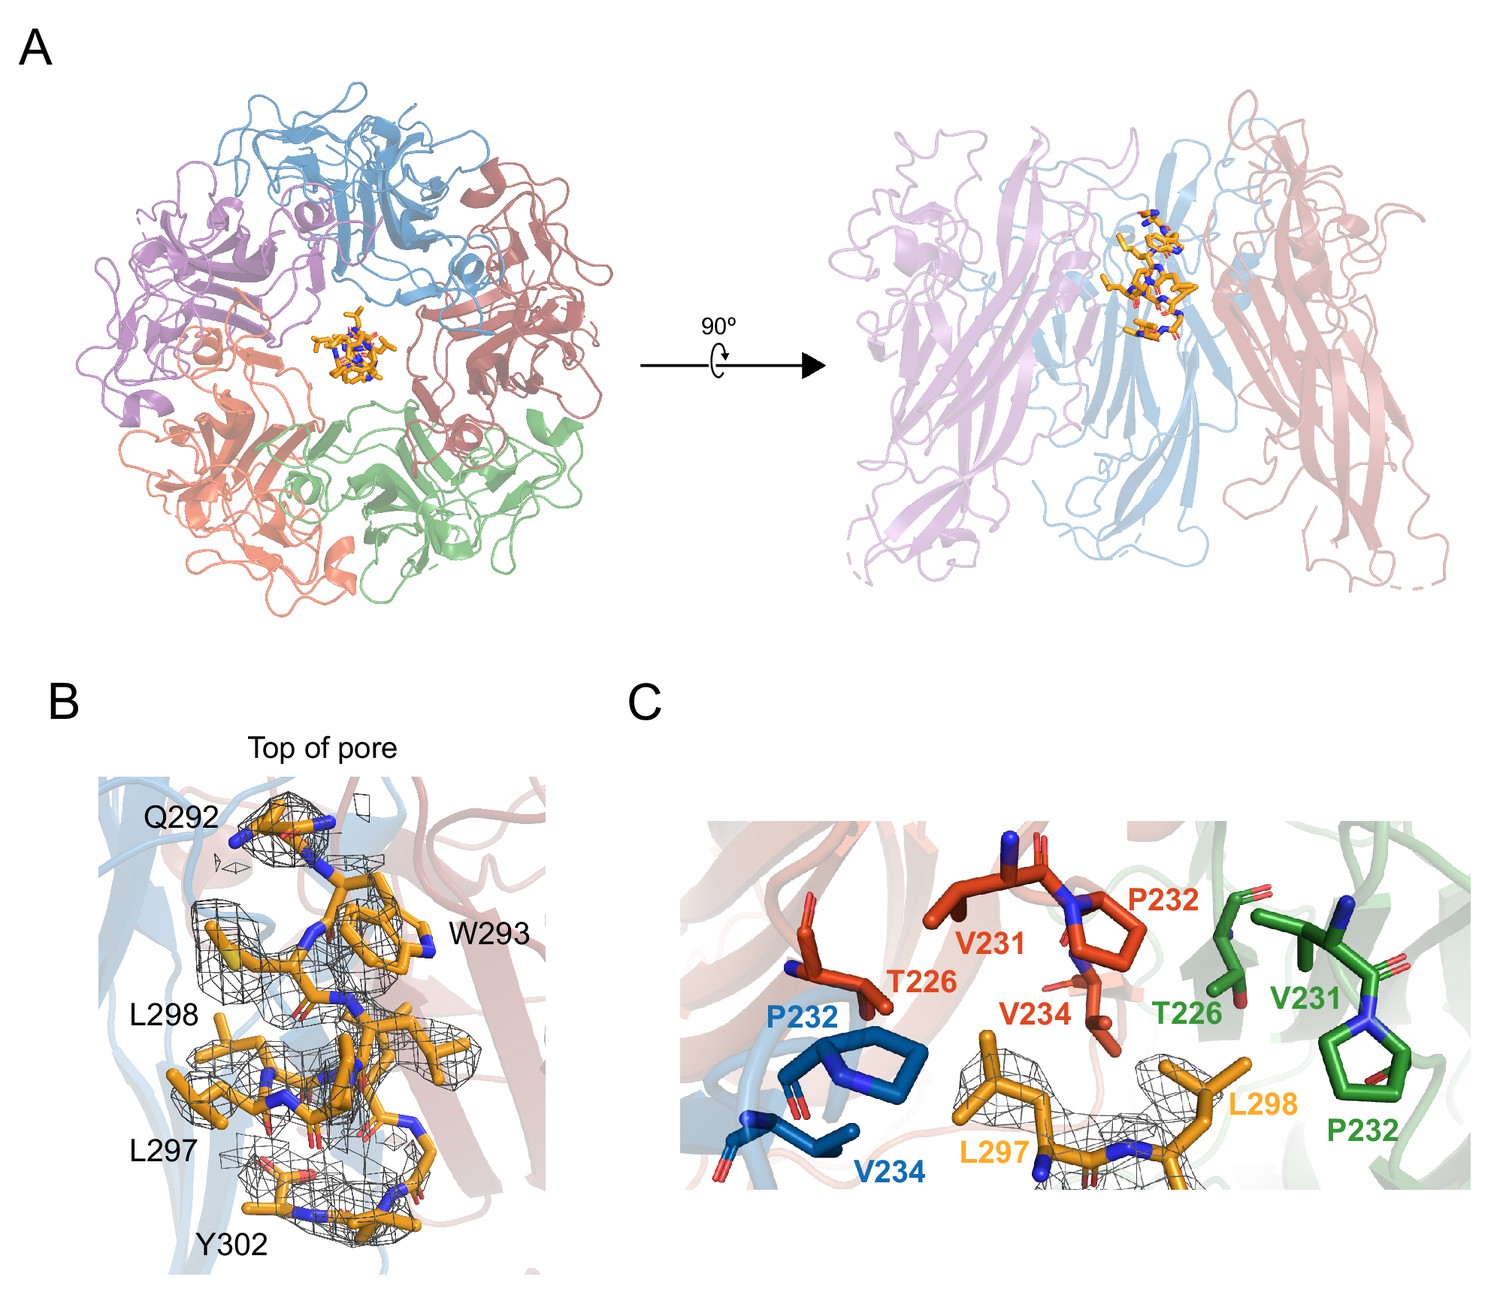
X-ray structurally-guided model of D1min-VP1 pentamer complex shows key residues mediating interaction.
(A) Structurally-guided model of structure of D1min peptide bound to BKV VP1 pentamer. (Left) Top-down view of the model. (Right) Cutaway representation showing three VP1 molecules of the pentamer with D1min peptide bound. (B) D1min 2Fo-Fc electron density map, contoured at 1σ, with model of peptide residues 292QWLPLLLGLY302 built with guidance from the experimental maps. Start and end residues, as well as key binding residues W293, L297, and L298 are highlighted. (C) Close-up of hydrophobic pocket formed by VP1 pore residues T226, V231, P232, and V234. Blue, orange, and green residues represent three distinct VP1 molecules within the pentamer. D1min electron density for residues L297 and L298 (yellow), shown contoured to 1σ, correspond to regions of closest approach of the peptide to the pocket.
Figure 3—figure supplement 1
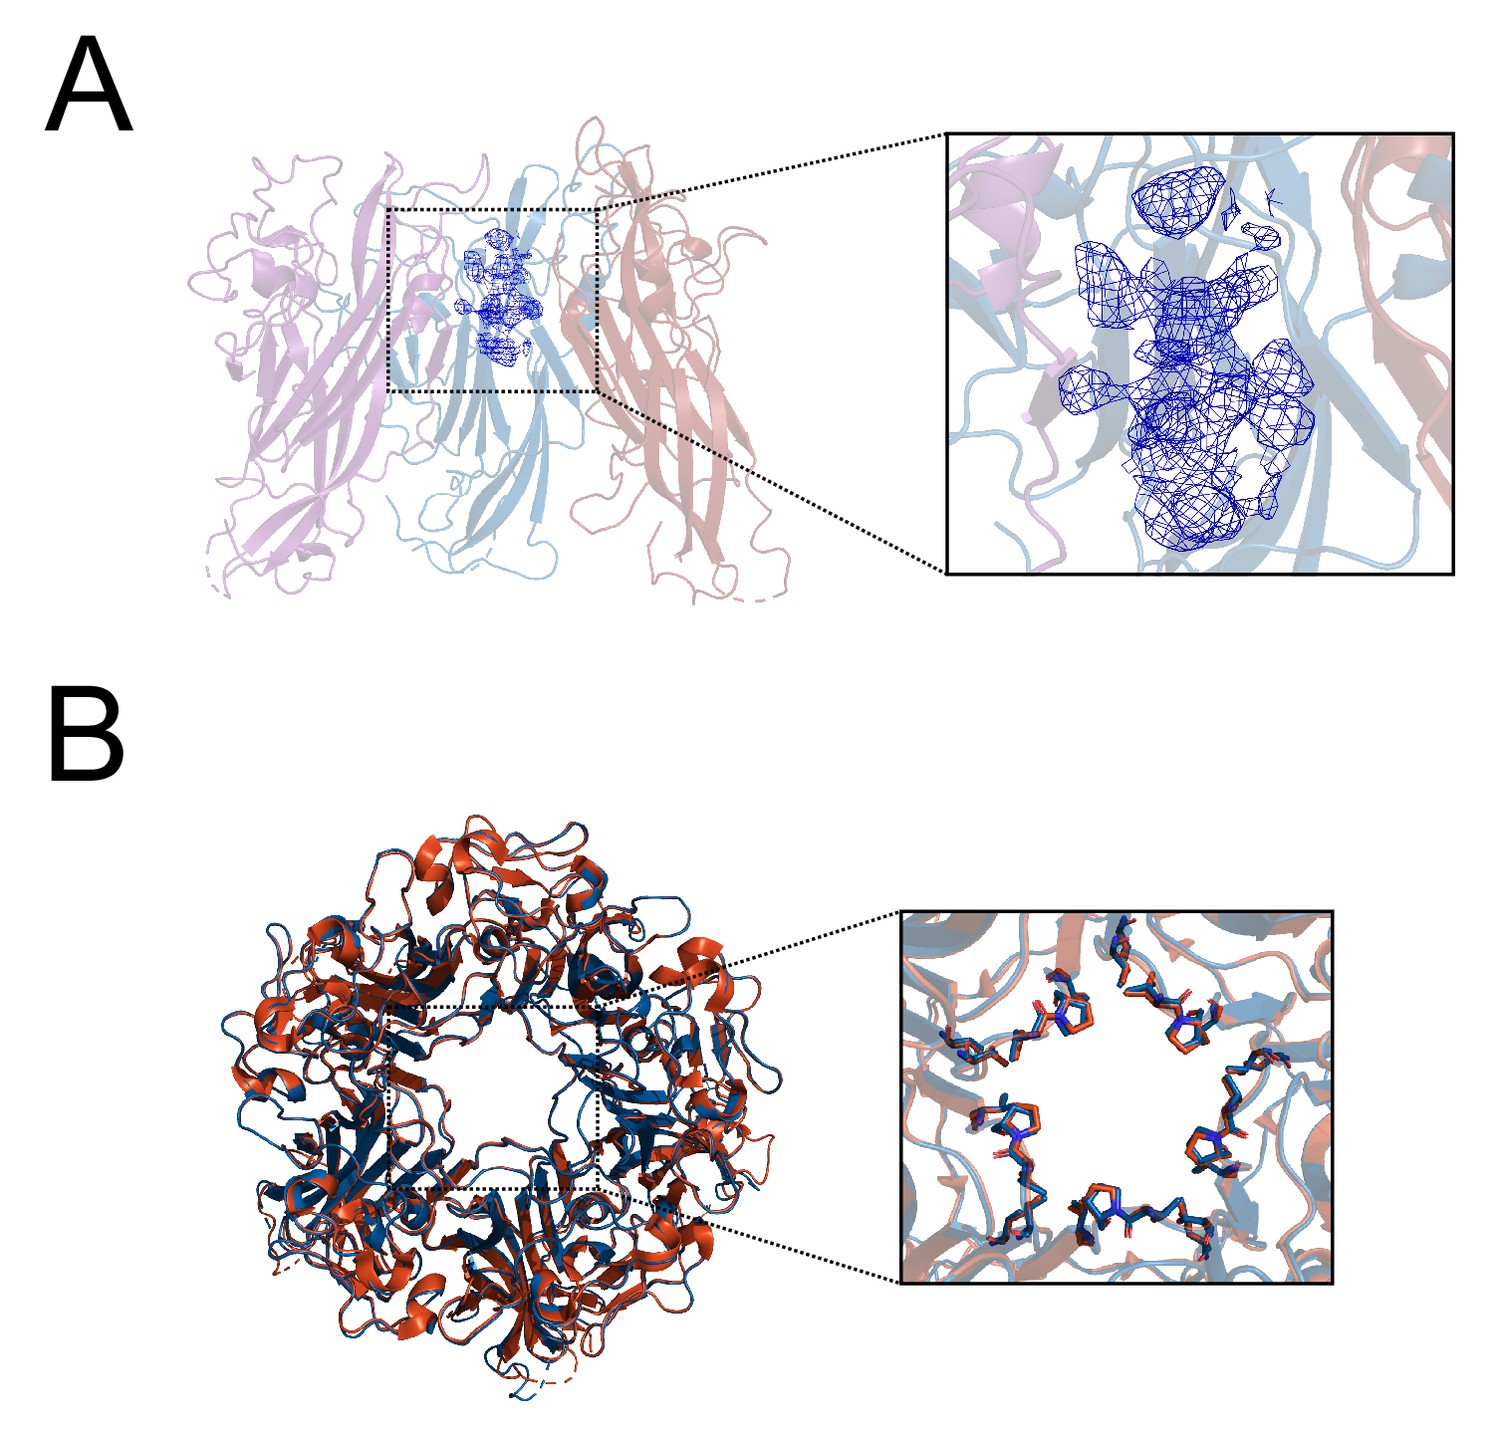
Additional description of X-ray structurally-guided model of D1min peptide in complex with VP1 pentamer.
(A) Cutaway view of structurally guided model of D1min peptide bound to BKV VP1 showing 3 VP1 molecules within the pentamer with D1min peptide bound. 2Fo-Fc electron density map, contoured at 1σ, is shown in blue. Experimental electron density is observed to occupy the upper region of the pore and has a distinct helical appearance. (B) Alignment of structurally-guided model of ligand-bound (peptide not displayed) BKV pentamer (blue) to apo BKV pentamer (orange) (PDB: 4MJ1; Neu et al., 2013) (RMSD: 0.85 Å), with magnified view of pore residues T224, T226, V231, P232, and V234 (RMSD: 0.42 Å, using previous whole-pentamer alignment).
Figure 4 with 2 supplements
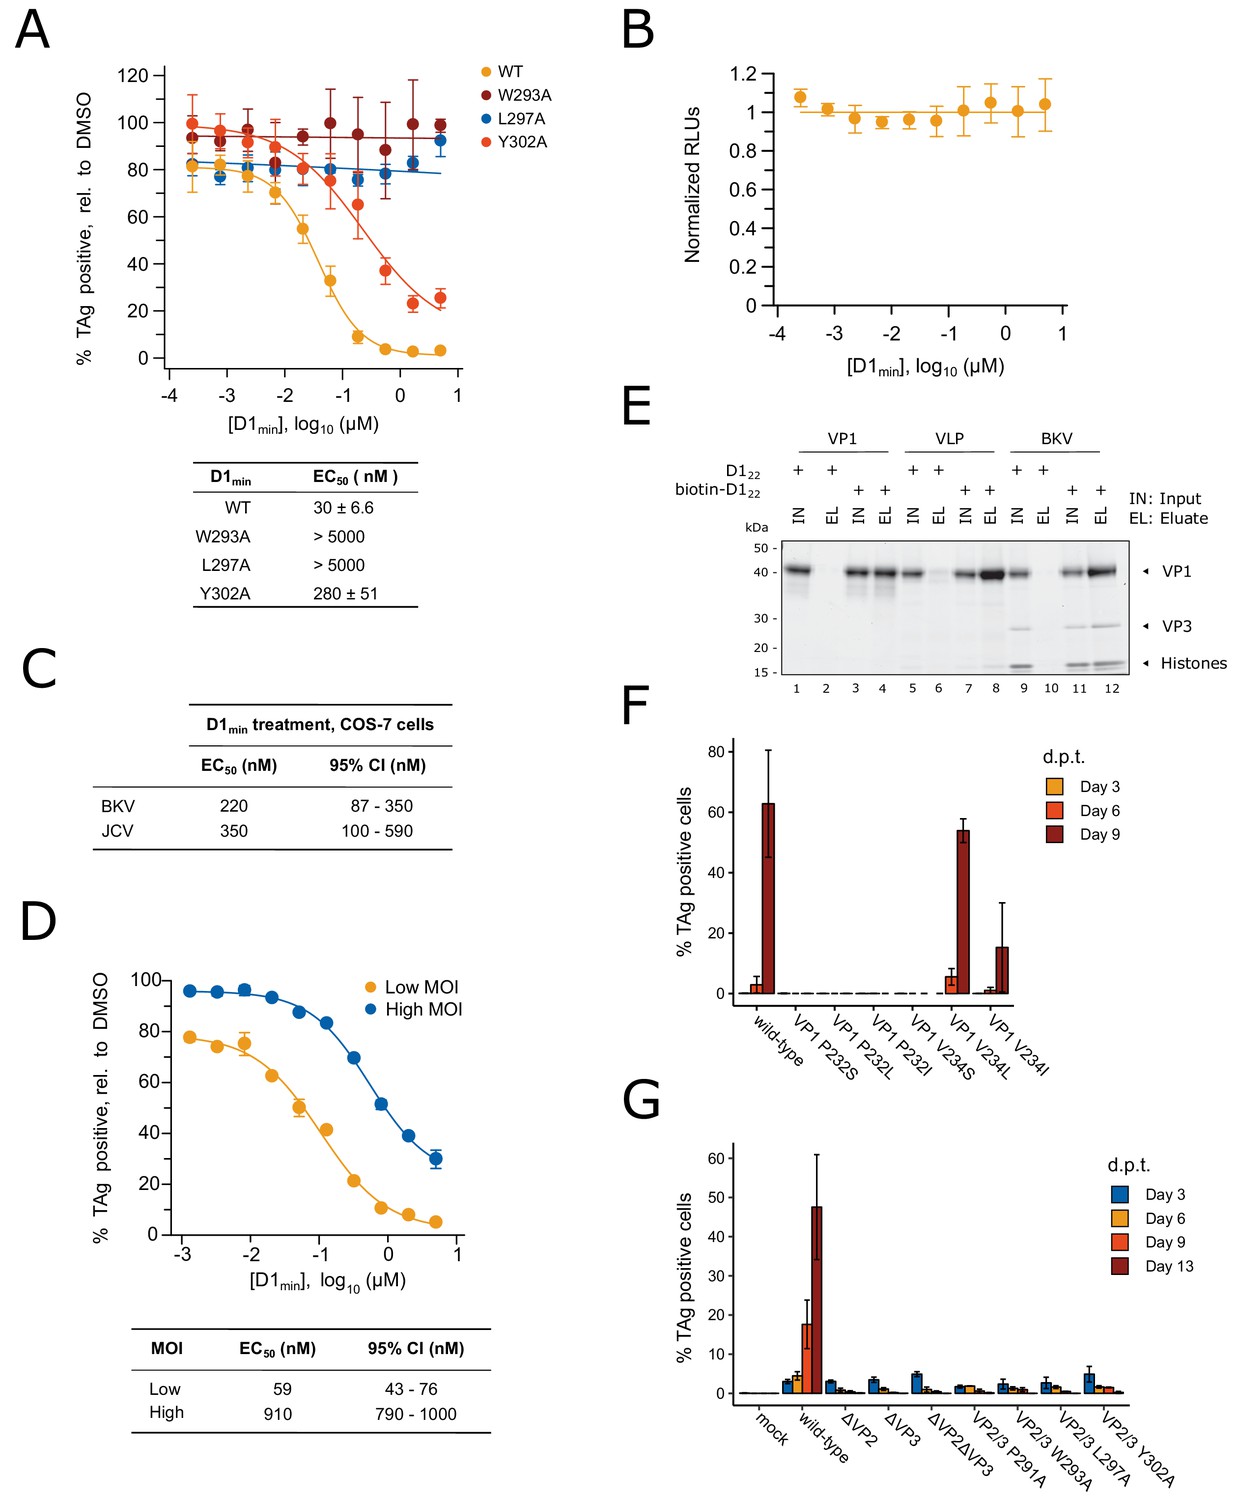
D1min peptide has nanomolar antiviral activity.
(A) Dose-response curves for wild-type D1min peptide and three alanine-substituted variants (W293A, L297A, L298A) in single-round BKV infection assay in RPTE cells (mean ± SD, n = 3), and table of derived EC50 values. Productive delivery of the viral genome to the nucleus is quantified by fraction of RPTE cells expressing BKV TAg by indirect immunofluorescent staining 48 hr post-infection (h.p.i). (B) CellTiter-Glo luminescent cell viability assay to measure D1min cytotoxicity in RPTE cells after two days of treatment. Relative light units (RLUs) are normalized to DMSO treatment (mean ± SD, n = 2). (C) D1min EC50 values with 95% confidence intervals (CI) are shown for single-round infection assay of JCV and BKV in COS-7 cells, measuring fraction of VP1 expressing cells 72 h.p.i. (D) Dose-response curves for wild-type D1min peptide in low (0.3) versus high (5) BKV MOI, measuring fraction of TAg-positive cells 48 h.p.i. EC50 values with 95% confidence intervals (CI) are shown. (E) Coomassie-stained gel showing streptavidin purification of VP1 pentamers, BK VLPs, or infectious BKV virions using either D122 or biotinylated-D122 peptide. (F) BKV spreading infection assay with VP1 pore mutants, measuring TAg-positive cells 3, 6, and 9 days post-transfection of BKV genomic DNA. d.p.t.: days post-transfection (mean ± SD, n = 2). (G) Same as (F), with BKV VP2/3 mutants (mean ± SD, n = 3). While residue position is relative to VP2, VP2/3 indicates mutation is present in both proteins.
Figure 4—figure supplement 1

D122 peptide requires N-terminal biotinylation to co-purify BKV VP1.
(A) Coomassie-stained SDS-PAGE of streptavidin-based affinity purification of biotinylated D122 peptides, assaying for co-affinity purification of VP1 protein in Figure 4. Sequences for peptides used in this assay can be found in Supplementary file 2. VLP: virus-like particle.
Figure 4—figure supplement 2
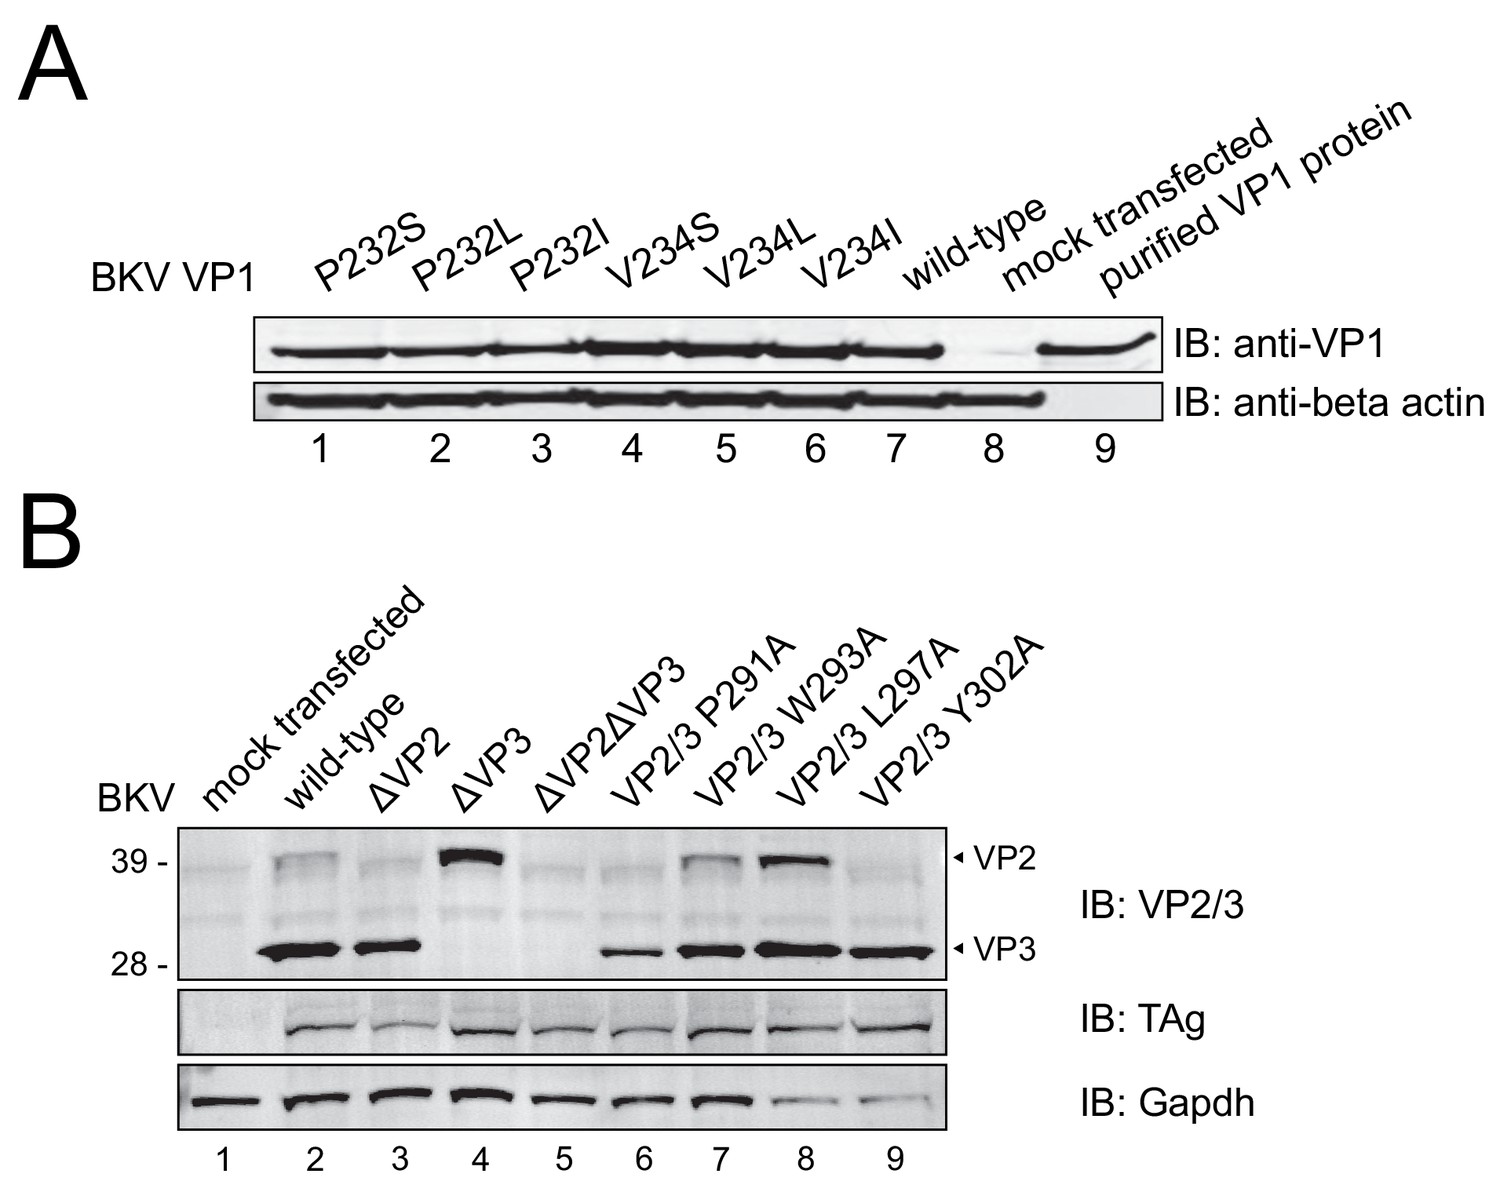
Expression of mutant BKV VP1 and VP2/3 proteins.
Figure 5 with 3 supplements
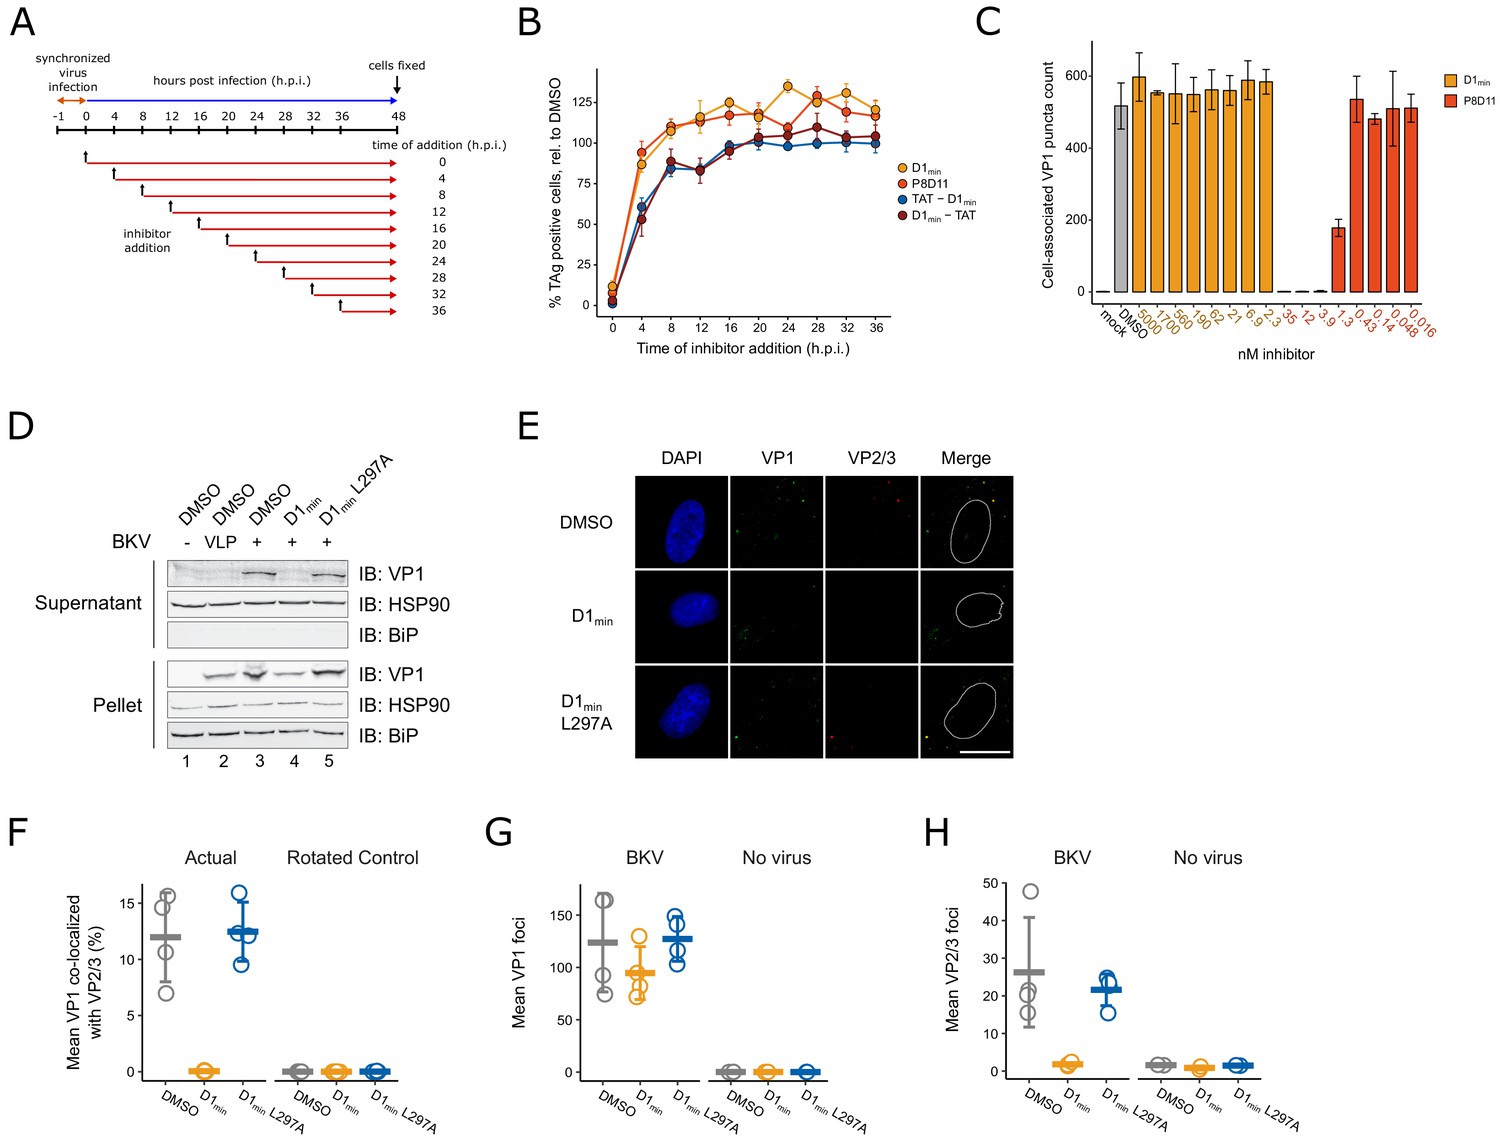
D1min inhibits key steps in virion processing during entry.
(A) Schematic of time-of-addition assay. (B) Time-of-addition assay with D1min, cell-penetrating peptides TAT-D1min and D1min-TAT, and anti-BKV neutralizing antibody P8D11. BKV infected cells were treated with inhibitors at 10-fold over measured EC50 concentrations. Productive delivery of the viral genome to the nucleus is measured by the fraction of RPTE cells expressing BKV TAg by indirect immunofluorescent staining 48 hr post-infection (h.p.i), relative to DMSO-treated samples (mean ± SD, n = 4). (C) Virus cell binding inhibitor assay. BKV was treated with indicated inhibitor at indicated concentrations for 1 hr on ice, adsorbed to cells for 1 hr at 4°C, unbound virus washed away, and remaining cell-associated virus measured by indirect immunofluorescent staining of VP1 (mean ± SD, n = 3). (D) ER-to-cytosol retrotranslocation assay. RPTE cells subjected to a synchronized BKV infection (high MOI), cells were harvested 24 h.p.i, and lysates were fractionated into a supernatant (cytoplasmic) and pellet fraction. Fractions were then analyzed by SDS-PAGE, and VP1 protein and cellular compartment markers were detected by immunoblotting. (E) Representative microscopy images of VP2/3 exposure assay. Minor capsid proteins were detected using a polyclonal antibody able to recognize both VP2 and VP3. Scale bar: 20 μm. (F) Quantification of images exemplified in (E), measuring fraction of VP1 stain co-localizing with VP2/3 stain, averaged per well. Rotated data indicate calculated co-localization between VP1 and VP2/3 stains after rotating VP2/3 images 90° to assess rate of random association between the two (mean ± SD, n = 4). (G) Quantification of VP1 foci in images exemplified in (E), averaged per well (mean ± SD, n = 4 for infected samples, n = 2 for uninfected samples). (H) Quantification of VP2/3 foci in images exemplified in (E), averaged per well (mean ± SD, n = 4 for infected samples, n = 2 for uninfected samples).
Figure 5—figure supplement 1

RT-qPCR assay for induction of innate immunity-associated genes.
(A) CT values for RT-qPCR assay measuring induction of GAPDH, CXCL10, IFNA2, IFNB1, MX1, OAS1, and STAT1 in RPTE cells after 20 hr of treatment with DMSO, 5 μM of D1min WT or L297A, or 1000 U/mL IFN-β. A threshold of 0.1 was applied to calculate CT values from samples run in triplicate. (B) Fold-change in expression of assayed genes in RPTE cells. Gene expression relative fold-change was calculated using ΔΔCT method normalized to GAPDH expression and relative to DMSO treatment.
Figure 5—figure supplement 2
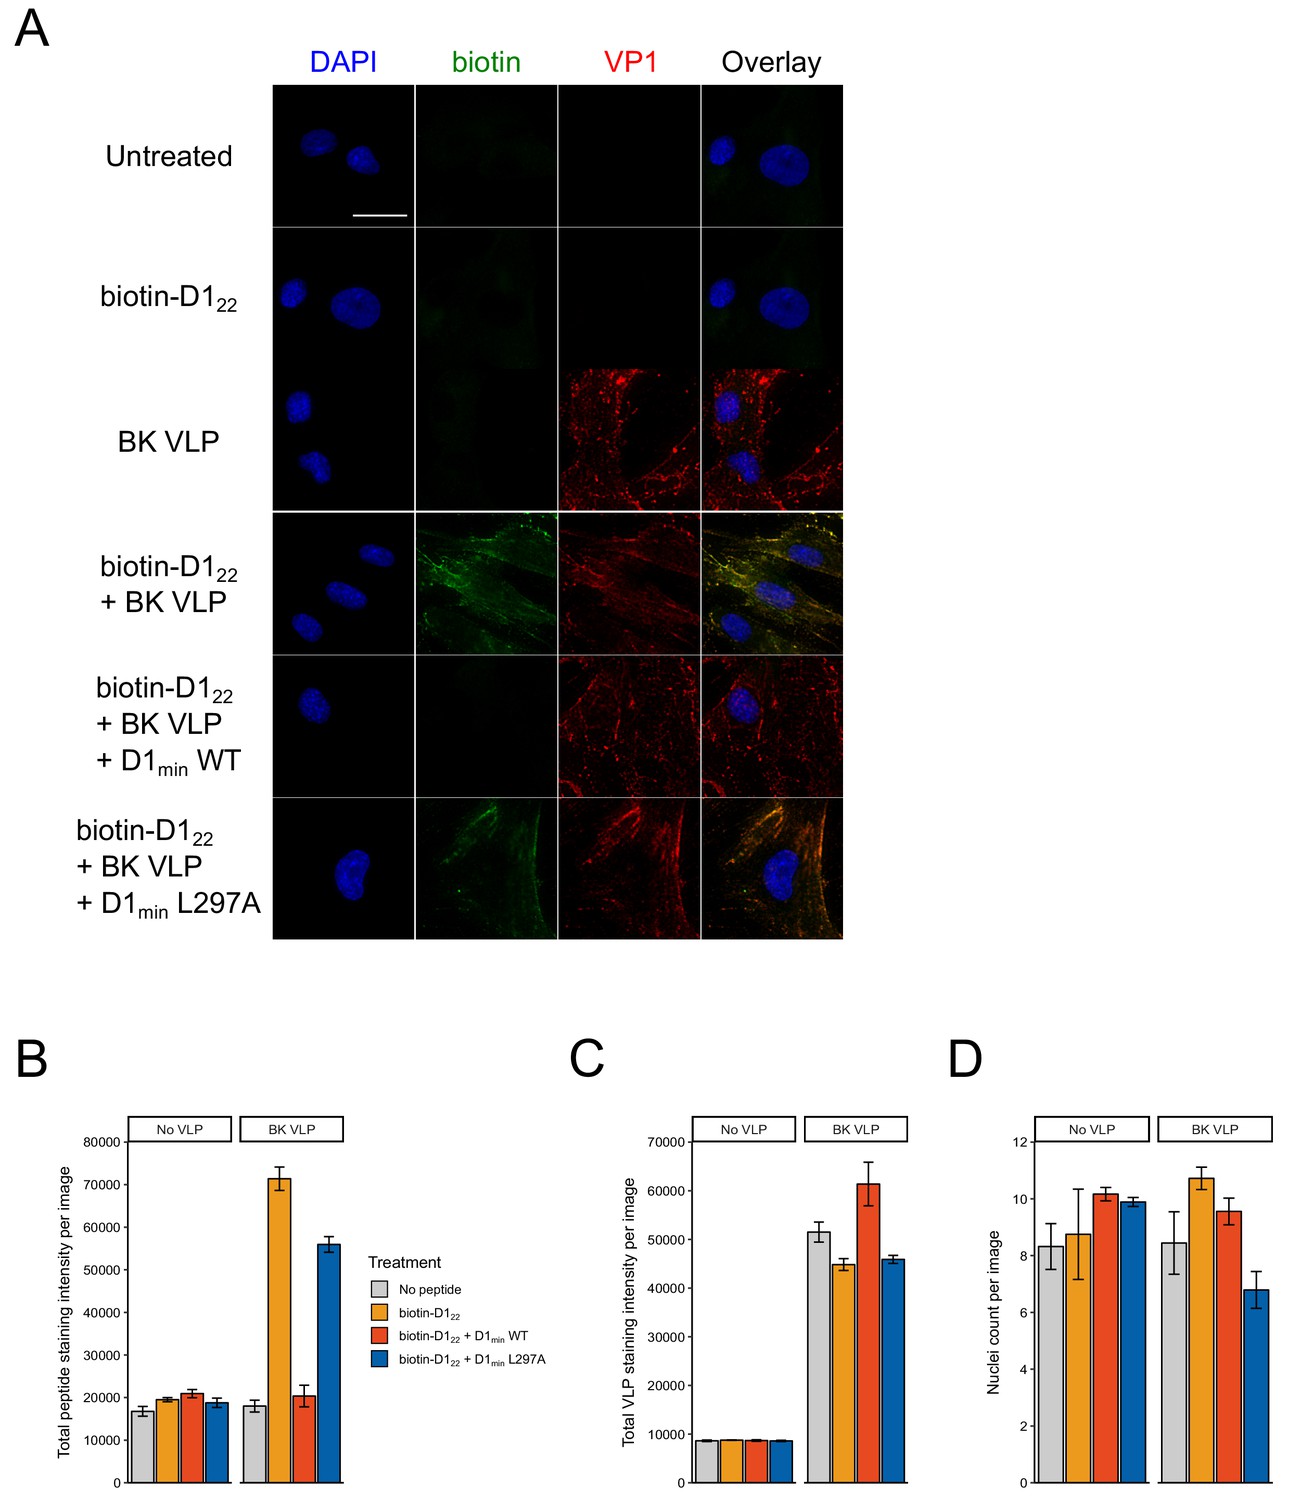
D122 peptide does not bind to RPTE cells in the absence of BK VLPs.
(A) Representative microscopy images of peptide-cell binding assay. RPTE cells were treated for 1 hr at 37°C with 1 μM N-terminal biotinylated D122 peptide and/or 10 nM BK VLP. Unlabeled peptide (D1min WT and L297A) were added in 5-fold excess of biotinylated D122 to control for non-specific peptide binding. Scale bar: 25 μm. (B) Quantification of total biotin stain intensity (AlexaFluor 488) per treatment (mean ± SD, n = 2). (C) Same as (B), quantifying total VP1 (VLP) stain intensity (AlexaFluor 647) per treatment (mean ± SD, n = 2). (D) Quantification of cell nuclei per treatment (mean ± SD, n = 2).
Figure 5—figure supplement 3
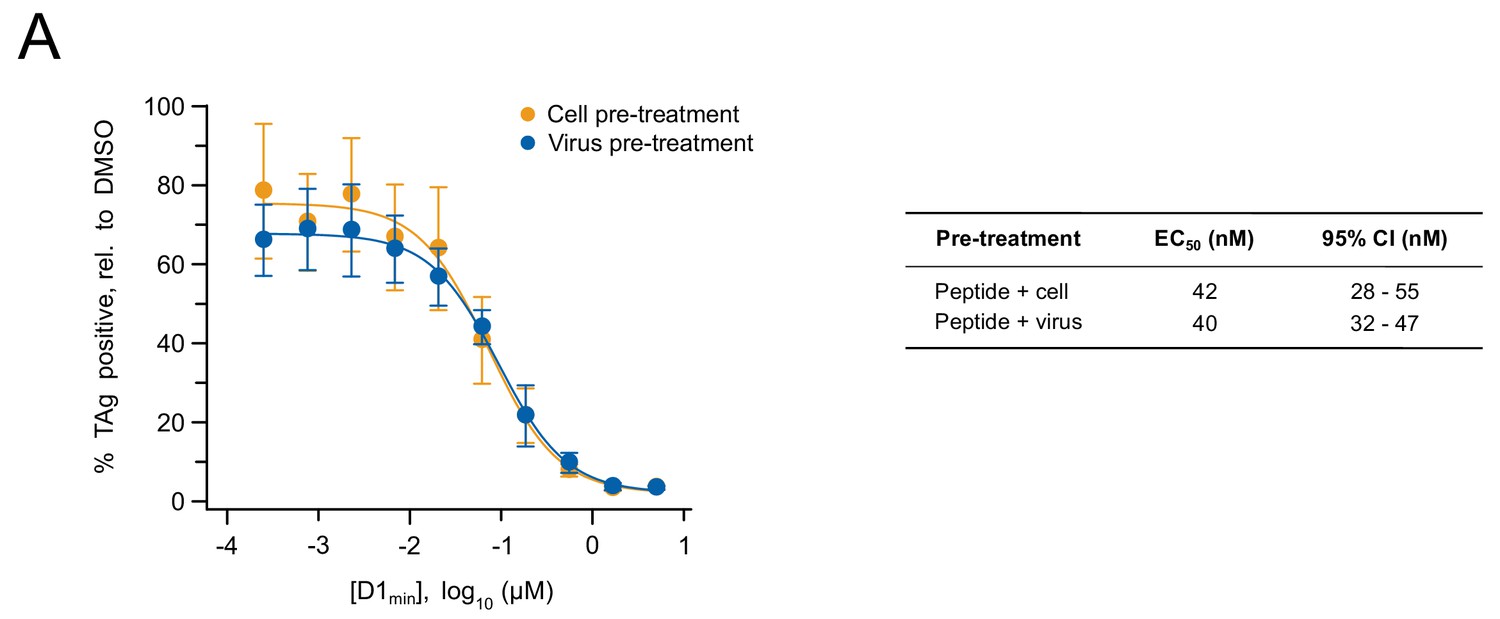
D1min antiviral potency is unaffected by pre-treatment of cells versus pre-treatment of virus.
(A) Dose-response curves for D1min WT peptide pre-treatment of RPTE cells (yellow) or BKV (blue) for 2 hr prior to infection. Productive trafficking of viral genome to the host cell nucleus is measured by % T-antigen expressing cells 48 h.p.i., relative to DMSO treatment (mean ± SD, n = 4). Calculated EC50 values and 95% confidence intervals (CI) are shown.
Tables
Table 1
Peptide IC50 and KD measurements.
Values are mean ± SD where applicable (AlphaScreen: n = 3; SPR: n = 2). ND: Not determined.
| Peptide Name | Sequence | AlphaScreen VP1 IC50 (nM) | SPR VP1 KD (nM) | Relative IC50 (vs D1min) | Relative KD (vs D1min) |
|---|---|---|---|---|---|
| D122 | APGGANQRTAPQWMLPLLLGLY | 11 ± 2.9 | 4.8 | 2.8 | 3.6 |
| D1min | Ac-APQWMLPLLLGLY-NH2 | 3.6 ± 0.57 | 1.4 ± 0.49 | 1.0 | 1.0 |
| D1min P291A | Ac-AAQWMLPLLLGLY-NH2 | 3.6 ± 0.16 | 3.6 | 1.0 | 2.9 |
| D1min Q292A | Ac-APAWMLPLLLGLY-NH2 | 15 ± 1.2 | 18 | 3.8 | 13 |
| D1min W293A | Ac-APQAMLPLLLGLY-NH2 | 3600 ± 380 | 920 ± 190 | 900 | 660 |
| D1min M294A | Ac-APQWALPLLLGLY-NH2 | 220 ± 18 | 100 | 55 | 71 |
| D1min L295A | Ac-APQWMAPLLLGLY-NH2 | 130 ± 34 | 110 ± 15 | 32 | 75 |
| D1min P296A | Ac-APQWMLALLLGLY-NH2 | 27 ± 7.9 | 51 ± 39 | 6.8 | 36 |
| D1min L297A | Ac-APQWMLPALLGLY-NH2 | 5200 ± 1100 | 1600 ± 610 | 1300 | 1200 |
| D1min L298A | Ac-APQWMLPLALGLY-NH2 | 2000 ± 310 | 1000 ± 160 | 500 | 720 |
| D1min L299A | Ac-APQWMLPLLAGLY-NH2 | 140 ± 24 | 97 ± 11 | 35 | 69 |
| D1min G300A | Ac-APQWMLPLLLALY-NH2 | 8.5 ± 0.83 | 9.3 | 2.0 | 6.4 |
| D1min L301A | Ac-APQWMLPLLLGAY-NH2 | 14 ± 1.6 | 11 | 3.5 | 7.9 |
| D1min Y302A | Ac-APQWMLPLLLGLA-NH2 | 62 ± 6.5 | 70 ± 3.8 | 16 | 50 |
| D1min HEX1 | Ac-APQWML-NH2 | 140 ± 44 | ND | 35 | ND |
| D1min HEX2 | Ac-PQWMLP-NH2 | 1100 ± 270 | ND | 280 | ND |
| D1min HEX3 | Ac-QWMLPL-NH2 | 1800 ± 400 | ND | 450 | ND |
| D1min HEX4 | Ac-WMLPLL-NH2 | 15000 ± 4500 | ND | 3800 | ND |
| D1min HEX5 | Ac-MLPLLL-NH2 | 17000 ± 3500 | ND | 4200 | ND |
| D1min HEX6 | Ac-LPLLLG-NH2 | 38000, >40000, >40000 | ND | 9600 | ND |
| D1min HEX7 | Ac-PLLLGL-NH2 | 19000 ± 2500 | ND | 4700 | ND |
| D1min HEX8 | Ac-LLLGLY-NH2 | 490 ± 120 | ND | 120 | ND |
Additional files
-
Supplementary file 1
JCV VP1 peptide binding data.
- https://cdn.elifesciences.org/articles/50722/elife-50722-supp1-v1.xls
-
Supplementary file 2
Additional peptide information.
- https://cdn.elifesciences.org/articles/50722/elife-50722-supp2-v1.xls
-
Supplementary file 3
Data collection and refinement statistics (molecular replacement).
- https://cdn.elifesciences.org/articles/50722/elife-50722-supp3-v1.xls
-
Supplementary file 4
Control inhibitor half-maximal effective concentrations (EC50) and half-maximal cytotoxic concentrations (CC50).
- https://cdn.elifesciences.org/articles/50722/elife-50722-supp4-v1.xls
-
Supplementary file 5
Key resources table.
- https://cdn.elifesciences.org/articles/50722/elife-50722-supp5-v1.docx
Download links
A two-part list of links to download the article, or parts of the article, in various formats.
Downloads (link to download the article as PDF)
Open citations (links to open the citations from this article in various online reference manager services)
Cite this article (links to download the citations from this article in formats compatible with various reference manager tools)
A polyomavirus peptide binds to the capsid VP1 pore and has potent antiviral activity against BK and JC polyomaviruses
eLife 9:e50722.
https://doi.org/10.7554/eLife.50722


