MYC and Twist1 cooperate to drive metastasis by eliciting crosstalk between cancer and innate immunity
- Stanford University, United States
- University of Iowa Hospitals and Clinics, United States
- Johns Hopkins University School of Medicine, United States
- Stanford University School of Medicine, United States
- NYU Langone Medical Center, United States
Figures
Figure 1 with 1 supplement
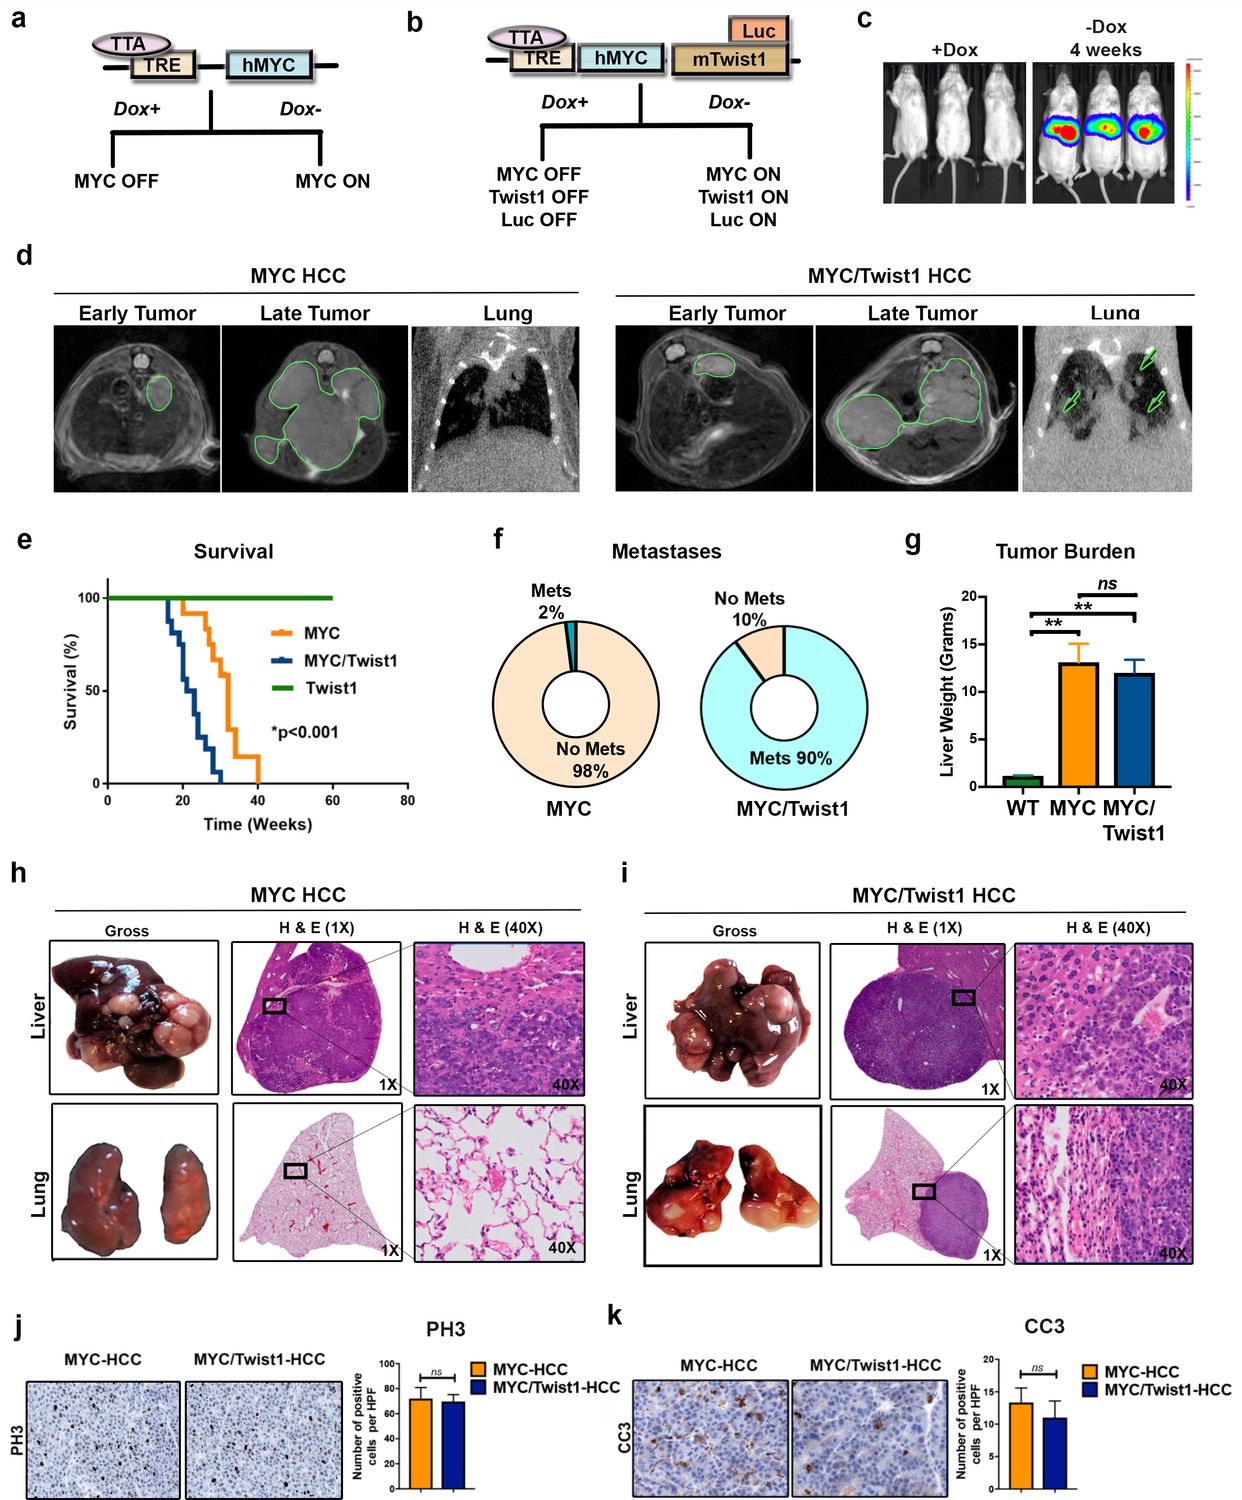
Twist1 induces spontaneous metastatic progression of MYC driven HCC in vivo.
(a) Mouse model of MYC induced HCC where MYC is under the control of a tetracycline responsive element (TRE) which contain the tetracycline-controlled transactivator protein (tTA) driven by the liver-enriched activator protein (LAP). Doxycycline (Dox) can be used to inactivate oncogene expression in adult mice. (b) Mouse model of MYC/Twist1-induced HCC which inducibly co-expressed MYC, Twist1 and firefly luciferase in a hepatocyte specific manner. (c) Bioluminescent imaging (BLI) confirms in vivo rapid induction of oncogenes by demonstrating liver specific luciferase expression upon withdrawal of Dox. (d) Serial cross sectional imaging of MYC- (n = 10) and MYC/Twist1-HCC (n = 10) using MRI scan for the abdomen and CT scan for the lungs demonstrate step-wise tumor progression. Both MYC and MYC/Twist1 mice develop multifocal liver tumors but only the latter develops lung metastases. (e) Kaplan Meier survival curves show that MYC/Twist1 mice (n = 16) had significantly shorter survival than MYC mice (n = 12) (**p<0.01) while Twist1 transgenic mice (n = 10) remained healthy. (f) Pie charts show incidence of metastasis in MYC- (n = 50) and MYC/Twist1 transgenic mice (n = 50). (g) Comparison of liver weights between MYC (n = 3) and MYC/Twist1 tumor bearing mice (n = 4) and control mice (n = 3) which were kept on Dox throughout (**p<0.01). (h) Gross and histopathologic appearance of tumors in MYC transgenic model confirming HCC. Lungs do not show any metastases. (i) Representative images showing MYC/Twist1-HCC have histologic appearance of HCC and lung histology shows metastatic disease. (j) Representative images from Immunohistochemistry to show phospho histone three (PH3) expression in MYC- and MYC/Twist1-HCC with quantification of IHC staining. (k) Representative images from Immunohistochemistry to show Cleaved Caspase three (CC3) expression in MYC- and MYC/Twist1-HCC with quantification of IHC staining.
Figure 1—figure supplement 1
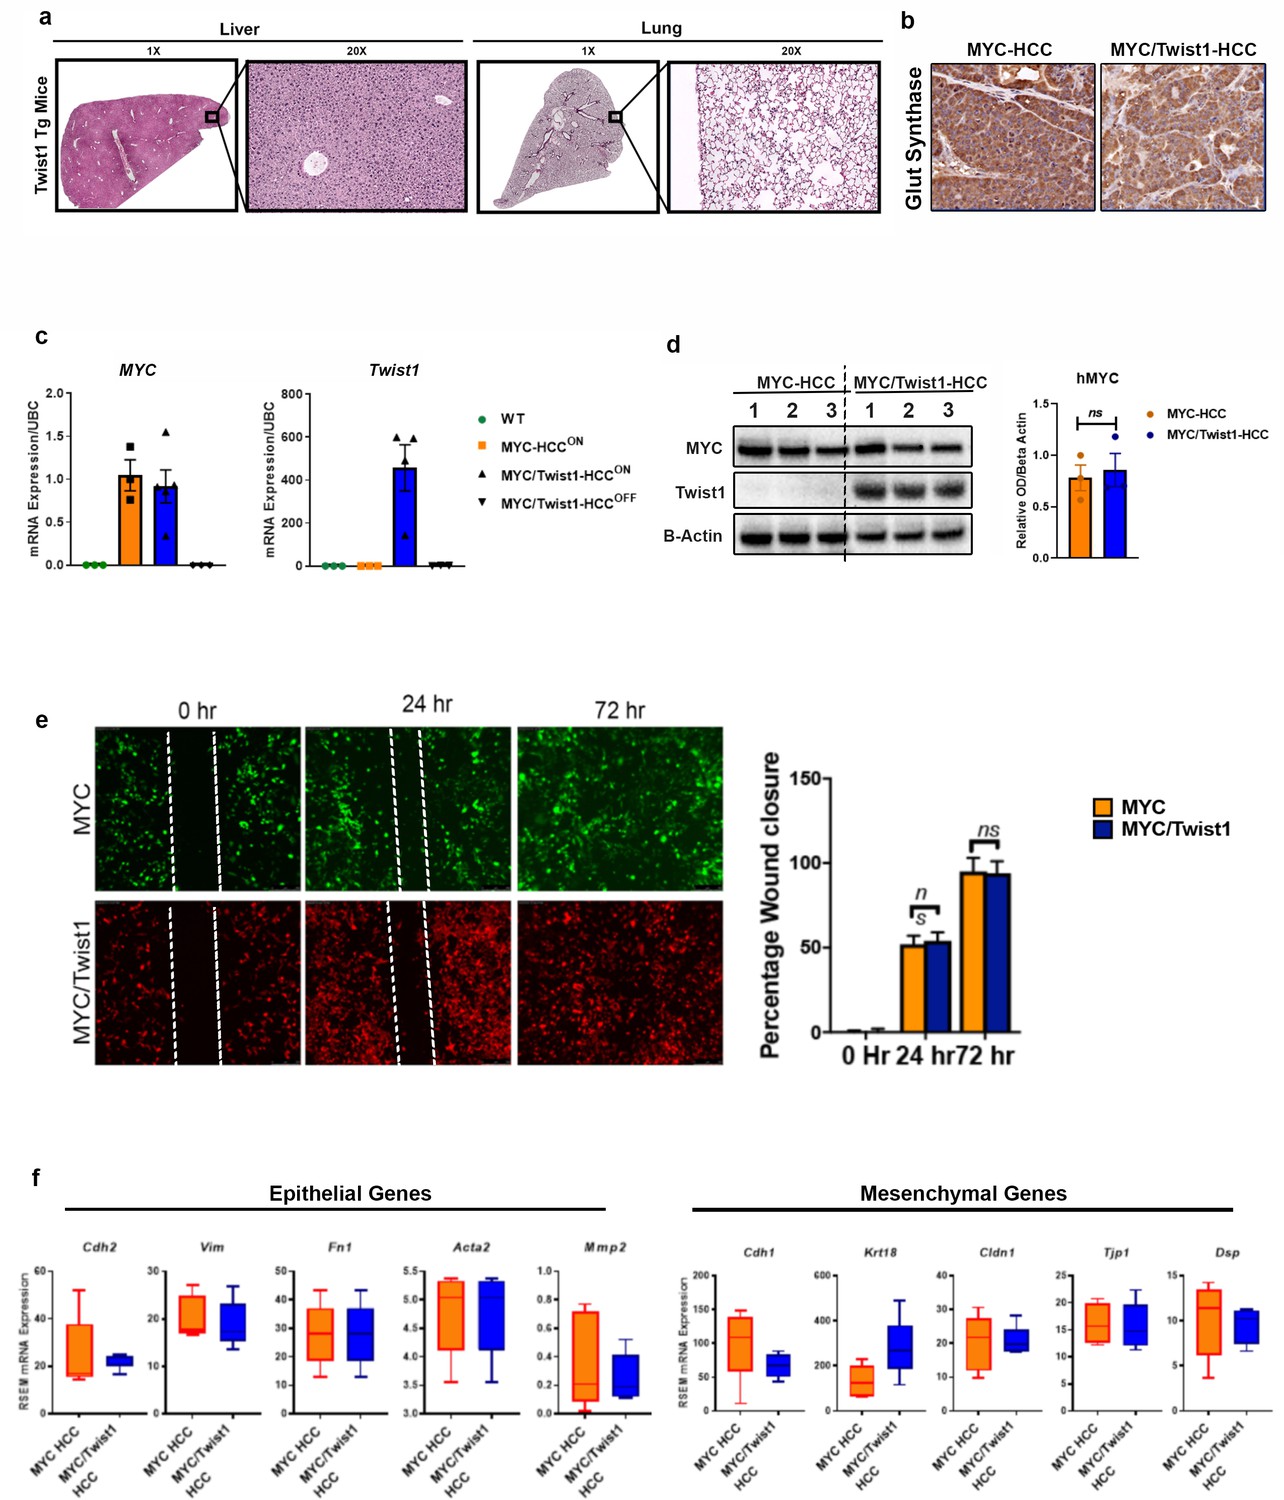
Twist1drives metastasis ofMYC-induced HCC by non-cell-autonomous mechanisms.
(a) Representative images from liver and lung (1X and 10X) H and E from liver and lungs of mice with Twist1-transgenic mice demonstrating lack of pathology. (b) Representative images from immunohistochemistry for glutamine synthetase (Glut Synthase) in MYC- and MYC/Twist1-HCC. (c) Quantification of mRNA expression levels of MYC and Twist1 in wild type mice (WT), MYC-HCC, MYC/Twist1-HCC and upon oncogene inactivation (MYC/Twist1 Off). (d) Representative images from immunoblotting of MYC and Twist1 levels in MYC- and MYC/Twist1-HCC with quantification of densitometry. (e) Wound healing assay to assess migratory capacity of MYC (n = 3 biological replicates with three technical replicates each) and MYC/Twist1 cells (n = 3 biological replicates with three technical replicates each) at 0 hr, 24 hr and 72 hr with bar graph showing quantification. (f) Transcriptomic expression of epithelial and mesenchymal markers between MYC- (n = 5) and MYC/Twist1-HCC (n = 5) in primary tumors.
Figure 2 with 1 supplement
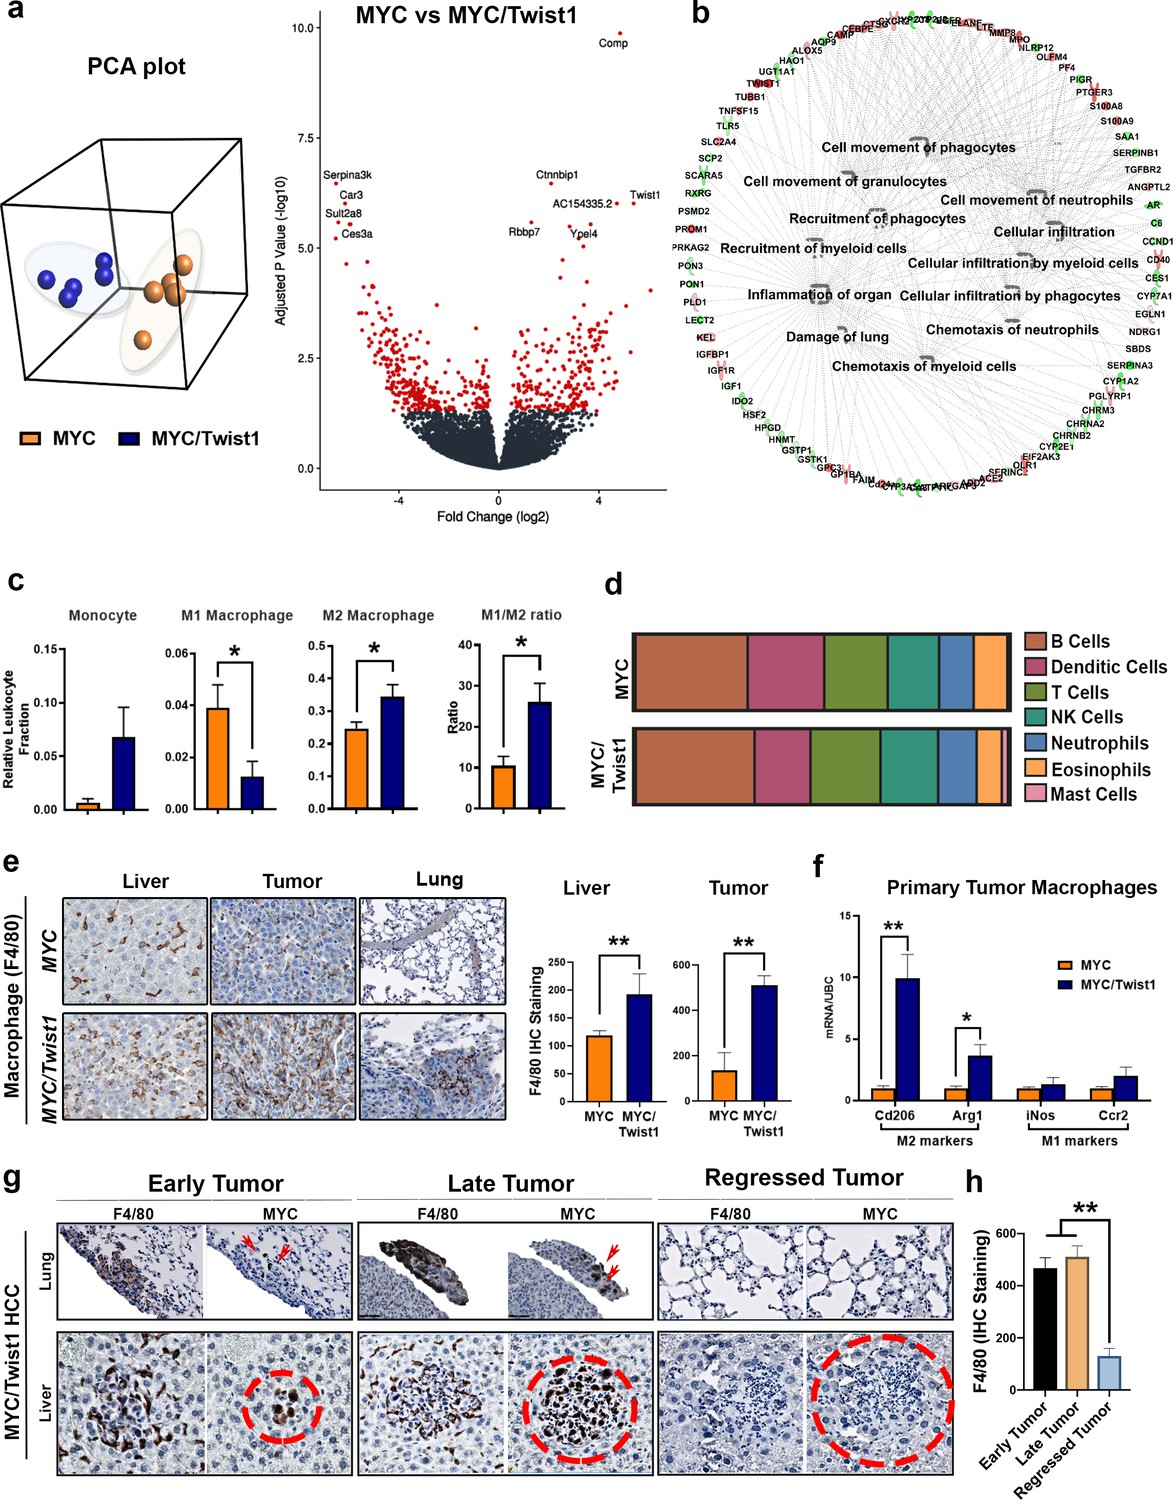
MYC and Twist1 cooperate to remodel the tumor immune microenvironment.
(a) Principal component analysis (PCA) showed that MYC- (n = 5) and MYC/Twist1-HCC (n = 5) overall had distinct, non-overlapping expression profiles. Volcano plot shows comparative analysis of differentially expressed genes between the MYC-HCC and MYC/Twist1-HCC. (b) Ingenuity pathway analysis of differentially expressed genes between MYC/Twist1- (n = 5) and MYC-HCC (n = 5) used to identify top biological processes upregulated in MYC/Twist1-HCC. (c) Comparison of relative percentage of monocyte and macrophage subpopulations, derived using CIBERSORT analysis, between MYC- (n = 5) and MYC/Twist1-HCC (n = 5) (*p<0.05). (d) Comparison of relative abundance of major immune subsets between MYC- (n = 5) and MYC/Twist1-HCC (n = 5) (p=ns). (e) Representative images from Immunohistochemistry staining for F4/80 in MYC and MYC/Twist1 normal liver (n = 4), primary tumor (n = 4) and lung (n = 4) with quantification in bar graph (*p<0.05, **p<0.01). (f) Macrophages were isolated from primary tumors and expression level of M2 markers (Cd206, Arg1) and M1 markers (iNos, Ccr2) was compared between MYC- and MYC/Twist1-HCC (*p<0.05). (g) Representative images from IHC staining for MYC and F4/80 in MYC/Twist1 HCC in temporal sequence from early tumor (n = 5) to later tumor (n = 5) and tumor regression (n = 5) upon oncogene inactivation. (h) Quantification of F4/80 staining in early tumor vs late tumor vs regressed MYC/Twist1-HCC (**p<0.01).
Figure 2—figure supplement 1
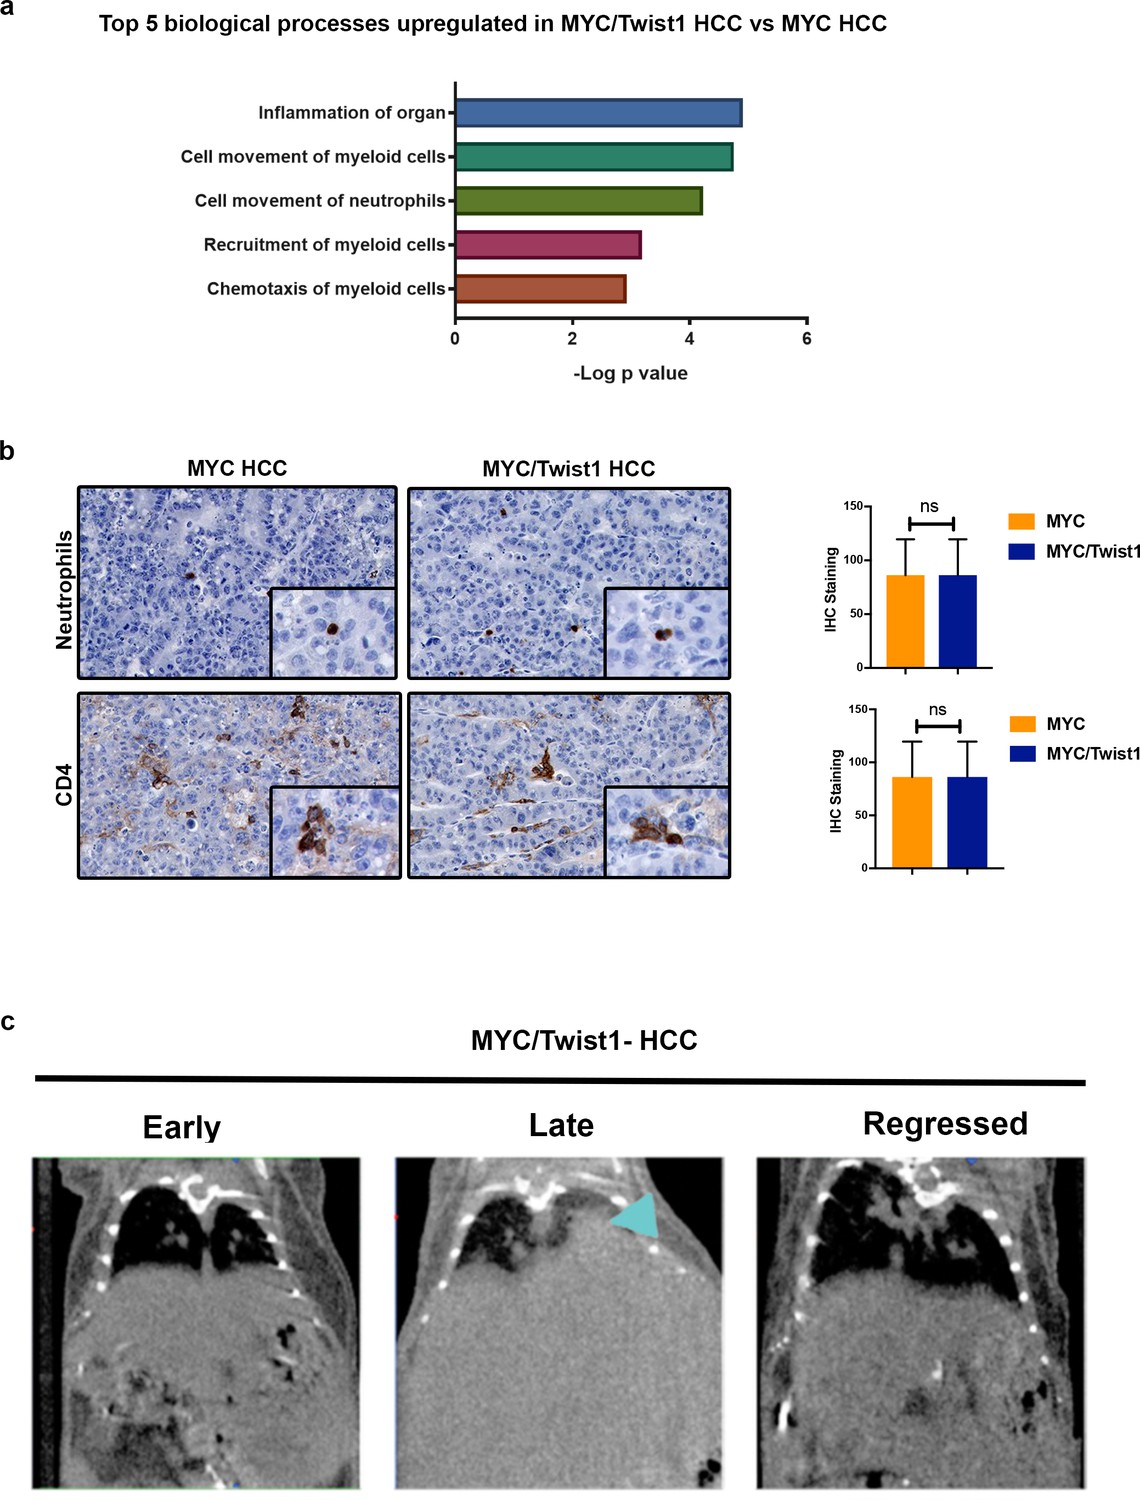
Tumor Microenvironment changes in MYC/Twist1 HCC.
(a) The top biological processes upregulated in genes differentially expressed in MYC/Twist1- (n = 5) versus MYC-HCC (n = 5) in transgenic mouse primary tumor tissue. (b) Representative images from immunohistochemistry staining for neutrophil marker and CD4 in primary liver tumors from MYC- and MYC/Twist1-HCC. Bar graphs show quantification of IHC staining. (c) Representative images from CT lungs of early tumor, late tumor and regression tumor demonstrating oncogene addiction. Arrows indicate lung metastasis.
Figure 3 with 1 supplement
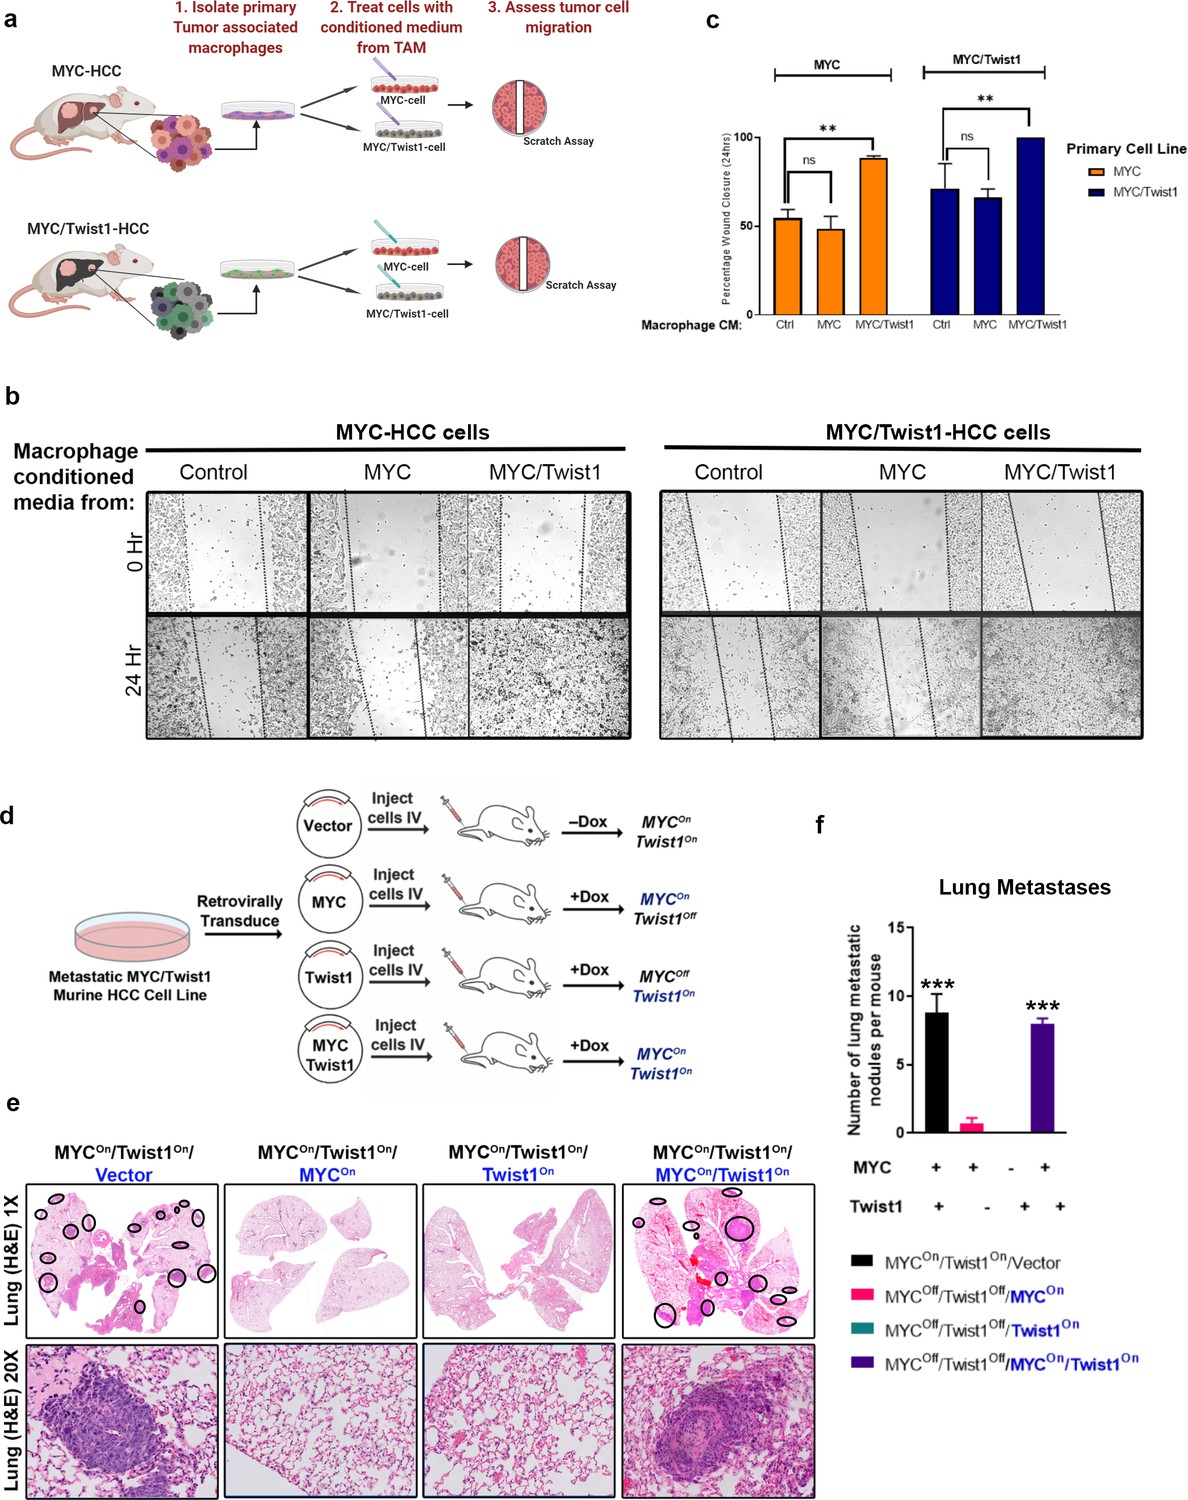
Coordinate expression of both MYC and Twist1 are necessary for inducing metastasis.
(a) Schematic of the experiment to extract tumor associated macrophages from the primary tumors of MYC- (n = 5) and MYC/Twist1-HCC (n = 5). Conditioned media from macrophages extracted from MYC-HCC (n = 3 biological replicates with three technical replicates each) or MYC/Twist1-HCC tumors (n = 3 biological replicates with three technical replicates each) was used to treat either MYC- or MYC/Twist1-HCC cells. (b) Wound healing assay was performed in MYC- or MYC/Twist1-HCC cells which were treated with conditioned media derived from TAMs isolated from primary MYC- or MYC/Twist1-HCC. (c) Bar graphs show quantification of percentage wound closure at 24 hr (**p<0.01). (d) Schematic showing generation of cell lines which constitutively express MYC and/or Twist1 (blue font) upon transgene inactivation with Dox treatment. (e) H and E (1X and 20X) of lungs of mice injected with the four different cell lines as shown in their individual titles. (f) Quantification of lung metastatic burden upon intravenous (IV) injection of cell lines expressing either MYC or Twist1 alone or both (***p<0.001).
Figure 3—figure supplement 1
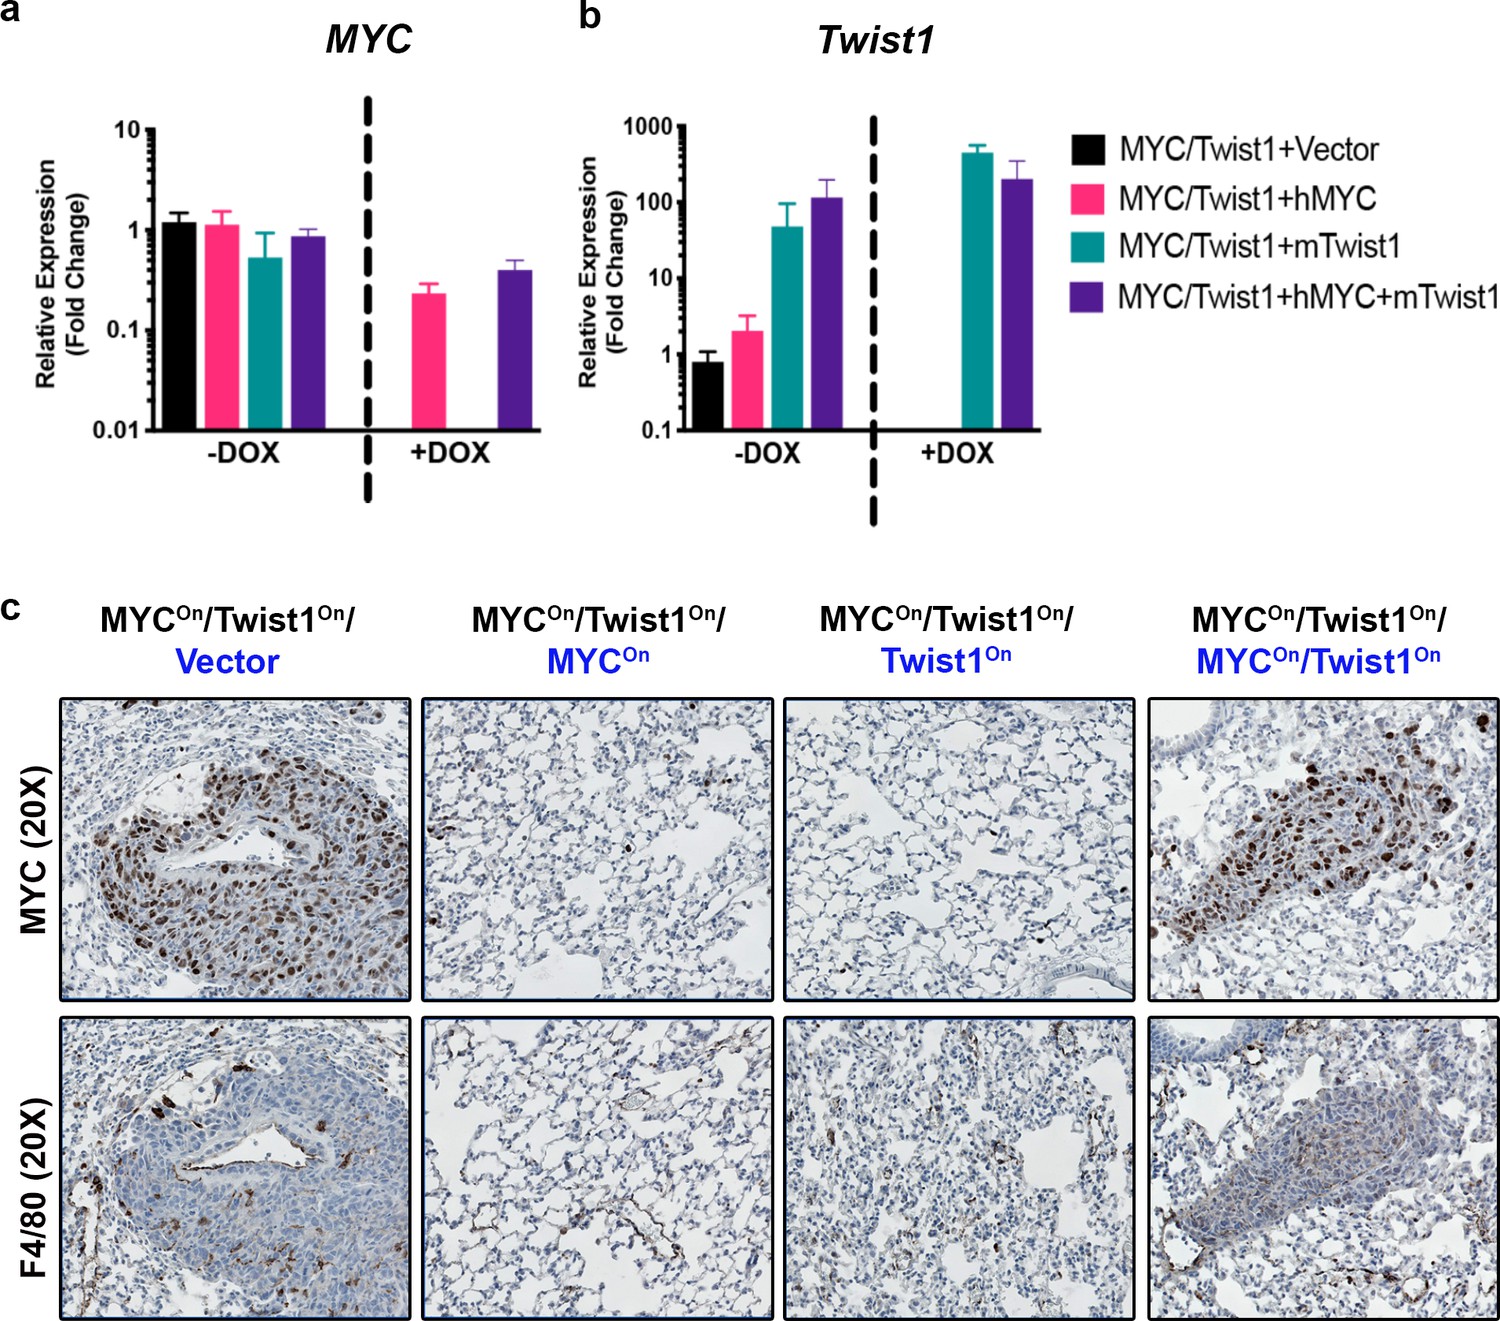
MYC and Twist1 cooperate to induce recruitment of tumor associated macrophages.
(a) Expression of MYC upon Dox treatment of MYC/Twist-HCC cells stably transfected with MYC or Twist1 or control vector, quantified by qPCR. (b) Expression of Twist1 upon Dox treatment of MYC/Twist-HCC cells stably transfected with MYC or Twist1 or control vector, quantified by qPCR. (c) Immunohistochemical staining for MYC and macrophages (F4/80) of lungs of mice injected with the respective cell lines as shown in the top panel.
Figure 4 with 1 supplement
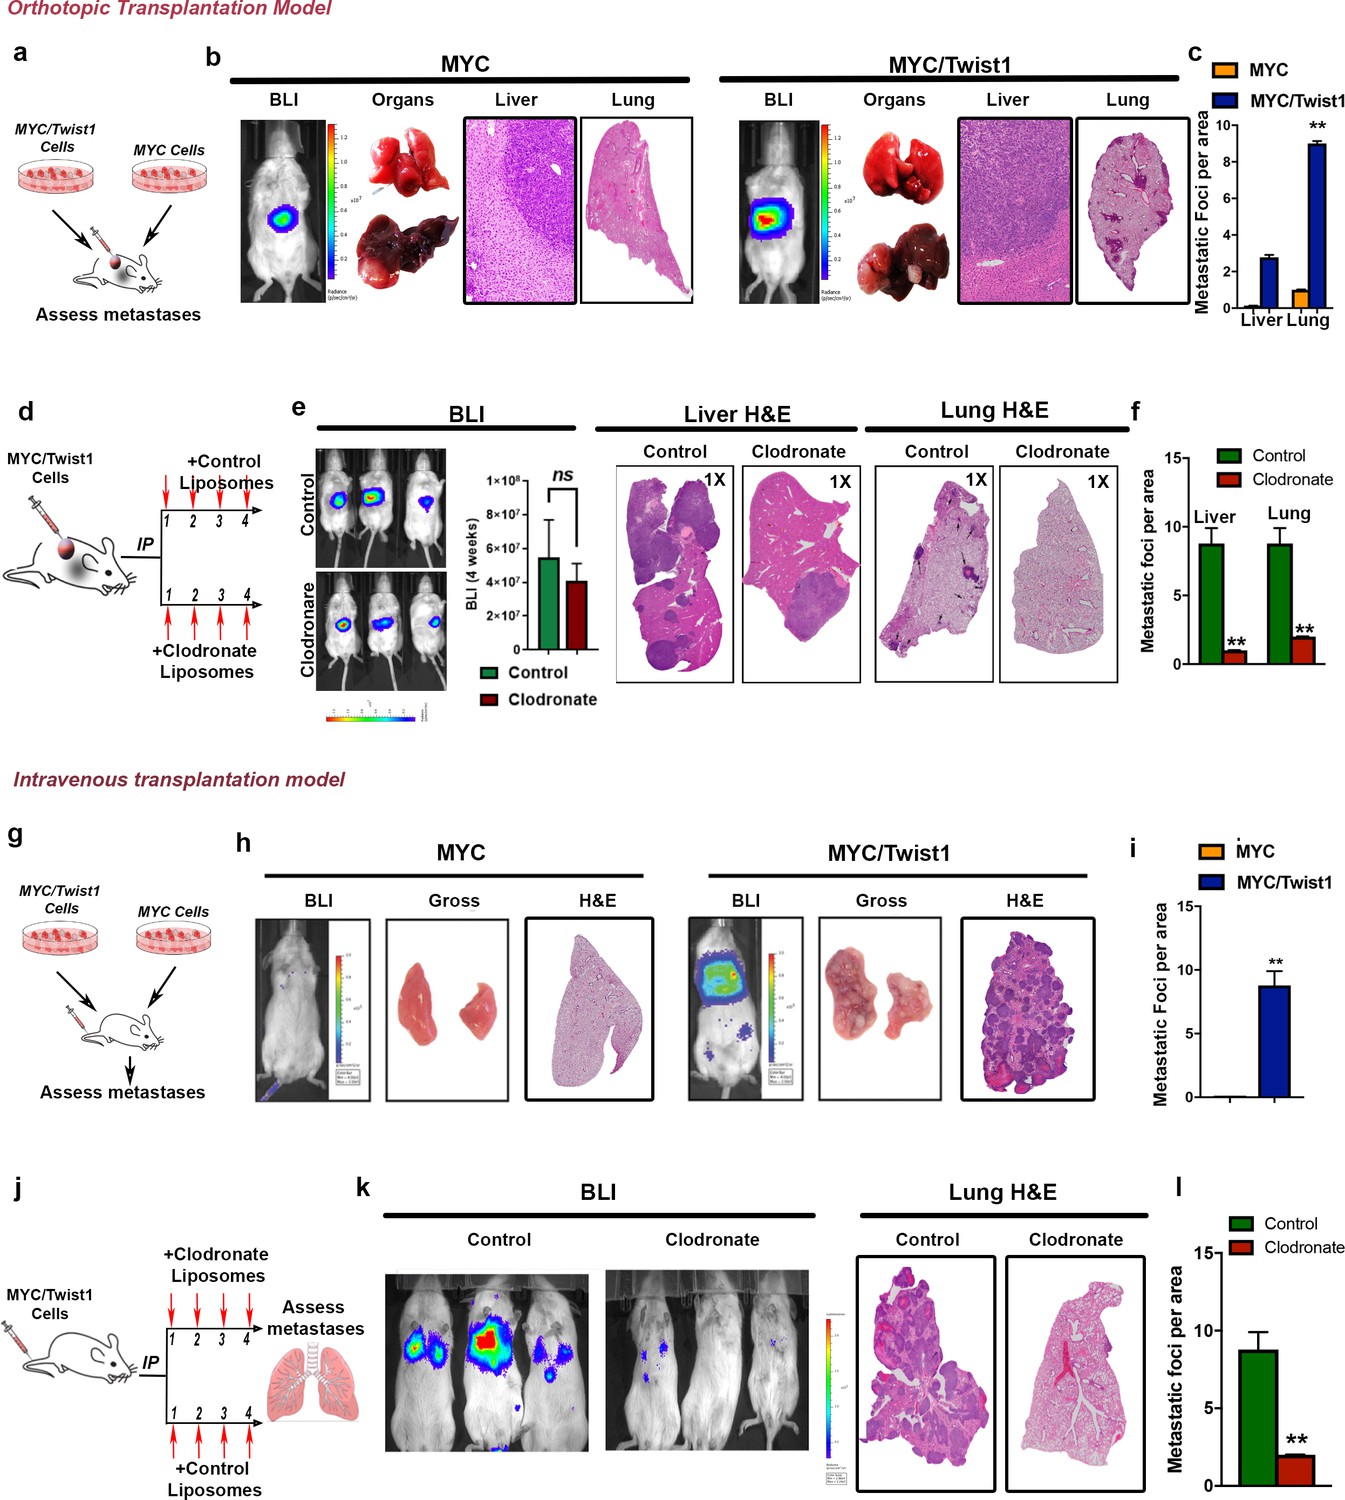
Tumor associated macrophages are required for Twist1 to induce metastasis of MYC-HCC.
(a) Experimental scheme- MYC and MYC/Twist1 cells were implanted orthotopically and metastatic burden in liver and lung assessed after 4 weeks. (b) Representative BLI imaging, gross organ appearance, histopathology of liver (10X) and lungs (1X) from mice orthotopically implanted with MYC (n = 5) and MYC/Twist1 cells (n = 5). (c) Comparative quantification of liver and lung metastatic burden between MYC (n = 5) and MYC/Twist1 orthotopic HCC (n = 5). (**p<0.01). (d) Experimental model of orthotopic MYC/Twist1-HCC treatment either with control liposomes or clodronate liposomes for 4 weeks for macrophage depletion. (e) Representative BLI imaging, BLI quantification, gross organ appearance, histopathology of liver and lungs from MYC/Twist1 orthotopic HCC bearing mice treated with either control liposomes (n = 5) or clodronate liposomes (n = 4). (f) Comparative quantification of liver and lung metastatic burden between MYC/Twist1 orthotopic HCC bearing mice treated with either control liposomes (n = 5) or clodronate liposomes (n = 4) (**p<0.01). (g) Experimental scheme- MYC and MYC/Twist1 cells were injected intravenously and metastatic burden in lung assessed after 4 weeks. (h) Representative BLI imaging, gross organ appearance, histopathology of lungs from mice intravenously injected with MYC (n = 5) and MYC/Twist1 cells (n = 4). (i) Comparative quantification of lung metastatic burden between MYC (n = 5) and MYC/Twist1 intravenously injected HCC (n = 4). (**p<0.01). (j) Experimental model of intravenous MYC/Twist1-HCC treatment either with control or clodronate liposomes for 3 weeks for macrophage depletion. (k) Representative BLI imaging, and lung histopathology from MYC/Twist1 intravenous HCC injected mice treated with either control liposomes (n = 4) or clodronate liposomes (n = 5). (l) Comparative quantification of liver and lung metastatic burden between MYC/Twist1 intravenously injected HCC bearing mice treated with either control liposomes (n = 4) or clodronate liposomes (n = 5) (**p<0.01).
Figure 4—figure supplement 1

Effect of Macrophage depletion on MYC/Twist1 HCC metastasis.
(a) Conditional mRNA expression of MYC and Twist1 in primary cell lines derived from MYC-HCC(n = 5, with three technical replicates each) and MYC/Twist1-HCC (n = 5, with three technical replicates each) via qPCR. (b) F4/80 immunostaining in orthotopic tumors from MYC-HCC (n = 5, with three technical replicates each) and MYC/Twist1-HCC (n = 5, with three technical replicates each) in normal liver, liver tumor and lungs. (c) MYC/Twist1-HCC cells treated with control liposomes (n = 5) or clodronate liposomes (n = 5) in vitro and number of colonies quantified. (d) Cleaved caspase three activity in macrophages and tumor cells treated with control ((n = 5, with three technical replicates each) or clodronate liposomes (n = 5, with three technical replicates each). (e) Representative images from F4/80 immunostaining in orthotopic tumors from MYC-HCC and MYC/Twist1-HCC in normal liver, liver tumor and lungs after treatment with control liposomes or clodronate liposomes. (f) Quantification of IHC staining of F4/80 immunostaining in orthotopic tumors from MYC-HCC and MYC/Twist1-HCC in normal liver, liver tumor and lungs after treatment with control liposomes or clodronate liposomes. (g) Representative images from MYC and F4/80 immunostaining of lung tissue after intravenous implantation of MYC-HCC and MYC/Twist1 HCC.
Figure 5 with 1 supplement
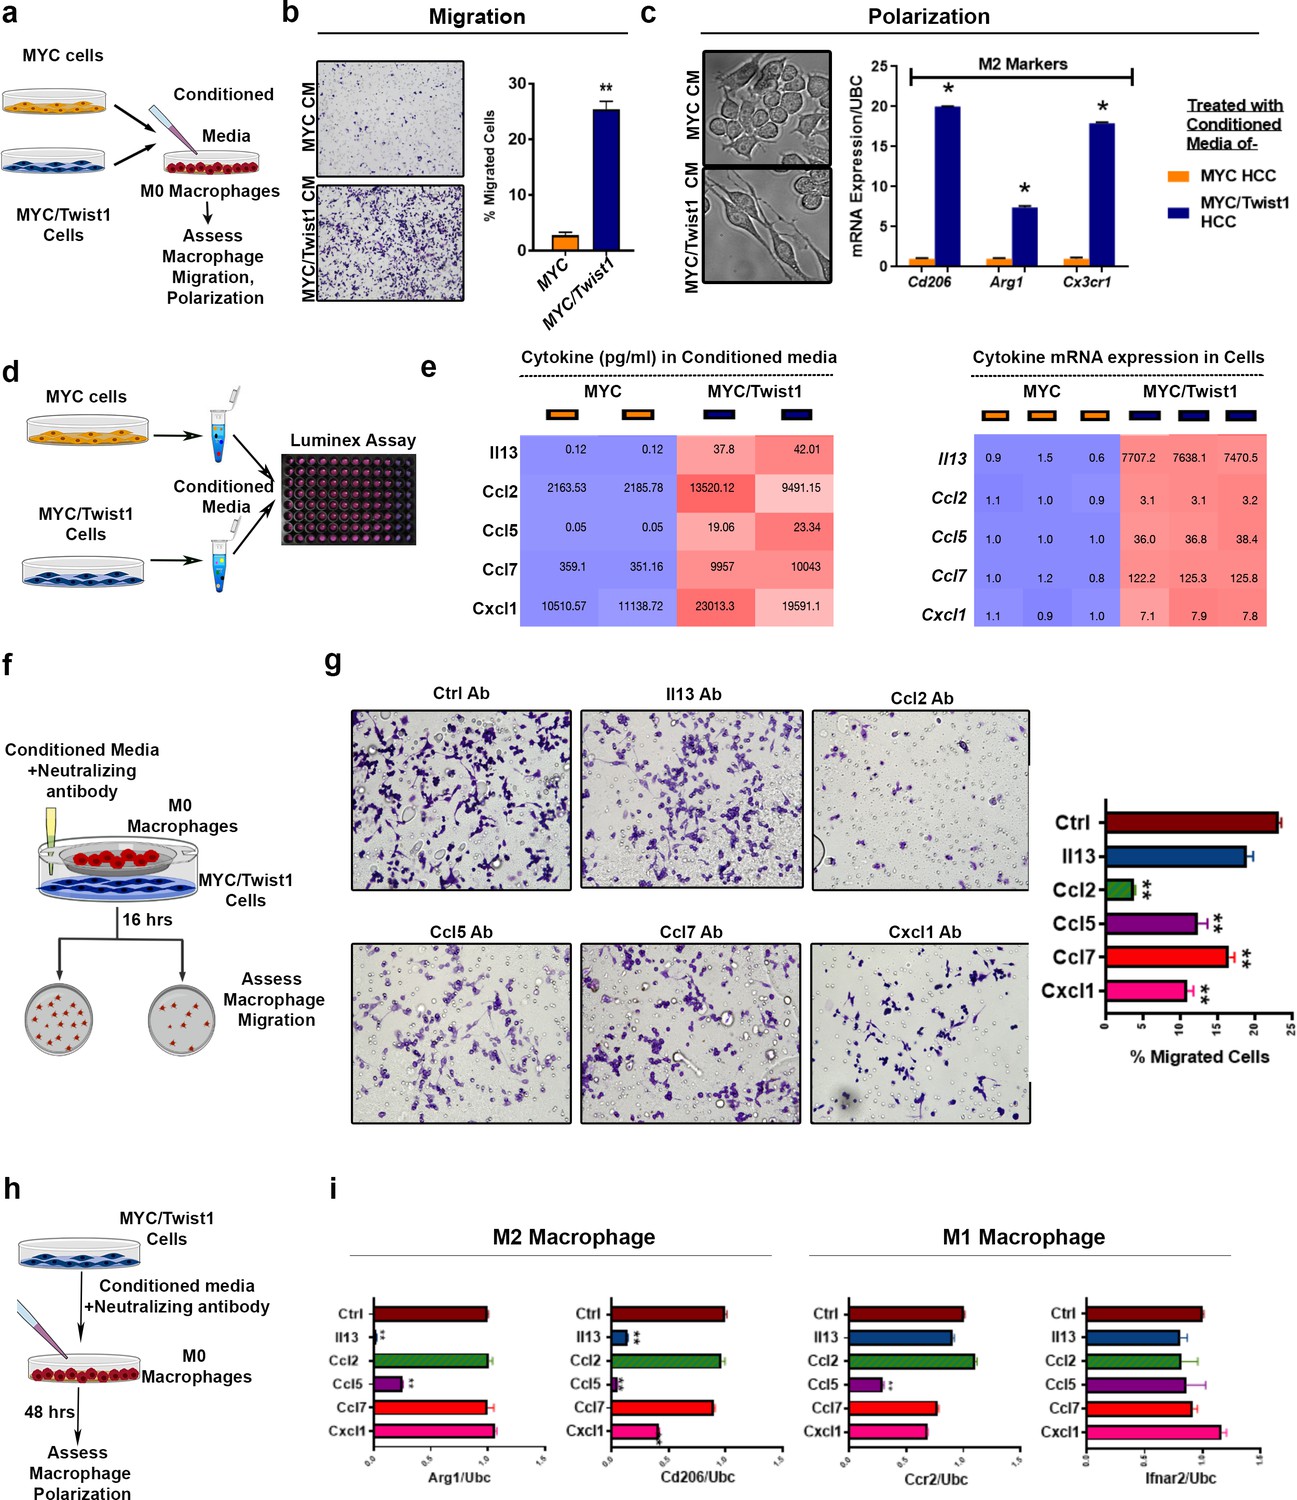
MYC and Twist1 reprogram the cytokinome to induce macrophage recruitment and polarization.
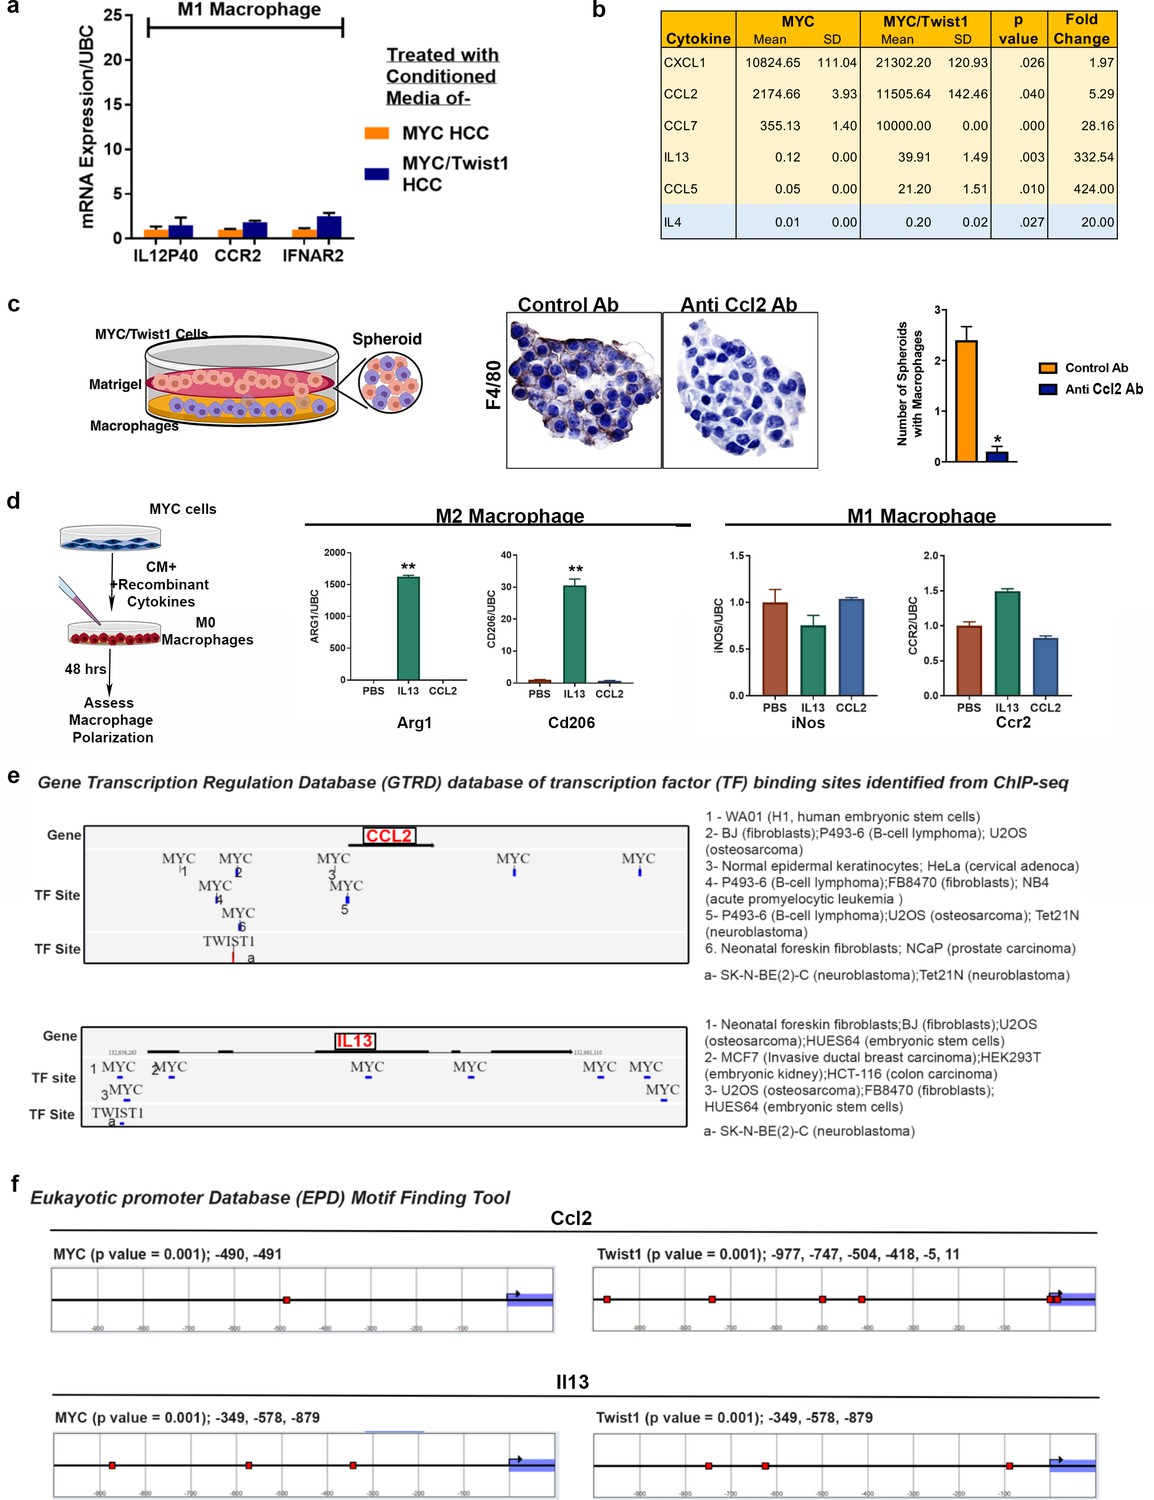
(a) Experimental scheme- conditioned media (CM) from MYC or MYC/Twist1 cells was used to treat non polarized macrophages for 48 hr. Following that, macrophage migration or polarization was assessed. (b) Transwell macrophage migration across a membrane insert when treated with CM from MYC-cells (n = 3 biological replicates, with three technical replicates each) or MYC/Twist1-cells (n = 3 biological replicates, with three technical replicates each). Bar graph shows quantification of migrated cells. (c) Morphologic appearance of macrophages treated with CM from MYC or MYC/Twist1 cells. Expression of M2 markers (CDd06, Arg1, Cx3cr1) in macrophages treated with CM from MYC (n = 3 biological replicates, with three technical replicates each) or MYC/Twist1 cells (n = 3 biological replicates, with three technical replicates each). (*p=0.05). (d) Experimental scheme- the CM from MYC or MYC/Twist1cells were analyzed using Luminex-plate based multiplex ELISA assay. (e) Heatmap showing expression levels of top five differentially secreted cytokines in CM of MYC (n = 3 biological replicates, with three technical replicates each) or MYC/Twist1 cells(n = 3 biological replicates, with three technical replicates each) by ELISA. Second heatmap showing mRNA expression levels of top five cytokines between MYC or MYC/Twist1 cells by qPCR. (f) Experimental scheme- Co-culture of MYC/Twist1 cells and macrophages separated by a chamber to evaluate chemotaxis of macrophages towards the cancer cells was performed. Neutralizing antibodies to individual cytokines or control antibody were added to the CM of MYC/Twist1 cells. (g) Transwell chamber migration assay of macrophages in the upper chamber toward the MYC/Twist1 cells in the lower chamber. MYC/Twist cells CM was treated with control antibody or neutralizing antibody to Il13, Ccl2, Ccl5, Ccl7 or Cxcl1 respectively. (n = 3 biological replicates, with three technical replicates each)(**p<0.01). (h) Experimental scheme- CM of MYC/Twist1 cells treated with control antibody or neutralizing antibody to Il13, Ccl2, Ccl5, Ccl7 or Cxcl1 respectively was added to non-polarized macrophages for 48 hr. (i) Macrophage polarization was assessed by qPCR for M2 markers (ARG1, CD2016) and M1 markers (Ifnar2, Ccr2)(n = 3 biological replicates, with three technical replicates each) (***p<0.001).
Figure 5—figure supplement 1
Mechanisms of MYC and Twist1 cooperation.
(a) Expression of M1 marker genes in macrophages treated with conditioned media from MYC-HCC (n = 3, with three technical replicates each) or MYC/Twist1-HCC (n = 3, with three technical replicates each). (b) Levels of top five cytokines differentially expressed in the conditioned media (pg/ml) of MYC- (n = 3, with three technical replicates each) and MYC/Twist-HCC (n = 3, with three technical replicates each) and Il4 which is not significantly different and is used as a negative control. (c) Representative images from spheroid co-culture assay of MYC/Twist1-cells and macrophages after treatment with either anti-Ccl2 antibody or control antibody. F4/80 staining was performed to quantify number of spheroids with macrophage infiltration (*p<0.05). (d) Experimental scheme- Conditioned medium of MYC-HCC cells treated with PBS or recombinant Il13 or Ccl2 respectively was added to non-polarized macrophages for 48 hr. Macrophage polarization was assessed by qPCR for M2 markers (Arg1, Cd206) and M1 markers (Ifnar2, Ccr2) (**p<0.01). (e) MYC and TWIST1 binding sites identified in the promoter regions of CCL2 and IL13 in the Gene transcription regulation database (GTRD) from ChIPseq analysis of the specific cancer cell lines shown on the right side. (f) Motif finding analysis of eukaryotic promoter database (EPD) identifies multiple MYC and Twist1 binding sites (red boxes) in the promoter region of mouse Ccl2 and Il13 genes.
Figure 6 with 1 supplement
MYC and TWIST1 require both Ccl2 and Il13 to promote metastasis.
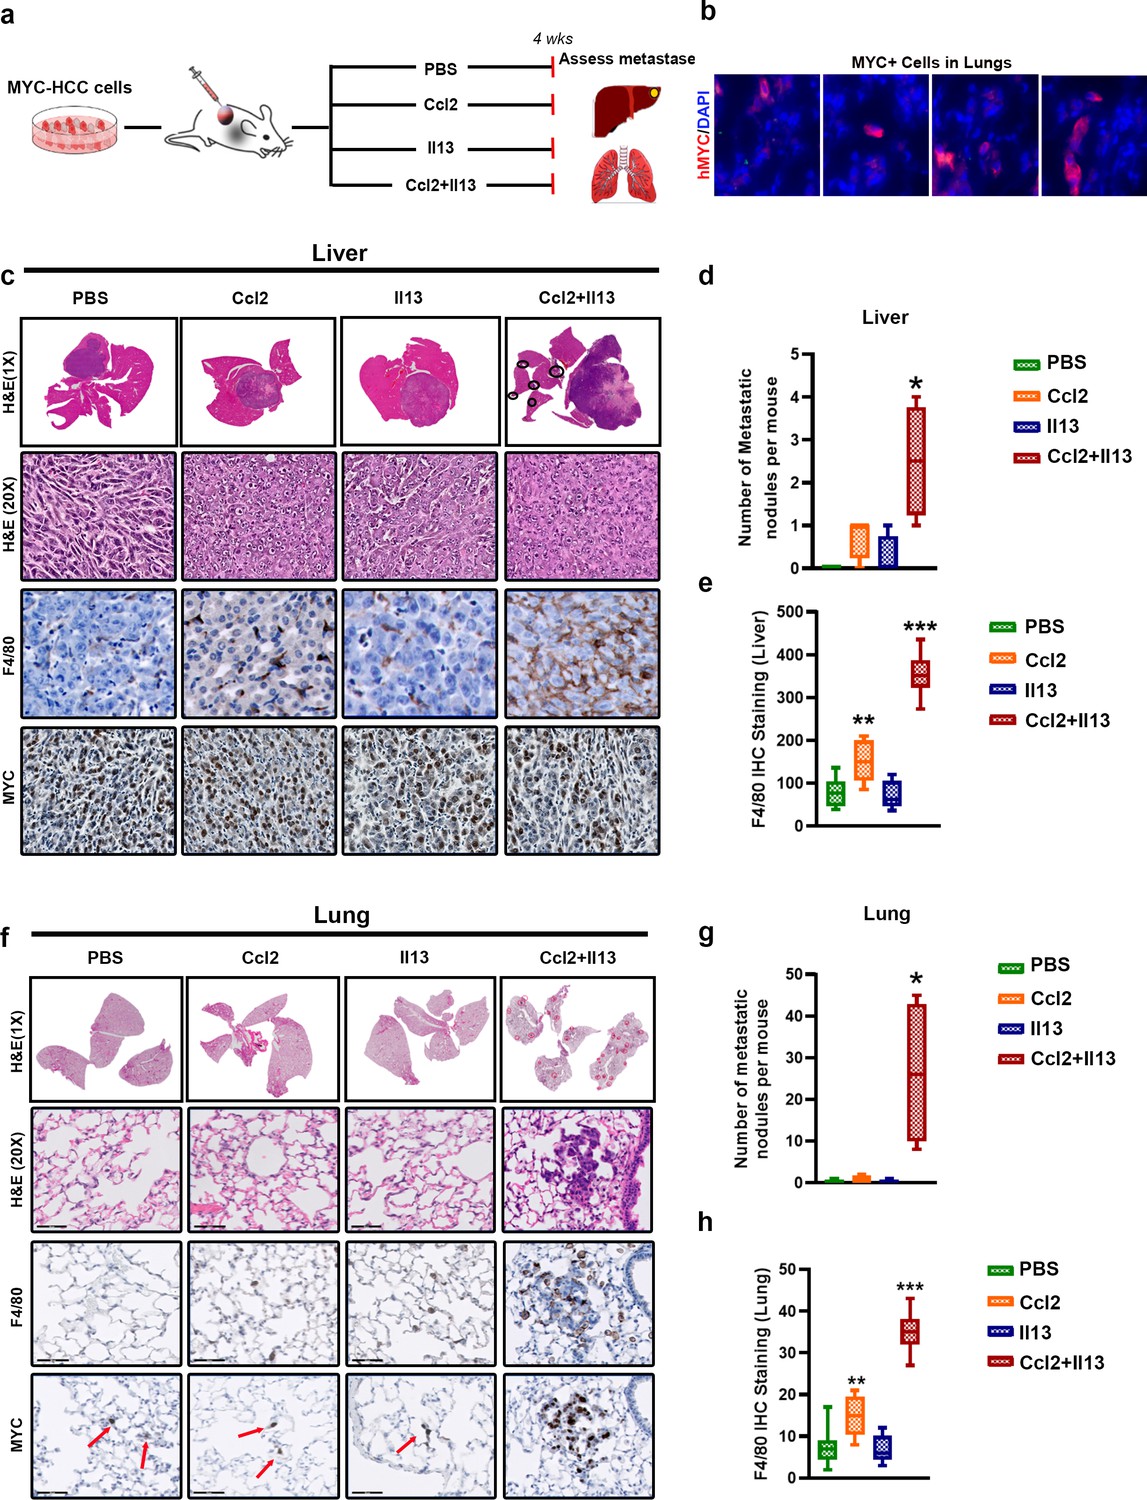
(a) Experimental scheme- Mice orthotopically transplanted with MYC-HCC cells were treated either with PBS or Il13 or Ccl2 or Ccl2+Il13 recombinant cytokines for 4 weeks. (b) MYC expressing single cells scattered in the lungs of mice orthotopically bearing MYC-HCC. (c) Histopathology of liver (1X and 20X) of MYC-HCC bearing mice treated with PBS (n = 4) or Ccl2 (n = 4) or Il13 (n = 4) or Ccl2+Il13 (n = 4) and IHC for F4/80 and MYC expression in each group. (d) Quantification of number of metastatic nodules in the liver control treated or recombinant cytokine treated MYC-HCC bearing mice. (*p<0.05). (e) Quantification of macrophage infiltration in liver by IHC staining for F4/80 of MYC-HCC bearing mice liver treated with PBS (n = 4) or Ccl2 (n = 4) or Il13 (n = 4) or Ccl2+Il13 (n = 4). (f) Representative images from histopathology of lung (1X and 20X) of MYC-HCC bearing mice treated with PBS or Ccl2 or Il13 or Ccl2+Il13 and IHC for F4/80 and MYC expression in each group. (g) Quantification of number of metastatic nodules in the lung of control treated or recombinant cytokine treated MYC-HCC bearing mice. (**p<0.01). (h) Quantification of macrophage infiltration in lung by IHC staining for F4/80 of MYC-HCC bearing mice liver treated with PBS (n = 4) or Ccl2 (n = 4) or Il13 (n = 4) or Ccl2+Il13 (n = 4).
Figure 6—figure supplement 1
MYC and Twist1 induce macrophage polarization and angiogenesis via Il13.
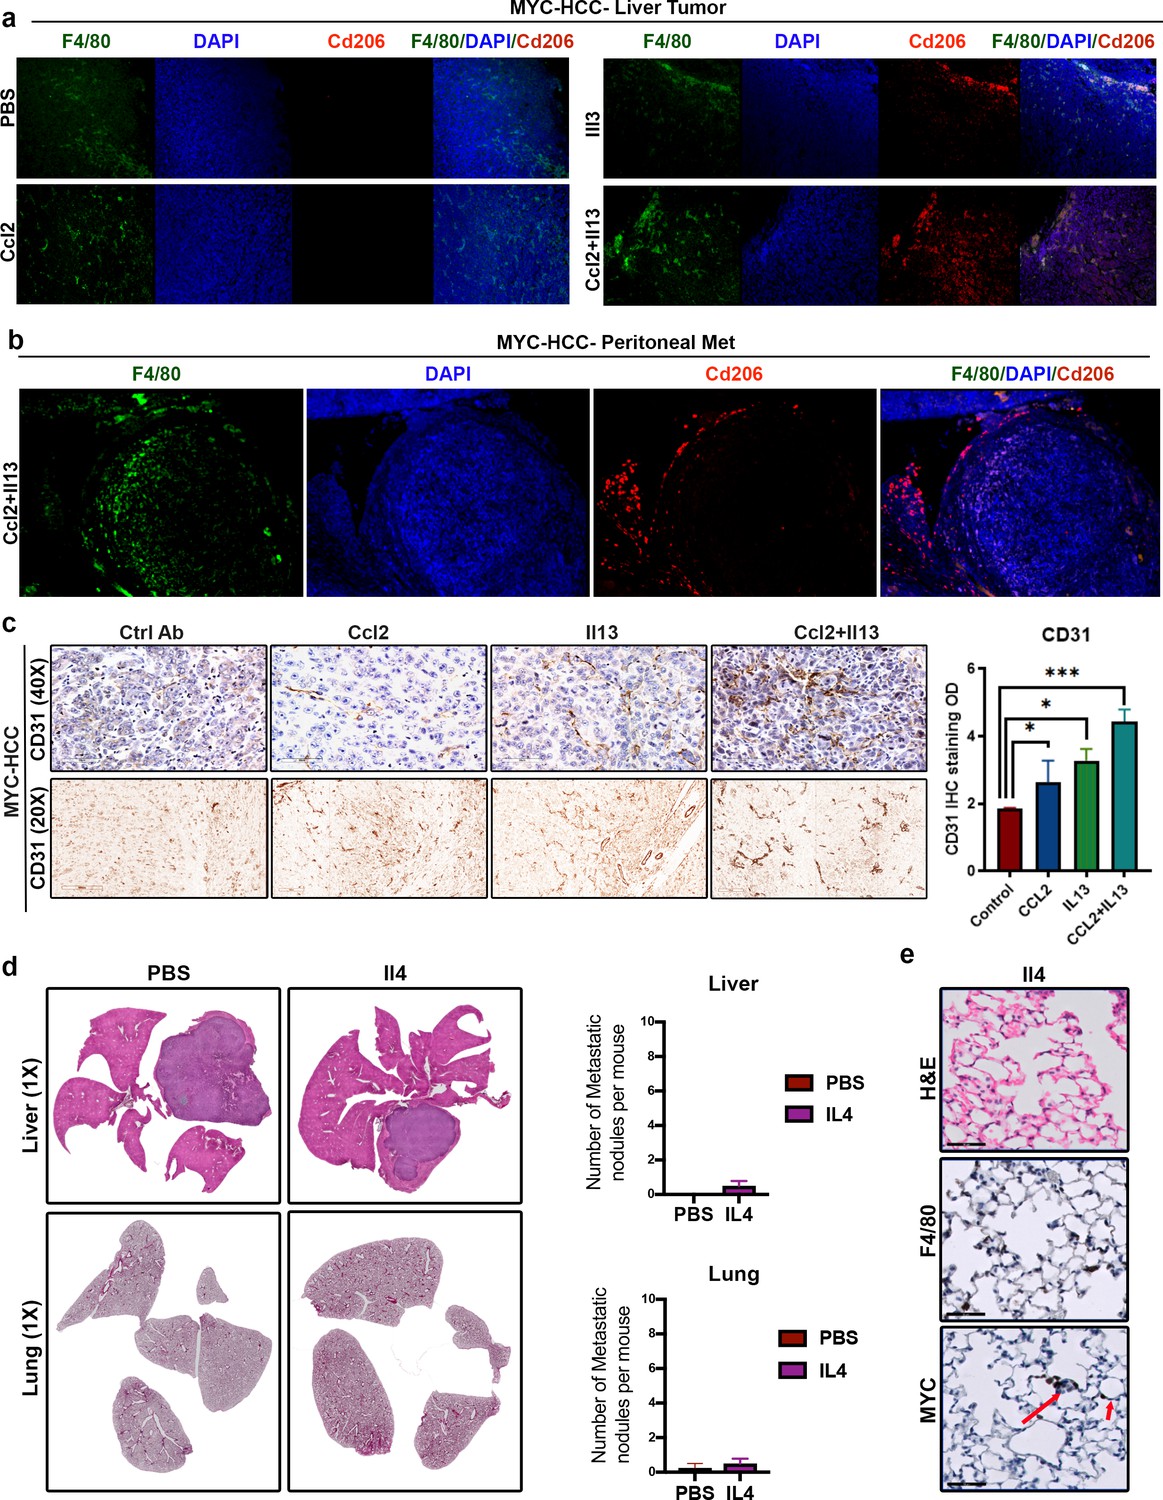
(a) Representative images from immunofluorescence staining for Cd206 in liver primary tumor reveals polarization to M2-like phenotype in MYC-HCC bearing mice treated with Il13 and Ccl2+Il13 but not in PBS treated or mice treated with Ccl2 alone. (b) Representative images from immunofluorescence staining for Cd206 in peritoneal metastatic lesion reveals polarization to M2-like phenotype in MYC-HCC bearing mice treated with Il13 and Ccl2+Il13 but not in PBS treated or mice treated with Ccl2 alone. (c) Representative images from immunohistochemical staining for CD31 in liver demonstrates reveals higher degree of angiogenesis in MYC-HCC bearing mice treated with Ccl2+Il13 than PBS treated or mice treated with Ccl2 or Il13 alone. Bar graph reveals quantification of IHC staining. Bottom panel shows the deconvoluted DAB staining to point out specific areas of IHC staining. (d) Histopathology of liver and lungs of mice orthotopically transplanted with MYC-HCC cells treated either with PBS (n = 4) or Il4 recombinant cytokine (n = 4). (e) Quantification of number of metastatic nodules in the liver and lungs of control treated or recombinant Il4 treated MYC-HCC bearing mice. (f) Representative images from MYC and F4/80 staining of lung tissue from mice orthotopically transplanted with MYC-HCC cells treated with recombinant Il4 (n = 4).
Figure 7 with 1 supplement
Combined inhibition of Ccl2 and Il13 has a synergistic effect on prevention of HCC metastasis.
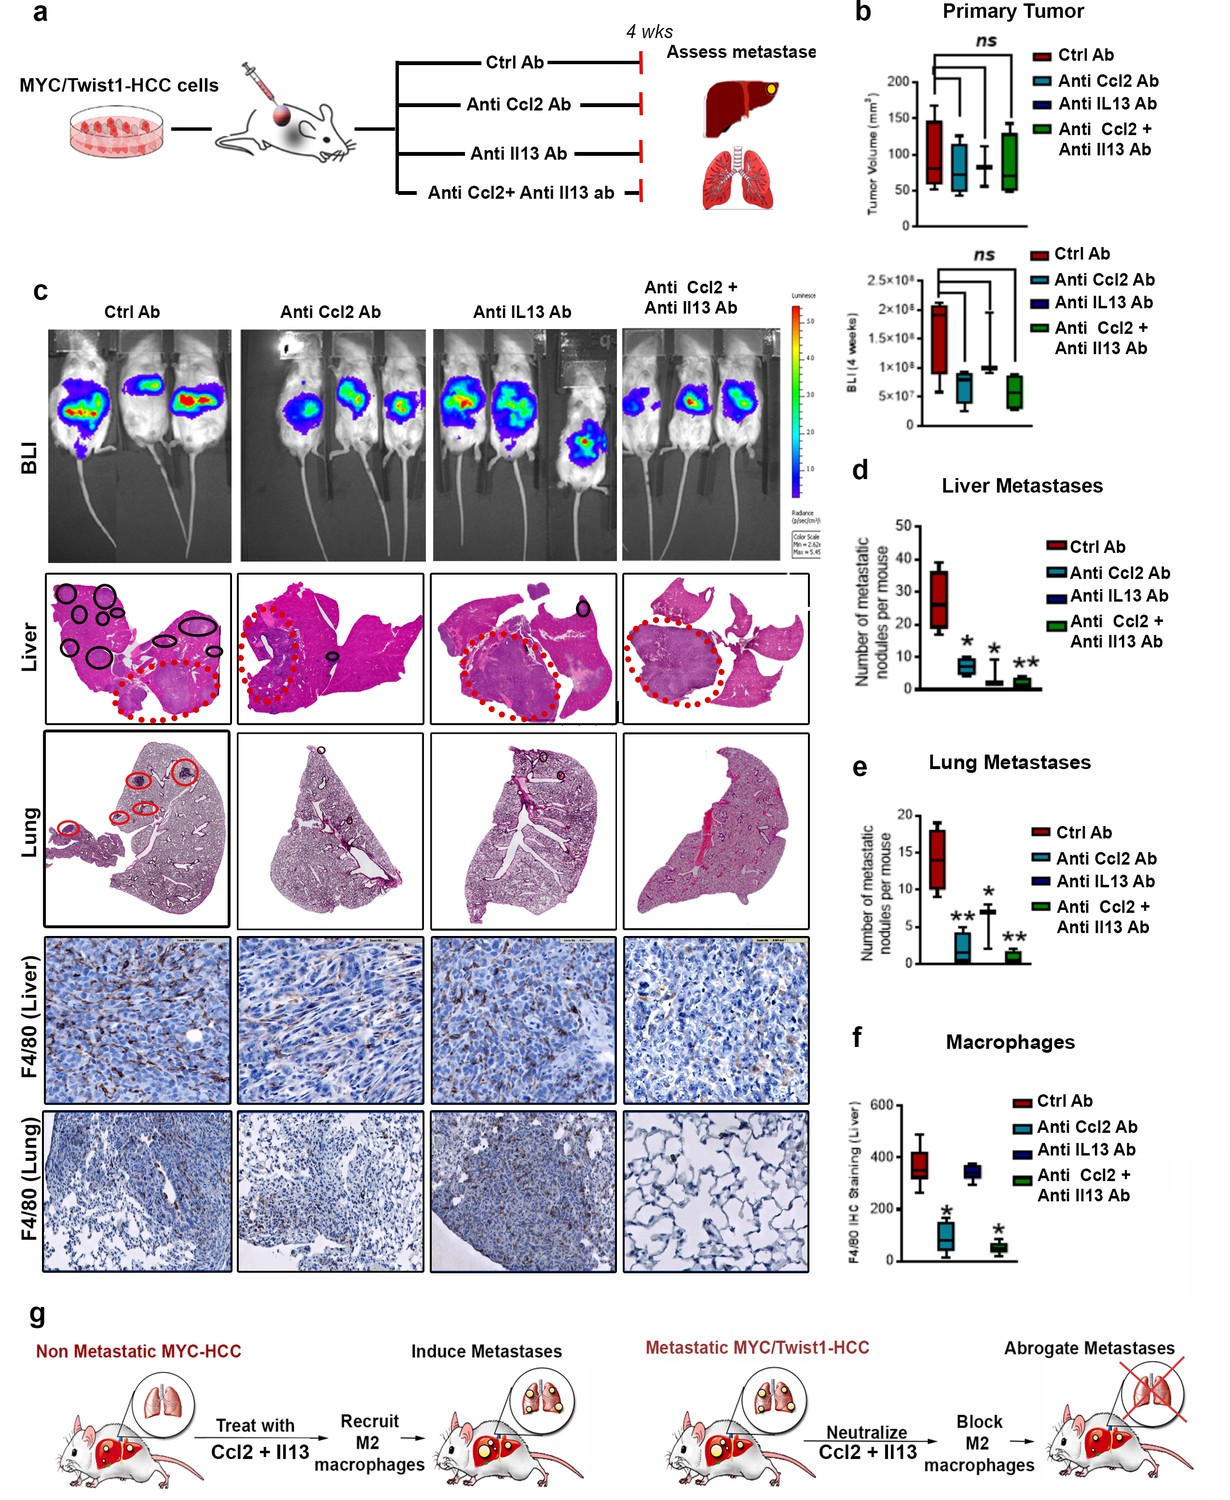
(a) Experimental scheme- Mice orthotopically transplanted with MYC/Twist1-HCC cells were treated either with control (ctrl) antibody or anti-Ccl2 antibody (ab) or anti-Il13 ab or anti-Ccl2+Il13 abs for 4 weeks. (b) Quantification of tumor volume of primary tumor and bioluminescence signal at 4 weeks in mice treated with ctrl ab (n = 4), anti-Ccl2 ab (n = 4) or anti-Il13 ab (n = 3) or anti-Ccl2+Il13 abs (n = 4). (c) BLI images, histopathology of liver (1X) and lungs (1X) of MYC/Twist1-HCC bearing mice treated with ctrl ab (n = 4) or anti-Ccl2 ab (n = 4) or anti-Il13 ab (n = 3) or anti-Ccl2+Il13 abs (n = 4) and IHC for F4/80 (20X) expression in the liver tumors and lungs in each group. The red dotted circles represent primary orthotopic tumor and the black circles show the metastatic nodules. (d) Quantification of number of metastatic nodules in the liver in MYC/Twist1-HCC bearing mice treated with ctrl ab or anti-Ccl2 ab or anti-Il13 ab or anti-Ccl2+Il13 abs. (**p<0.01). (e) Quantification of number of metastatic nodules in the liver in MYC/Twist1-HCC bearing mice treated with ctrl ab or anti-Ccl2 ab or anti-Il13 ab or anti-Ccl2+Il13 abs. (**p<0.01). (f) Quantification of macrophage infiltration in liver by IHC staining for F4/80 of MYC/Twist1-HCC bearing mice treated with ctrl ab (n = 4) or anti-Ccl2 ab (n = 4) or anti-Il13 ab (n = 3) or anti-Ccl2+Il13 abs (n = 4). (**p<0.01). (g) Schematic representation of how combined treatment of non-metastatic MYC-HCC can now induce metastases and synergistic inhibition of Ccl2 and Il13 can inhibit metastasis of MYC/Twist1-HCC.
Figure 7—figure supplement 1
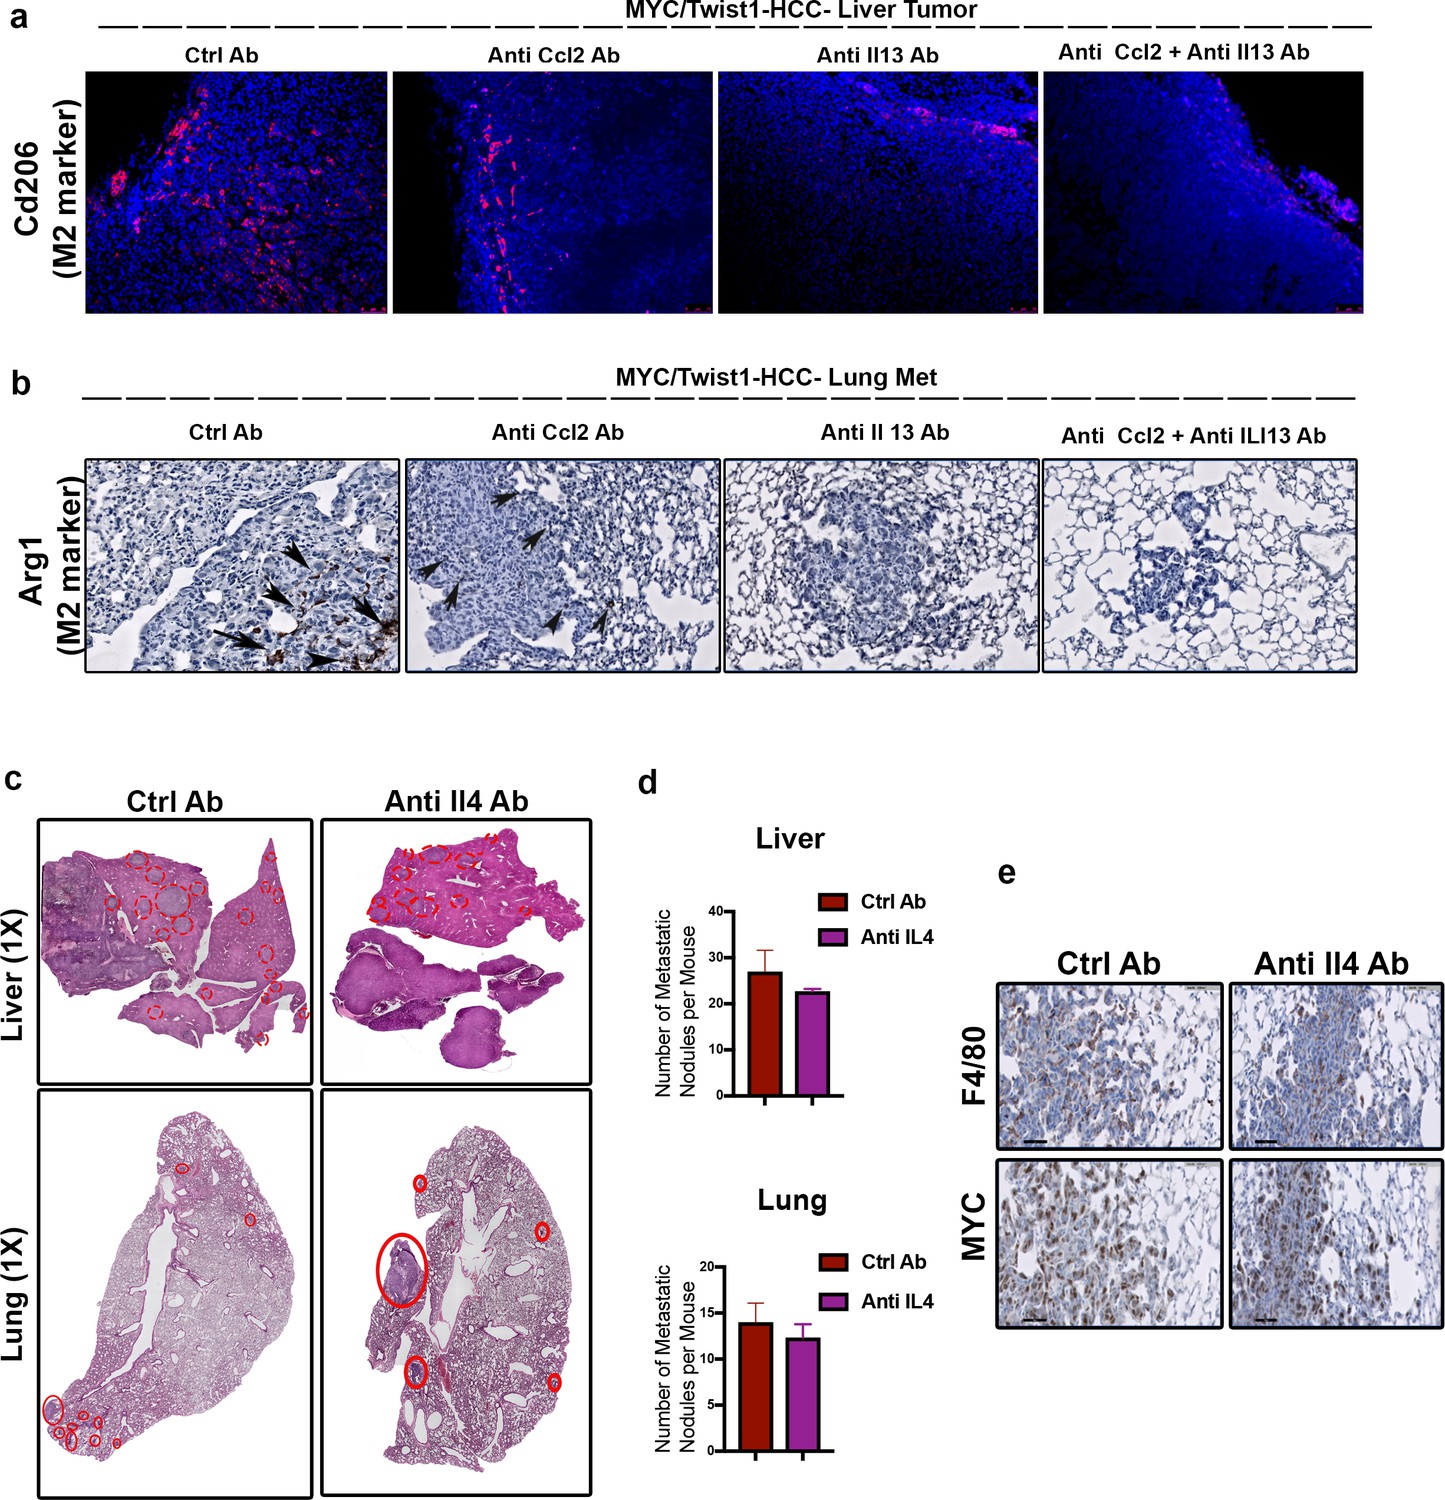
Combined inhibition of Ccl2 and Il13 inhibits macrophage polarization.
(a) Representative images from Cd206 staining of liver primary tumor sections (10X) of orthotopic transplanted MYC/Twist1-HCC bearing mice treated with control (ctrl) ab or anti-Ccl2 ab or anti-Il13 ab or anti-Ccl2+Il13 abs. Shows CD206+ M2-like polarization in mice treated with ctrl antibody and anti Ccl2 antibody but not anti-Il13 antibody or anti-Ccl2+Il13 antibodies. (b) Representative images from Arg1 staining of lung sections (10X) of orthotopic transplanted MYC/Twist1-HCC bearing mice treated with control (ctrl) ab or anti-Ccl2 ab or anti-Il13 ab or anti-Ccl2+Il13 abs. Shows M2 like polarization in mice treated with ctrl antibody and anti-Ccl2 antibody but not anti-Il13 antibody or anti-Ccl2+Il13 antibodies. (c) Representative images from histopathology of liver and lungs of mice orthotopically transplanted with MYC/Twist1-HCC cells treated either with ctrl ab (n = 4) or anti-Il4 ab (n = 4). (d) Quantification of number of metastatic nodules in the liver and lung of MYC/Twist1-HCC bearing mice treated either with ctrl ab (n = 4) or anti-Il4 ab (n = 4). (e) MYC and F4/80 staining of lung tissue from MYC/Twist1-HCC bearing mice treated either with ctrl ab (n = 4) or anti-Il4 ab (n = 4).
Figure 8 with 1 supplement

MYC and TWIST1 predict poor prognosis, TAM infiltration and pro-TAM cytokines in 33 human cancers.
(a) Disease-free survival in pan-cancer TCGA cohort of 9502 patients from 33 cancers stratified by median MYC+TWIST1 expression (first KM curve) and median MYC+TWIST1+ CCL2+IL13 (second KM curve). (b) Disease-free survival in GSE364 cohort of metastatic HCC patients (n = 144) stratified by median MYC and TWIST1 expression. (c) Comparison of relative percentage of monocyte and macrophage subpopulations, derived using CIBERSORT analysis of pan cancer TCGA cohort of 10366 patients from 33 cancers with tumors stratified as MYC/TWIST1High or MYC/TWIST1low (*p<0.05). Comparison of relative percentage of M2 macrophage subpopulation, derived using CIBERSORT analysis of Liver cancer TCGA cohort of 373 patients with tumors stratified as MYC/TWIST1High or MYC/TWIST1low (*p<0.05). (d) Correlation of MYC+TWIST1 expression with TAM markers in TCGA pan-cancer cohort and HCC cohort. Correlation of MYC+TWIST1 expression with CCL2 and IL13 in TCGA pan-cancer cohort (n = 9502). (e) Comparison of mRNA expression of MYC, TWIST1, CCL2 and IL13 between two HCC cell lines Huh7 (n = 3 biological replicates with three technical replicates each) and SNU398 (n = 3 biological replicates with three technical replicates each). (f) Experimental scheme for analysis of macrophage polarization in vitro assay. (g) Expression of M2 (CD163, CD206) and M1 markers (TNFA, IL1B) after treatment with conditioned media from Huh7 (n = 3 biological replicates with three technical replicates each) or SNU398 (n = 3 biological replicates with three technical replicates each). (*p<0.05, **p<0.01, ***p<0.001). (h) Prospective clinical study of plasma levels of cytokines in patients with cirrhosis (n = 10) versus patients with HCC (n = 25). (*p<0.05, **p<0.01, ***p<0.001). (i) Comparison of plasma levels of cytokines between patients with single HCC versus multifocal HCC (*p<0.05, **p<0.01, ***p<0.001). (j) Comparison of plasma levels of cytokines between patients with HCC with vascular invasion and without vascular invasion (*p<0.05, **p<0.01, ***p<0.001).
Figure 8—figure supplement 1
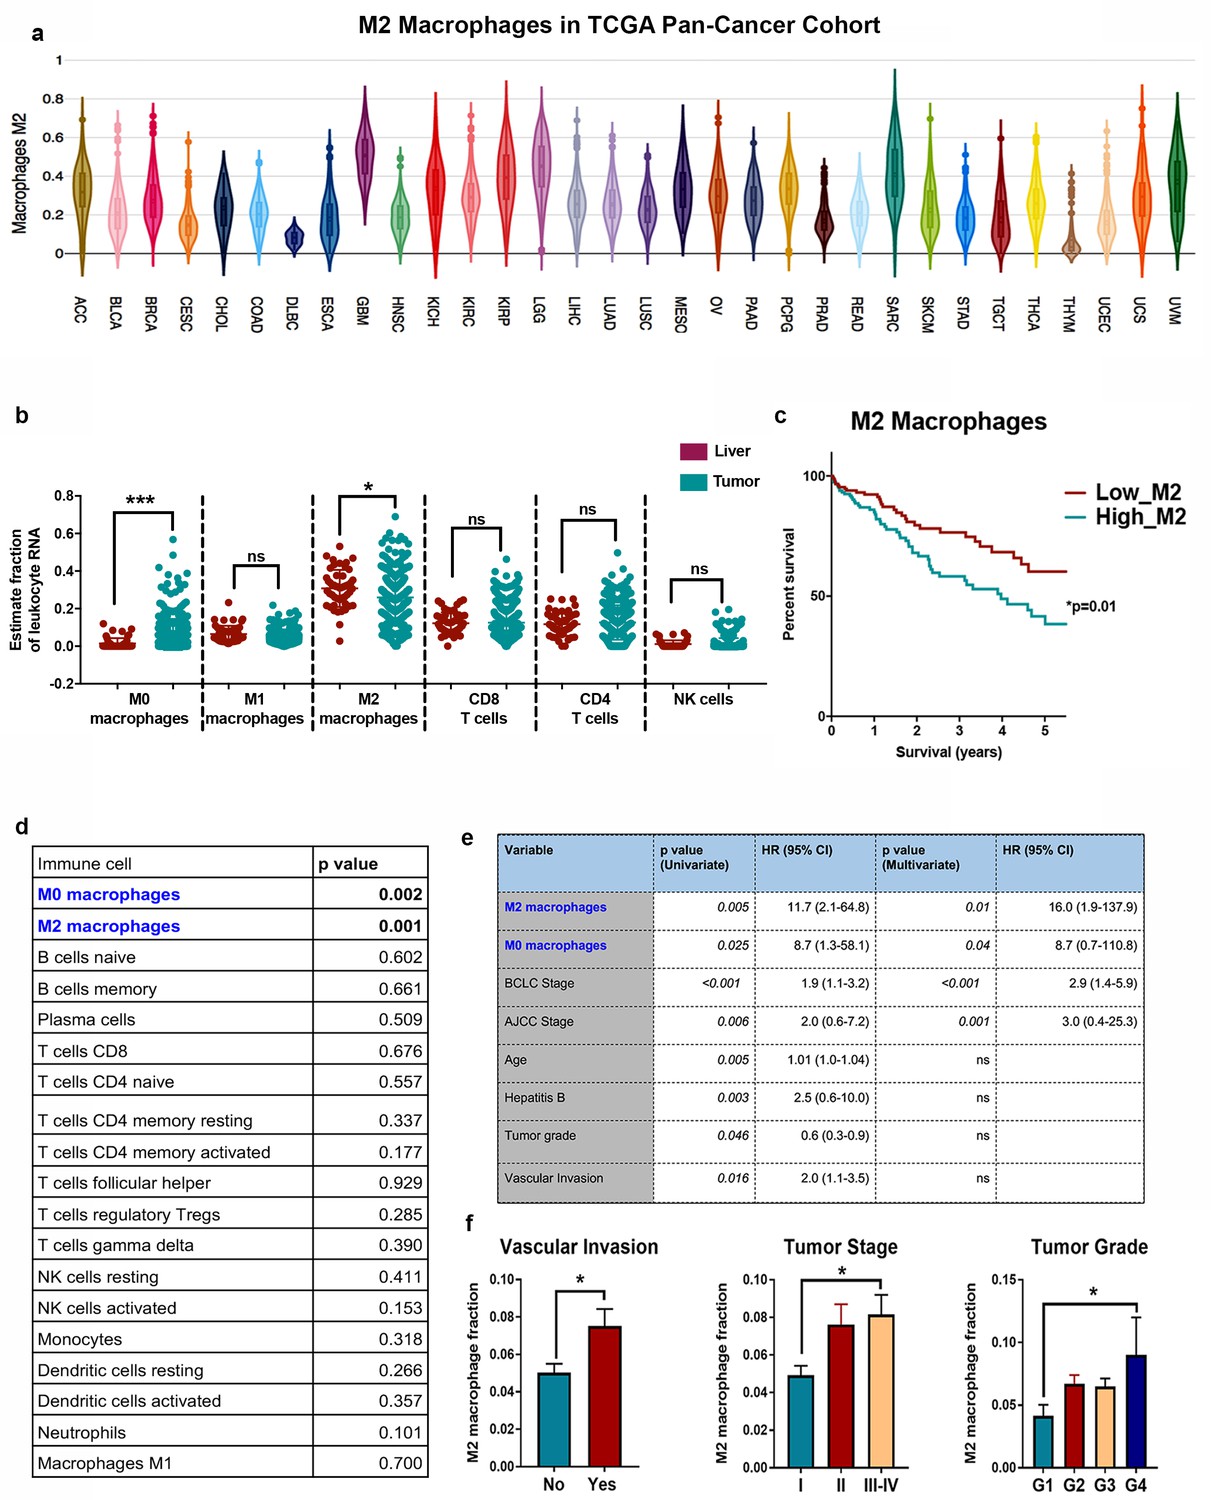
M2 macrophages have a prognostic role in human cancers including liver cancer.
(a) M2 macrophage infiltration in 33 different cancers from the pan-cancer TCGA cohort based on transcriptome deconvolution analysis using CIBERSORT. (b) CIBERSORT analysis of human HCC TCGA RNAseq dataset (n = 373) to show major immune subset composition. (c) Kaplan Meier survival curve of TCGA human HCC (n = 373) stratified by median M2 macrophage infiltration. (d) Cox proportional hazard survival analysis of 22 immune compartments on survival of HCC patients in TCGA cohort (n = 373). (e) Multivariate survival analysis of factors independently influencing survival of HCC patients in TCGA cohort (n = 373). (f) Correlation of M2 macrophage infiltration with vascular invasion, tumor stage and tumor grade in human HCC (n = 373).
Figure 9
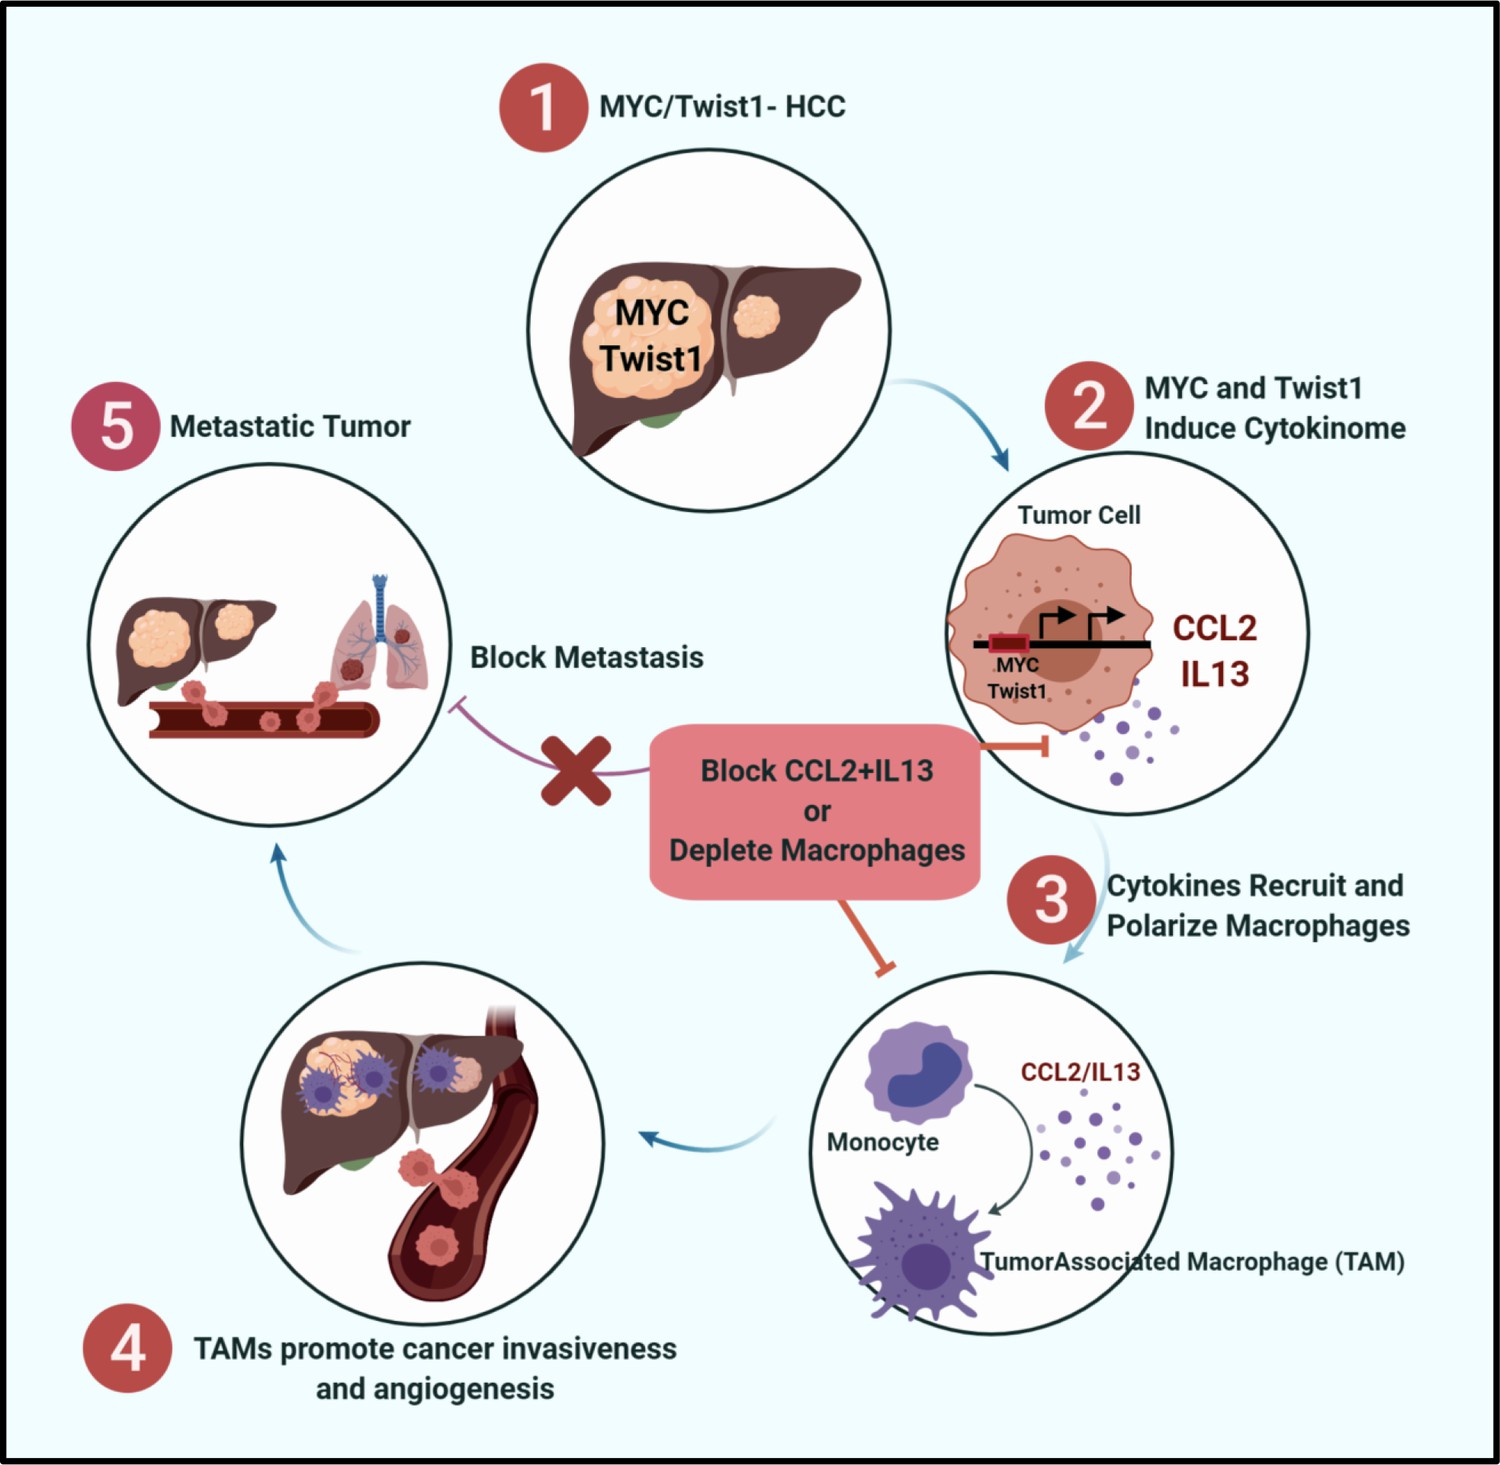
MYC and Twist1 Drive Metastasis via CCL2/IL13 mediated macrophage activation.
Graphical representation showing that MYC and Twist1 elicit a cytokinome including CCL2/IL13 which mediate the crosstalk between cancer cells and macrophages. Therapeutic blockade of the cytokines can inhibit cancer metastasis.
Tables
Key resources table
| Reagent type (species) or resource | Designation | Source or reference | Identifiers | Additional information |
|---|---|---|---|---|
| Antibody | MYC (Rabbit, Monoclonal) | Epitomics | RRID:AB_11000313 | IHC (1:150), WB (1:1000) |
| Antibody | F4/80 (Rat, Monoclonal) | ThermoFisher | RRID: AB_10376289 | IHC (1:150) |
| Antibody | Twist1 (Mouse, Monoclonal) | Abcam | RRID:AB_883294 | WB (1:500) |
| Antibody | Phospho-Histone 3 (Rabbit, Polyclonal) | Cell Signaling Technology | RRID:AB_331535 | IHC (1:100) |
| Antibody | Cleaved Caspase3 (Rabbit, Polyclonal) | Cell Signaling Technology | RRID:AB_2341188 | IHC (1:100) |
| Antibody | Neutrophil (Rat, Monoclonal) | Abcam | RRID:AB_881409 | IHC (1:100) |
| Antibody | CD4 (Mouse, Monoclonal) | Abcam | RRID:AB_2686917 | IHC (1:1000) |
| Antibody | Glutamine Synthetase (Rabbit, Monoclonal) | Abcam | RRID:AB_446132 | IHC (1:200) |
| Antibody | CD31 (Rabbit, Polyclonal) | Abcam | RRID:AB_726362 | IHC(1:100) |
| Antibody | CD206 (Mouse, Monoclonal) | R and D | RRID:AB_2745540 | ICC (1:100) |
| Antibody | CCL2 (Mouse, Monoclonal) | BioXCell | RRID:AB_10950302 | In vivo treatment (10 mg/kg body weight three times per week) |
| Antibody | Il-4 (Mouse, Monoclonal) | Genentech | Propreitary | In vivo treatment (10 mg/kg body weight three times per week) |
| Antibody | IL-13 (Mouse, Monoclonal) | Genentech | Propreitary | In vivo treatment (10 mg/kg body weight three times per week) |
| Genetic Reagent (M. musculus) | Twist1-tetO7-luc | PMID: 22654667 | Twist1 Transgenic mouse model | Felsher Lab |
| Genetic Reagent (M. musculus) | LAP-tTA | PMID: 15475948 | LAP-tTA mouse | Felsher Lab |
| Genetic Reagent (M. musculus) | TetO-MYC | PMID: 10488335 | MYC Transgenic mouse | Felsher Lab |
| Genetic Reagent (M. musculus) | Nod Scid-Gamma (NSG) mice | Jackson Laboratory | MGI:3577020 | Felsher Lab |
| Cytokine | CCL2 | Peprotech | RRID:AB_147738 | In vivo treatment (500 ng/mouse) |
| Cytokine | IL13 | Peprotech | RRID:AB_147840 | In vivo treatment (250 ng/mouse) |
| Cytokine | IL4 | Peprotech | RRID:AB_147635 | In vivo treatment (250 ng/mouse) |
| Drug | Clodronate liposomes | Liposoma | CP-005–005 | In vivo treatment (6.5 μl/g body weight/mouse) |
| Sequence-based reagent | MYC | Stanford PAN facility | N/A | f-CTGCGACGAGGAGGAGAACT r-GGCAGCAGCTCGAATTTCTT |
| Sequence-based reagent | UBC | Stanford PAN facility | N/A | f-AGCCCAGTGTTACCACCAAG r-ACCCAAGAACAAGCACAAGG |
| Sequence-based reagent | Twist1 | Stanford PAN facility | N/A | f-GGACAAGCTGAGCAAGATTCA r-CGGAGAAGGCGTAGCTGAG |
| Sequence-based reagent | CD206 | Stanford PAN facility | N/A | f-CTCTGTTCAGCTATTGGACGC r-TGGCACTCCCAAACATAATTTGA |
| Sequence-based reagent | Arginase-1 | Stanford PAN facility | N/A | f-CTCCAAGCCAAAGTCCTTAGAG r-AGGAGCTGTCATTAGGGACATC |
| Sequence-based reagent | CCR2 | Stanford PAN facility | N/A | f-GTGTACATAGCAACAAGCCTCAAAG r-CCCCCACATAGGGATCATGA |
| Sequence-based reagent | INFaR | Stanford PAN facility | N/A | f-CTTCCACAGGATCACTGTGTACCT r-TTCTGCTCTGACCACCTCCC |
| Sequence-based reagent | iNOS | Stanford PAN facility | N/A | f-ACACCGACCCGTCCACAGTAT r-CAGAGGGGTAGGCTTGTCTC |
| Sequence-based reagent | CX3CR1 | Stanford PAN facility | N/A | f-TACCTTGAGGTTAGTGAACGTCA r-CGCTCTCGTTTTCCCCATAATC |
Additional files
-
Supplementary file 1
List of genes (220 up and 294 down) that were differentially expressed between the MYC-HCC and MYC/Twist1-HCC.
- https://cdn.elifesciences.org/articles/50731/elife-50731-supp1-v1.xlsx
-
Supplementary file 2
The top biological processes, and associated genes, upregulated in MYC/Twist1-HCC versus MYC-HCC.
- https://cdn.elifesciences.org/articles/50731/elife-50731-supp2-v1.xlsx
-
Transparent reporting form
- https://cdn.elifesciences.org/articles/50731/elife-50731-transrepform-v1.pdf
Download links
A two-part list of links to download the article, or parts of the article, in various formats.
Downloads (link to download the article as PDF)
Open citations (links to open the citations from this article in various online reference manager services)
Cite this article (links to download the citations from this article in formats compatible with various reference manager tools)
MYC and Twist1 cooperate to drive metastasis by eliciting crosstalk between cancer and innate immunity
eLife 9:e50731.
https://doi.org/10.7554/eLife.50731


