YAP1 and TAZ negatively control bone angiogenesis by limiting hypoxia-inducible factor signaling in endothelial cells
- Max Planck Institute for Molecular Biomedicine, Germany
- University of Münster, Germany
- Institute of Basic Science (IBS), Republic of Korea
- Korea Advanced Institute of Science and Technology (KAIST), Republic of Korea
Figures
Figure 1 with 3 supplements
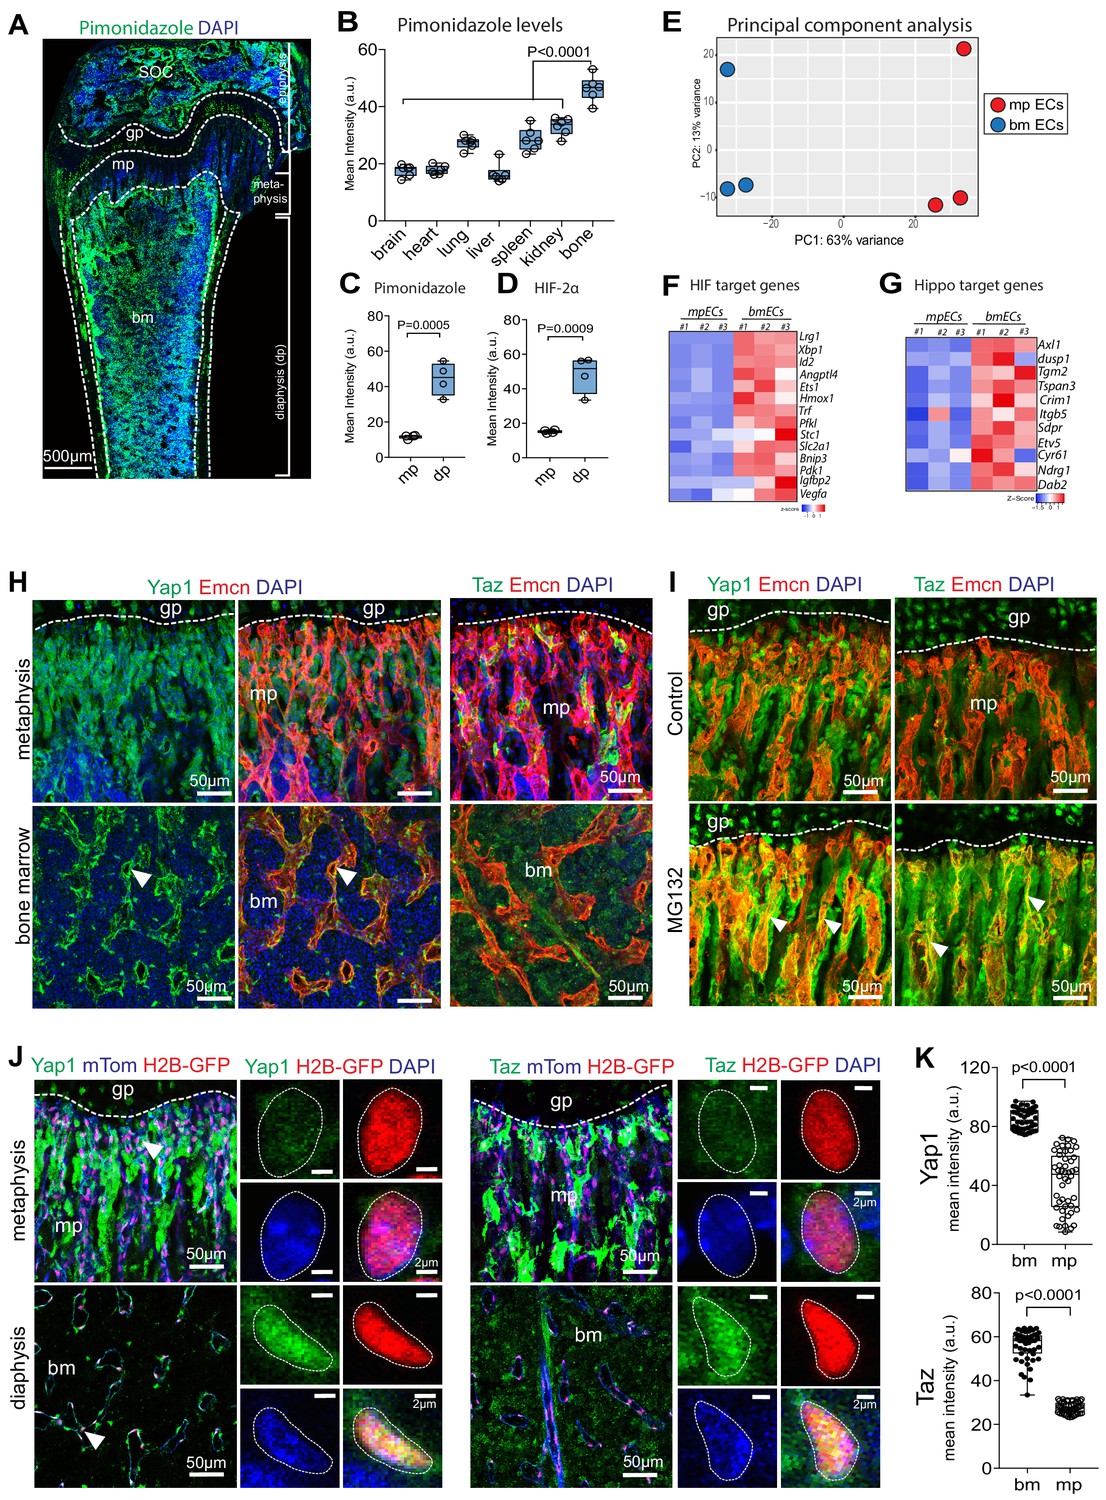
Regional differences in hypoxia and Yap1/Taz expression in bone.
(A) Tile scan maximum intensity projection of P21 femur with Pimonidazole (green) and DAPI (blue) staining. (B) Quantification of Pimonidazole staining intensity (artificial units, a.u.) in different organs. (C, D) Regional differences in Pimonidazole (C) and HIF2α (D) staining levels in metaphysis (mp) and diaphysis (dp). (E) Principal component analysis of RNA sequencing data using most variable genes across the samples. The first principal component (PC1) explains 63% of all variance; and PC2 13% of the variance between metaphyseal (mpECs) and diaphyseal/bone marrow (bmECs) endothelial cells. (F, G) Heat map showing differential expression of hypoxia (F) and Yap1/Taz (G) controlled genes in mpECs vs. bmECs. (H) Confocal image showing immunostaining of Yap1 and Taz (H) in 3-week-old wild-type femur. Arrowheads highlight expression in Emcn+ (red) ECs. Nuclei, DAPI (blue). (I) Immunostaining of Yap1 and Taz in the control (vehicle) and MG132 proteasome inhibitor-treated femoral metaphysis. (J) Nuclear localization (arrowheads) of Yap1 (green) in H2B-GFP+ EC nuclei (shown in red) in 3-week-old Cdh5-mTnG femoral metaphysis (mp) and bone marrow (bm). Higher magnification image shows strong Yap1 and Taz nuclear signals bmECs. (K) Mean intensity (a.u.) of Yap1 and Taz nuclear localization signals in bm and mp ECs. (n = 4; 48 cells in total; data are presented as mean ±sem, P values, two-tailed unpaired t-test).
-
Figure 1—source data 1
Source data for Figure 1B,C,D,F,G,K.
- https://cdn.elifesciences.org/articles/50770/elife-50770-fig1-data1-v1.xlsx
Figure 1—figure supplement 1
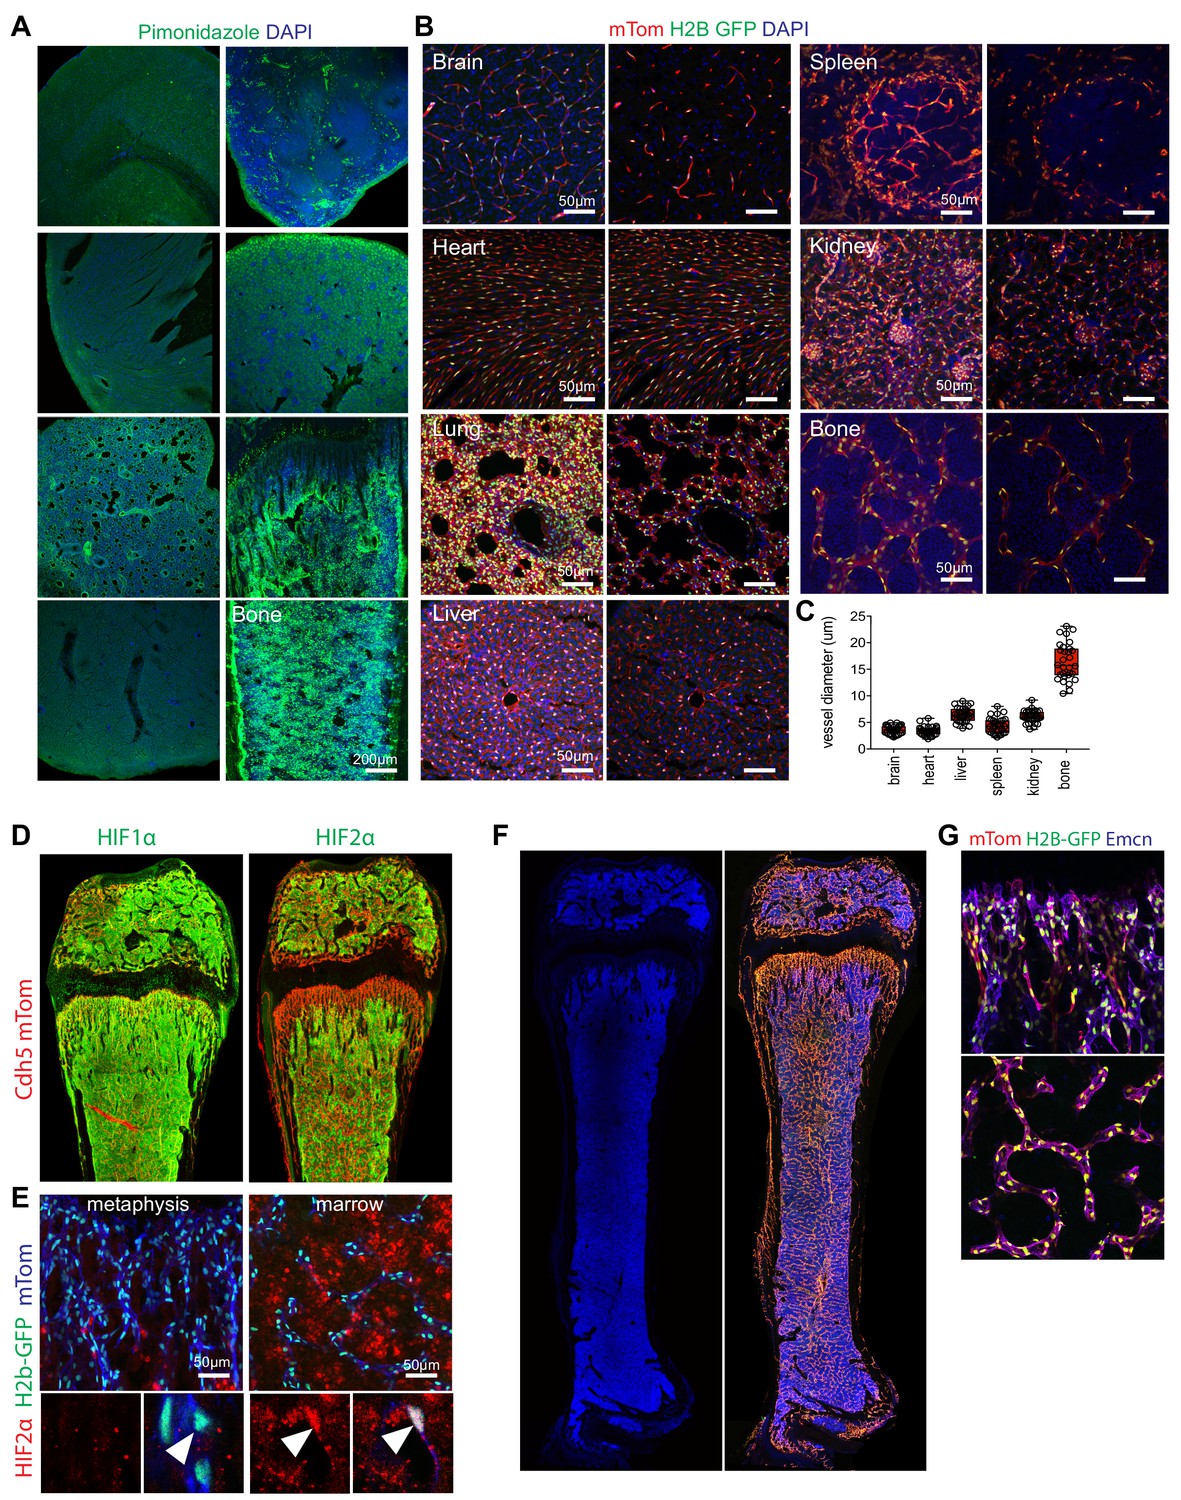
Bone-specific features of the vasculature.
(A) Maximum intensity projection of different organ stained with Pimonidazole (green) and DAPI (blue) at P21. (B) Representative confocal images of the vasculature in different organs from 3-week-old Cdh5-mTnG reporter mice (red, mTom; green, H2B-GFP; blue, DAPI). Panels on the left show maximum intensity projections, single focal planes are shown on the right. (C) Quantification of average vessel diameter in different organs (μM). (D, E) Tile scan maximum intensity projections of 3-week-old Cdh5-mTnG femur (red, mTom; green, HIF-1α or HIF-2α, as indicated) (D). Nuclear HIF2α immunosignal (red) is prominent in bone marrow (green, H2B-GFP; blue, mTom) (E). (F, G) Tile scan confocal images of 3-week-old Cdh5-mTnG reporter femur and DAPI (blue). The Cdh5-mTnG reporter labels bmECs and mpECs (F). Higher magnification images show H2B-GFP in endothelial nuclei (G).
-
Figure 1—figure supplement 1—source data 1
Source data for Figure 1—figure supplement 1C.
- https://cdn.elifesciences.org/articles/50770/elife-50770-fig1-figsupp1-data1-v1.xlsx
Figure 1—figure supplement 2
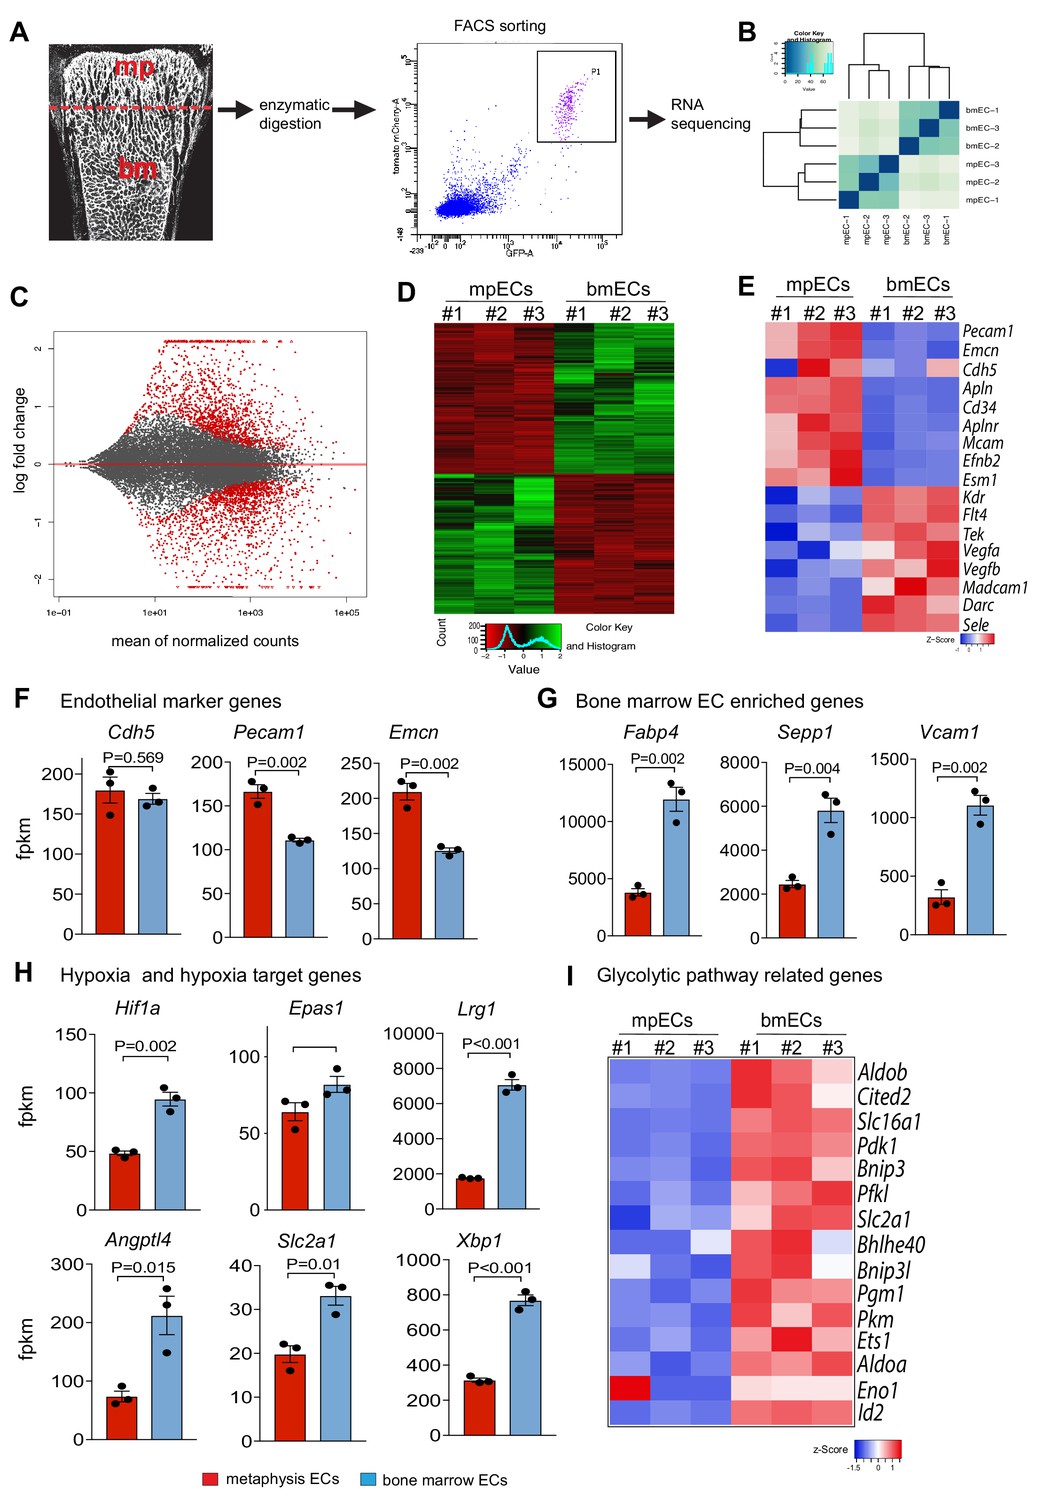
Spatial molecular differences between the metaphyseal and BM vasculature.
(A) Experimental strategy for FACS isolation of GFP+ mTom+ mpECs and bmECs from 3-week-old Cdh5-mTnG reporter bones for RNA sequencing. (B) Hierarchical clustering of RNA-seq data of mpECs and bmECs. (C) Differentially regulated genes in MA-plots of P21 mpECs and bmECs. The x-axis represents the mean normalized counts and the y-axis shows the log2 fold change between EC subtypes. Differentially regulated genes are represented by red colored points (FDR-adjusted p-value<0.01 and absolute log2 fold change <1). Data points outside of the range of the y-axis are represented as triangles. (D, E) Heatmap of differentially expressed genes in mpECs and bmECs (D) and differentially expressed endothelial marker genes (E). (F, G) Expression of the endothelial marker genes Pecam1 and Emcn are increased in mpECs, whereas Cdh5 expression is comparable between mpECs and bmECs (F). Fabp4, Sepp1 and Vcam1 are increased in bmECs relative to mpECs (G) (fpkm – fragments per kilobase million; n = 3; data are presented as mean ±sem). (H) Expression of hypoxia inducible factors Hif1a and Epas1 (Hif2a), and the target genes Lrg1, Angptl4, Slc2a1 and Xbp1 are increased in bmECs compared to mpECs (fpkm – fragments per kilobase million; n = 3; data are presented as mean ±sem). (I) Heatmap showing enrichment of glycolytic pathway-related genes in bmECs relative to mpECs.
-
Figure 1—figure supplement 2—source data 1
Source data for Figure 1—figure supplement 2E,F,G,H and I.
- https://cdn.elifesciences.org/articles/50770/elife-50770-fig1-figsupp2-data1-v1.xlsx
Figure 1—figure supplement 3
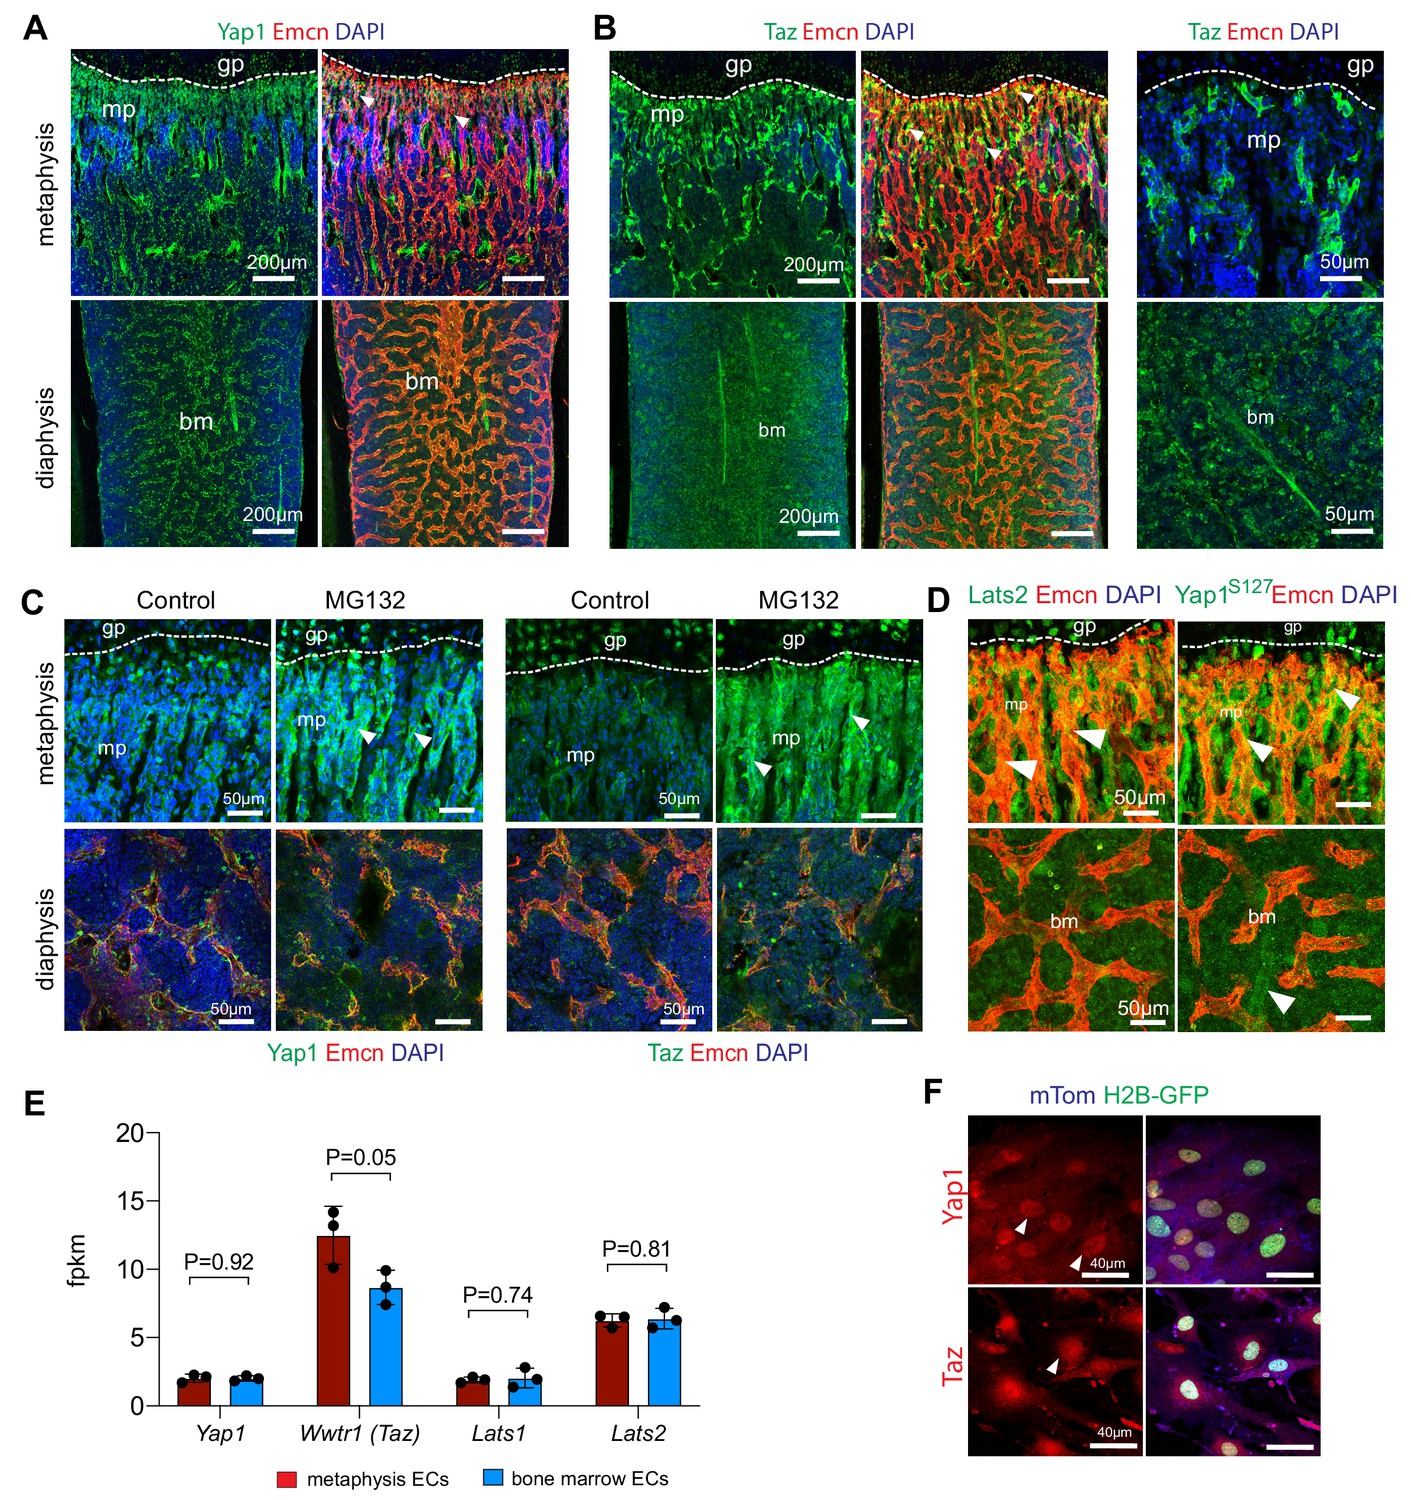
Hippo signaling in bone ECs.
(A–B) Confocal images of 3-week-old wild-type femoral sections showing Yap1 (green) (A), Taz (green) (B) immunostaining in the metaphyseal (mp) and bone marrow (bm) Emcn+ (red) vasculature. Nuclei (DAPI (blue). Arrows mark perivascular cells. Growth plate (gp) is indicated. (C) Immunostaining of Yap1 and Taz in control (vehicle) and MG132 proteasome inhibitor-treated femoral metaphysis and diaphysis. (D) Enhanced immunostaining of Lats2 and phospho-Yap1S127 in the metaphysis (mp) relative to bone marrow (bm). (E) RNA-seq data showing expression of the Yap1, Taz (Wwtr1), Lats1 and Lats2 in mpECs and bmECs (n = 3; data are presented as mean ±sem). (F) In vitro culture of bone ECs from Cdh5-mTnG reporter mice. Yap1 and Taz immunostaining is concentrated in nuclei.
-
Figure 1—figure supplement 3—source data 1
Source data for Figure 1—figure supplement 3E.
- https://cdn.elifesciences.org/articles/50770/elife-50770-fig1-figsupp3-data1-v1.xlsx
Figure 2 with 2 supplements
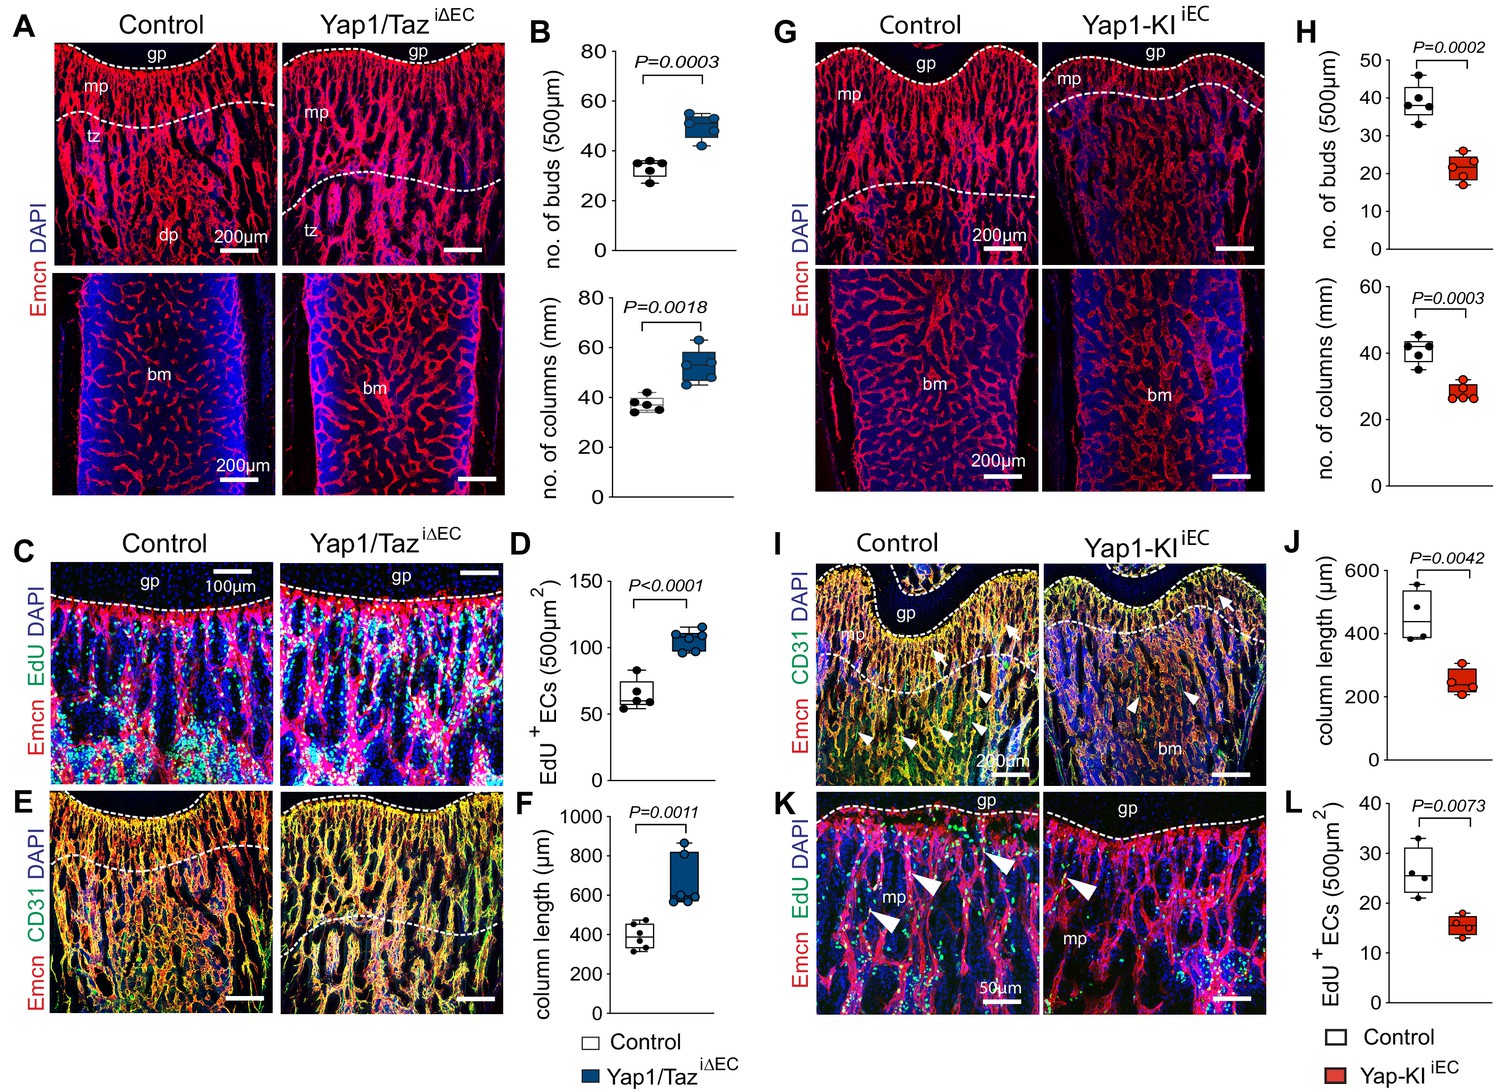
Yap1/Taz inhibits angiogenesis in bone.
(A, B) Representative confocal images of P21 control and Yap1/TaziΔEC femoral Emcn+ (red) vasculature (A). Nuclei, DAPI (blue). Metaphysis (mp), transition zone (tz), diaphysis (dp), and growth plate (gp) are indicated. Note the increased number of Yap1/TaziΔEC vessel buds and columns (B) compared to littermate control (n = 6, data are presented as mean ±sem. P values, two-tailed unpaired t-test). (C, D) Representative confocal image of Emcn+ (red) proliferating (EdU, green) mpECs. Nuclei, DAPI (blue) (C). Quantification of EdU+ Emcn+ ECs in Yap1/TaziΔEC and control metaphysis (D), (control n = 6 and Yap1/TaziΔECn = 7, data are presented as mean ±sem. P values, two-tailed unpaired t-test). (E, F) Maximum intensity projections of Emcnhi (red) CD31hi (green) vessels in the P21 Yap1/TaziΔEC and control femur (E). Metaphyseal column length is significantly increased in Yap1/TaziΔEC mutant compared to control femur (F) (n = 6 data are presented as mean ±sem. P values, two-tailed unpaired t-test). (G, H) Representative confocal images of control and Yap1-KIiEC femur. Emcn+ (red) ECs and nuclei (DAPI, blue) are stained (G). Vessel buds and columns are reduced in the Yap1-KIiEC metaphysis relative to littermate control (H) (n = 5, data are presented as mean ±sem. P values, two-tailed unpaired t-test). (I, J) Maximum intensity projection of Emcnhi (red) CD31hi (green) vessels in P21 Yap1-KIiEC and control femur. The vasculature of the metaphysis (mp) (arrows; dashed lines), the transition zone (tz) connecting the mp to the diaphysis (dp) and arteries (arrowheads) are reduced in Yap1 gain-of-function femur (I). The length of the Yap1-KIiEC Emcnhi CD31hi vessel columns in femur is significantly reduced (J) (control n = 4 data are presented as mean ±sem. P values, two-tailed unpaired t-test). (K, L) Representative confocal image of proliferating ECs (Emcn, red; EdU, green) in femoral metaphysis. Nuclei, DAPI (blue) (K). Quantification of EdU+ Emcn+ ECs in Yap1-KIiEC and control metaphysis (L) (control n = 4 data are presented as mean ±sem. P values, two-tailed unpaired t-test).
-
Figure 2—source data 1
Source data for Figure 2B,D,F,H,J,L.
- https://cdn.elifesciences.org/articles/50770/elife-50770-fig2-data1-v1.xlsx
Figure 2—figure supplement 1
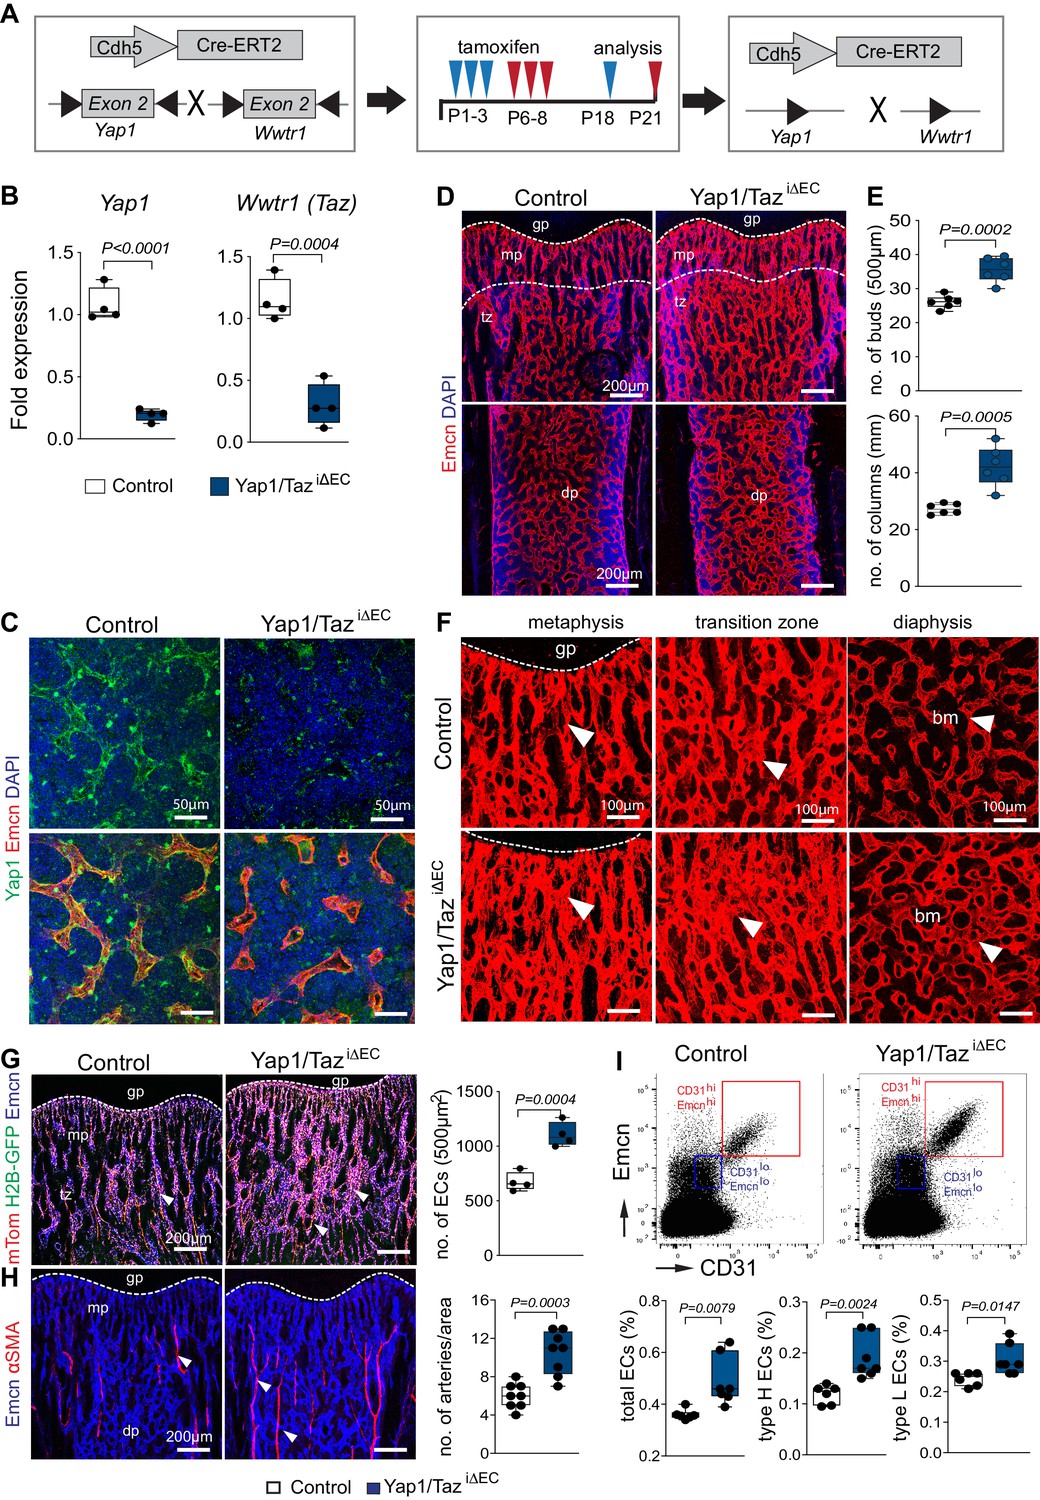
Endothelial Yap1/Taz in bone angiogenesis.
(A) Scheme showing the time points of tamoxifen administration and analysis of endothelial specific (Cdh5-Cre-ERT2) Yap1 and Wwtr1 double (Yap1/TaziΔEC) mutants. Mutants were sacrificed at P18 following tamoxifen treatment at P1-3 (red arrowheads) or at P21 after treatment at P6-8 (blue arrowheads), respectively. (B, C) Yap1 and Wwtr1 transcript levels are significantly decreased in freshly isolated Yap1/TaziΔEC mutant bone ECs compared to control (B). Yap1 immunostaining is reduced in P21 Yap1/TaziΔEC mutant bone vessels compared to control (C). (n = 4, data are presented as mean ±sem. P values, two-tailed unpaired t-test). (D, E) Representative confocal images of control and Yap1/TaziΔEC femoral Emcn+ (red) vasculature at P18. Nuclei in (D), DAPI (blue). Metaphysis (mp), transition zone (tz), diaphysis (dp), and growth plate (gp) are indicated. Note the increased number of Yap1/TaziΔEC vessel buds and arches (E) compared to littermate control (n = 6, data are presented as mean ±sem. P values, two-tailed unpaired t-test). (F) High magnification confocal images of the P18 metaphysis, transition zone, and diaphysis showing the changes in Yap1/TaziΔEC vascular architecture relative to littermate control. (G) Maximum intensity projections showing ECs in P21 Yap1/TaziΔEC Cdh5-mTnG femur compared to littermate control. Arteries (arrowheads) show high expression of Cdh5-mTnG reporter (red and green) and are Emcn (blue) negative. Graphs show quantitation of ECs in femur. (Control n = 4 and Yap1/TaziΔECn = 4; data are presented as mean ±sem. P values, two-tailed unpaired t-test). (H) Arteries, which are negative for Emcn (blue) and covered by α-smooth muscle actin (αSMA)-positive cells (red), are significantly increased in Yap1/TaziΔEC bone sections (n = 8, data are presented as mean ±sem. P values, two-tailed unpaired t-test). (I) Representative flow cytometry dot plots (top) and quantification (bar graphs, bottom) of bone ECs from control and Yap1/TaziΔEC mutants at P21. Total ECs and type H (Emcnhi CD31hi) cells are increased in Yap1/TaziΔEC mutants (n = 6, 7; data are presented as mean ±sem. P values, two-tailed unpaired t-test).
-
Figure 2—figure supplement 1—source data 1
Source data for Figure 2—figure supplement 1B,E,G,H,I.
- https://cdn.elifesciences.org/articles/50770/elife-50770-fig2-figsupp1-data1-v1.xlsx
Figure 2—figure supplement 2
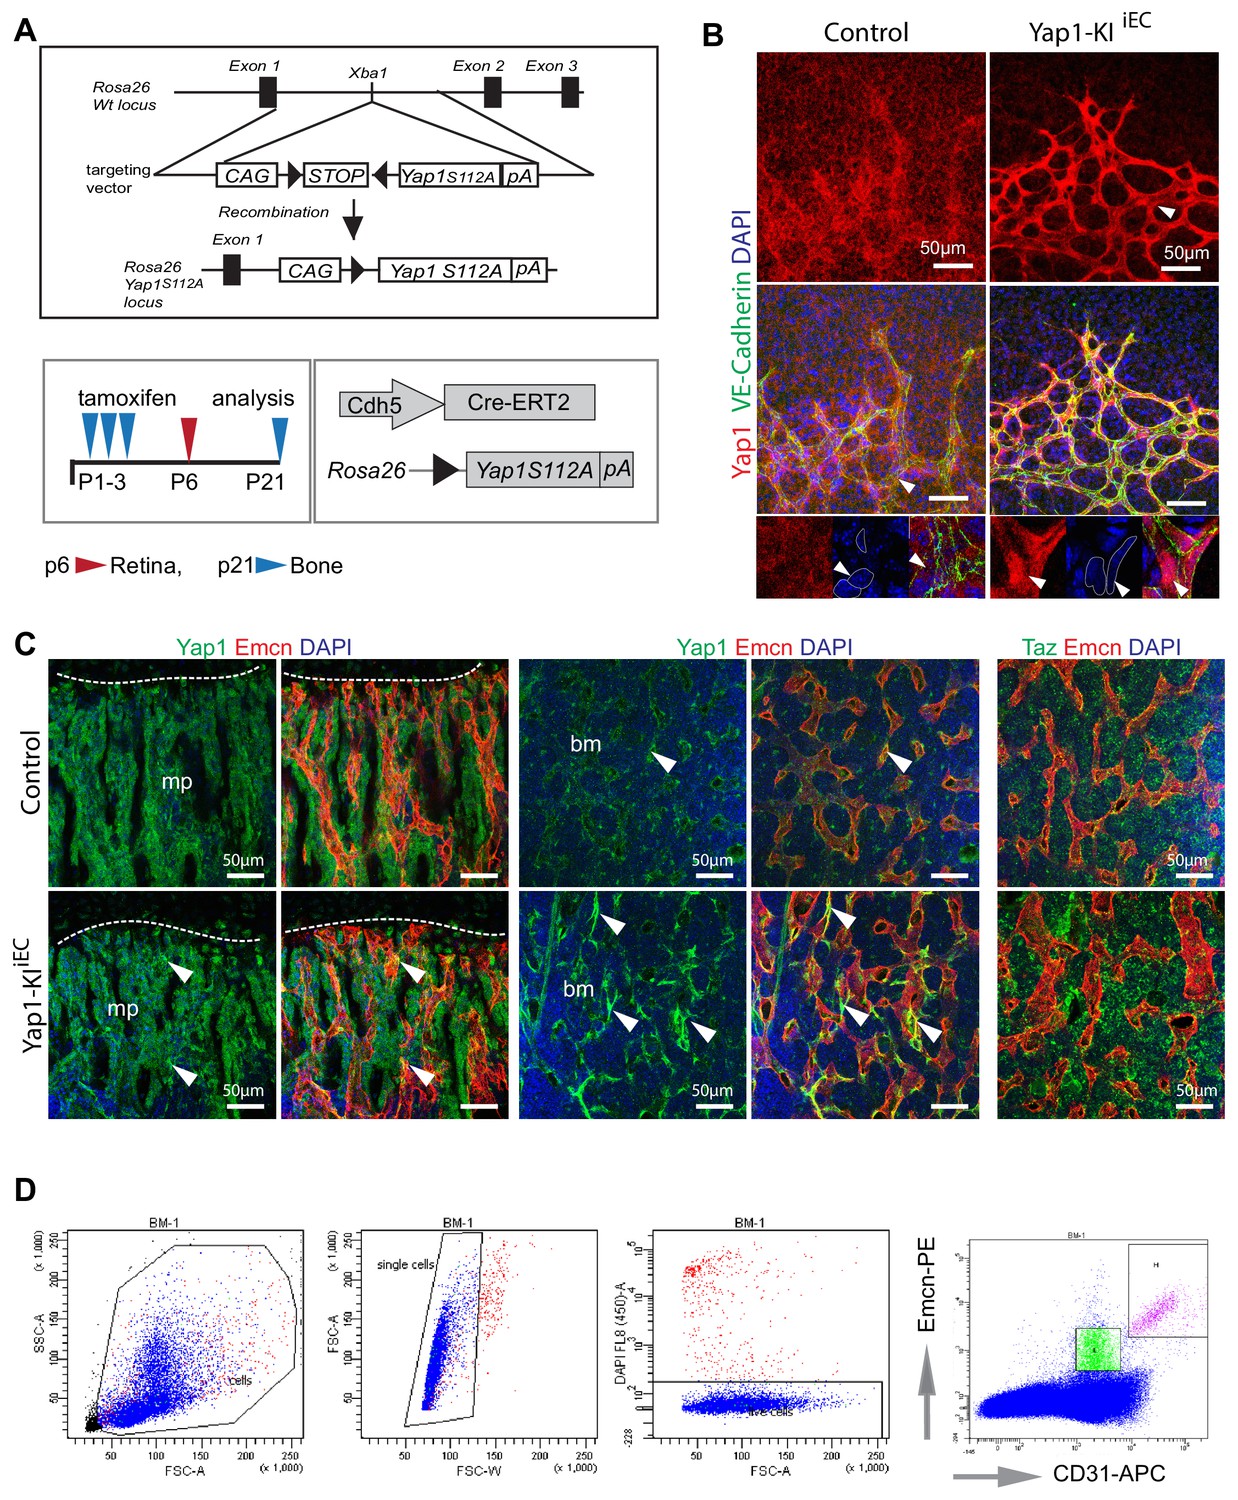
Overexpression of Yap1 in ECs inhibits angiogenesis in bone.
(A) Strategy for overexpression of constitutively active Yap1 in endothelial cells. A cassette containing the CAG promoter, a floxed STOP sequence, a cDNA encoding Yap1S112A (in which serine residue 112 was mutated to alanine) followed by the polyadenylation signal from bovine growth hormone was inserted by homologous recombination into the Rosa26 locus. After interbreeding with Cdh5-CreERT2 transgenic animals, Yap1S112A expression was induced by tamoxifen administration at P1-3 followed by analysis at P6 (red arrowhead) for the analysis of retinas or at P21 (blue arrowhead) for bone samples. (B) Increased Yap1 (red) expression and nuclear localization (bottom panels) in the P6 Yap1-KIiEC retinal vasculature compared to control. (C) High magnification confocal images of metaphysis and diaphysis showing changes in Yap1 and Taz expression in Yap1-KIiEC ECs relative to littermate control. (D) Representative gating strategy for sorting of type H (Emcnhigh, CD31high) and type L (Emcnlow, CD31low) bone EC subpopulations.
Figure 3 with 3 supplements
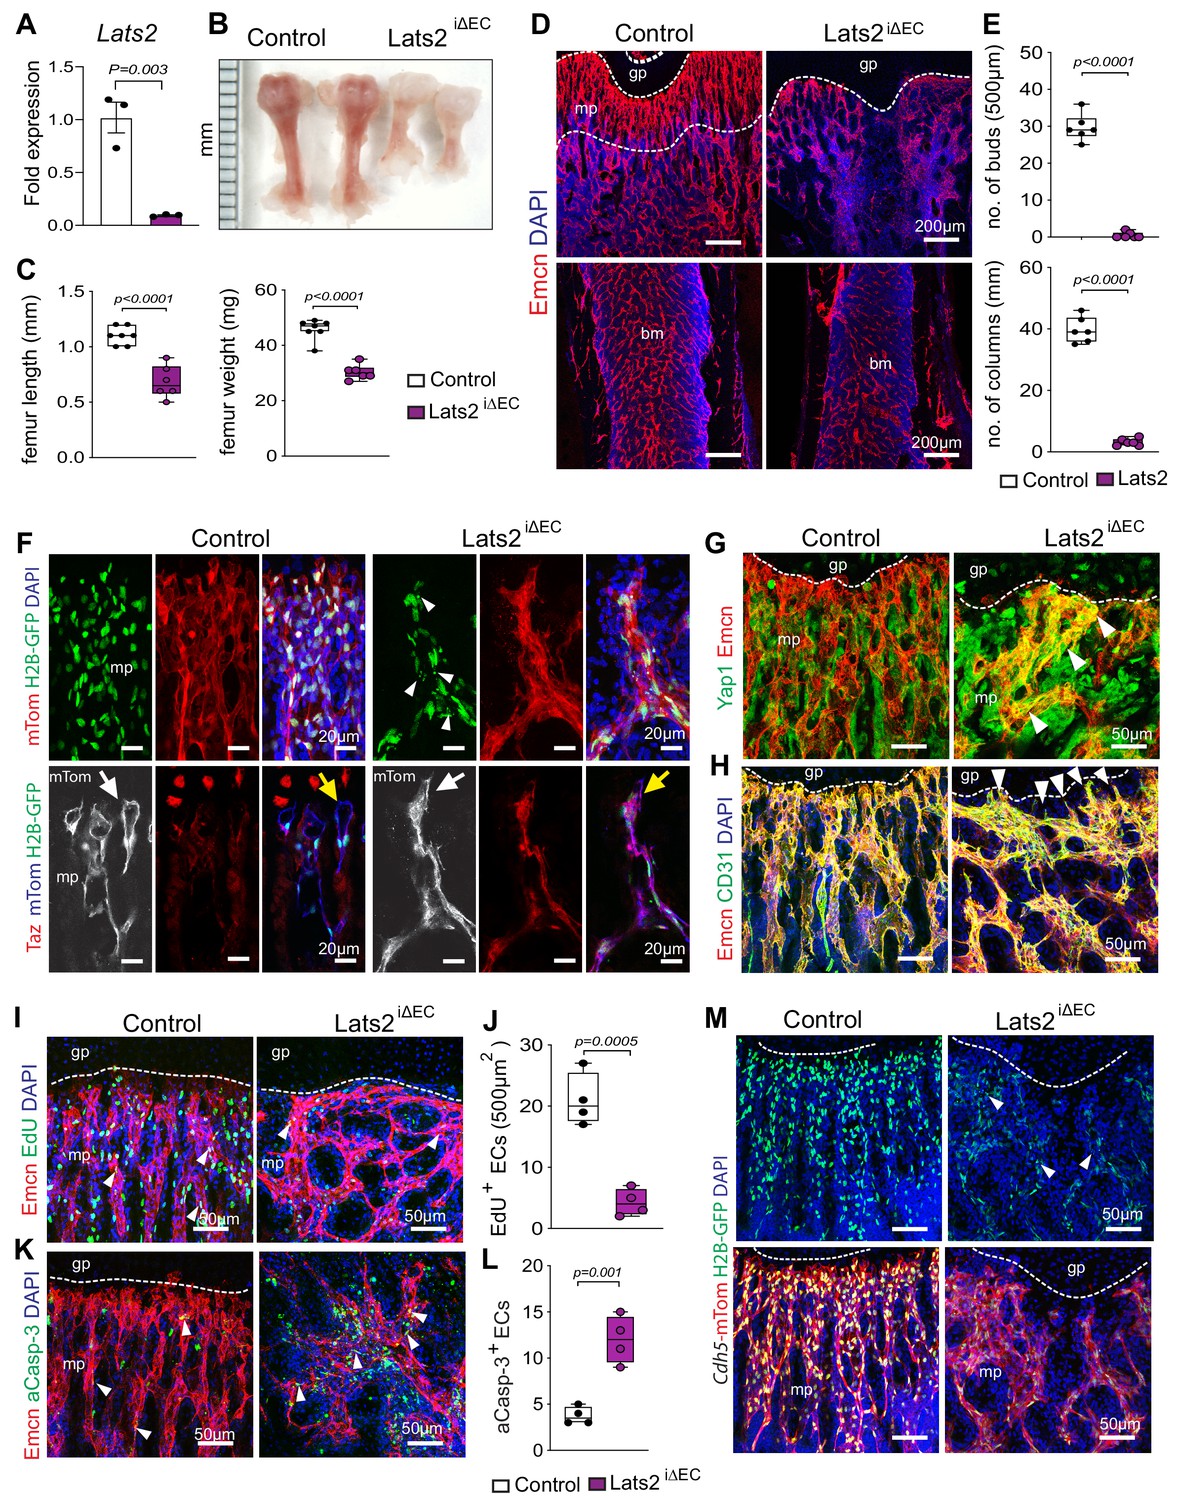
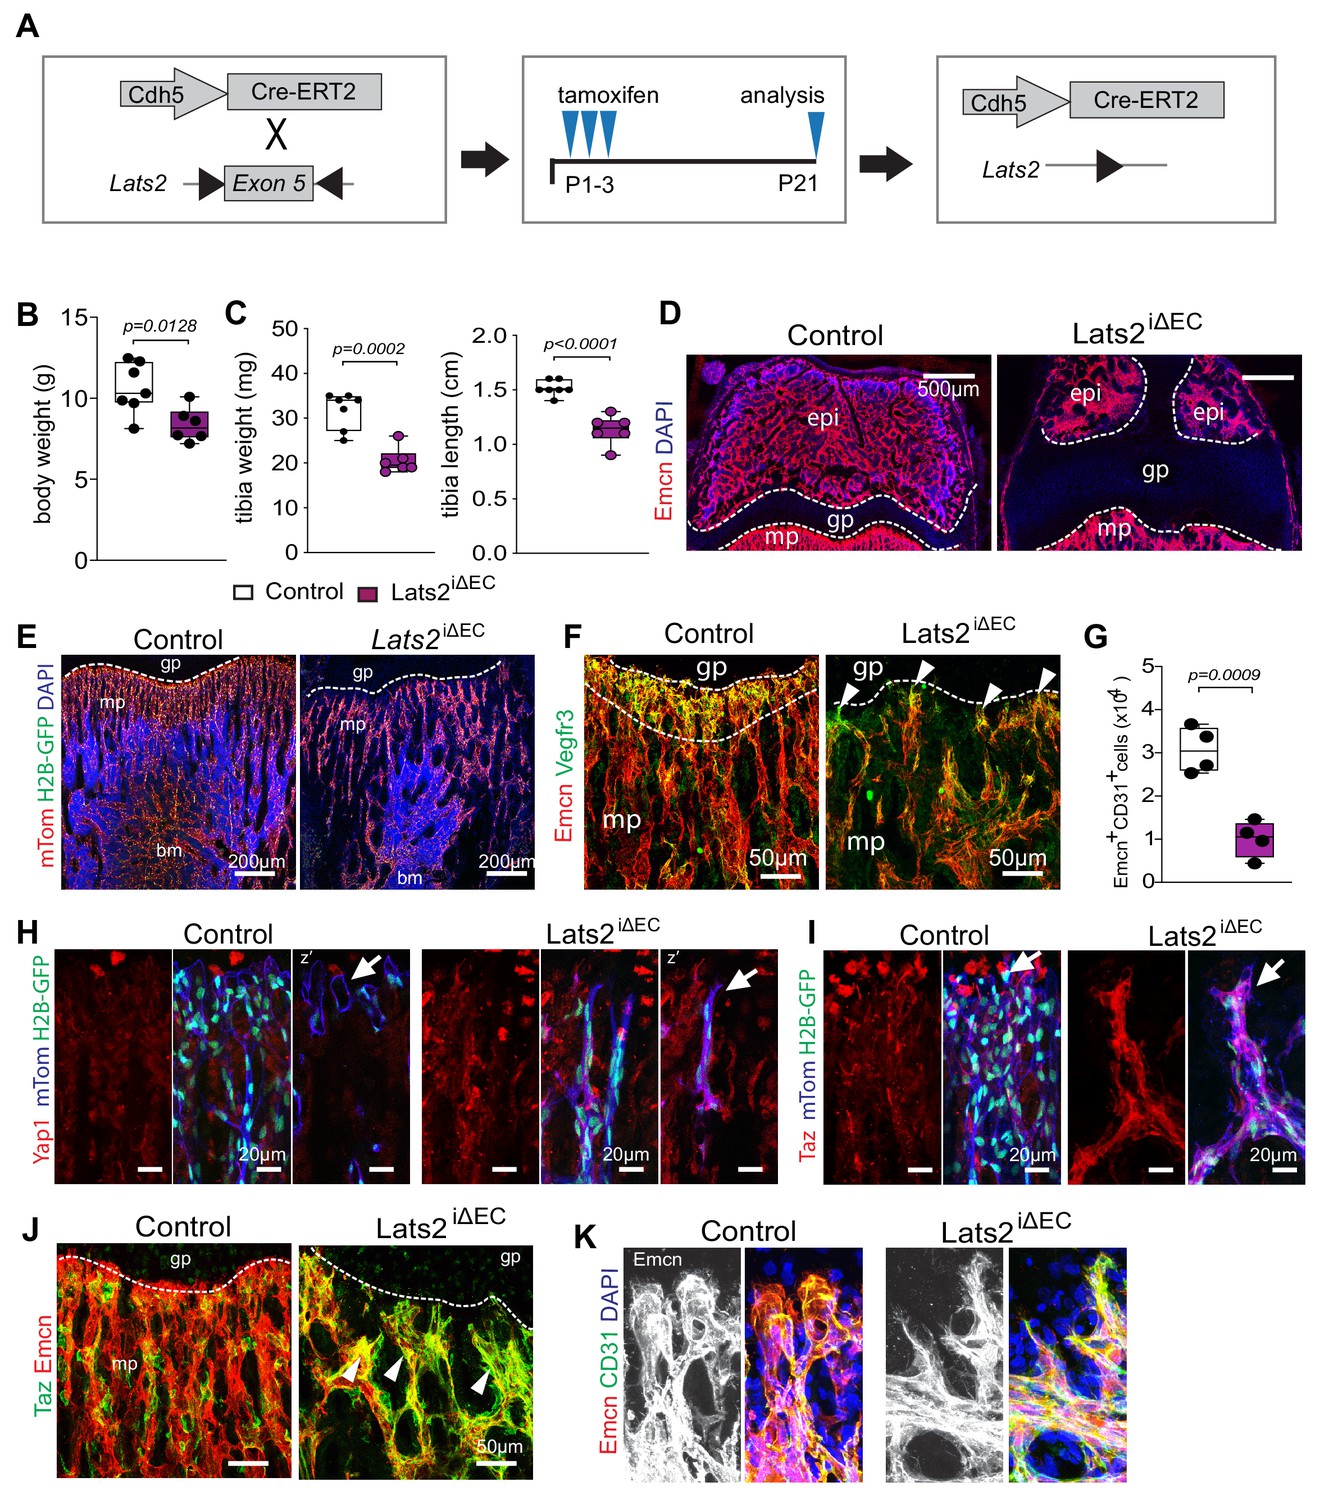
Endothelial Lats2 promotes angiogenesis in bone.
(A) Lats2 transcript levels are significantly decreased in freshly isolated Lats2iΔEC mutant bone ECs compared to control. (n = 3, data are presented as mean ±sem. P values, two-tailed unpaired t-test). (B, C) Freshly dissected P21 Lats2iΔEC mutant femur relative to littermate control (B). Femur length (mm) and weight are reduced in Lats2iΔEC mutants (C). (control n = 7 and mutant n = 6; data are presented as mean ±sem, P values, two-tailed unpaired t-test). (D, E) Representative confocal images of P21 control and Lats2iΔEC femur stained with Emcn+ (red) vasculature, and nuclei in DAPI (blue) (D). Vessel buds and columns are strongly reduced in Lats2iΔEC mutants compared to littermate controls (E). (n = 6, data are presented as mean ±sem. P values, two-tailed unpaired t-test). (F) Lats2iΔEC distal vessel buds and arches switch to a tip-like morphology (arrow). The Cdh5-mTnG reporter (red and green) visualizes nuclear fragmentation (arrowheads) in Lats2iΔEC ECs but not in control. Taz immunosignal is strongly increased in Lats2iΔEC mutants. (G) Yap1 (green) immunosignal is enhanced in Lats2iΔEC metaphyseal vessels (Emcn, red). (H) Confocal image of control and Lats2iΔEC femoral metaphysis stained for Emcn (red), CD31 (green), and nuclei (DAPI, blue). (I, J) Representative confocal image of proliferating (Emcn+, red; EdU+, green) ECs in metaphysis. Nuclei (DAPI, blue) (I). Quantification of EdU+ Emcn+ ECs in Lats2iΔEC and control metaphysis (J) (control n = 4 and Lats2iΔECn = 4 data are presented as mean ±sem. P values, two-tailed unpaired t-test). (K, L) Apoptotic Emcn+ (red) and active caspase-3+ (aCasp-3, green) ECs in metaphysis. Nuclei (DAPI, blue) (K). Quantification of Emcn+ aCasp-3+ ECs (L) (control n = 4 and Lats2iΔECn = 4 data are presented as mean ±sem. P values, two-tailed unpaired t-test). (M) Representative confocal image of Lats2iΔEC Cdh5-mTnG femur compared to littermate control.
-
Figure 3—source data 1
Source data for Figure 3A,C,E,J,L.
- https://cdn.elifesciences.org/articles/50770/elife-50770-fig3-data1-v1.xlsx
Figure 3—figure supplement 1
Endothelial Lats2 promotes bone angiogenesis.
(A) Scheme showing the time points of tamoxifen administration and analysis of Lats2iΔEC mutants. (B, C) Average body weight (B) and tibia weight and length (C) of control and Lats2iΔEC mutants (Control n = 7; mutant = 6). Data are presented as mean ±sem, P values, two-tailed unpaired t-test). (D) Representative images of P21 control and Lats2iΔEC femoral epiphysis with vessels (Emcn, red) in secondary ossification center. Nuclei, DAPI (blue). (E) Representative images of 3-week-old Cdh5-mTnG (red and green) control and Lats2iΔEC mutant bones. (F) Representative images of P21 control and Lats2iΔEC femoral metaphyseal vessels stained for Emcn (red) and VEGFR3 (green). VEGFR3, a marker of vessel buds in proximity of the growth plate, is reduced in Lats2iΔEC mutants. (G) Graph showing the results of the flow cytometric analysis of the number of Emcn+ CD31+ ECs (n = 4, data are presented as mean ±sem. P values, two-tailed unpaired t-test). (H, I) Representative images of P21 Cdh5-mTnG (red and green) control and Lats2iΔEC bones. Yap1 (H) and Taz (I) expression and tip-like cells (arrow) are increased in mutant metaphyseal vessels. (J) Representative images of P21 control and Lats2iΔEC femoral increased Taz immunosignal (green) in the Lats2iΔEC metaphyseal vasculature (Emcn, red) relative to control. (K) High magnification of confocal image showing that buds are replaced by sprout-like structures in Lats2iΔEC mutants.
-
Figure 3—figure supplement 1—source data 1
Source data for Figure 3—figure supplement 1B,C,G.
- https://cdn.elifesciences.org/articles/50770/elife-50770-fig3-figsupp1-data1-v1.xlsx
Figure 3—figure supplement 2
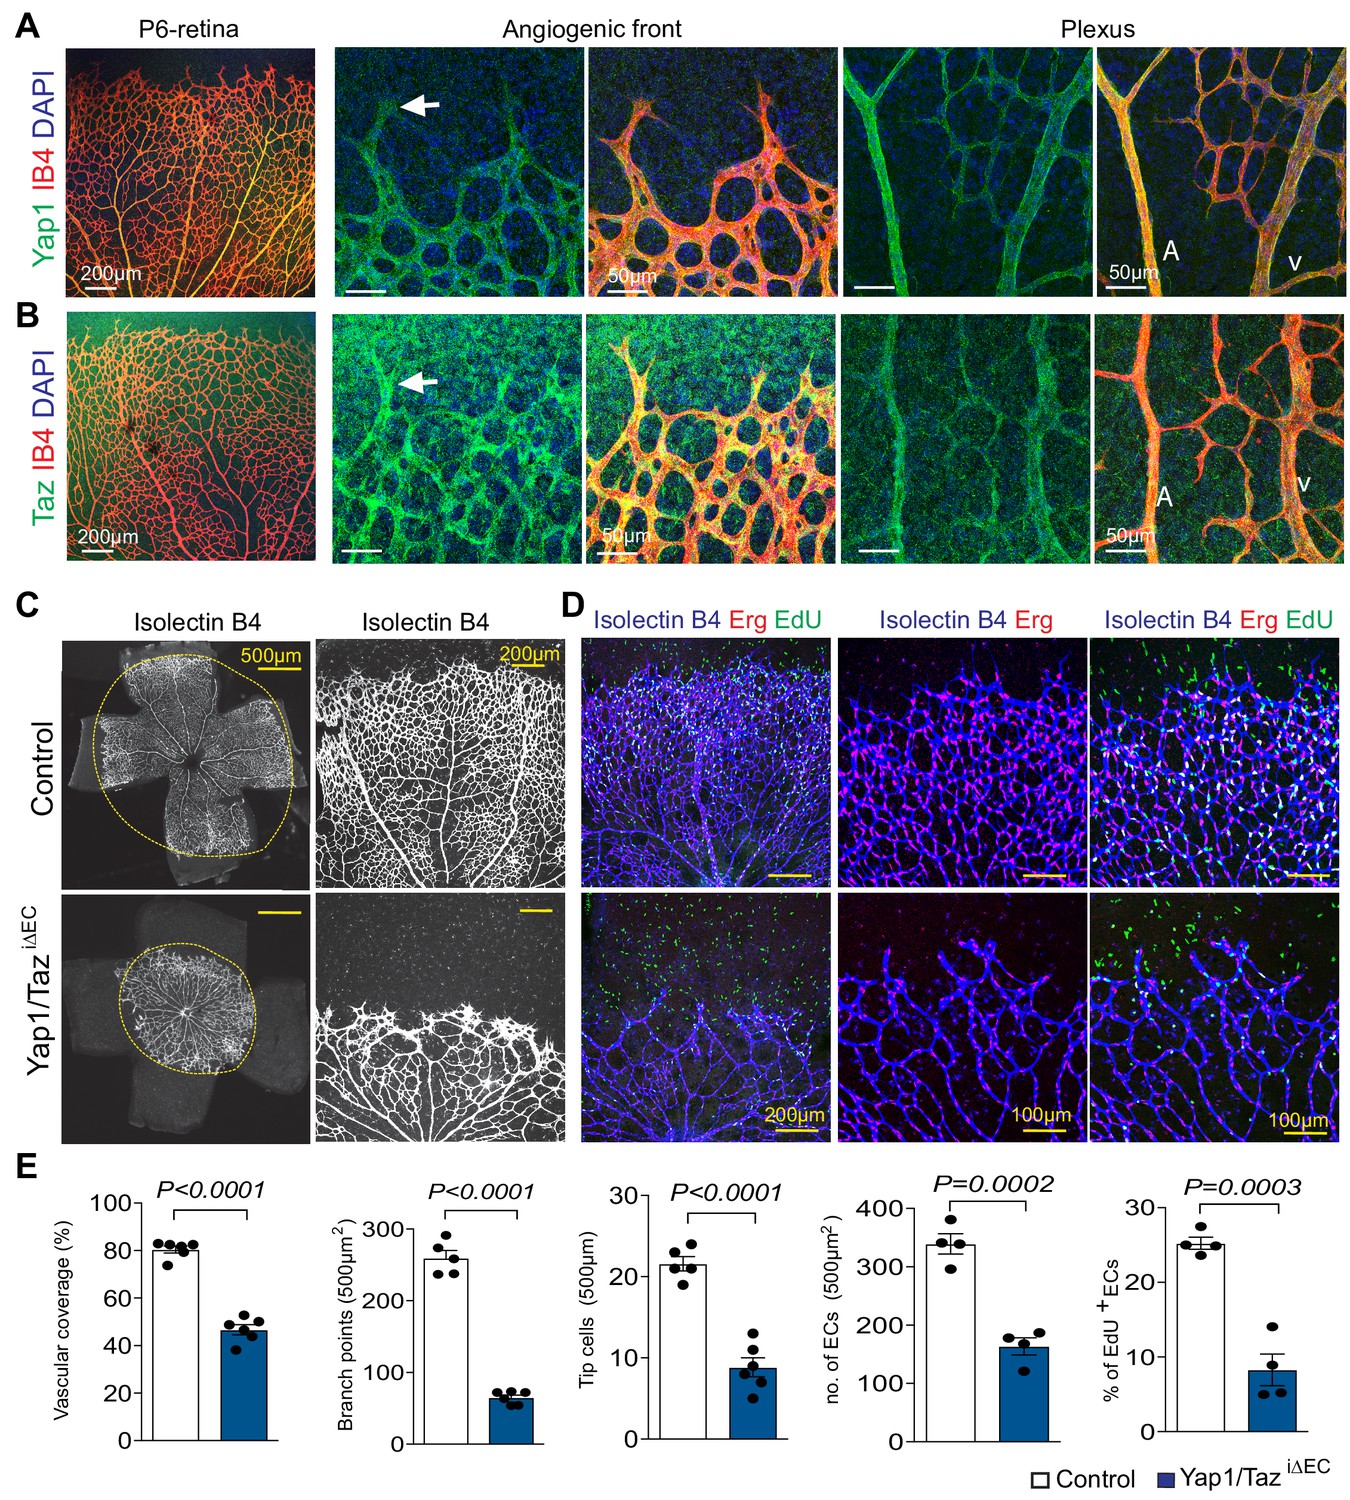
Endothelial Yap1/Taz in retinal angiogenesis.
(A, B) P6 retina whole-mount immunostaining of Yap1 (A), green) and Taz (B), green) shows expression of Isolectin B4-positive (IB4, red) retinal vessels. Higher magnifications show sprouts at the angiogenic front (center) and arteries (A) and veins (V) in the central plexus. (C–E) Confocal images of P6 retina whole-mount showing the Isolectin B4-stained Yap1/TaziΔEC and littermate control vasculature (C). Higher magnification images show staining with Isolectin B4 (blue), anti-Erg antibody (EC nuclei, red) and EdU (green) cells. Nuclei of EdU+ ECs appear white (D). Reduction of vascular coverage, branching, tip cells, number of Erg+ ECs, and percentage of proliferating Erg+ EdU+ ECs in Yap1/TaziΔEC mutant retinal vessels (E) (n = 6 and 4; data are presented as mean ±sem. P values, two-tailed unpaired t-test).
-
Figure 3—figure supplement 2—source data 1
Source data for Figure 3—figure supplement 2E.
- https://cdn.elifesciences.org/articles/50770/elife-50770-fig3-figsupp2-data1-v1.xlsx
Figure 3—figure supplement 3
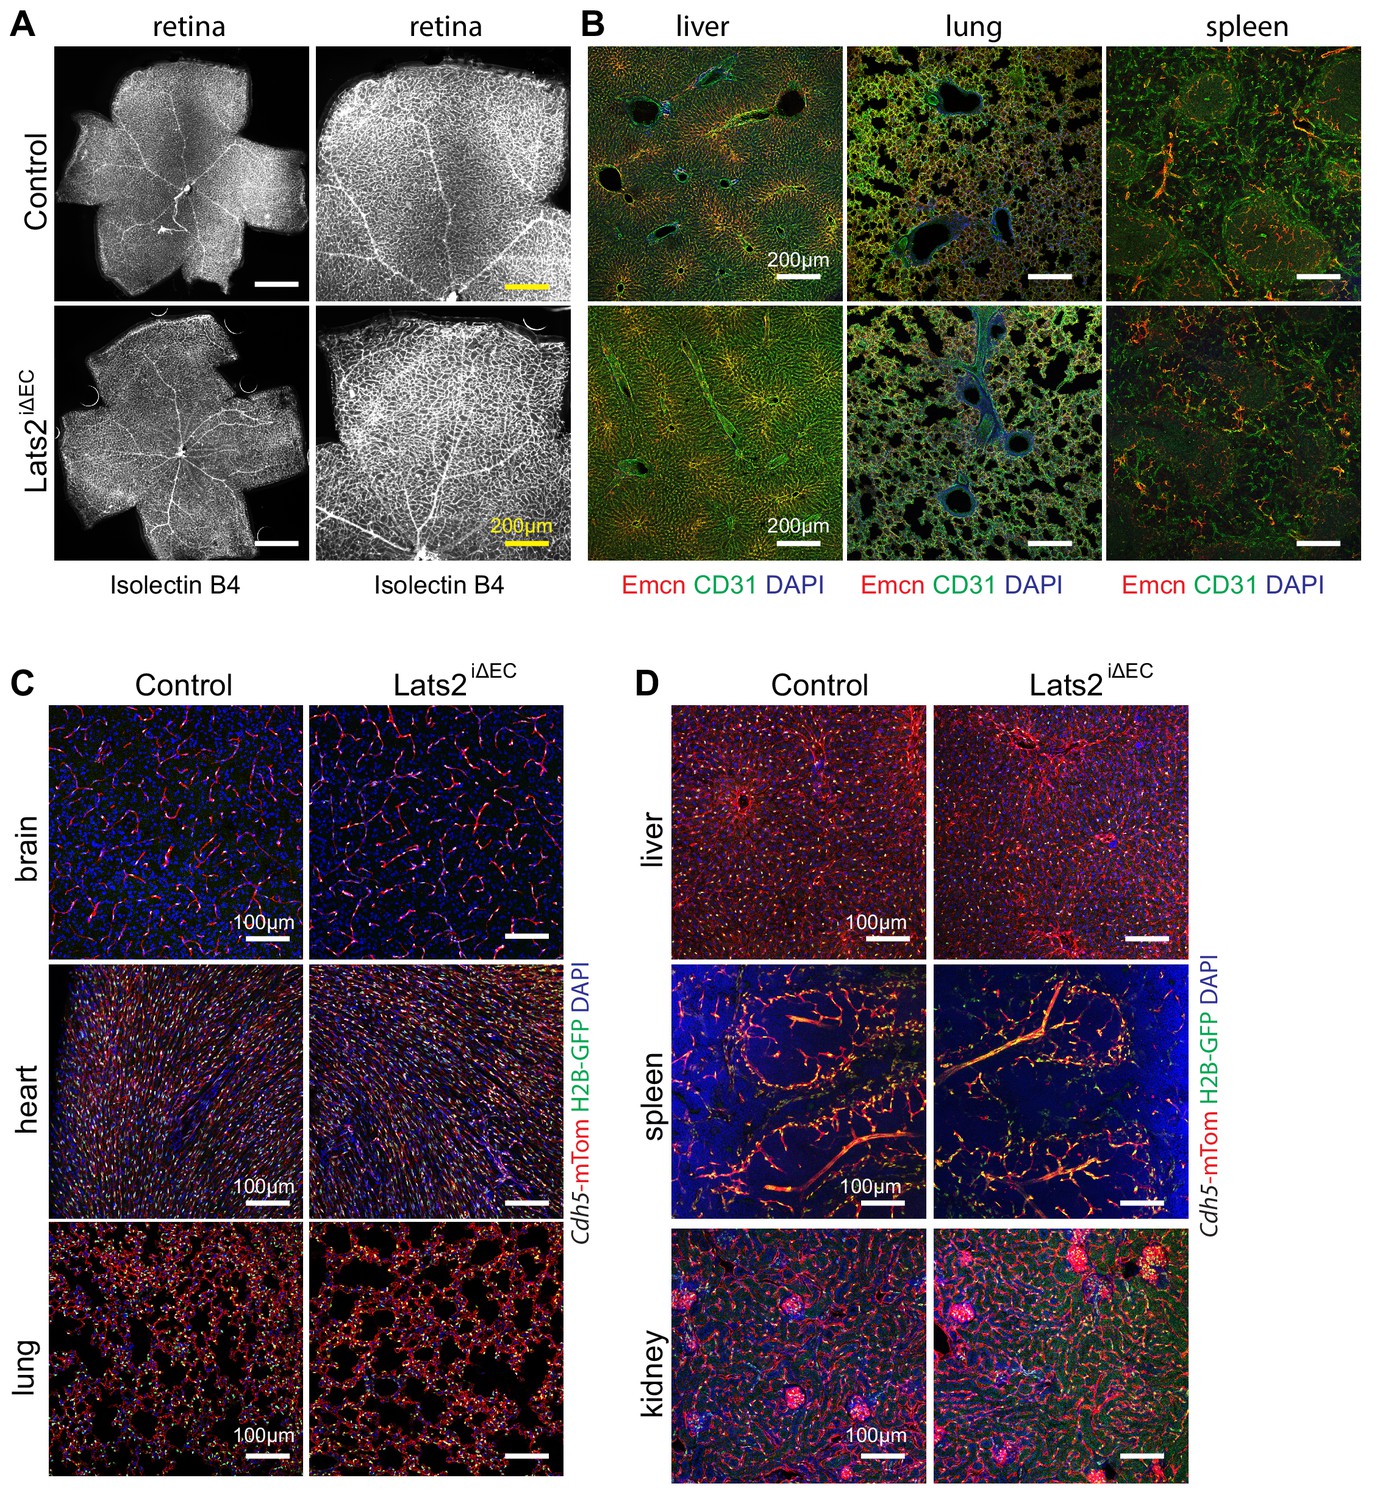
Endothelial Lats2 in organ-specific angiogenesis.
(A, B) Images of control and Lats2iΔEC P21 retina whole mounts stained with Isolectin B4 (A). Representative confocal images of the vasculature in sections from control and Lats2iΔEC mutant liver, lung, and spleen stained with Emcn (red), CD31 (green), DAPI (blue) (B). (C, D) Representative confocal images of the vasculature in different organs from 3-week-old Lats2iΔEC mutant and littermate controls positive for the Cdh5-mTnG reporter allele (red, mTom; green, H2B-GFP; blue, DAPI).
Figure 4 with 1 supplement
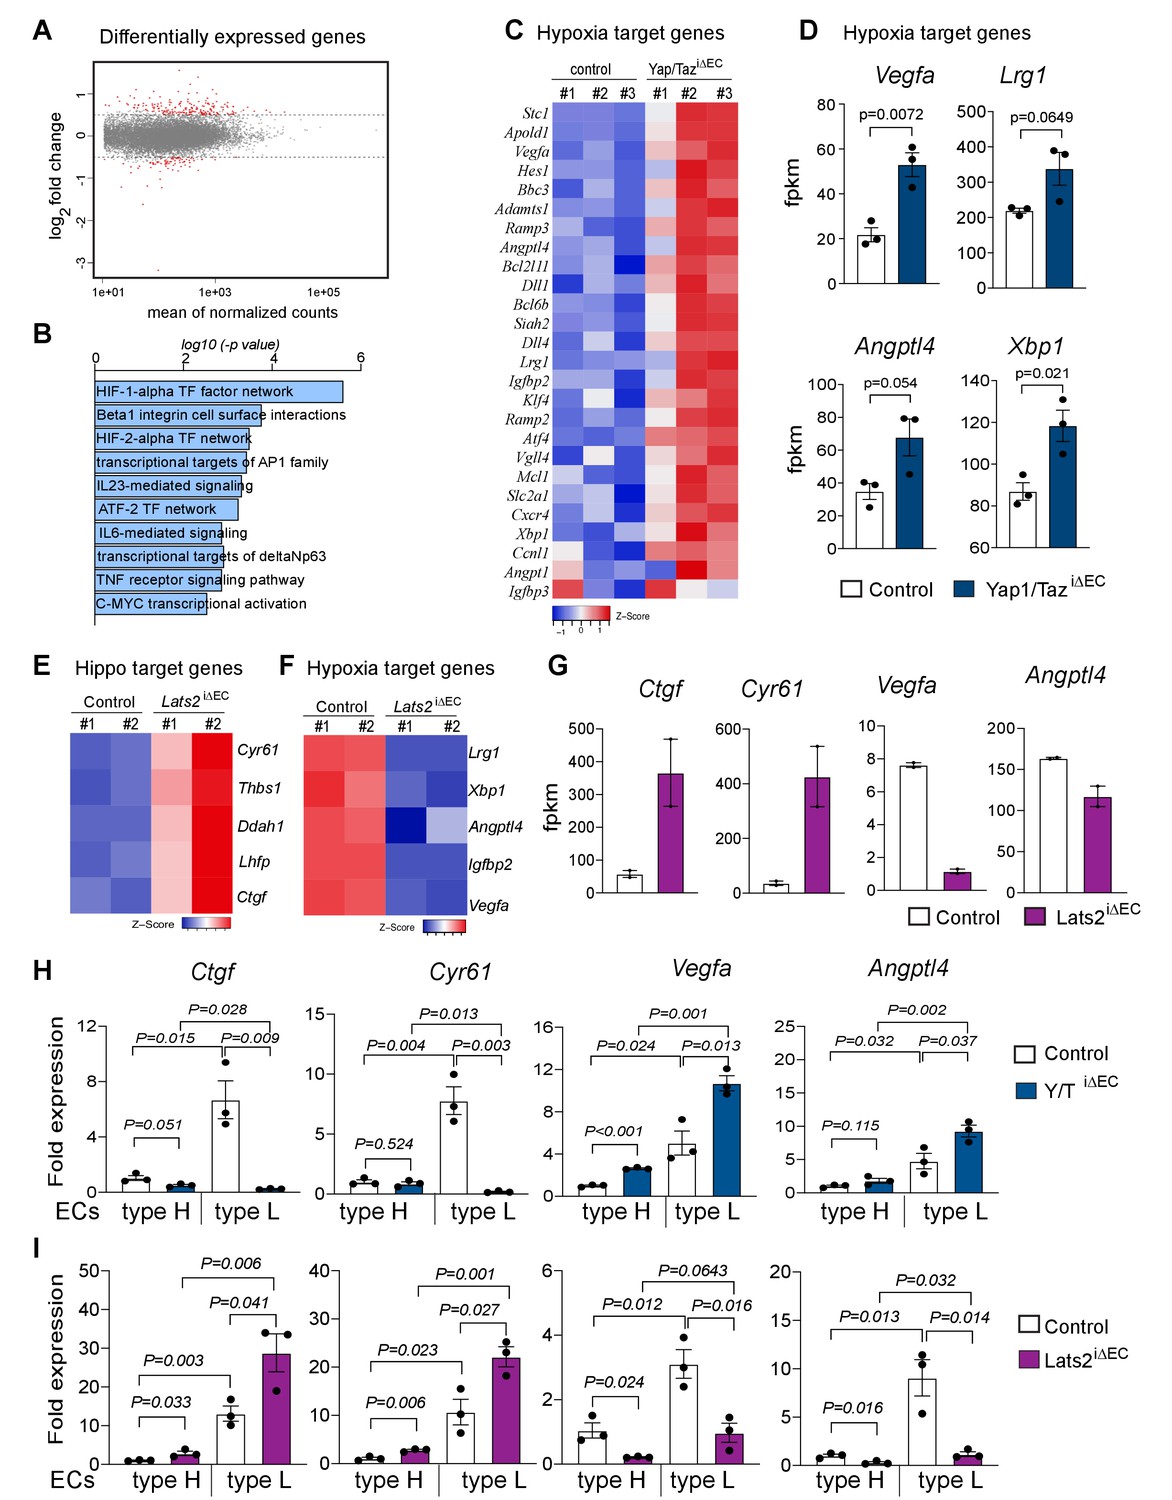
Loss of Yap1/Taz changes hypoxia target gene expression in bone ECs.
(A) Differentially expressed genes determined by RNA-seq analysis of ECs from 3-week-old control vs. Yap1/TaziΔEC mutant bone (n = 3; log2 fold change). (B) Bar graph showing enrichment of cellular signaling pathway components among Yap1/TaziΔEC upregulated genes. (C) Heatmap of upregulated HIF1α target genes in Yap1/TaziΔEC bone ECs. (D) RNA-seq data showing expression of the HIF1α target genes Vegfa, Lrg1, Angptl4, and Xbp1 in control and mutant bone ECs (n = 3; data are presented as mean ±sem). (E, F) Heatmaps of Hippo pathway (E) and hypoxia (F) target genes. Expression of Cyr61, Thbs1, Ddah1, Lhfp, and Ctgf is increased in Lats2iΔEC ECs relative to control, whereas the HIF1α targets Lrg1, Xbp1, Angptl4, Igfbp2, and Vegfa are decreased. (G) Bar graph showing Ctgf, Cyr61, Vegfa and Angptl4 gene expression levels in control and Lats2iΔEC mutant ECs. (H, I) Expression of the Yap1/Taz targets Ctgf, Cyr61 and the HIF1α targets Vegfa, Angptl4 in freshly isolated type H and type L EC subpopulations from P21 Yap1/TaziΔEC (H) and Lats2iΔEC (I) bone samples.
-
Figure 4—source data 1
Source data for Figure 4C,D,E,F,G,H,I.
- https://cdn.elifesciences.org/articles/50770/elife-50770-fig4-data1-v1.xlsx
Figure 4—figure supplement 1
The Hippo pathway regulates HIF1α-controlled gene expression.
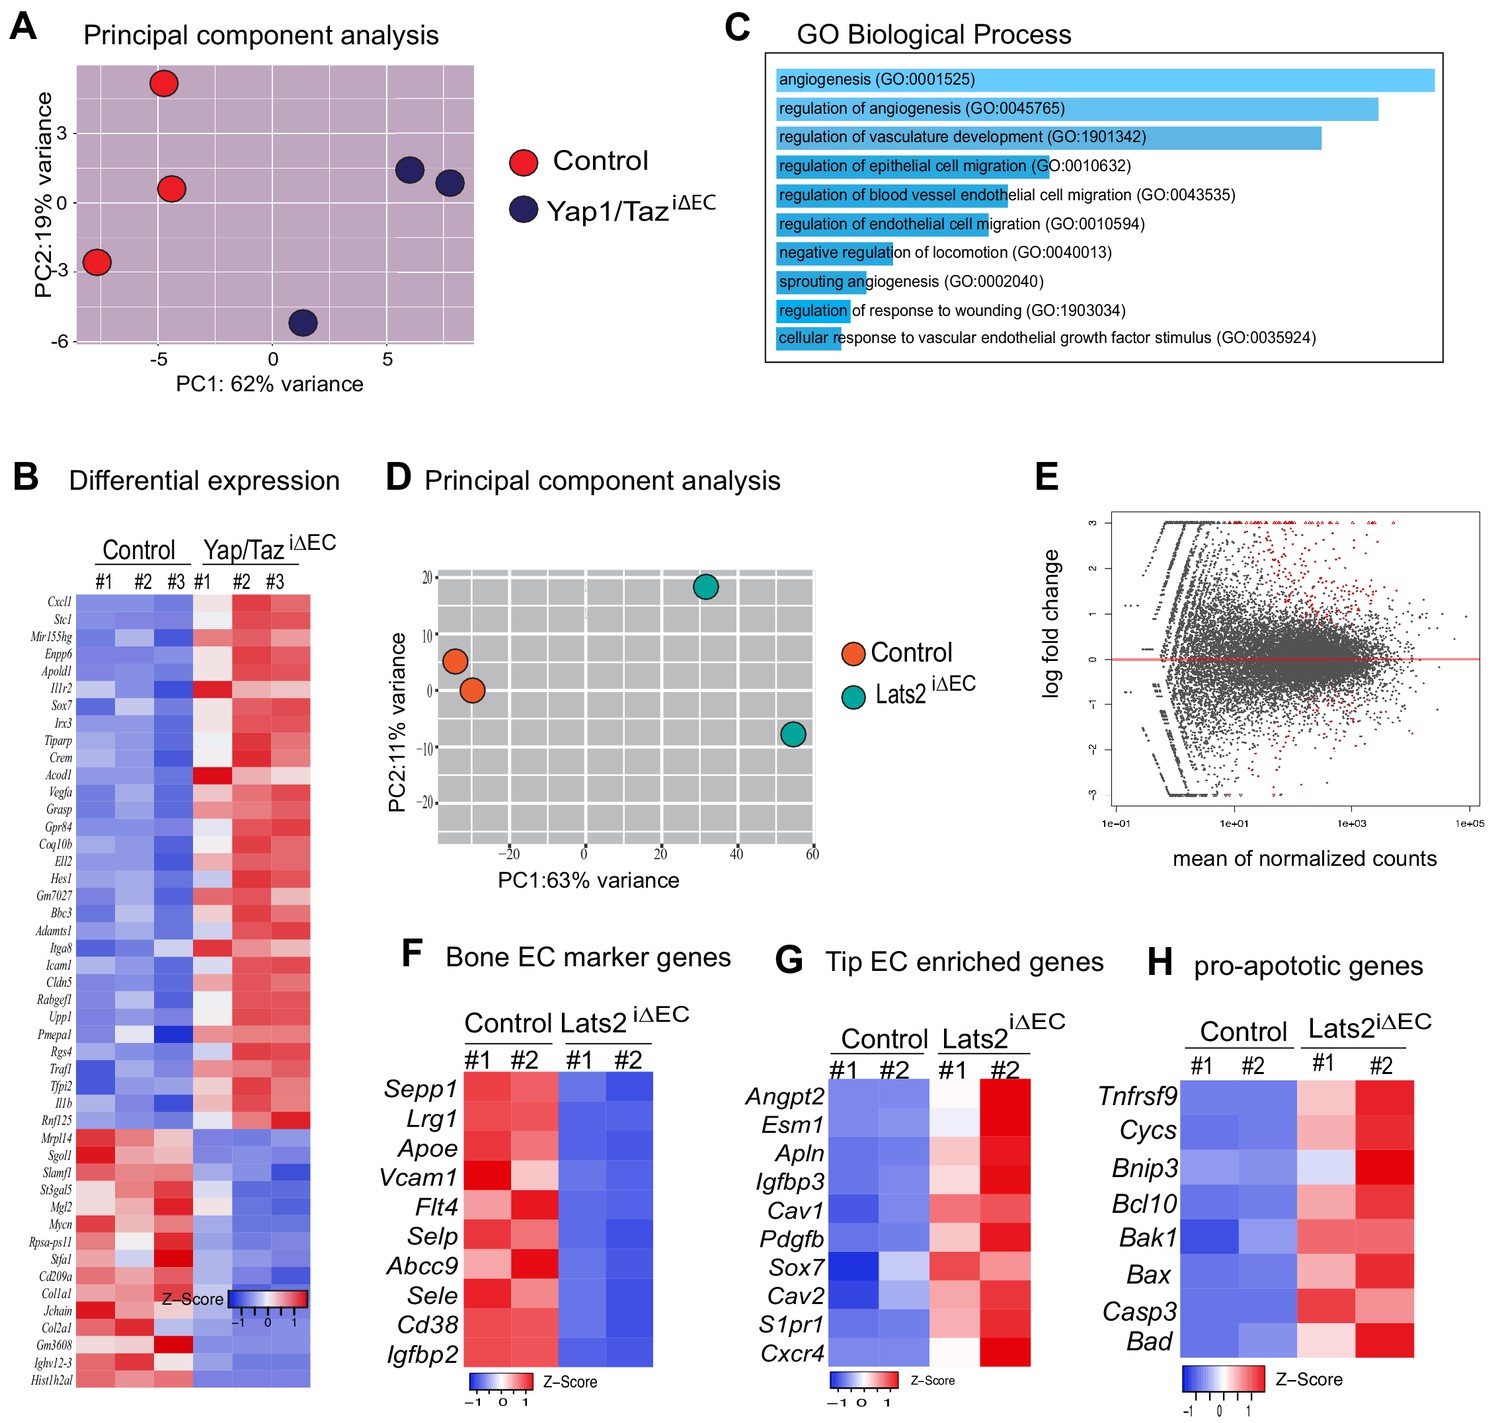
(A) Principal component analysis (PCA) of RNA sequencing data from control and Yap1/TaziΔEC bone ECs. (B) Heatmap of selected upregulated and downregulated genes in Yap1/TaziΔEC bone ECs. (C) Gene ontology (GO) analysis of Yap1/TaziΔEC upregulated genes. Size of the bar graph represents significance based on p-value. (D) PCA of RNA sequencing data from control and Lats2iΔEC mutant bone ECs. (E) Differentially regulated genes shown in MA-plots of control and Lats2iΔEC bone ECs. The x-axis represents the mean normalized counts and the y-axis shows the log2 fold change. (F–H) Heatmap of selected gene sets showing changes in molecular markers for bone marrow ECs (F), tip cells (G) and pro-apoptotic genes (H).
-
Figure 4—figure supplement 1—source data 1
Source data for Figure 4—figure supplement 1B,F,G,H.
- https://cdn.elifesciences.org/articles/50770/elife-50770-fig4-figsupp1-data1-v1.xlsx
Figure 5 with 1 supplement
Yap1 and Taz inhibit HIF-1α-controlled gene expression.
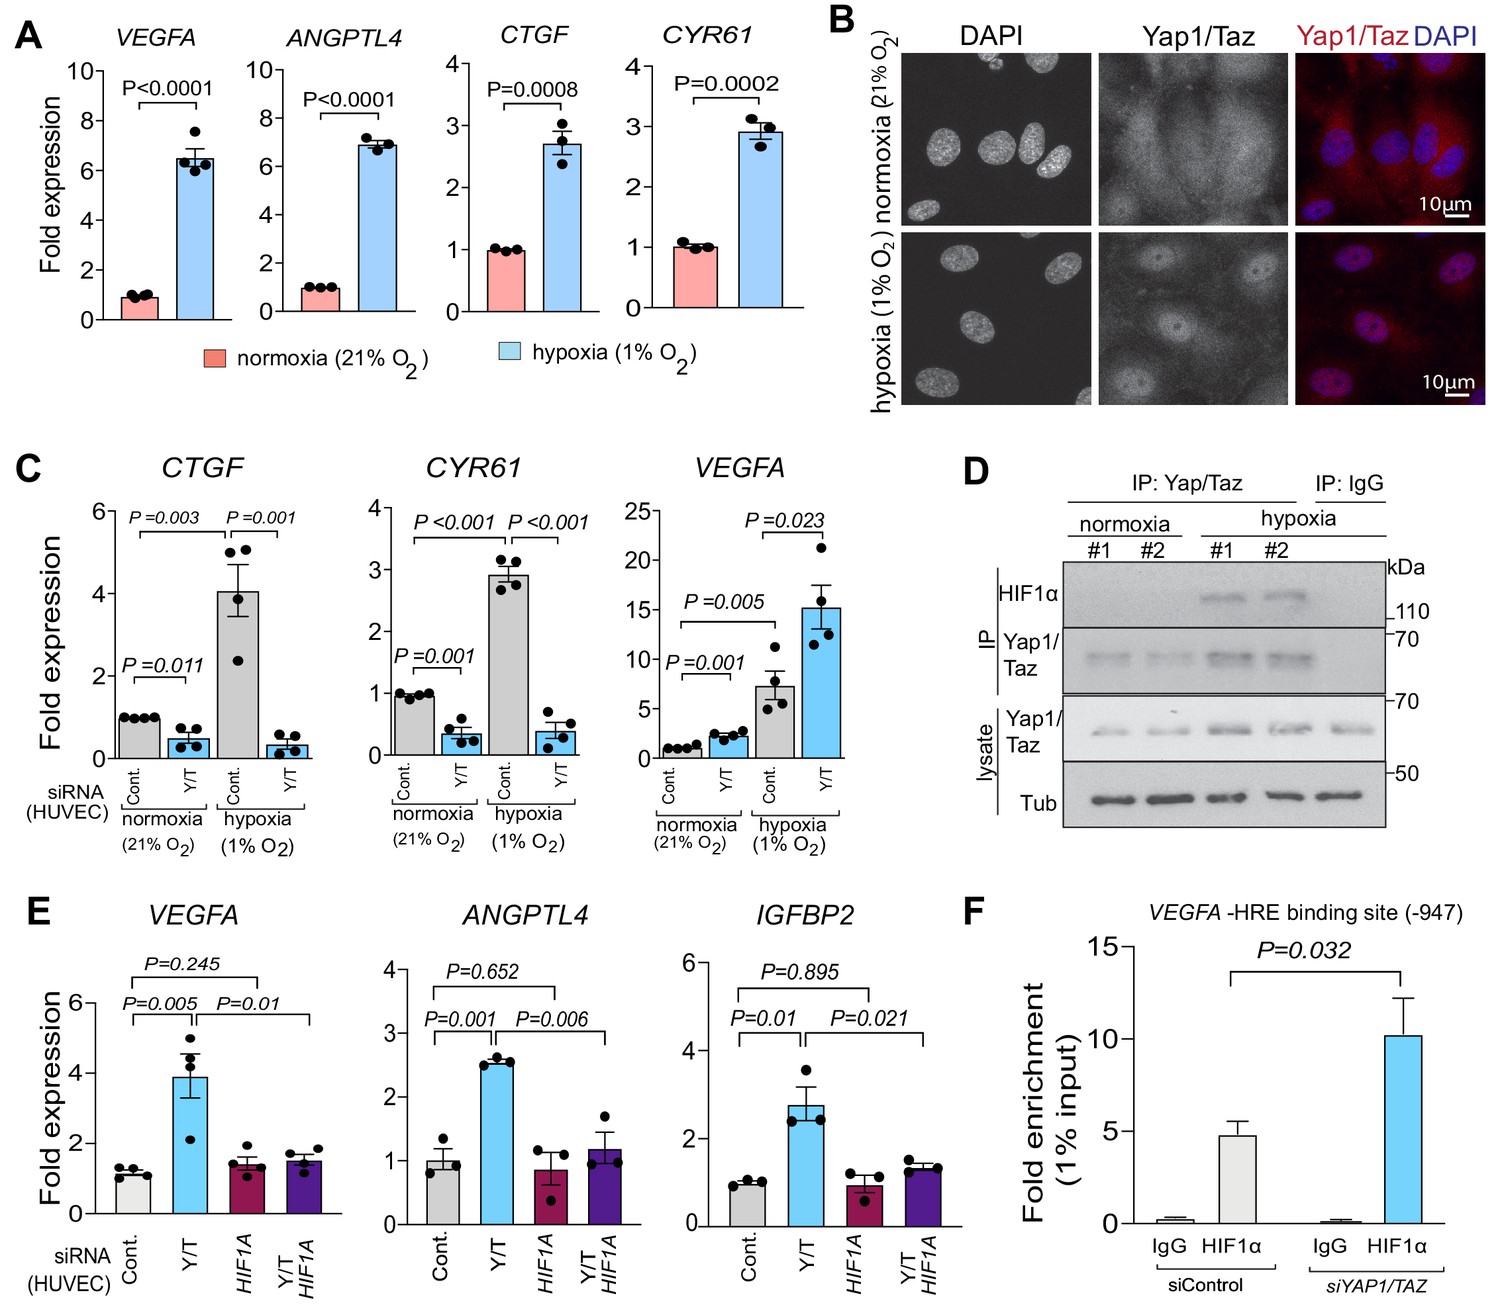
(A) Increased expression of the HIF1α target genes VEGFA and ANGPTL4 as well as Yap1/Taz target genes CTGF and CYR61 under hypoxic condition (1% O2) compared to normoxia (21% O2) (n = 4; data are presented as mean ±sem, P values, two-tailed unpaired t-test). (B) Confocal image of HUVEC showing nuclear accumulation of Yap1/Taz in 1% O2 relative to 21% O2. Nuclei, DAPI (blue). (C) Increased expression of the Yap1/Taz target genes CTGF, CYR61 and the HIF1α target VEGFA in HUVECs in 1% O2 relative to 21% O2. CTGF and CYR61 expression under both conditions is significantly reduced in siYAP1/TAZ-transfected (Y/T) HUVECs. VEGFA expression significantly increased in Y/T cells in both conditions (n = 4; data are presented as mean ±sem, P values, two-tailed unpaired t-test). (D) Western blots showing immunoprecipitation (IP) of Yap1/Taz followed by immunoblotting of HIF1α and Yap1/Taz. IgG is used as negative control in IP. Lysates are shown as loading control. (E) Increased VEGFA, ANGPTL4, IGFBP2 expression in siYAP1/TAZ-treated HUVECs is normalized by siHIF1A transfection, whereas baseline VEGFA, ANGPTL4 and IGFBP2 is not altered by HIF1A knockdown alone (n = 3–4; data are presented as mean ±sem, P values, two-tailed unpaired t-test). (F) Enrichment of VEGFA promoter sequences after chromatin immunoprecipitation with HIF1α antibodies compared to IgG antibodies under hypoxic conditions and after transfection of HUVECs with siYAP1/TAZ or siControl (n = 3; data are presented as mean ±sem, P values, two-tailed unpaired t-test).
-
Figure 5—source data 1
Source data for Figure 5A,C,E,F.
- https://cdn.elifesciences.org/articles/50770/elife-50770-fig5-data1-v1.xlsx
Figure 5—figure supplement 1
Yap1 and Taz inhibit HIF1α-controlled gene expression.
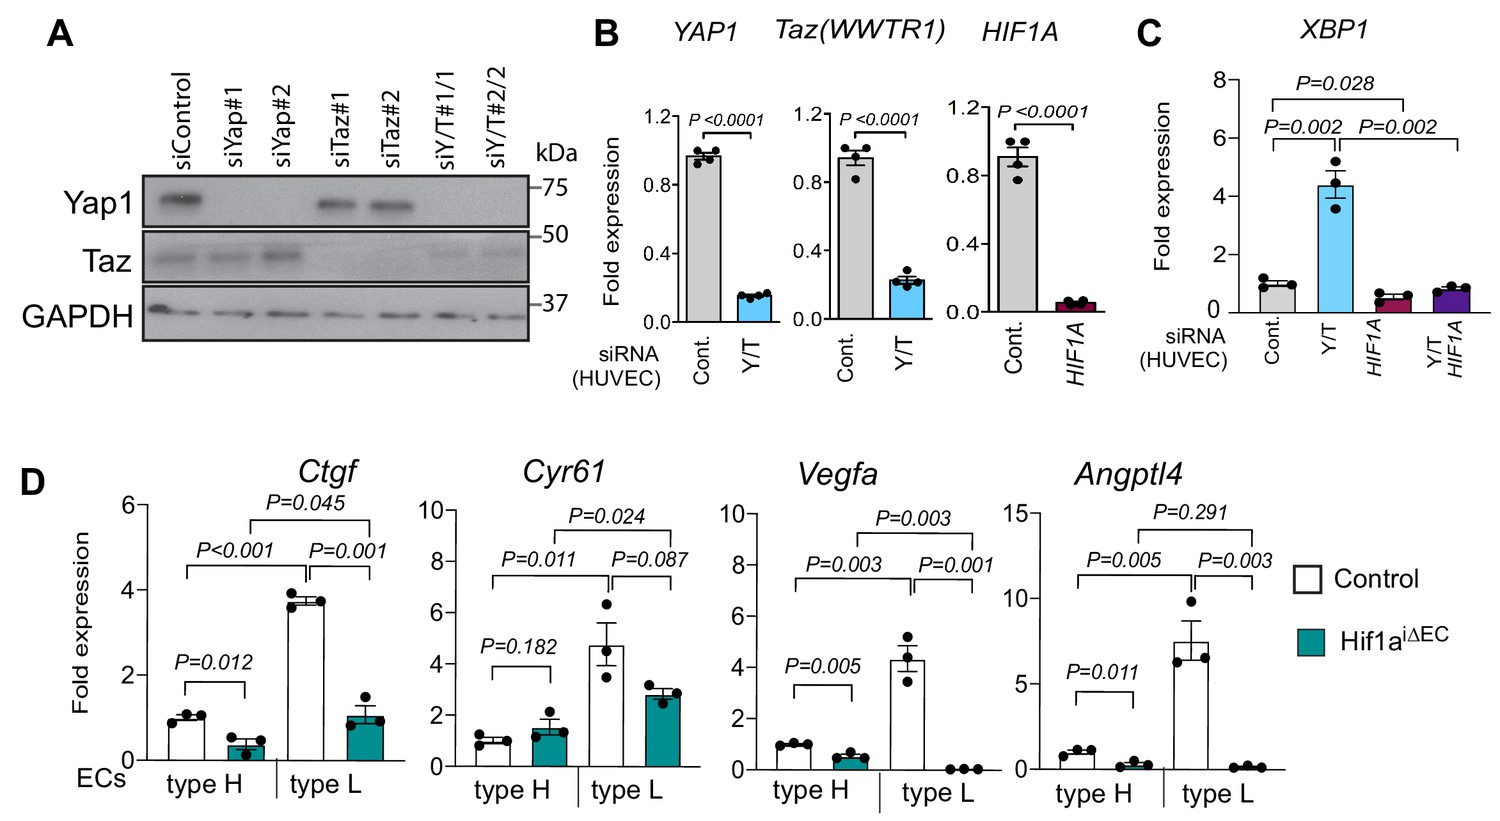
(A) Decreased Yap1 and Taz protein levels in siYAP1 and siTAZ-transfected HUVECs. (B) Reduced expression of YAP1, TAZ and HIF1A transcripts in HUVECs transfected with the indicated siRNAs. (C) XBP1 expression is increased in siYAP1/TAZ-treated HUVECs and normalized by siHIF1A, whereas baseline XBP1 is not altered by HIF1A knockdown alone (n = 3–4; data are presented as mean ±sem, P values, two-tailed unpaired t-test). (D) Expression of the Yap1/Taz targets Ctgf, Cyr61 and the HIF1α targets Vegfa, Angptl4 in freshly isolated type H and type L EC subpopulations from P21 Hif1aiΔEC littermate control long bone.
-
Figure 5—figure supplement 1—source data 1
Source data for Figure 5—figure supplement 1B,C,D.
- https://cdn.elifesciences.org/articles/50770/elife-50770-fig5-figsupp1-data1-v1.xlsx
Figure 6
Cross-talk between Yap1/Taz and HIF1α in bone ECs.
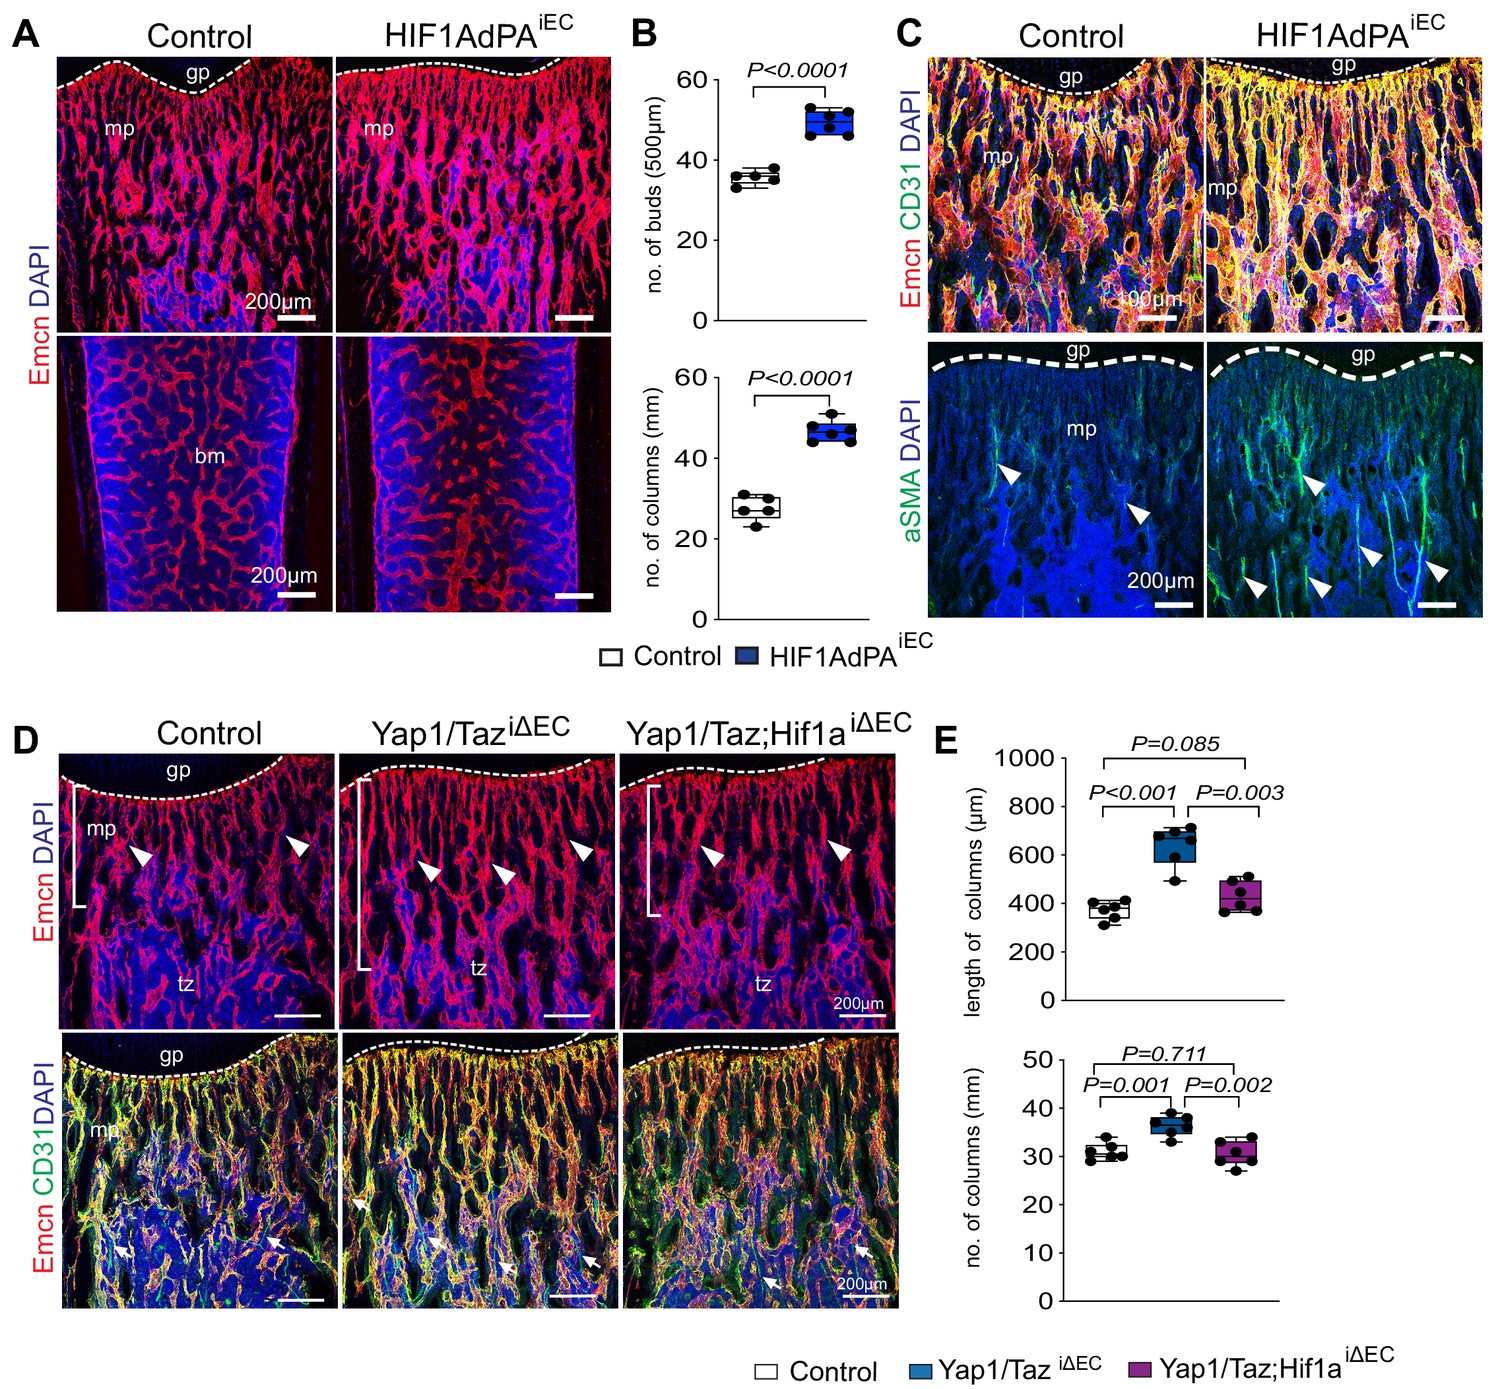
(A, B) Representative confocal images of control and HIF1AdPAiEC femur. Emcn+ (red) ECs and nuclei (DAPI, blue) are stained (A). Vessel buds and column are increased in the HIF1AdPAiEC metaphysis relative to littermate control (B) (n = 5; data are presented as mean ±sem, P values, two-tailed unpaired t-test). (C) Metaphyseal Emcnhi (red) CD31hi (green) capillaries in P21 control and HIF1A gain-of-function (HIF1AdPAiEC) femur. Nuclei, DAPI (blue). Number of aSMA positive arteries is increased in HIF1AdPAiEC femur compared to control. (D, E) Maximum intensity projections of Yap1/TaziΔEC, Yap1/Taz; Hif1aiΔEC and control femur stained for Emcn (red) and CD31 (green). Nuclei, DAPI (blue). Arrowheads mark vessels in transition zone (D). Quantitative analysis of length and number of vessel column (E) (n = 6; data are presented as mean ±sem, P values, two-tailed unpaired t-test).
-
Figure 6—source data 1
Source data for Figure 6B,E.
- https://cdn.elifesciences.org/articles/50770/elife-50770-fig6-data1-v1.xlsx
Figure 7 with 1 supplement
Endothelial Hippo signaling promotes coupling of angiogenesis and osteogenesis.
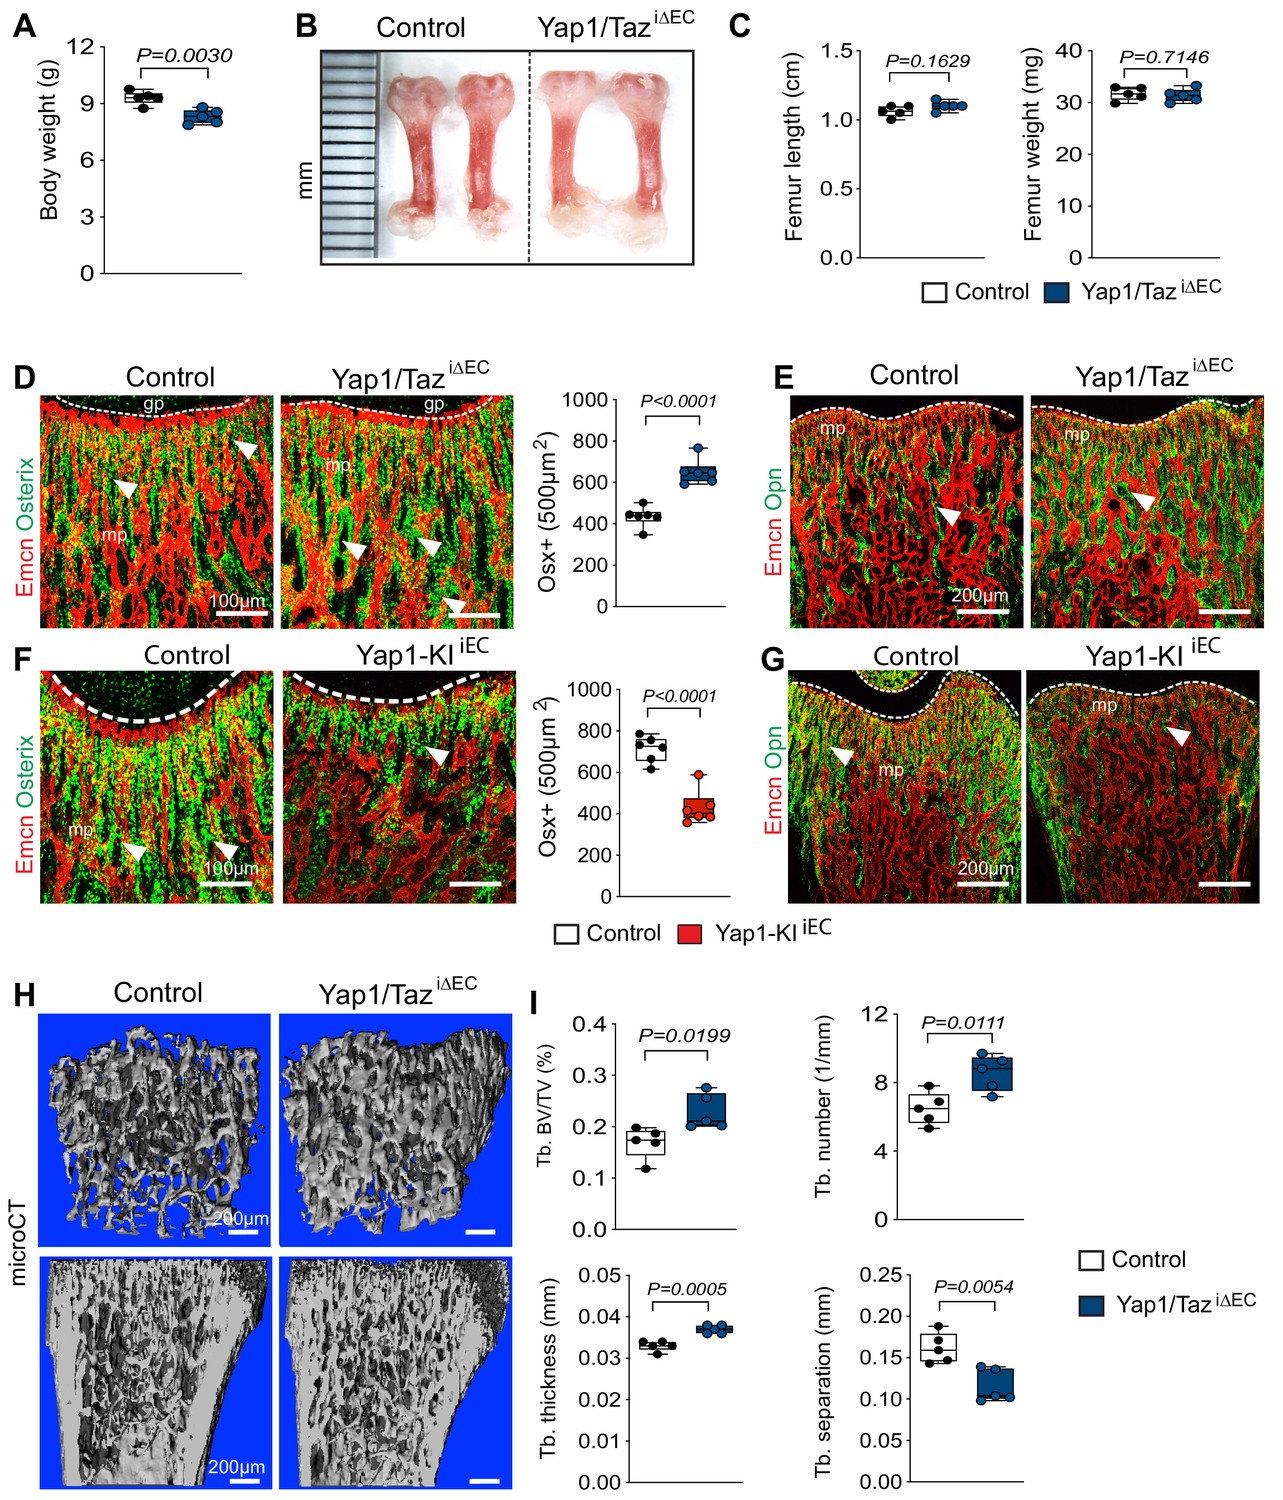
(A) Average body weight of P21 control and Yap1/TaziΔEC mutants (n = 6; data are presented as mean ±sem, P values, two-tailed unpaired t-test). (B, C) Representative images of P21 control and Yap1/TaziΔEC femur (C). Quantitation of femur length and weight show no changes between Yap1/TaziΔEC mutants and littermate controls (C) (n = 6; data are presented as mean ±sem, P values, two-tailed unpaired t-test). (D) Confocal images showing Osterix+ cells (green) in relation to Emcn+ ECs (red) in P21 Yap1/TaziΔEC and control metaphysis. Graph on the right shows quantitative analysis of Osterix+ (Osx+) cells (control n = 6 and Yap1/TaziΔECn = 6; data are presented as mean ±sem, P values, two-tailed unpaired t-test). (E) Confocal images showing bone vessels (Emcn), and the bone matrix protein Osteopontin in Yap1/TaziΔEC vs control femur. (F) Representative confocal images of Osterix+ cells (green) in relation to Emcn+ ECs (red) in the P21 control and Yap1-KIiEC femoral metaphysis. Graph on the right shows significant reduction of Osterix+ cells in Yap1-KIiEC mutants (n = 6; data are presented as mean ±sem, P values, two-tailed unpaired t-test). (G) Decreased bone matrix protein Osteopontin (Opn, green) deposition in P21 Yap1-KIiEC femur relative to control. ECs, Emcn (red). (H, I) Representative μCT images of trabecular bone in P21 control and Yap1/TaziΔEC femur (H). Quantitative analysis of trabecular volume (BV/TV, bone volume/total volume) trabecular (Tb.) number, Tb. thickness, and Tb. separation (I). (n = 5; data are presented as mean ±sem, P values, two-tailed unpaired t-test).
-
Figure 7—source data 1
Source data for Figure 7A,C,D,F,I.
- https://cdn.elifesciences.org/articles/50770/elife-50770-fig7-data1-v1.xlsx
Figure 7—figure supplement 1
Endothelial Yap1/Taz controls coupling of angiogenesis and osteogenesis.
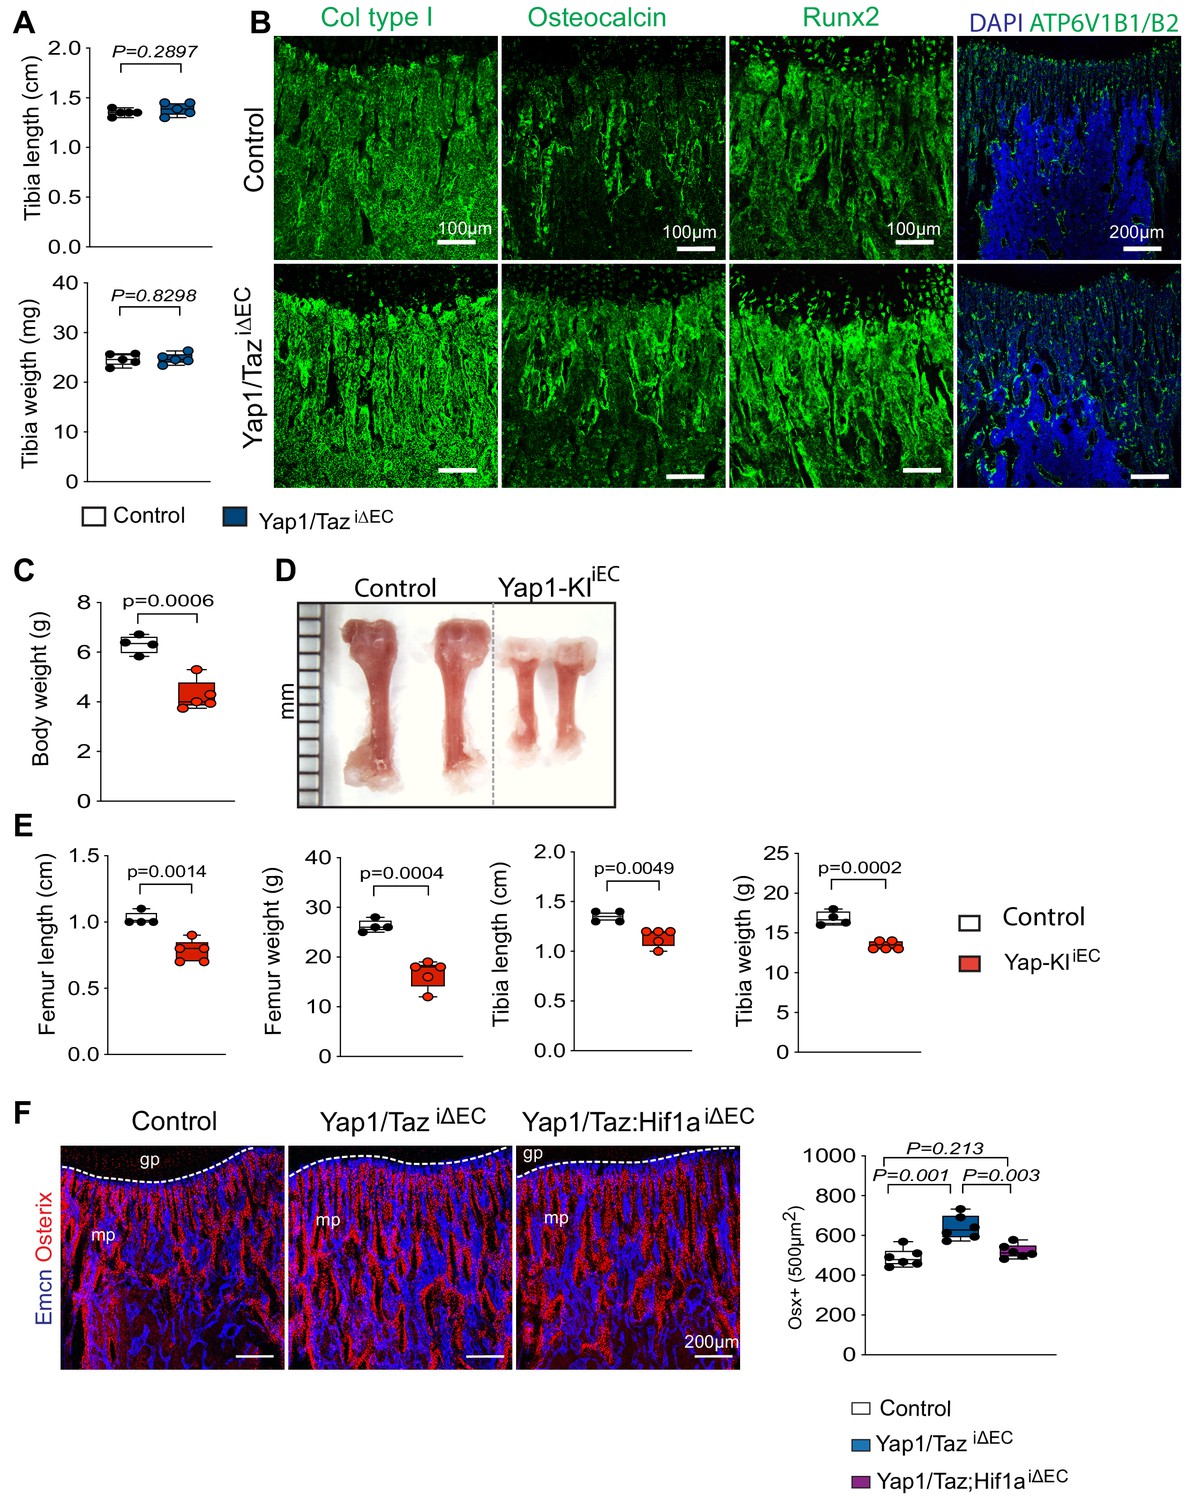
(A) Quantifications of tibia weight and length show no changes between Yap1/TaziΔEC mutants and littermate controls (n = 6; data are presented as mean ±sem, P values, two-tailed unpaired t-test). (B) Confocal images showing osteoblast markers collagen type aI (Col type I, alpha 1) and Osteocalcin (Ocn), osteoprogenitor differentiation marker Runx2 and the osteoclast marker ATP6V1B1 and two in Yap1/TaziΔEC and control femur. (C–E) Average body weight of control and Yap1-KI iEC mice (C). Representative images of P21 control and Yap1-KI iEC femur (D). Quantification of femur and tibia weight and length in Yap1-KI iEC mutants relative to littermate controls (E) (n = 4, 5; data are presented as mean ±sem, P values, two-tailed unpaired t-test). (F) Representative confocal images of Osterix+ cells (red) in relation to Emcn+ ECs (blue) in P21 control, Yap1/TaziΔEC and Yap1/Taz; Hif-1aiΔEC femoral metaphysis. Quantification of Osterix+ cells in Yap1/TaziΔEC and Yap1/Taz; Hif-1aiΔEC mutants compared to control (n = 6; data are presented as mean ±sem, P values, two-tailed unpaired t-test).
-
Figure 7—figure supplement 1—source data 1
Source data for Figure 7—figure supplement 1A,C,E,F.
- https://cdn.elifesciences.org/articles/50770/elife-50770-fig7-figsupp1-data1-v1.xlsx
Author response image 1

Additional files
-
Supplementary file 1
Key Resources Table.
- https://cdn.elifesciences.org/articles/50770/elife-50770-supp1-v1.docx
-
Transparent reporting form
- https://cdn.elifesciences.org/articles/50770/elife-50770-transrepform-v1.docx
Download links
A two-part list of links to download the article, or parts of the article, in various formats.
Downloads (link to download the article as PDF)
Open citations (links to open the citations from this article in various online reference manager services)
Cite this article (links to download the citations from this article in formats compatible with various reference manager tools)
YAP1 and TAZ negatively control bone angiogenesis by limiting hypoxia-inducible factor signaling in endothelial cells
eLife 9:e50770.
https://doi.org/10.7554/eLife.50770


