Cdc7 activates replication checkpoint by phosphorylating the Chk1-binding domain of Claspin in human cells
- Tokyo Metropolitan Institute of Medical Science, Japan
Figures
Figure 1 with 2 supplements
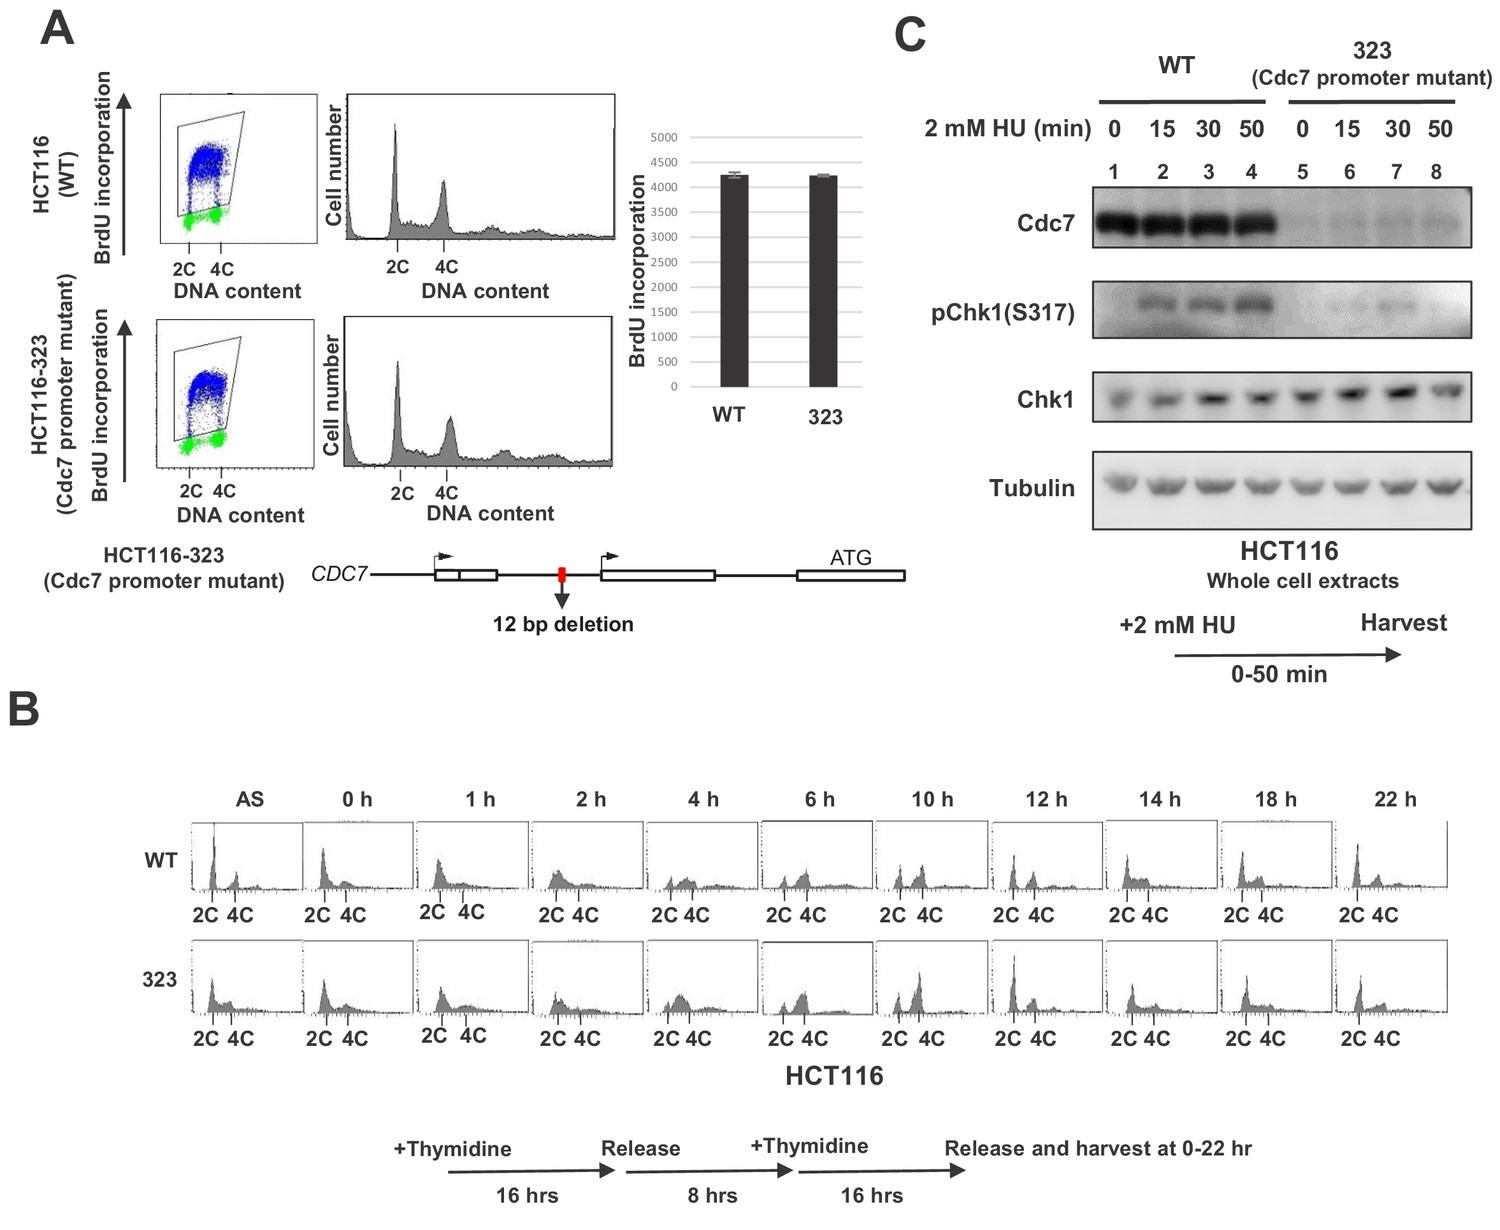
Cdc7 is required for activation of Chk1 in response to replication stress.
(A) HCT116 and its derivative, HCT116-323, in which the promoter for the Cdc7 gene was mutated (see Figure 1—figure supplement 1 for details of the mutation), were incubated with BrdU for 20 min and were analyzed by FACS for BrdU incorporation. The average FITC intensity of each cell is shown in the graph. The mean ±s.d. values from three replicates are shown. (B) HCT116 and HCT116-323 cells were arrested at the G1/S boundary by double thymidine block, as outlined in the figure, and were released into the medium without thymidine. Cells were harvested at the times indicated after the release and DNA contents were analyzed by FACS. (C) HCT116 and HCT116-323 were treated with 2 mM HU for 0, 15, 30, 50 min and the whole cell extracts were analyzed by western blotting with indicated antibodies.
-
Figure 1—source data 1
Quantification for graph (three independent FACS experiments) in Figure 1A.
- https://cdn.elifesciences.org/articles/50796/elife-50796-fig1-data1-v2.xlsx
Figure 1—figure supplement 1
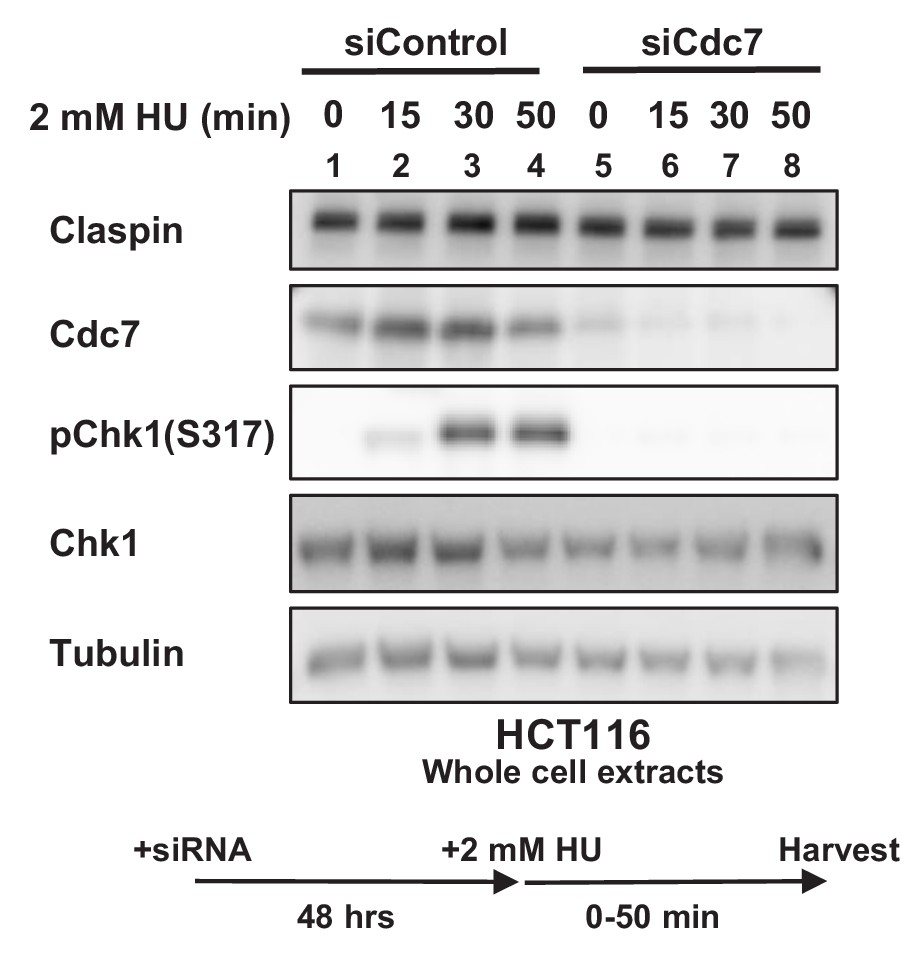
Cdc7 is required for activation of Chk1 in HCT116 cells.
HCT116 cells were transfected with siControl or siCdc7 for 48 hr. Cells were harvested at 0, 15, 30 and 50 min after addition of 2 mM HU, and the whole cell extracts were analyzed by western blotting with indicated antibodies.
Figure 1—figure supplement 2
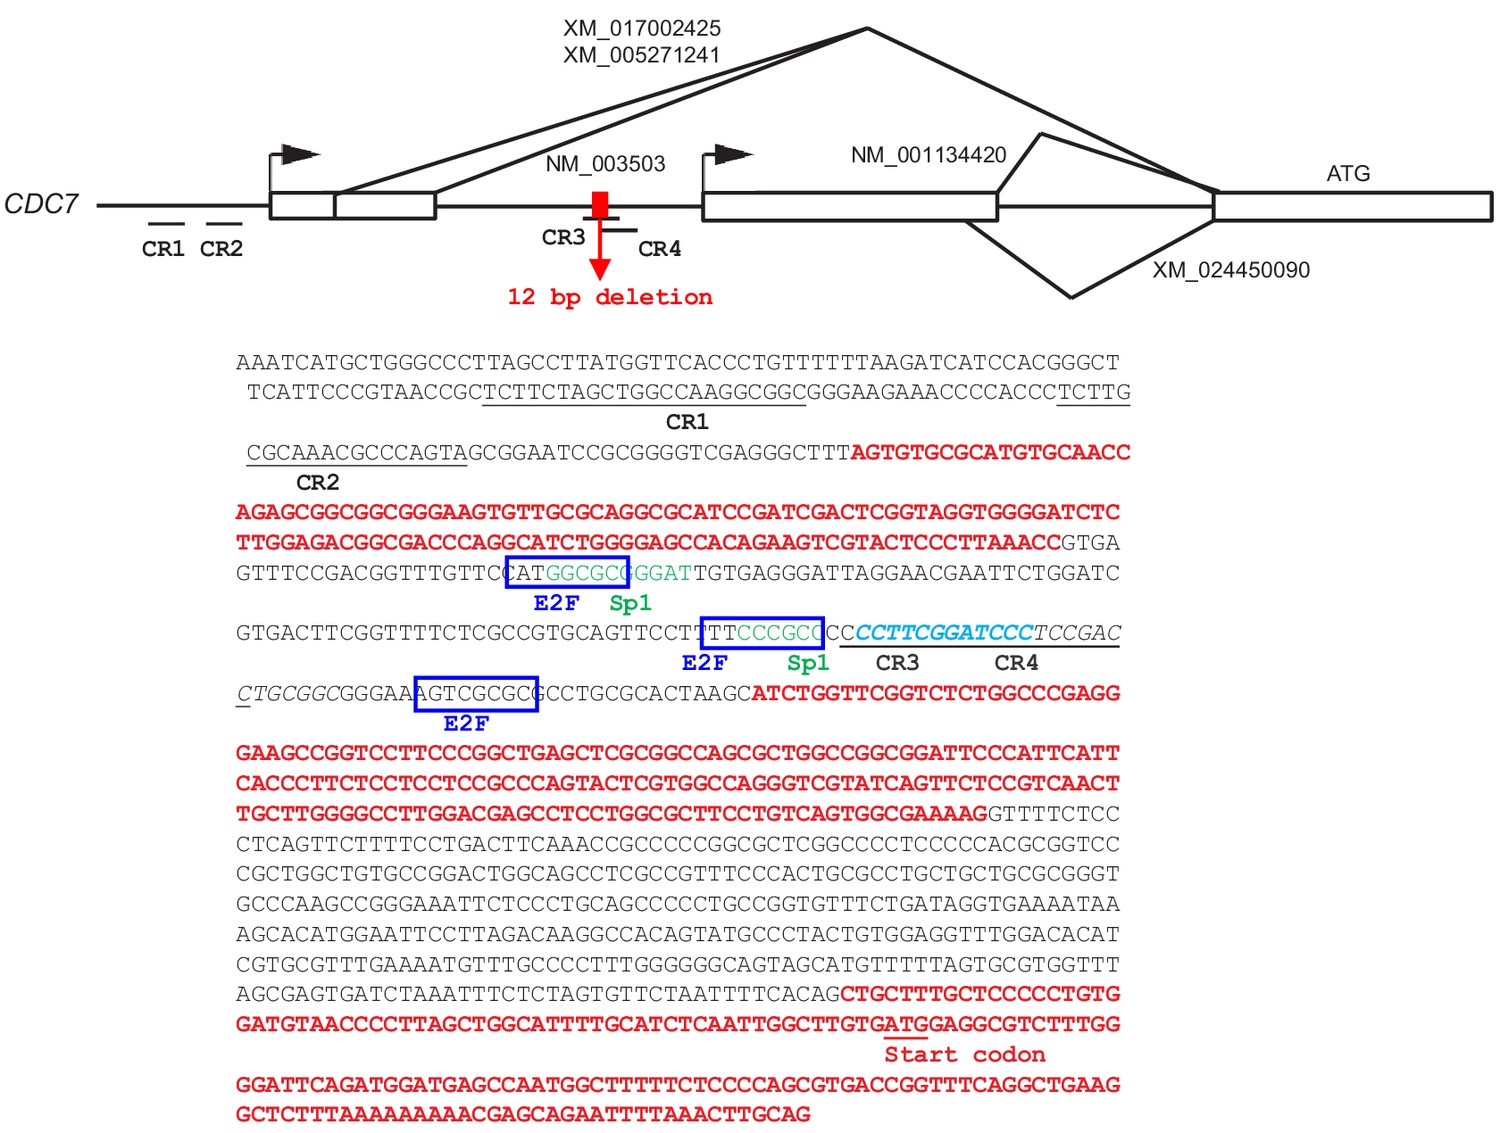
Sequences of the promoter region of human Cdc7 gene and deletion introduced by CRISPR-Cas9.
The upper drawing shows the exon (white boxes) and intron (bars) organization of the Cdc7 gene. The bent arrows indicate two transcription initiation sites. The exons and introns are in red and black in the sequences, respectively. Representative GenBank accession numbers for mRNA isoforms (alternatively spliced forms) are presented. The putative E2F binding sequences and Sp1 sites are indicated by blue boxes and green letters, respectively. The ATG start codon for Cdc7 is indicated. The deleted 12 bp sequences are shown by a red box in the drawing and by light blue, italicized letters in the sequences. The underlined segments (CR1-4) indicate the locations of gRNA targets designed. The Cdc7 expression level was examined for all the clones obtained from each gRNA (data not shown). The HCT116-323 obtained with CR3 showed significant reduction of Cdc7 expression, and was used for this study. In HCT116-323, a large deletion was introduced on the other Cdc7 allele.
Figure 2 with 1 supplement
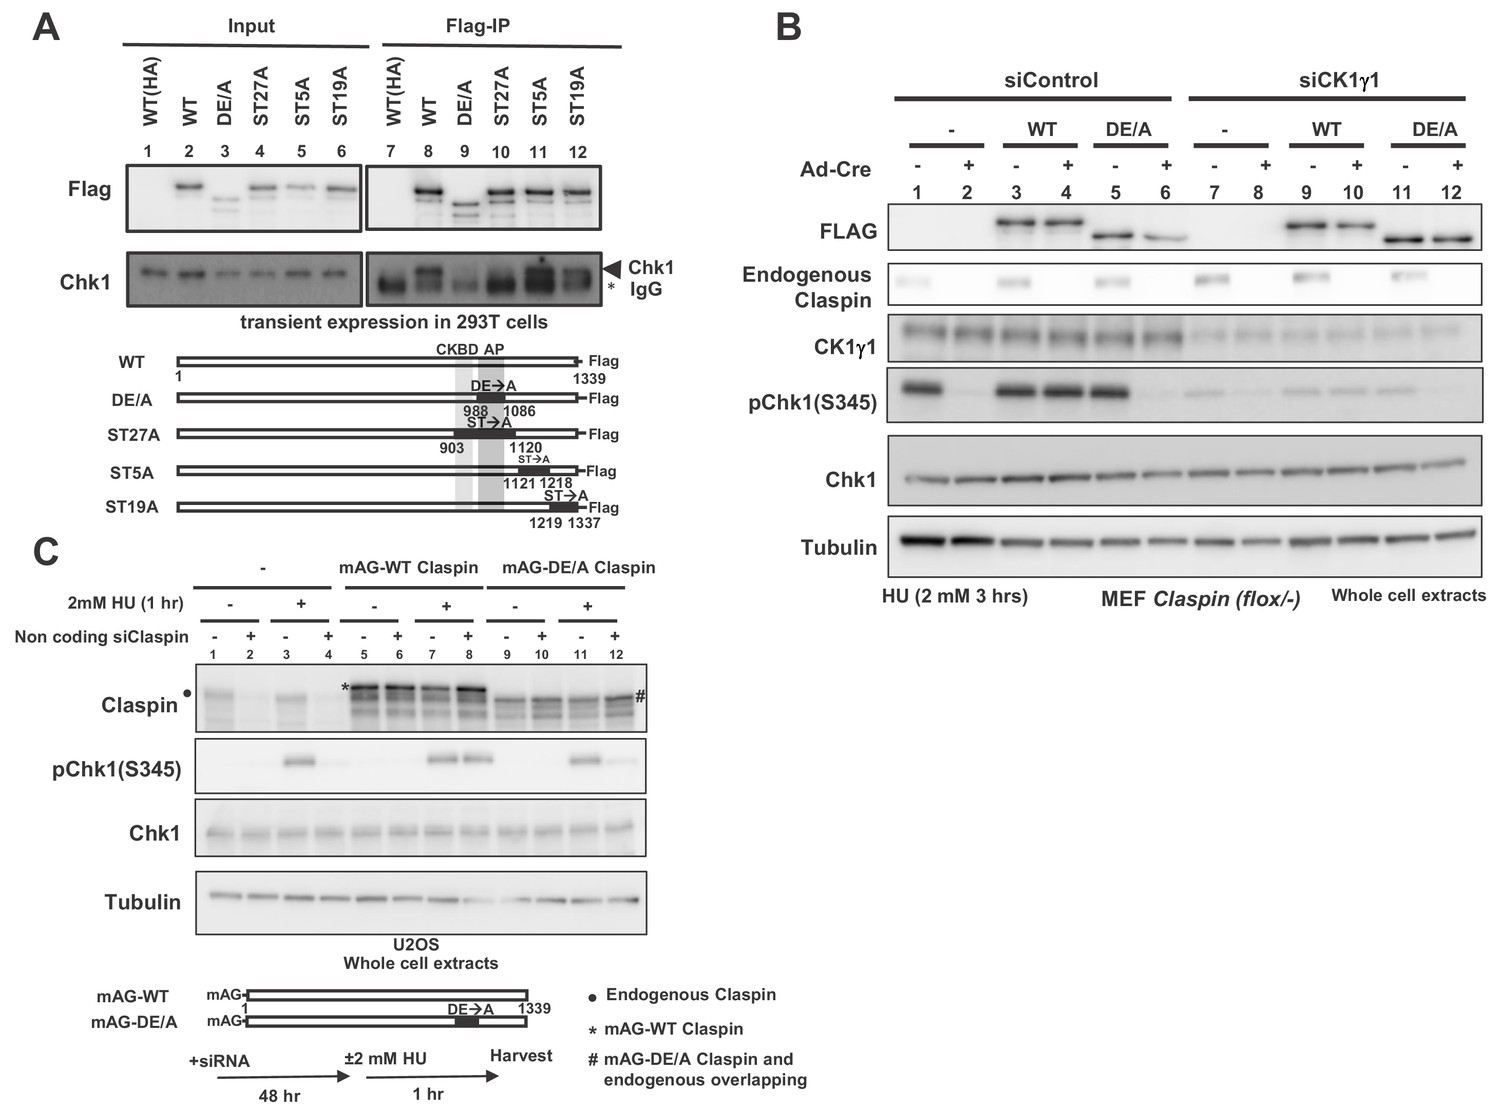
AP (Acidic Patch) of Claspin is required for interaction with Chk1 and Chk1 activation.
(A) C-terminally Flag-tagged wild type (WT) and mutant Claspin indicated were transiently expressed in 293 T cells and were pulled down by anti-Flag beads. Immunoprecipitated proteins were analyzed by western blotting with anti-Flag and anti-Chk1 antibodies. Shown below the panels are schematic diagrams of the mutant Claspin proteins. Black boxes indicated the segments in which amino acid replacements were introduced. Asterisks indicate IgG; arrowheads indicate Chk1. WT(HA) represents the HA-tagged Claspin, which was used as a negative control. (B) Stable clones of Claspin flox /-MEF cells expressing the Flag-tagged wild-type or APDE/A mutant Claspin or no transgene were infected with Ad-Cre for 48 hr or non-treated. Cells were then treated with CK1γ1 siRNA (lanes 7–12) or non-treated (lanes 1–6) for 24 hr and then with 2 mM HU for 3 hr, and the whole cell extracts were analyzed by western blotting with indicated antibodies. (C) U2OS cells were infected by retroviruses expressing mAG-WT Claspin or mAG-APDE/A Claspin (momeric Azami Green fluorescent protein fused at the N-terminus of Claspin, which does not affect the functionso of Clapsin). At 2 days after infection, non-coding Claspin siRNA or control siRNA was introduced into the cells for two days, and then the cells were treated with 2 mM HU for 1 hr or non-treated before harvest. The whole cell extracts were analyzed by western blotting with indicated antibodies. mAG indicates monomeric Azami Green fluorescent protein.
Figure 2—figure supplement 1
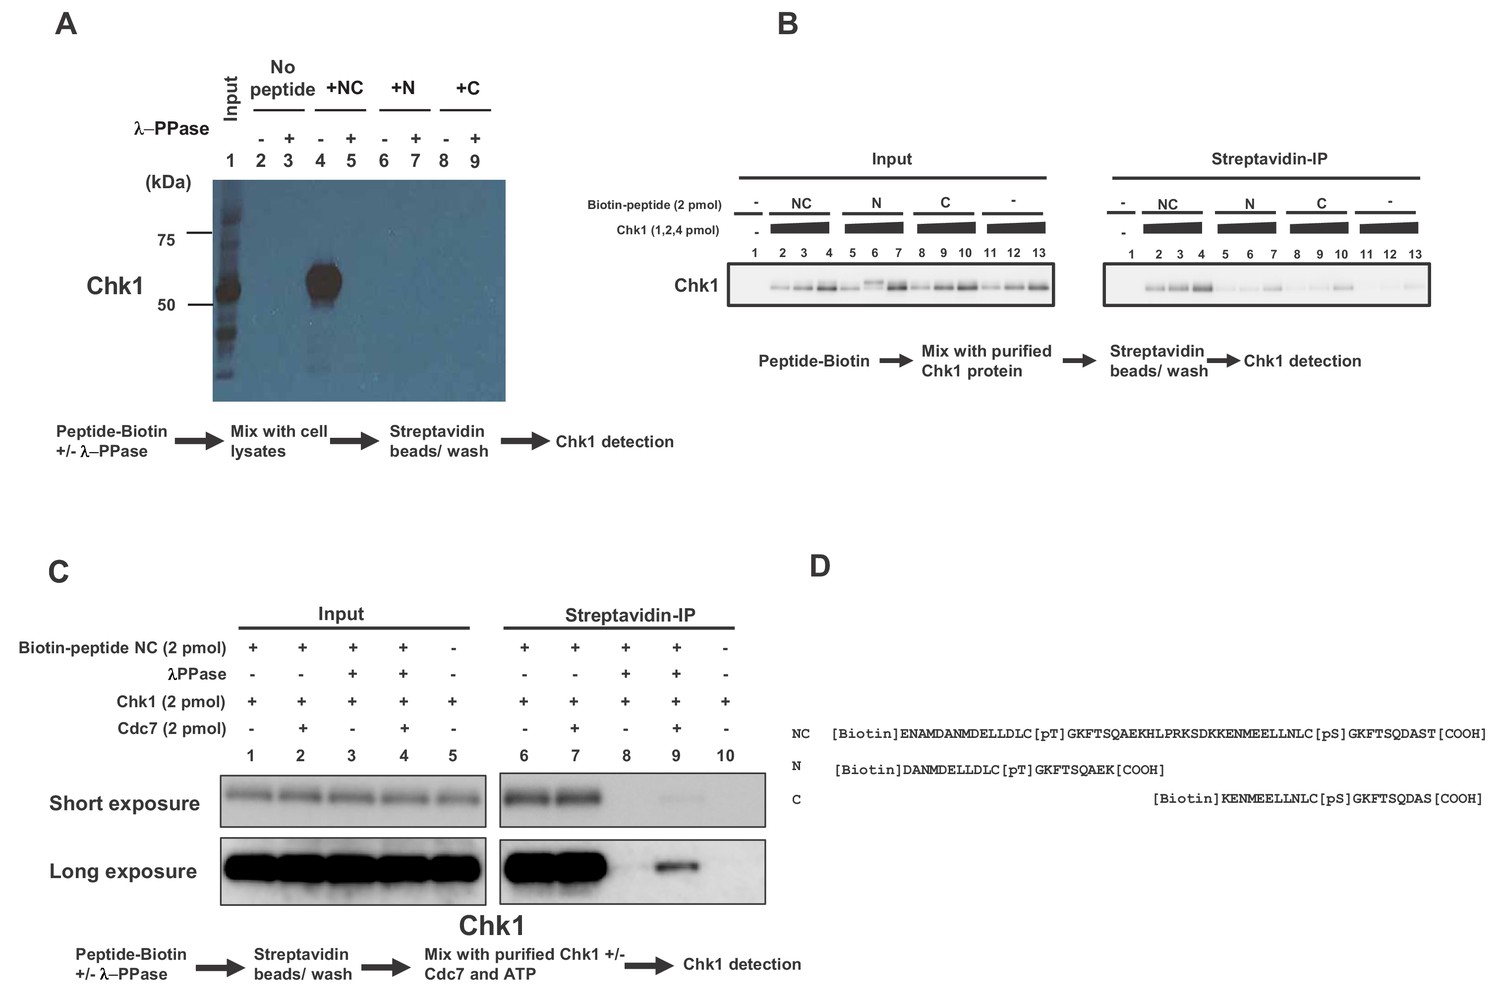
Pull down assays with biotinylated CKBD phospho-oligopeptides.
Biotinylated peptides, as shown, were mixed with cell lysates (A) or purified Chk1 protein (B and C) and pulled down by streptavidin beads, and were analyzed by western blotting using anti-Chk1 antibody. In (A and C), where indicated, the biotinylated peptide was pretreated with λ-phosphatase (λ-PPase) and washed before incubation with extracts or the protein. In C, where indicated, Cdc7 kinase and ATP were also included when incubated with Chk1. (D). Sequences of biotinylated peptides used.
Figure 3
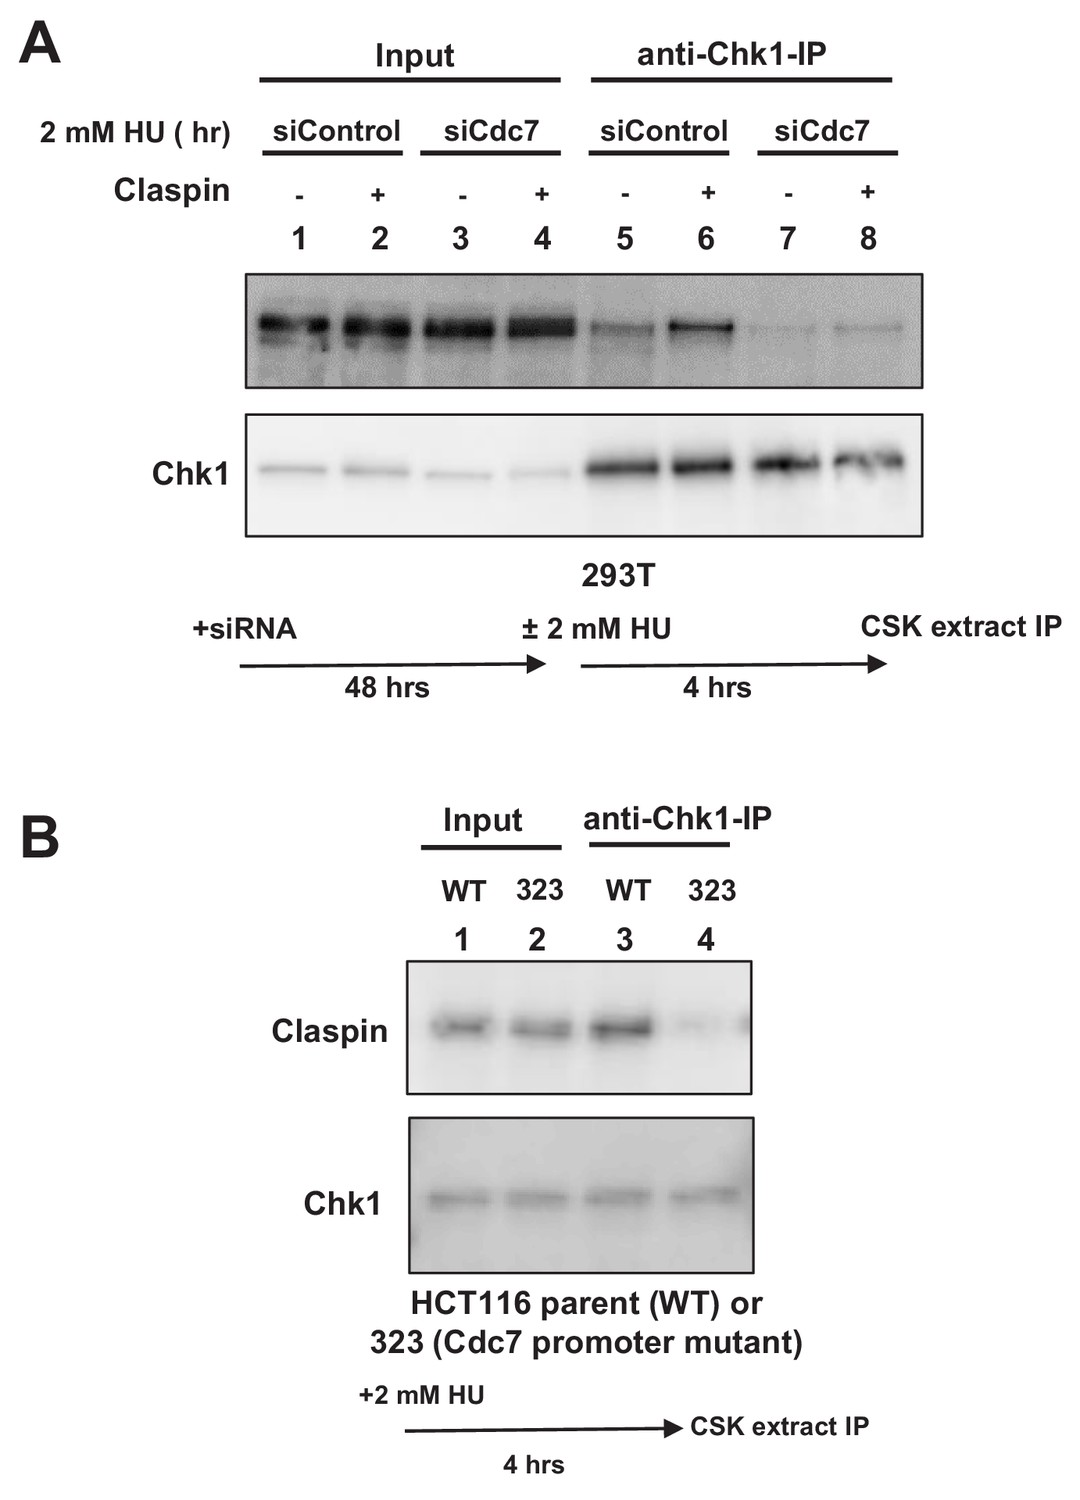
Cdc7 is required for interaction of Claspin with Chk1.
(A) 293 T cells transfected with siControl or siCdc7 for 48 hr were treated with 2 mM HU for 4 hr or non-treated. Cells were lysed with CSK buffer containing 0.1% Triton-X100 and proteins were pulled down with anti-Chk1 antibody and were analyzed by western blotting with anti-Claspin and anti-Chk1 antibodies. (B) HCT116 and its derivative, HCT116-323 (Cdc7 promoter mutant), were treated with 2 mM HU for 4 hr and proteins were analyzed as in A.
Figure 4 with 1 supplement

Cdc7 is required for phosphorylation of CKBD of Claspin in 293 T cells.
Phosphorylation sites of Claspin in the non-treated, HU-treated, siCdc7-treated and siCdc7+HU-treated cells were determined by mass spectrometry analyses and are shown on the drawing along the polypeptide. See Figure 4—figure supplement 1 for experimental details. ‘HU’ and ‘HU+Cdc7 siRNA’ experiments were repeated three times, and ‘No treatment’ and ‘Cdc7 siRNA’ experiments were repeated two times (2nd and 3rd). Phosphorylation sites identified are indicated by the small bars and amino acid numbers, which are color-coded by the efficacy of phosphorylation, as determined by the formula in the figure. The efficacy of phosphorylation is based on the third experiment. The amino acid numbers in black are the phosphorylated residues detected only in the 1st and/or 2nd experiments. Three CKBD are shown by yellow boxes. Putative phosphorylation sites in the CKBD are boxed in red. ‘+” indicate phosphorylation sites detected in each experiment. Those on CKBD detected are indicated by ‘*”. ‘+” and ‘*” are color coded in red, blue and black which stands for 1st, 2nd and 3rd experiment, respectively.
-
Figure 4—source data 1
Primary data (1st experiment) for Figure 4.
- https://cdn.elifesciences.org/articles/50796/elife-50796-fig4-data1-v2.xlsx
-
Figure 4—source data 2
Primary data (2nd experiment) for Figure 4.
- https://cdn.elifesciences.org/articles/50796/elife-50796-fig4-data2-v2.xlsx
-
Figure 4—source data 3
Primary data (3rd experiment) for Figure 4.
- https://cdn.elifesciences.org/articles/50796/elife-50796-fig4-data3-v2.xlsx
Figure 4—figure supplement 1
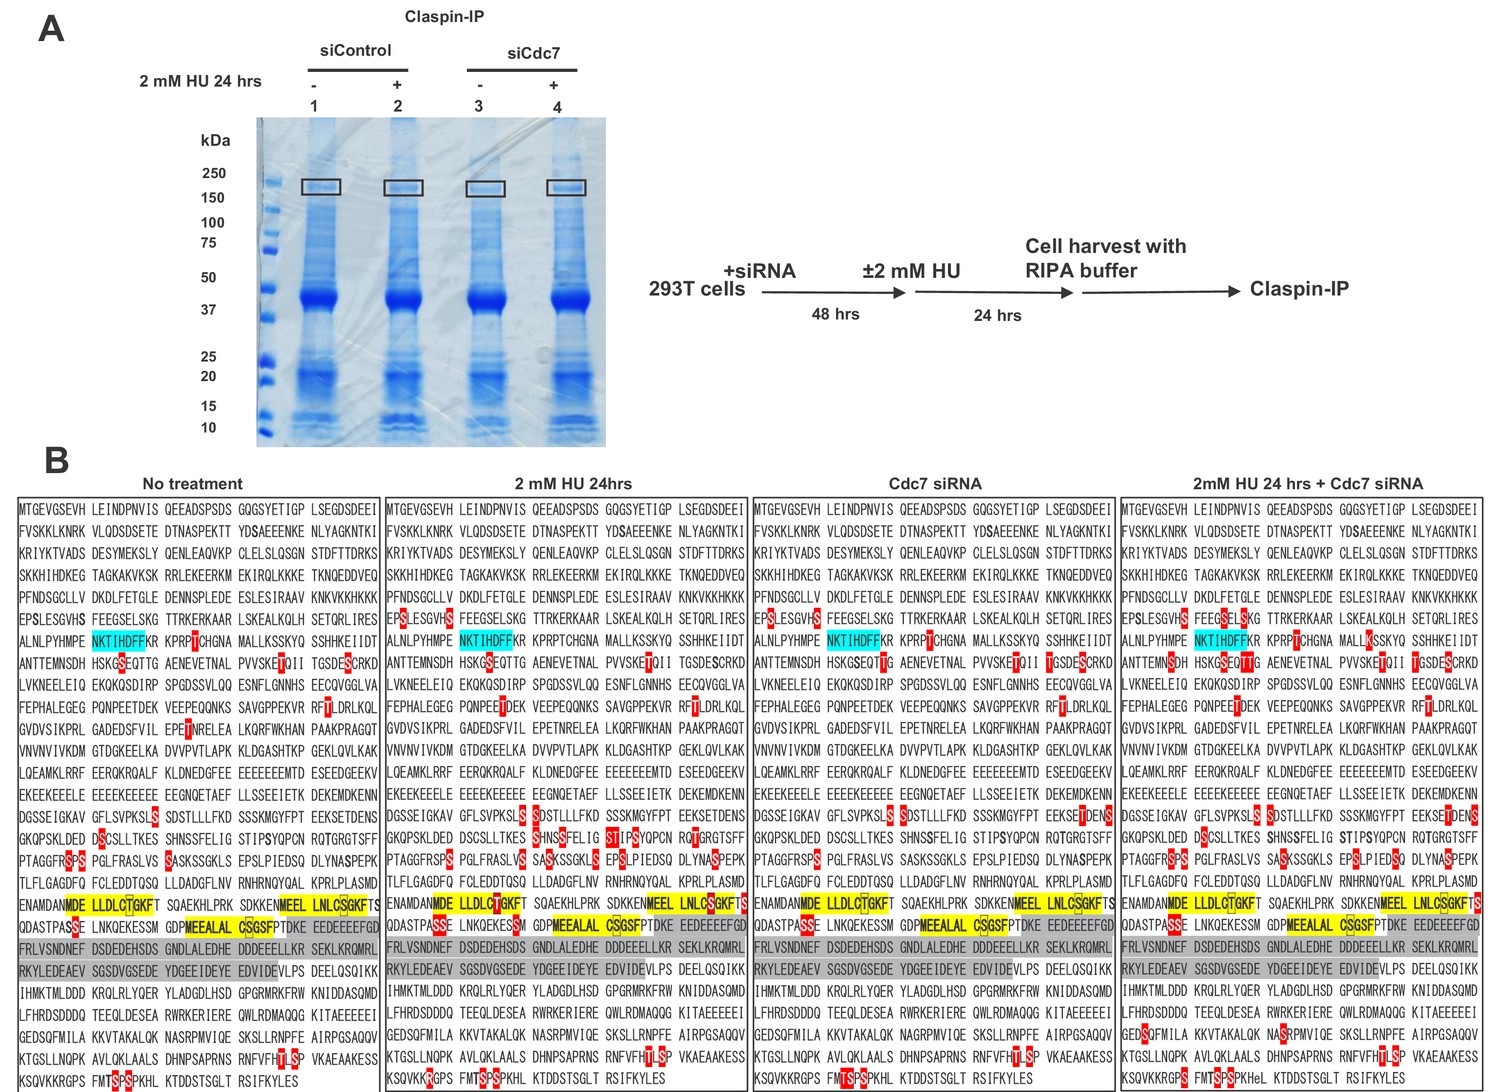
Mass spectrometry analyses of phosphorylation sites on Clapsin in 293 T cells.
(A) 293 T cells, treated with siControl or siCdc7 for 24 hr were treated with 2 mM HU for 50 min or not treated. Cells were lysed with RIPA buffer. Claspin was pulled down by anti-Claspin antibody, separated by SDS-PAGE, stained by CBB and the Claspin protein bands (indicated by boxes) were excised out and analyzed by mass spectrometry. (B) Phosphorylation sites of Claspin in the non-treated, HU-treated, siCdc7-treated and HU+siCdc7-treated 293 T cells are shown on the polypeptide sequences. PIP box, CKBD and AP (Acidic Patch) are highlighted in blue, yellow and gray, respectively. Phosphorylated serines and threonines are shown with white letters in red background. Putative phosphorylation sites in the three CKBD are boxed. All the phosphorylation sites detected in multiple experiments are compiled and shown.
Figure 5 with 5 supplements
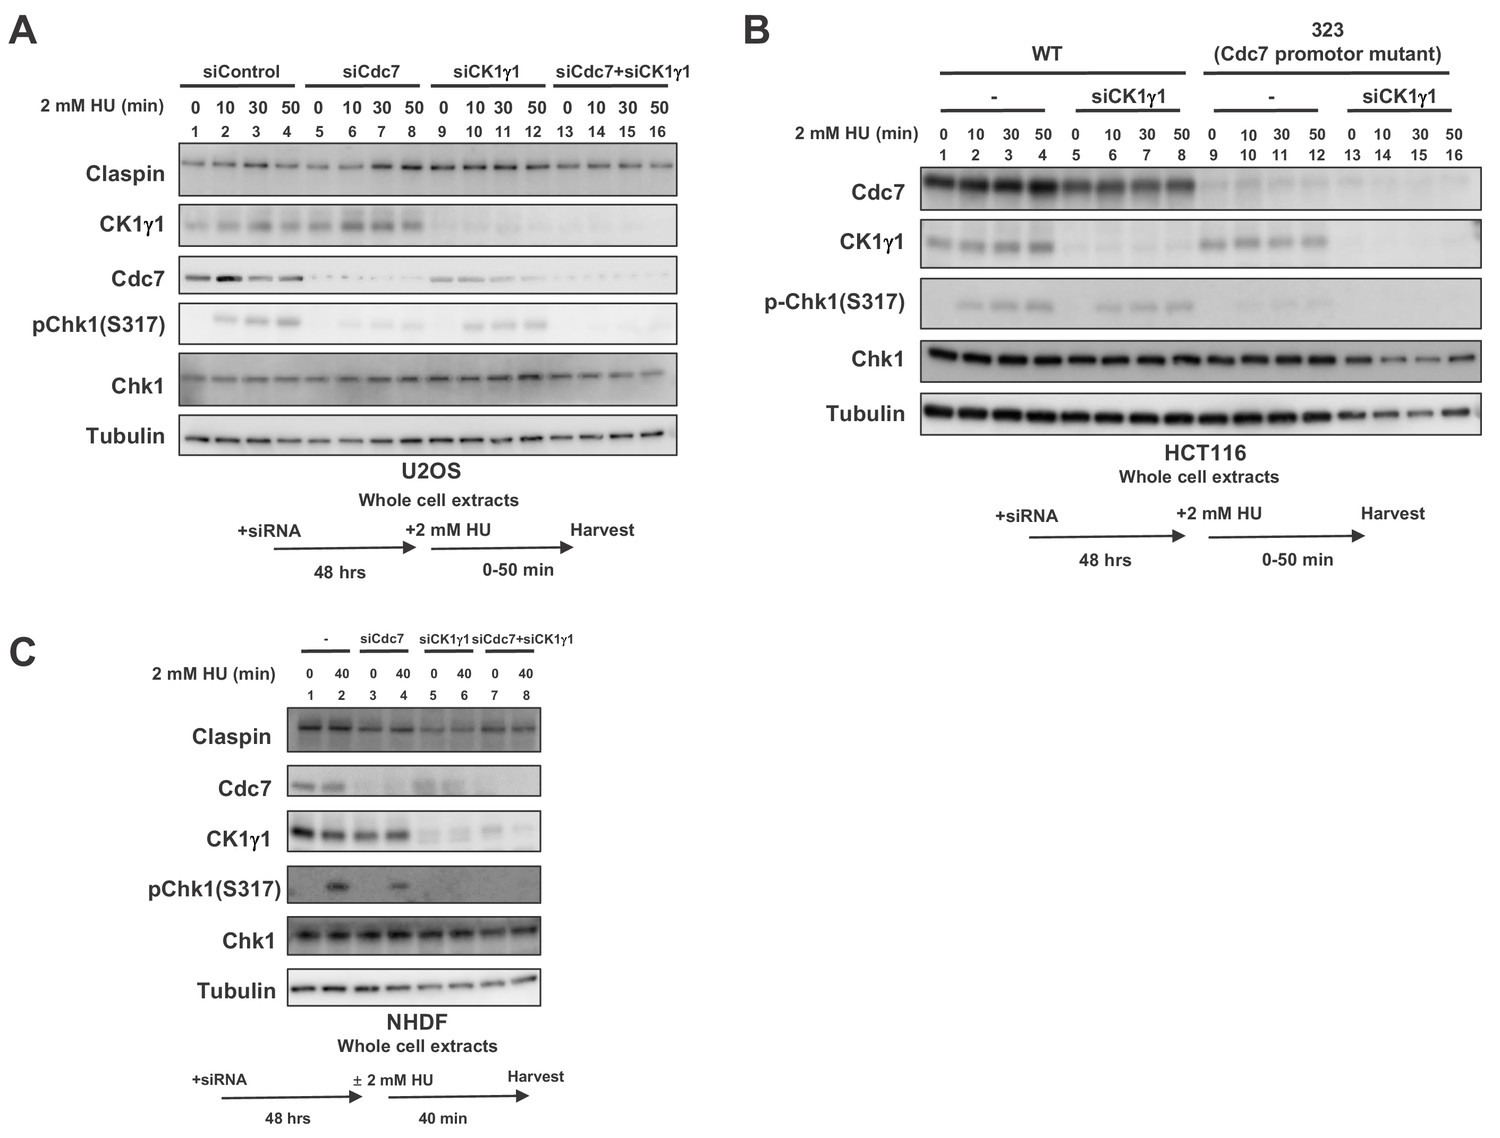
Both Cdc7 and CK1γ1 are required for full activation of Chk1 in response to replication stress.
(A) U2OS cells were transfected with siControl, siCdc7, siCK1γ1 or siCdc7+siCK1γ1 for 48 hr. (B) HCT116 and HCT116-323, a Cdc7 promoter mutant cell line, were transfected with siControl or siCK1γ1 for 48 hr. In A and B, cells were harvested at 0, 10, 30 and 50 min after addition of 2 mM HU. (C) NHDF cells were transfected with siControl, siCdc7, siCK1γ1 or siCdc7+siCK1γ1 for 48 hr. Cells were non-treated or treated with 2 mM HU for 40 min. In A-C, the whole cell extracts were analyzed by western blotting with indicated antibodies.
Figure 5—figure supplement 1
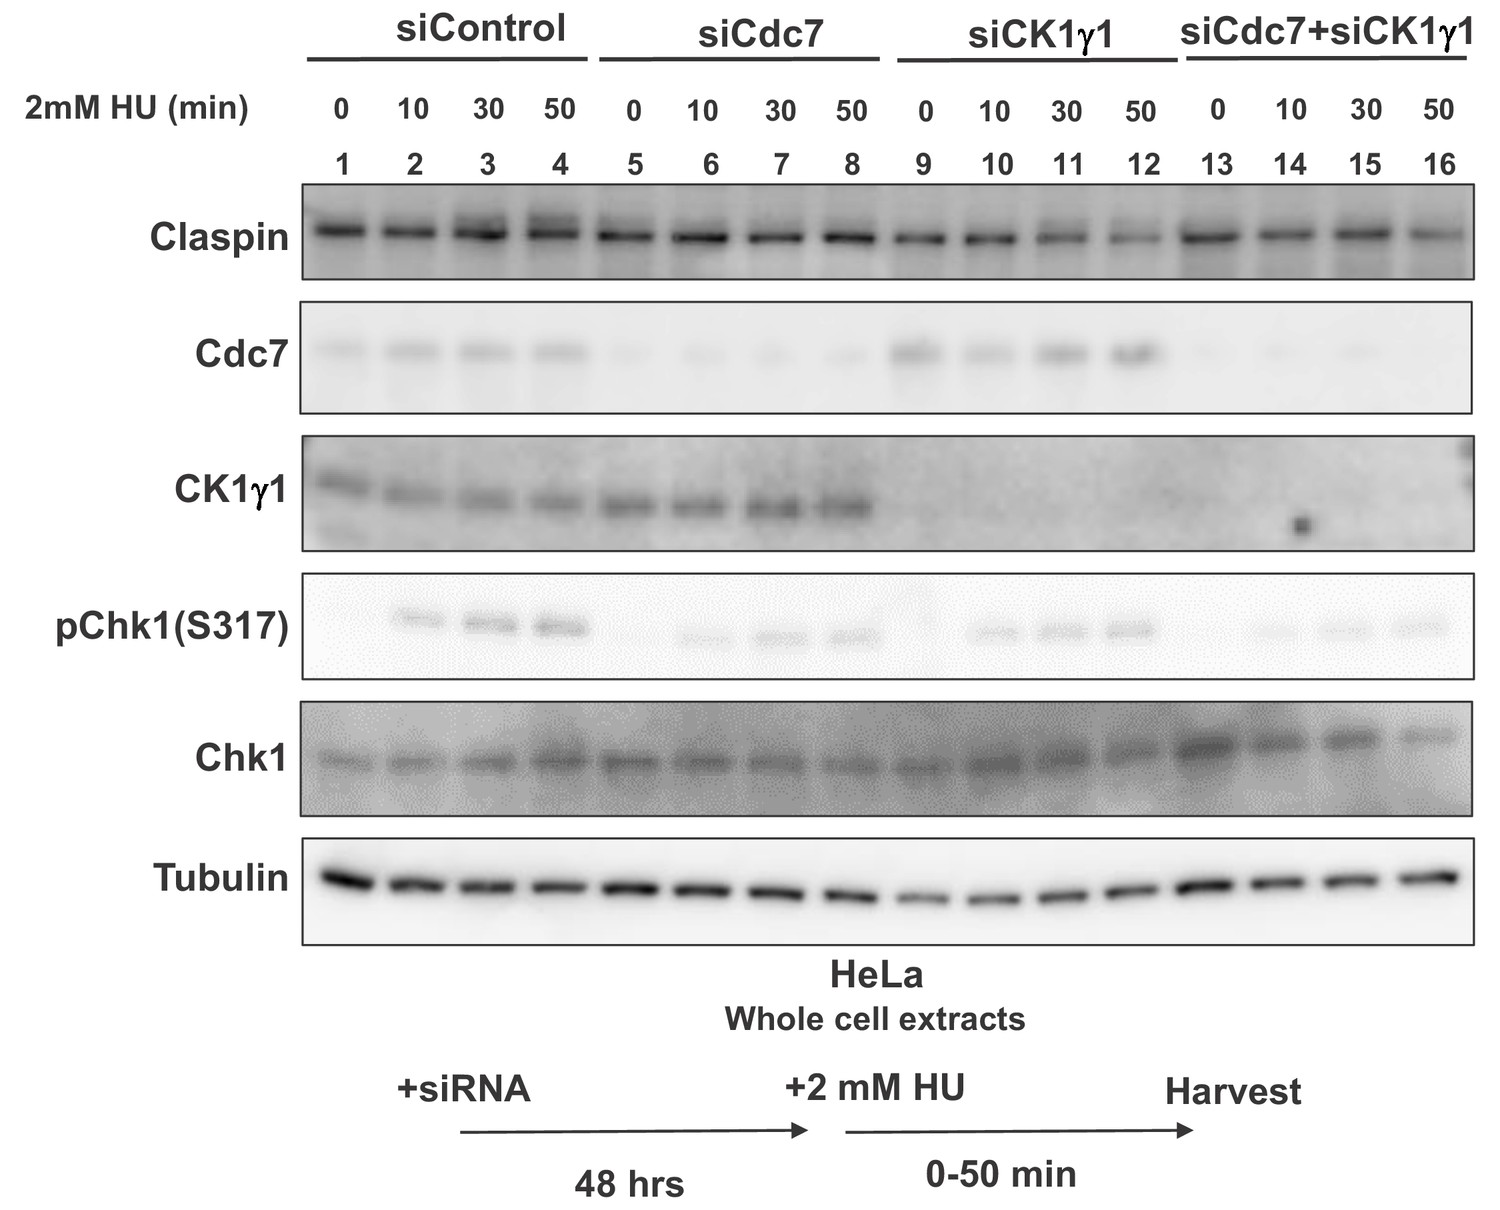
Cdc7 and CK1γ1 are required for full activation of Chk1 in response to replication stress in HeLa cells.
HeLa cells were transfected with siControl, siCdc7, siCK1γ1 or siCdc7+siCK1γ1 for 48 hr. Cells were harvested at 0, 10, 30 and 50 min after addition of 2 mM HU and whole cell extracts were analyzed by western blotting with indicated antibodies.
Figure 5—figure supplement 2
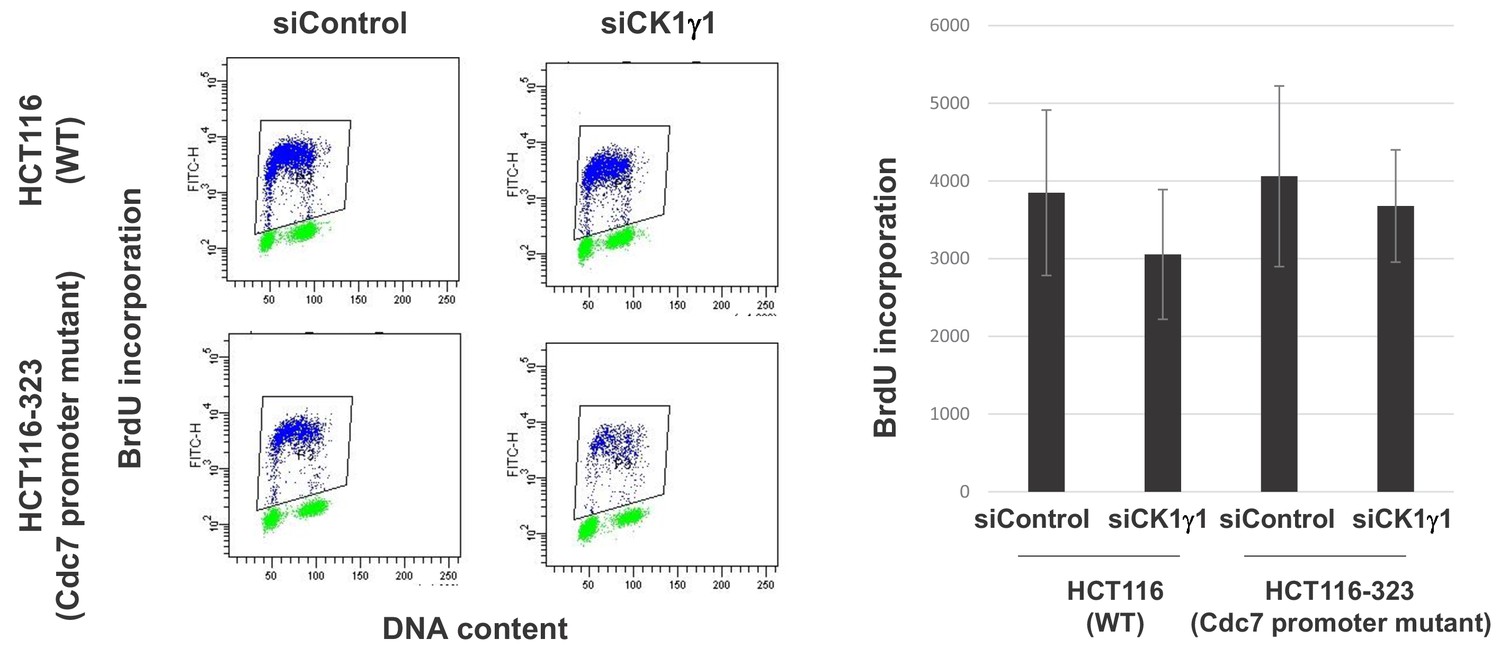
Effect of CK1γ1 depletion on DNA replication in HCT116-323 cells.
(A) HCT116 and Cdc7 promotor mutant HCT116-323 were transfected with siControl or siCK1γ1for 48 hr. Cell were labeled by BrdU for 20 min and BrdU incorporation was analyzed by FACS. (B) The average FITC intensity of each cell is shown in the graph. The mean ±s.d. values from three independent experiments are shown.
-
Figure 5—figure supplement 2—source data 1
Quantification for graph (three independent FACS experiments) in Figure 5—figure supplement 2.
- https://cdn.elifesciences.org/articles/50796/elife-50796-fig5-figsupp2-data1-v2.xlsx
Figure 5—figure supplement 3
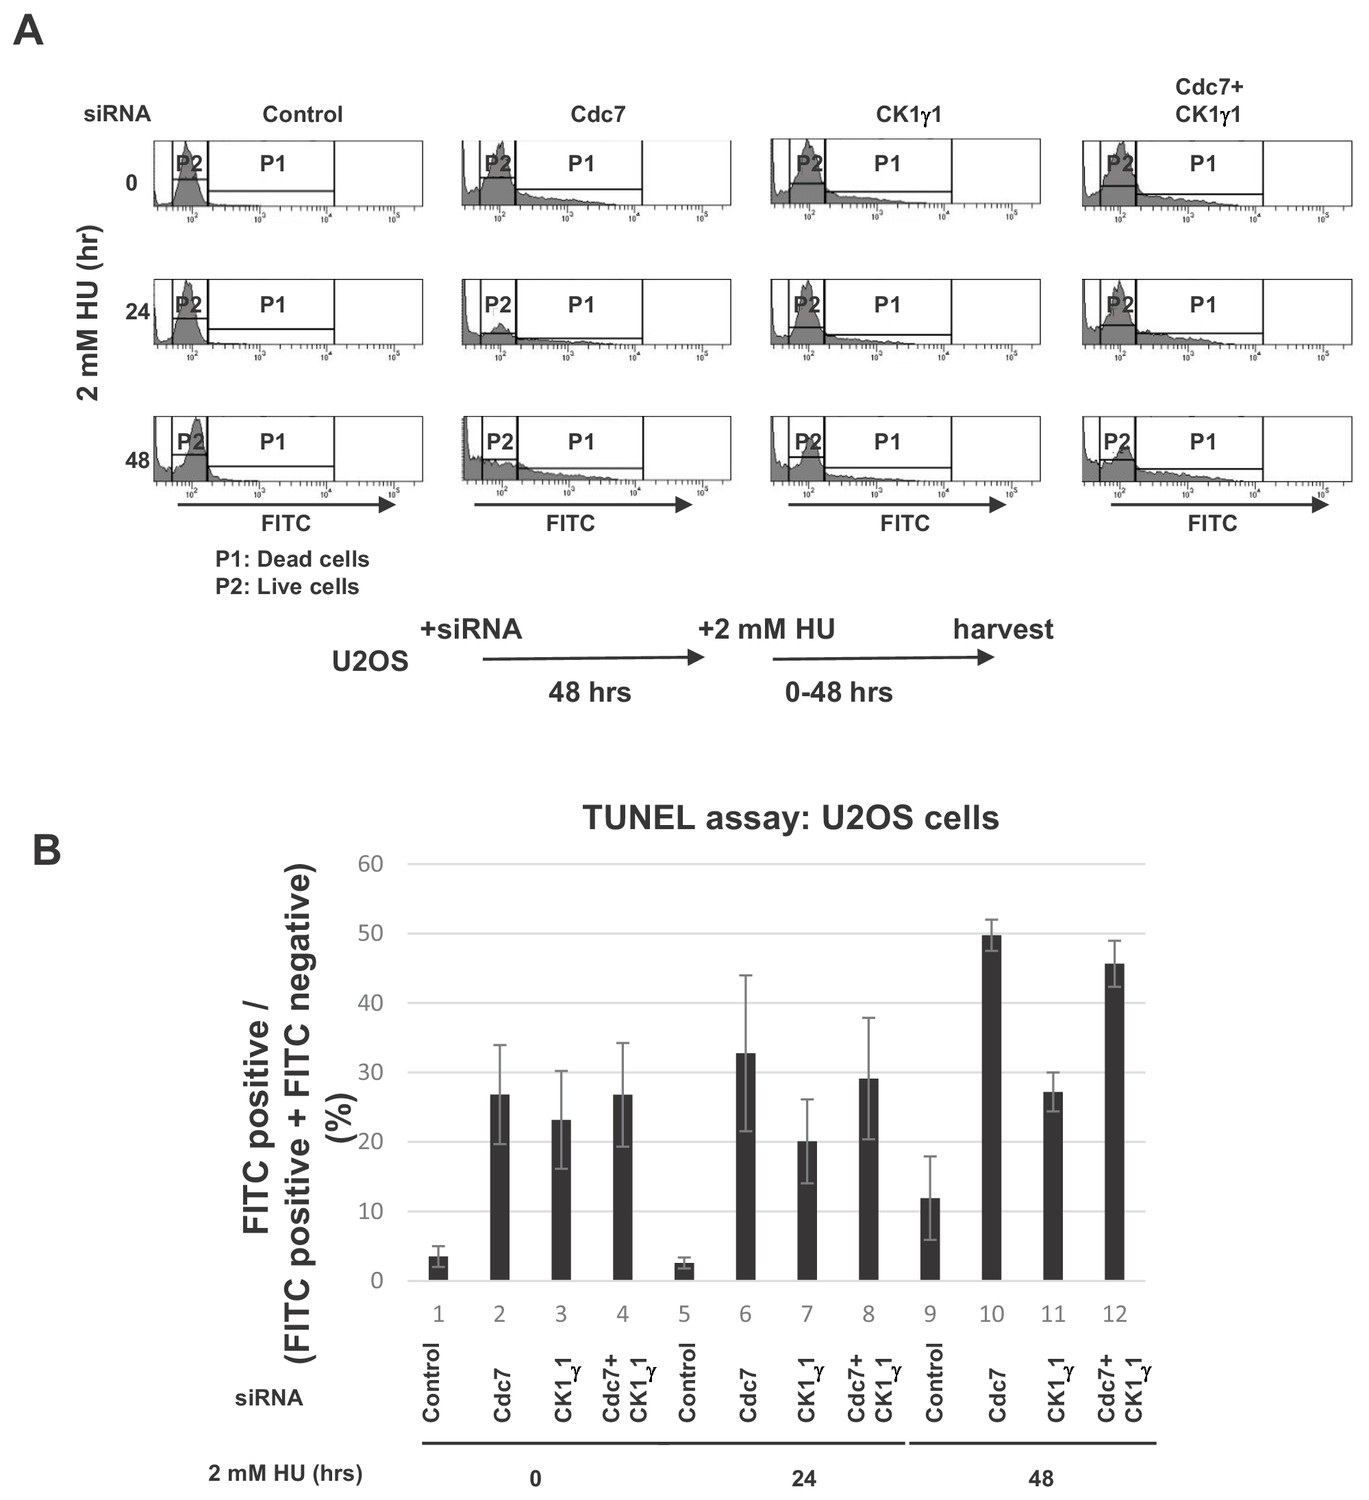
Cdc7 plays a major role in prevention of replication stress-induced cell death in U2OS cells.
(A) U2OS cells were transfected with indicated siRNA for 48 hr, and then were treated with 2 mM HU for 0, 24 or 48 hr. After mixing with reagents for TUNEL assays, cells were analyzed by FACS. P1 and P2 indicate FITC-positive (dead) and -negative (live) cells, respectively. (B) Quantification of A. The averages of the results from three independent experiments are shown with error bars.
-
Figure 5—figure supplement 3—source data 1
Quantification for graph (three independent FACS experiments) in Figure 5—figure supplement 3.
- https://cdn.elifesciences.org/articles/50796/elife-50796-fig5-figsupp3-data1-v2.xlsx
Figure 5—figure supplement 4
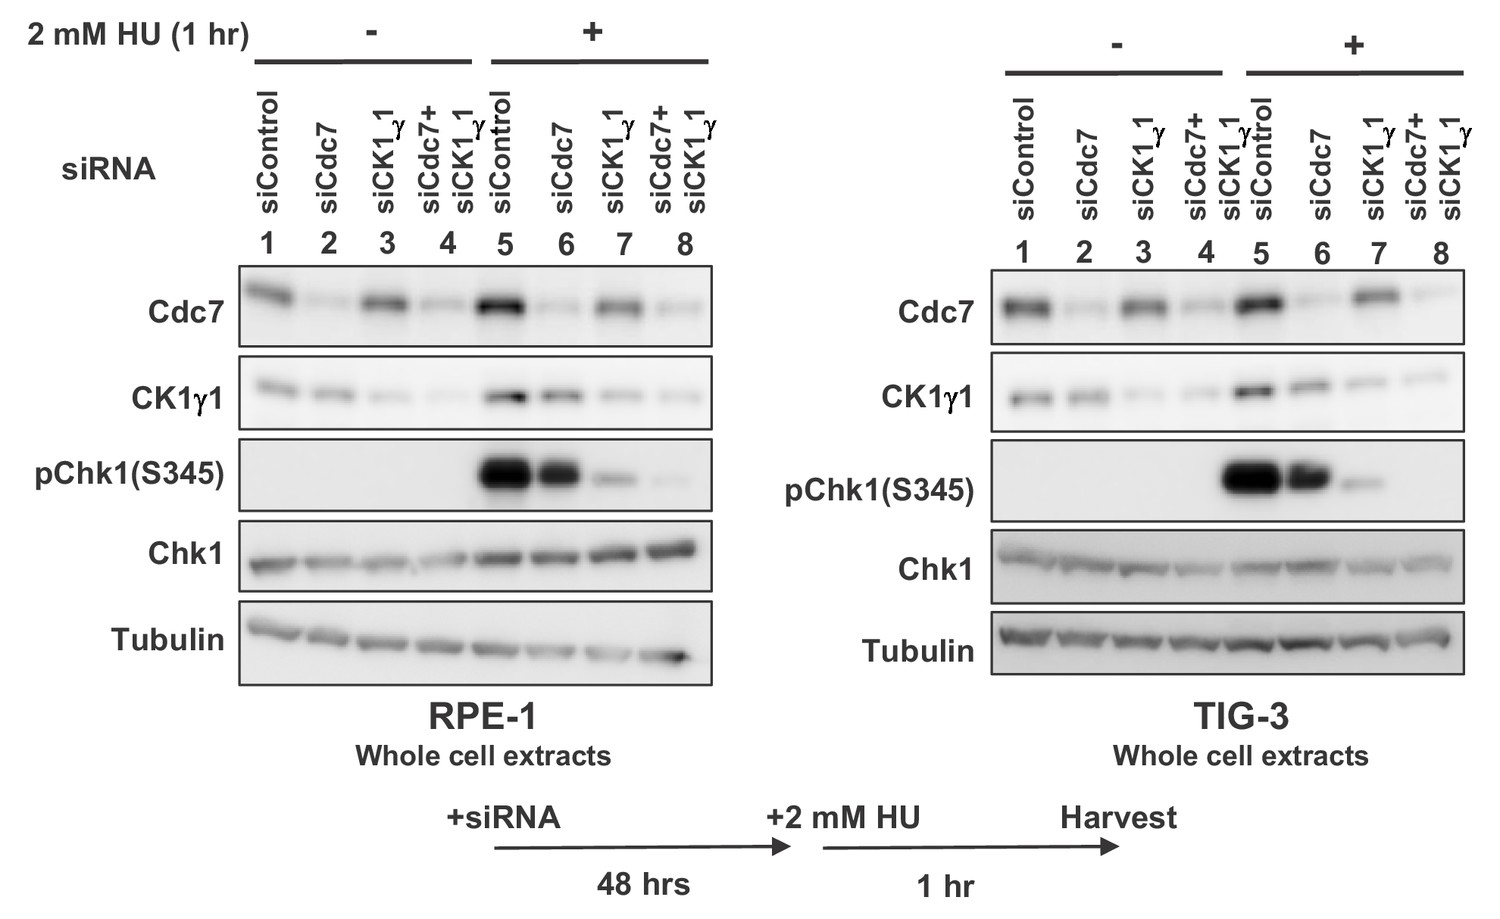
CK1γ1 plays a major role for full activation of Chk1 in response to replication stress in non-cancer cells.
RPE-1 and TIG-3 cells were transfected with siControl, siCdc7, siCK1γ1 or siCdc7+siCK1γ1 for 48 hr. Cells were harvested at 1 hr after addition of 2 mM HU and whole cell extracts were analyzed by western blotting with indicated antibodies.
Figure 5—figure supplement 5
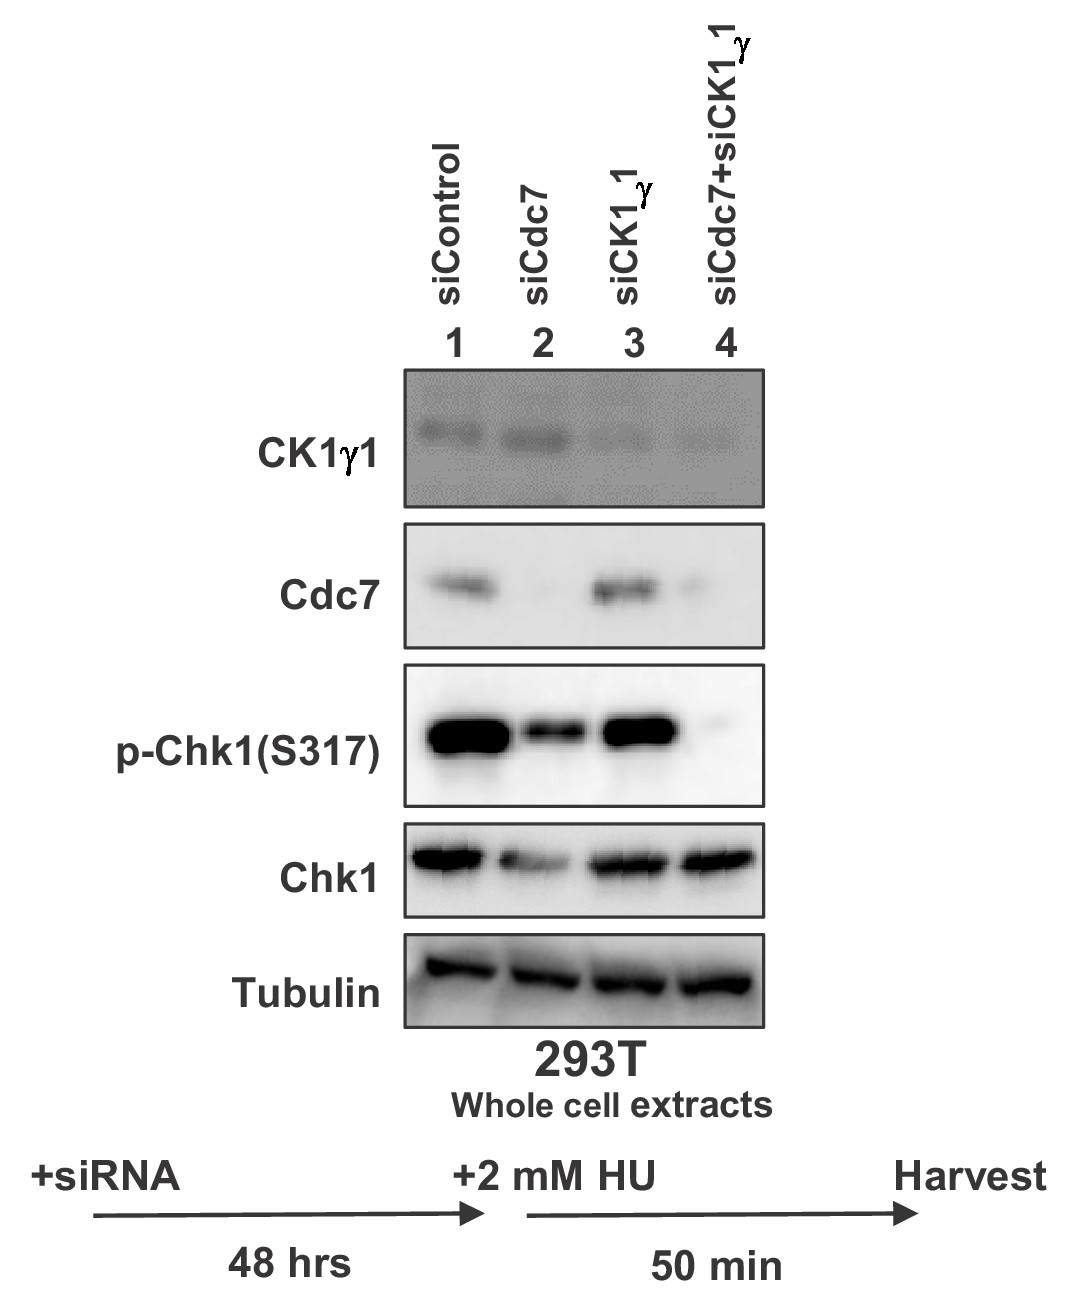
Cdc7 plays a major role for full activation of Chk1 in response to replication stress in 293 T cells 293 T cells were transfected with siControl, siCdc7, siCK1γ1 or siCdc7+siCK1γ1 for 48 hr.
Cells were harvested at 50 min after addition of 2 mM HU and whole cell extracts were analyzed by western blotting with indicated antibodies.
Figure 6 with 2 supplements
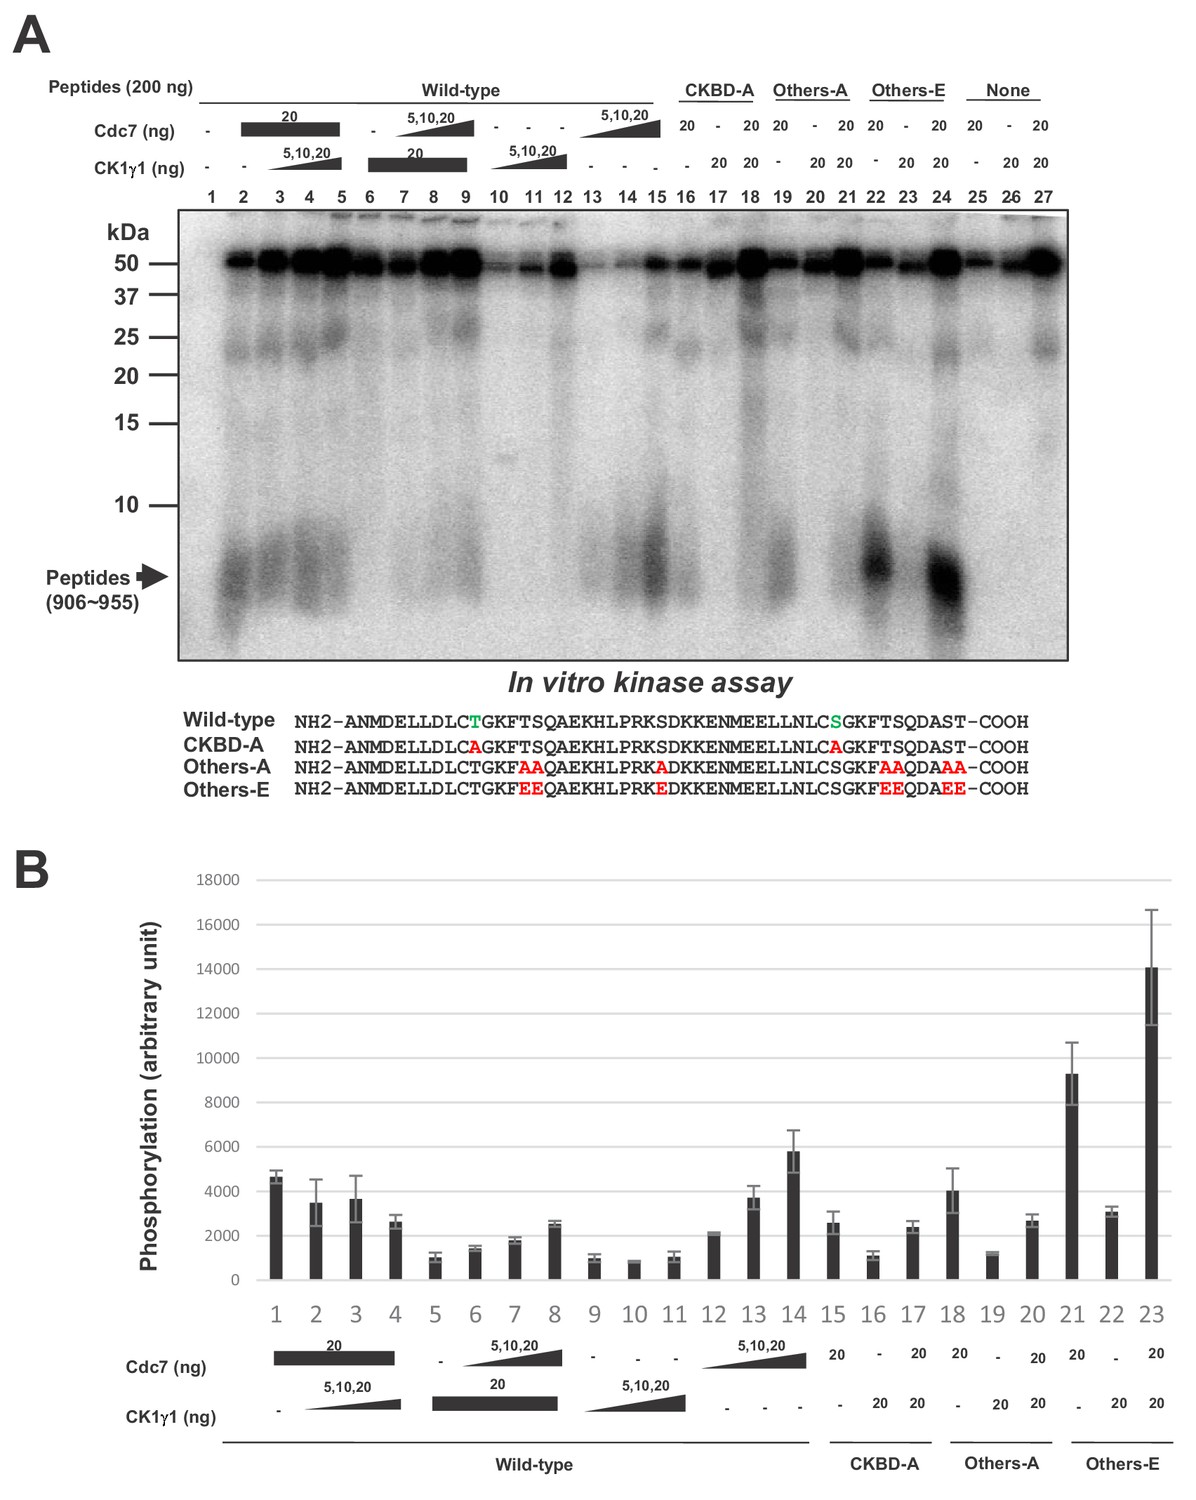
Cdc7 phosphorylates T916 and S945.
(A) Two hundred ng (34 pmole) each of wild type CKBD peptide (wild-type) or mutant peptides (CKBD-A, Others-A and Others-E) was incubated in the kinase reaction with indicated amounts of purified Cdc7-ASK and/or CK1γ1 in the presence of [γ-32P]-ATP for 60 min at 30°C. Samples were analyzed on 18% SDS-PAGE. After silver staining, the gel was autoradiographed. The position of the substrate peptides in the gel is indicated by an arrow. The amino acid sequences of each peptide are shown below the panel. The serine and threonine in CKBD are in green, and the mutated residues are shown in red. (B) Quantification of the phosphorylation level of the peptide in (A). The averages of three independent kinase assays are shown with error bars.
-
Figure 6—source data 1
Quantification for graph (three independent FACS experiments) in Figure 6B.
- https://cdn.elifesciences.org/articles/50796/elife-50796-fig6-data1-v2.xlsx
Figure 6—figure supplement 1
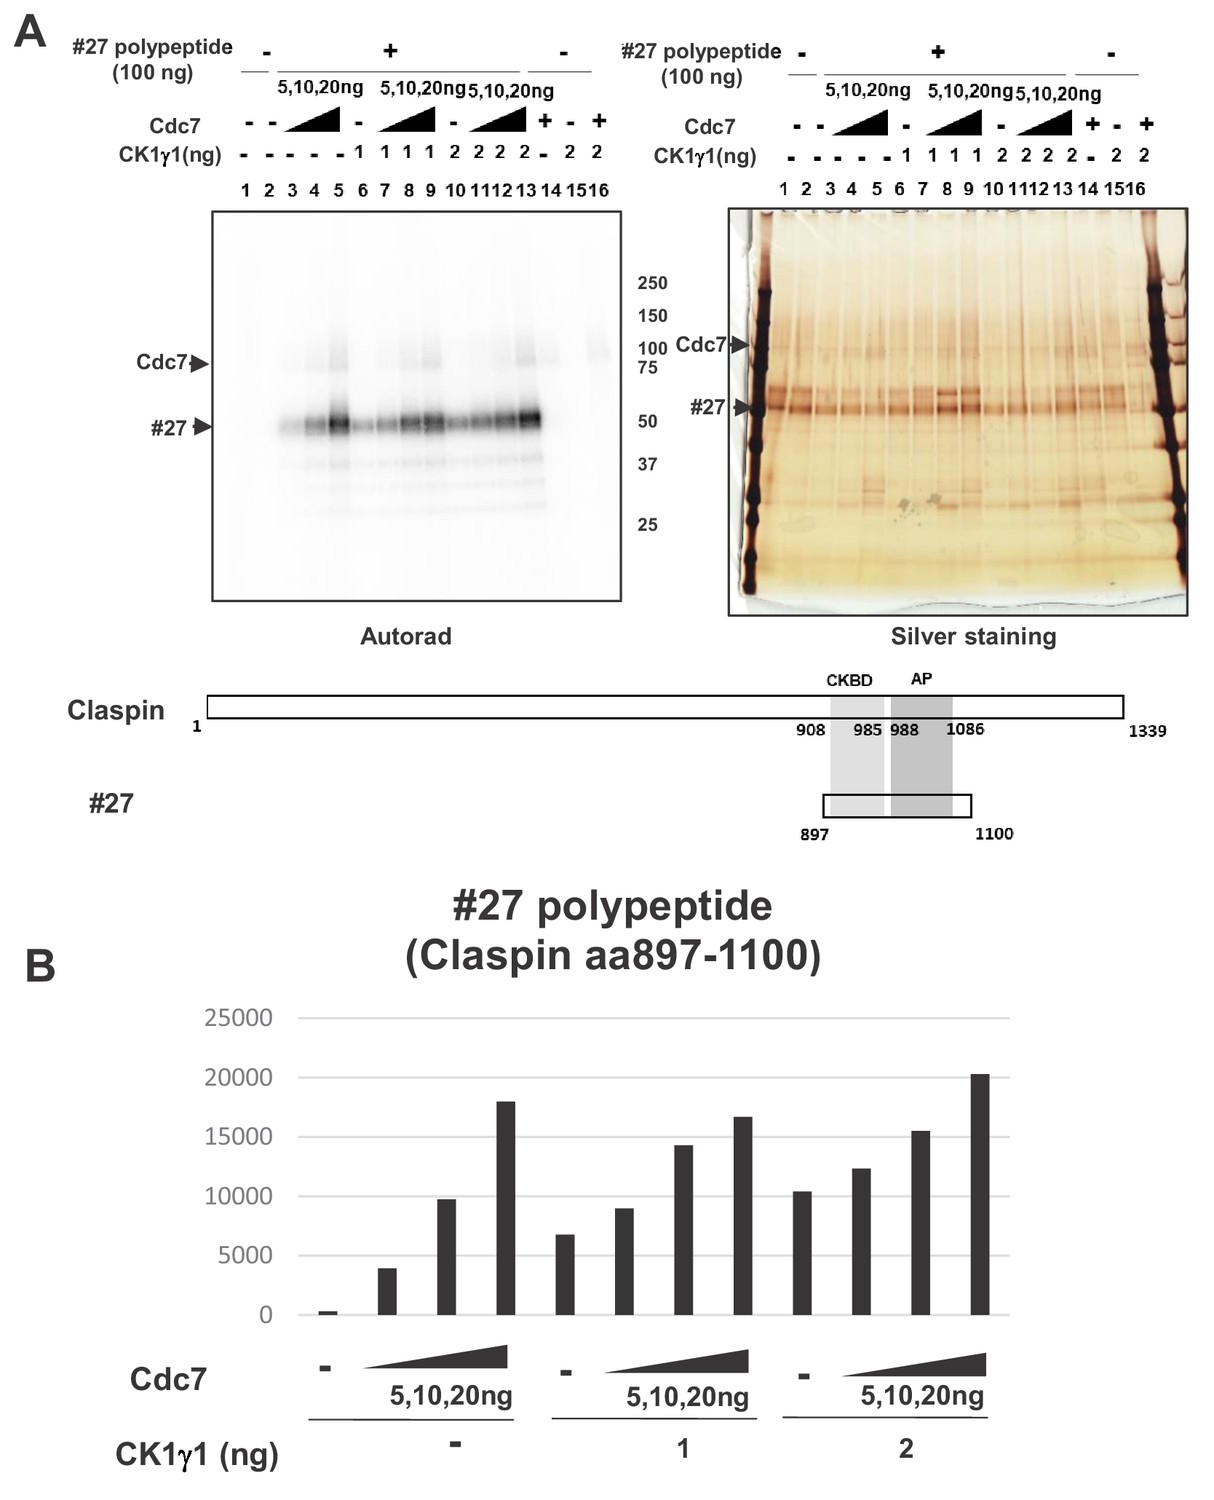
Cdc7 and CK1γ1 phosphorylate Claspin independently.
(A) Purified Claspin polypeptide #27 (aa897-1100 containing CKBD and AP) was incubated in the kinase reaction with indicated amounts of purified Cdc7-ASK and/or CK1γ1 in the presence of [γ-32P]-ATP. Samples were analyzed on 4–20% gradient SDS-PAGE, followed by silver staining (right) and autoradiogram (left). The positions of the proteins are indicated by arrows. Bottom drawing shows schematic diagram of the polypeptide #27. (B) Quantification of the phosphorylation level of the #27 polypeptide in A.
Figure 6—figure supplement 2
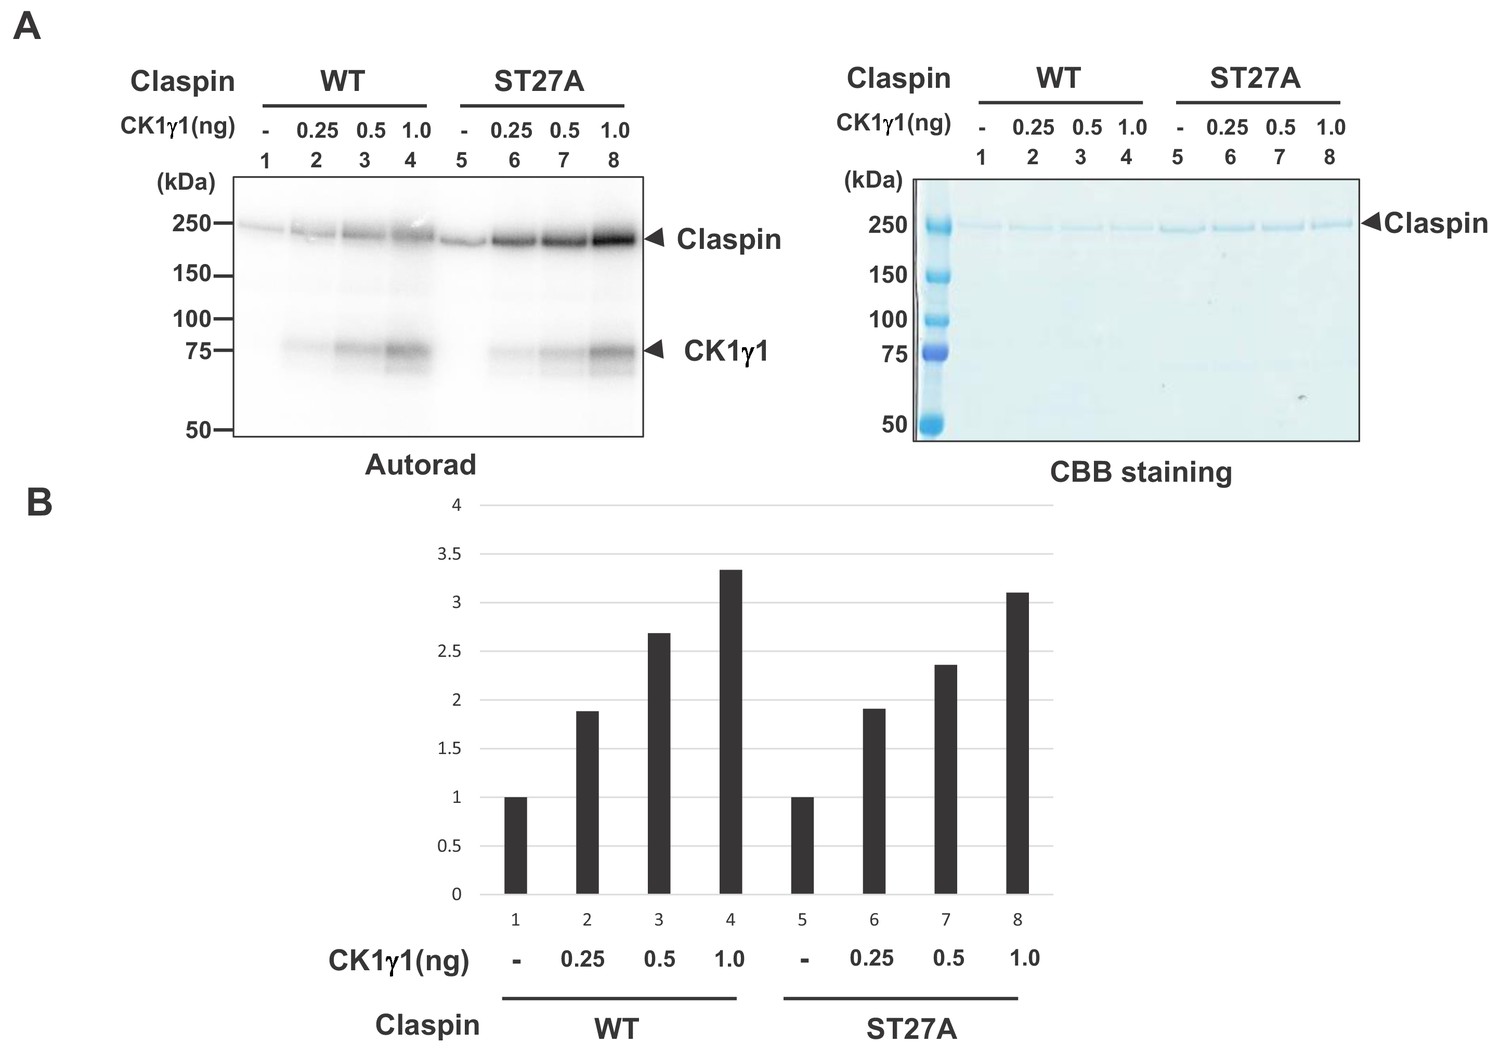
CK1γ1 phosphorylates Claspin in a manner independent of serine/threonine residues in the CKBD-AP segment.
(A) Purified wild type Claspin or Claspin mutant ST27A (serines and threonines in aa903-1120 substituted by alanine) was incubated in the kinase reaction with indicated amounts of purified CK1γ1 in the presence of [γ-32P]-ATP. Samples were analyzed on 4–20% gradient SDS-PAGE, followed by CBB staining (right) and autoradiogram (left). The positions of the proteins are indicated by arrows. Bottom drawing shows schematic diagram of the polypeptide #27. (B) Quantification of the phosphorylation levels of the Wt or ST27A Claspin in A. The background phosphorylation level in the absence of CK1γ1 was taken as one for both WT and ST27A Claspin proteins.
Figure 7 with 3 supplements
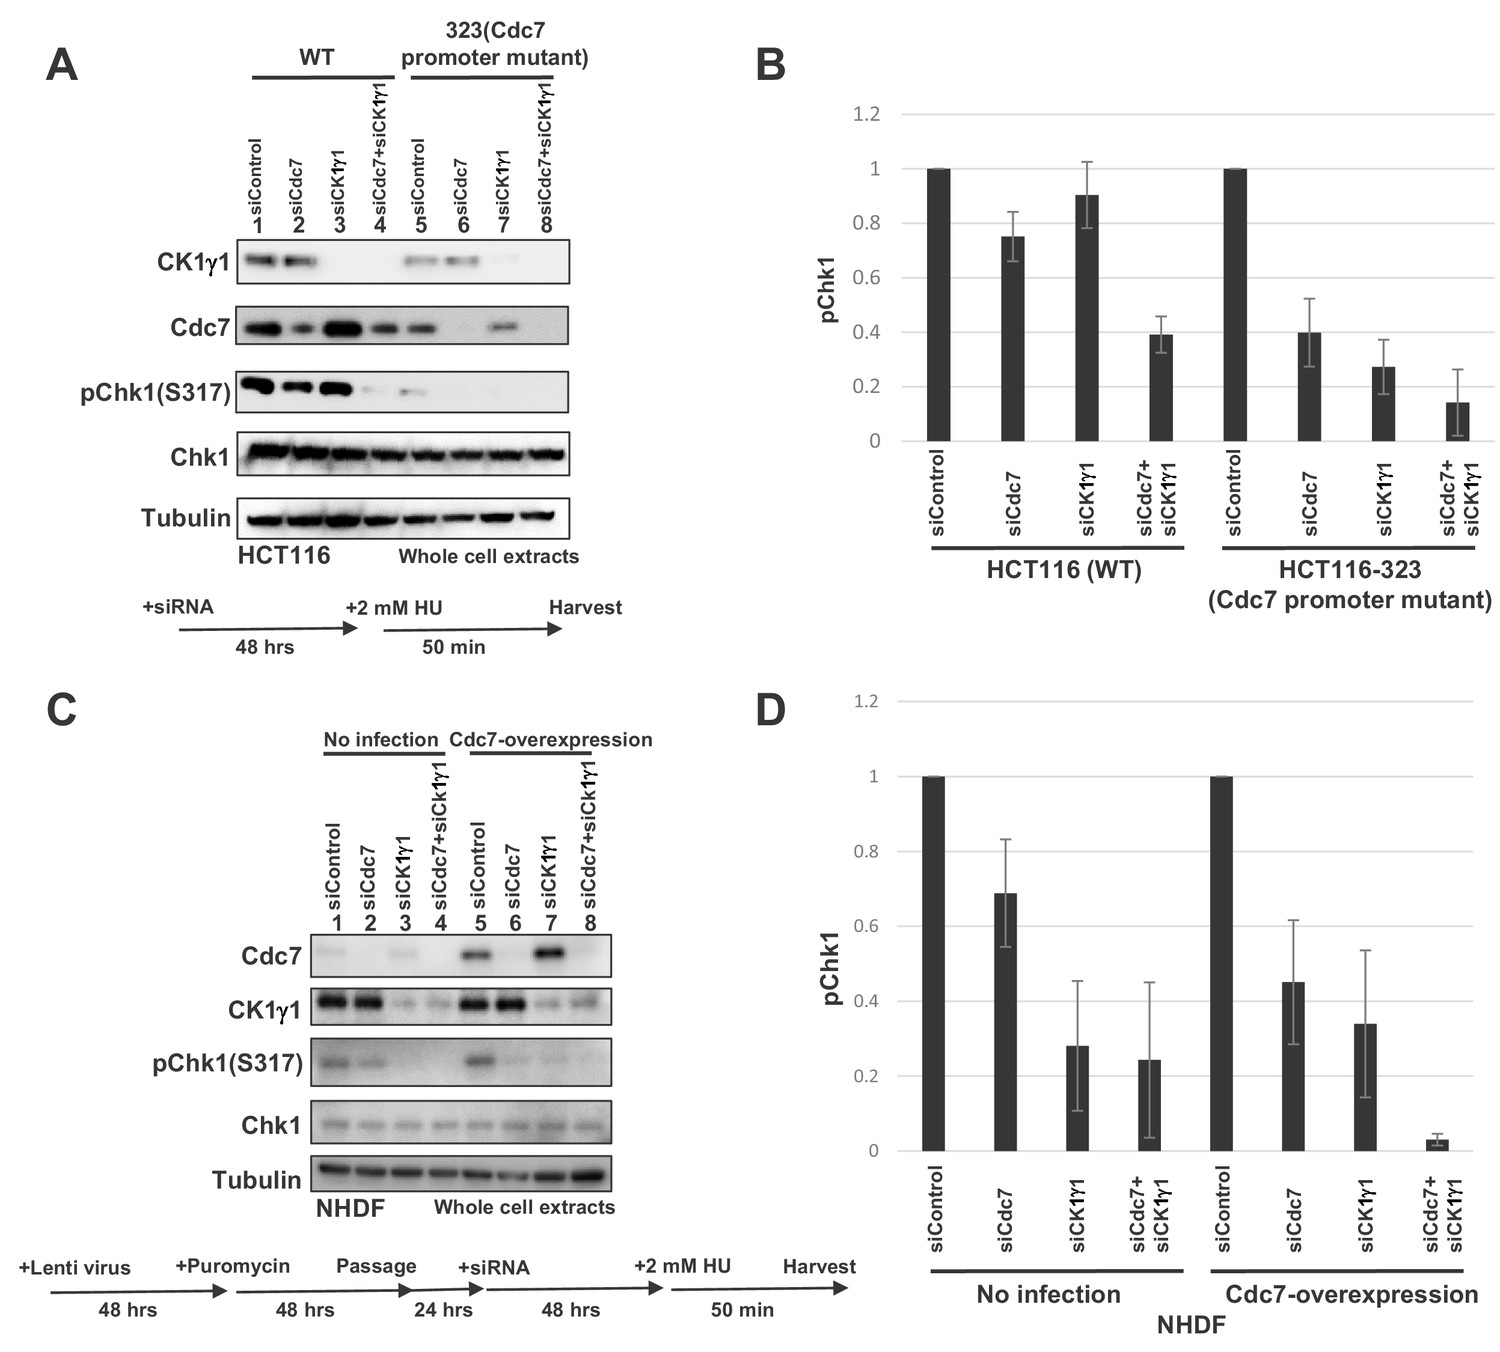
Levels of Cdc7 protein affect the dependency on CK1γ1 for checkpoint activation.
(A) HCT116 and HCT116-323 (Cdc7 promoter mutant) cells were transfected with siControl, siCdc7, siCK1γ1 or siCdc7+ siCK1γ1 for 48 hr. Cells were then treated with 2 mM HU for 50 min. Whole cell extracts were analyzed by western blotting with indicated antibodies. (B). Quantification of the level of Chk1 phosphorylation in (A). (C) NHDF cells were infected by Cdc7-expressing lentiviruses. At 2 days after infection, cells were selected by puromycin (4 µg/ml) for 2 days, and were transfected with indicated siRNA for 2 days, followed by incubation with 2 mM HU for 50 min. Whole cell extracts were analyzed by western blotting with indicated antibodies. (D) Quantification of the level of Chk1 phosphorylation in (C). In B and D, the level of Chk1 phosphorylation in the siControl sample was taken as 1, and relative levels of the phosphorylation in other siRNA samples are shown for each cell line. Averages of the three independent experiments are shown with error bars.
-
Figure 7—source data 1
Quantification for western data (three independent experiments of Figure 7A) in Figure 7B.
- https://cdn.elifesciences.org/articles/50796/elife-50796-fig7-data1-v2.xlsx
-
Figure 7—source data 2
Quantification for western data (three independent experiments of Figure 7C) in Figure 7D.
- https://cdn.elifesciences.org/articles/50796/elife-50796-fig7-data2-v2.xlsx
Figure 7—figure supplement 1
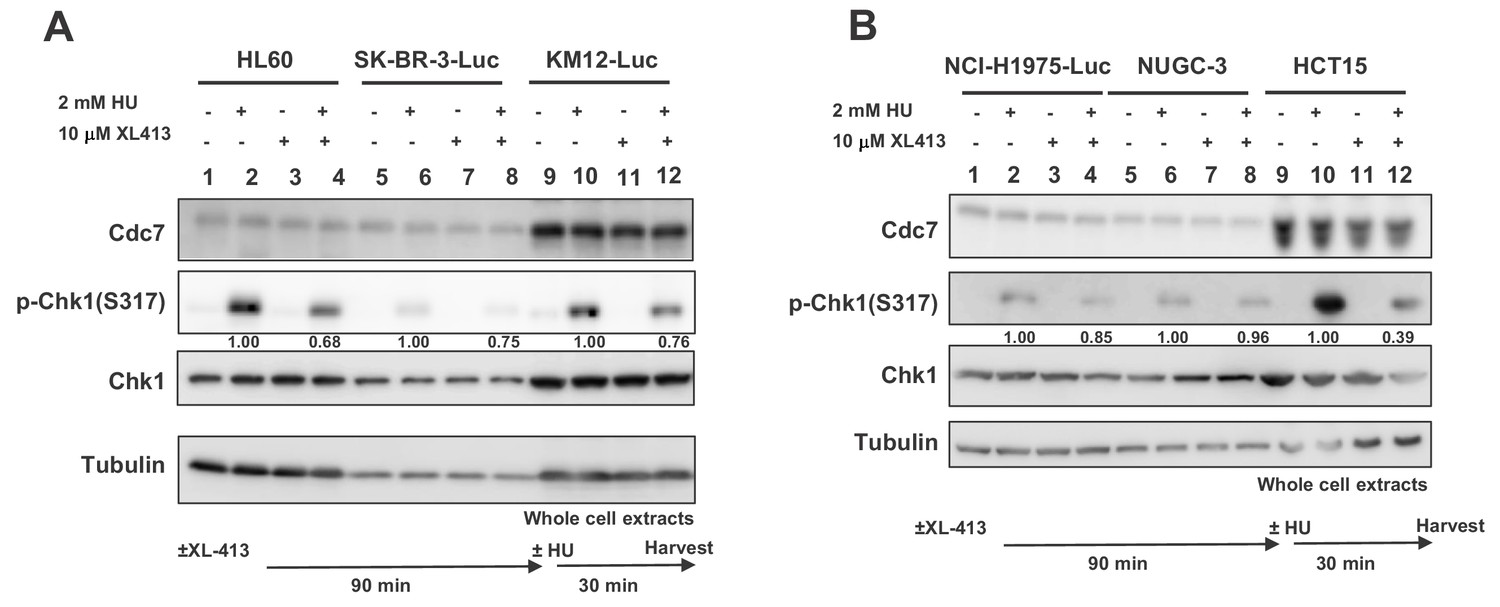
Effect of Cdc7 inhibition on checkpoint activation in various cancer and normal cell lines (related to Figures 1 and 4 as well).
(A and B) Various cells indicated in the figure were treated with 10 µM XL413 (Cdc7-specific inhibitor) for 90 min and then treated with HU at the concentrations shown for the time indicated. The whole cell extracts were analyzed by western blotting with indicated antibodies. The band intensities of pChk1 relative to those of tubulin were quantified and the relative values for each cell line are shown below relevant bands.
Figure 7—figure supplement 2
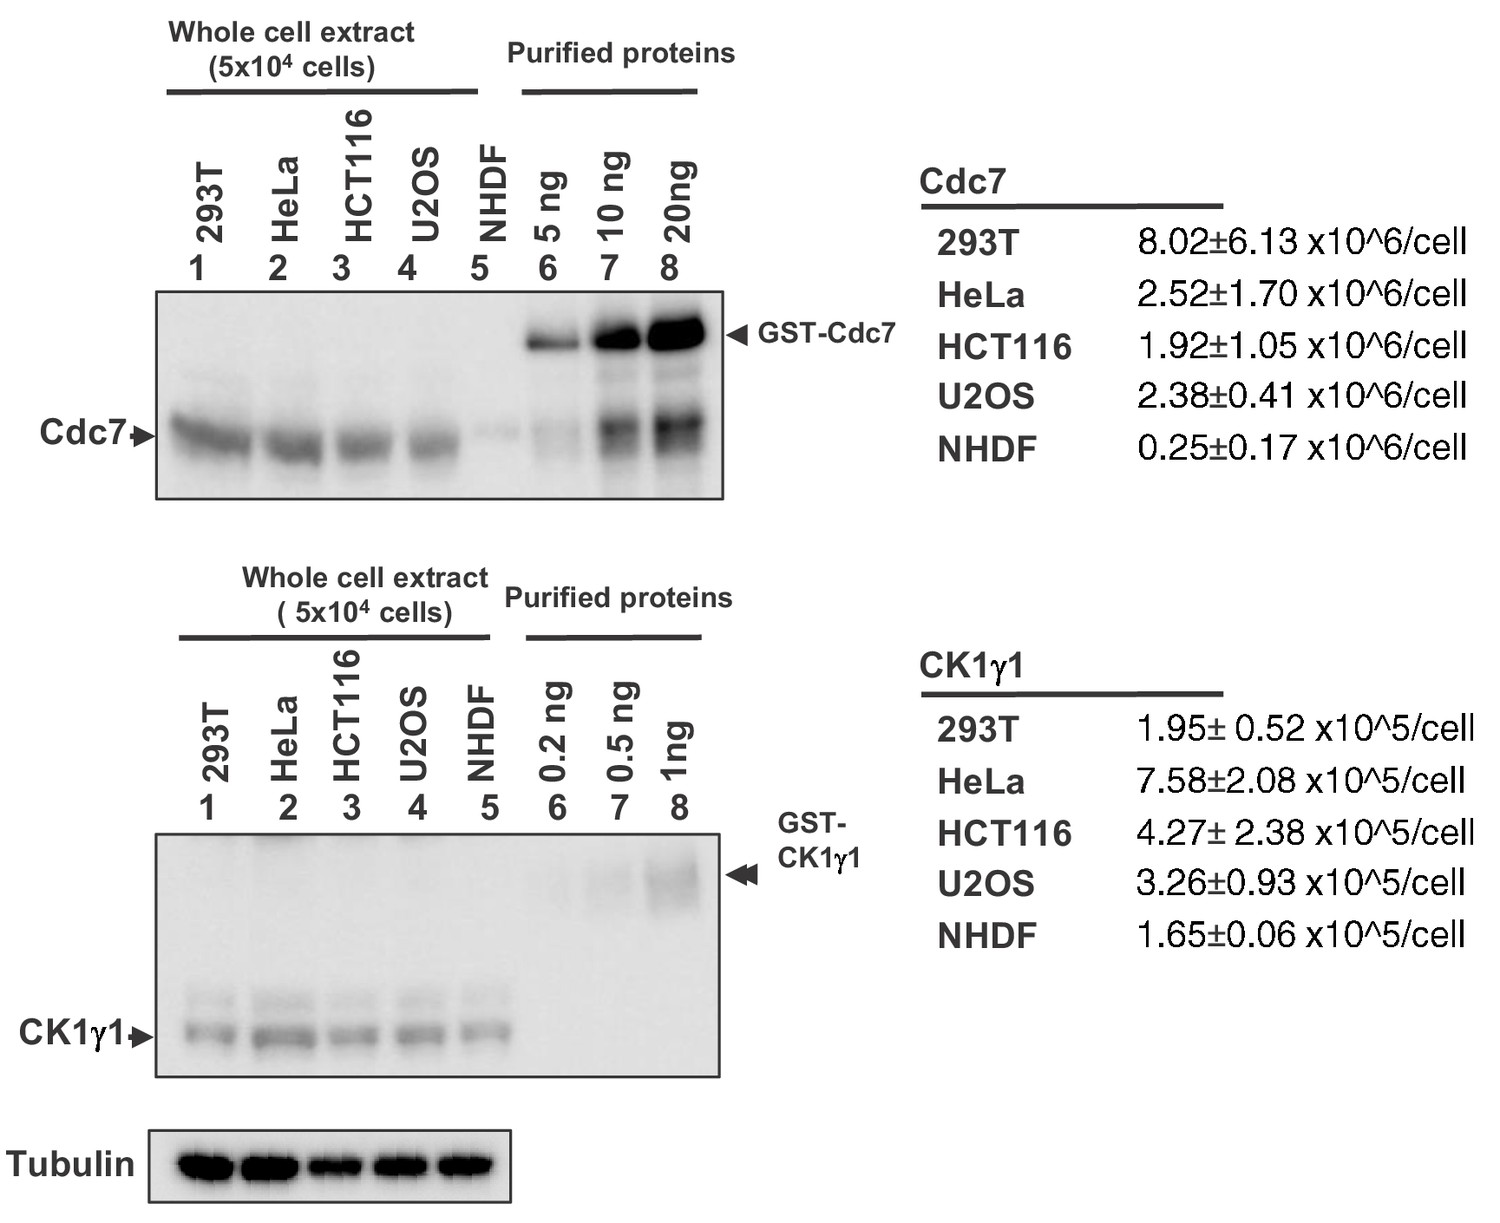
Estimation of the numbers of molecules of Cdc7 and CK1γ1 in various cell lines.
The whole cell extracts from 5 × 10⁴ 293T, HeLa, HCT116, U2OS and NHDF cells and purified Cdc7 and CK1γ1 proteins of the amount indicated were run on 4–20% gradient SDS-PAGE and analyzed by western blotting with antibodies against Cdc7 (upper) or CK1γ1 (lower). The band intensities were quantified and the numbers of Cdc7 or CK1γ1 molecules per cell were calculated. The averages of the three experiments with standard deviations are indicated in the table on the right.
Figure 7—figure supplement 3
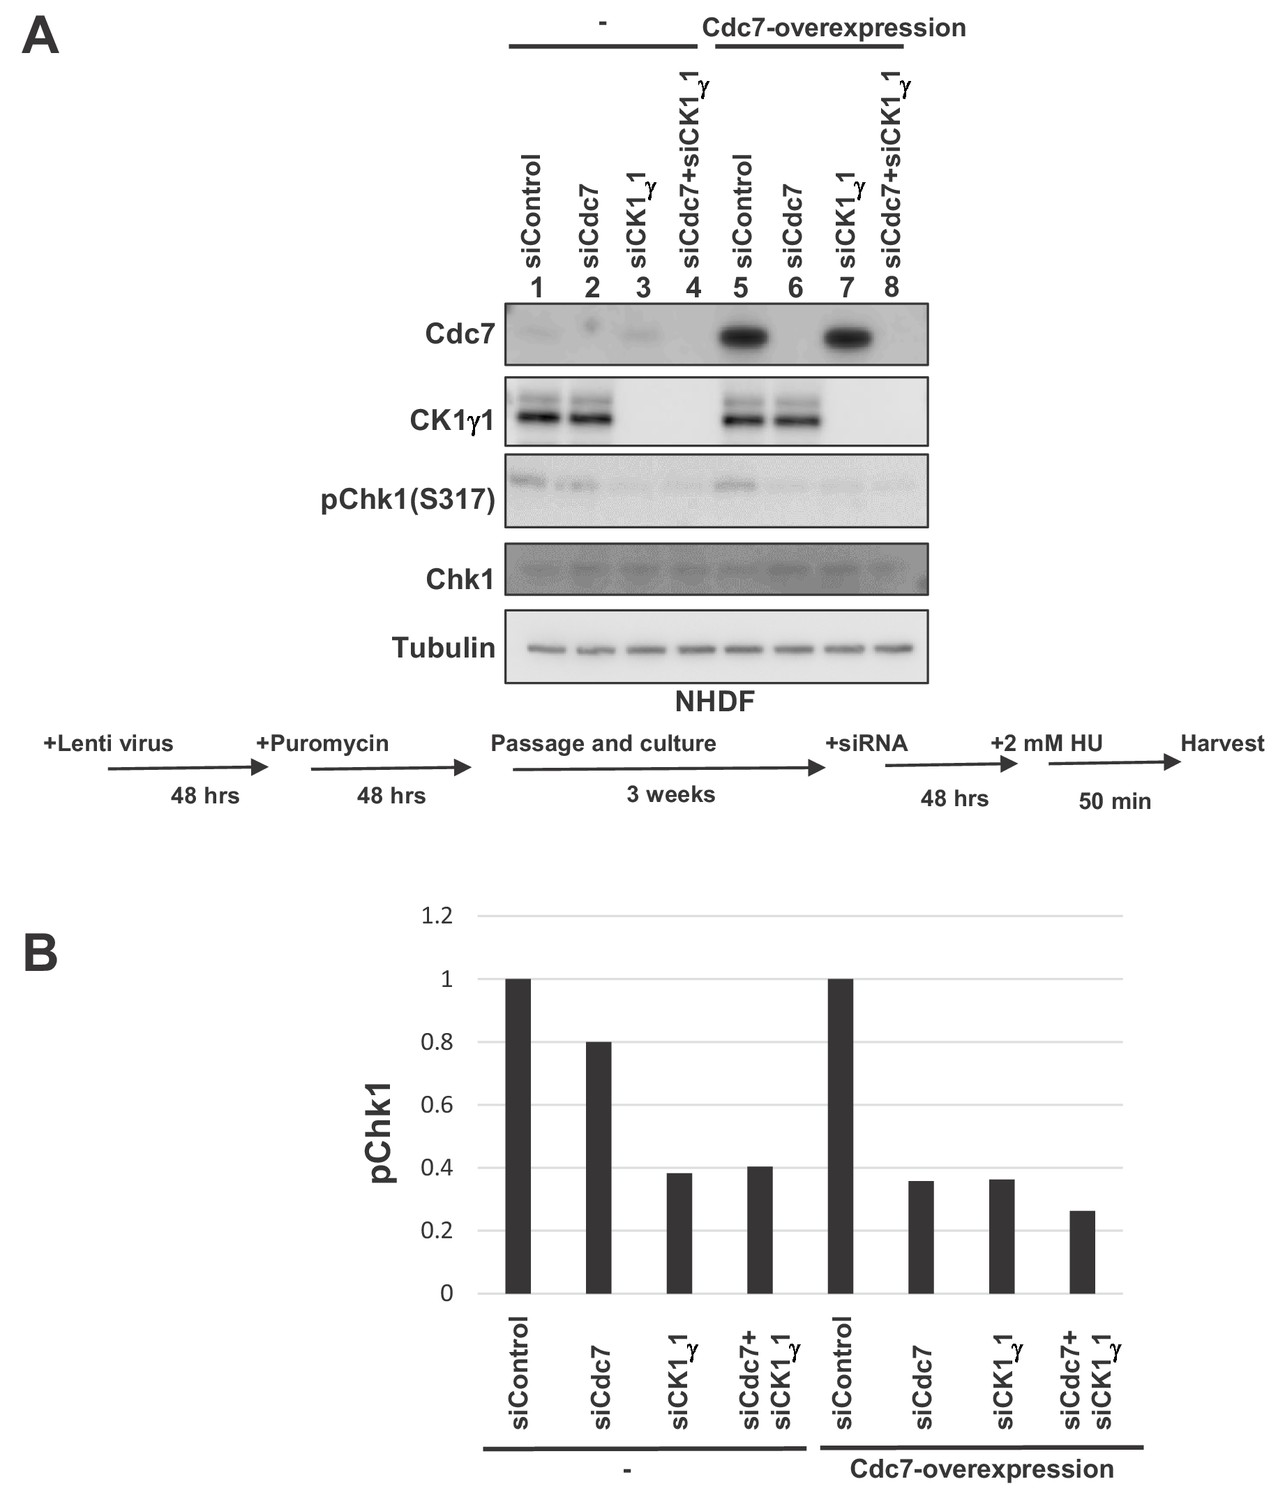
Overexpression of Cdc7 in NHDF cells increases dependency on Cdc7 for checkpoint activation.
(A) NHDF cells were infected by Cdc7- or CK1γ1-expressing lentiviruses. At 2 days after infection, cells were selected by puromycin (4 µg/ml) for 2 days, followed by incubation in the absence of the selection for 3 weeks. Cells were then transfected with indicated siRNA for 2 days, followed by incubation with 2 mM HU for 50 min. The whole cell extracts were analyzed by western blotting with indicated antibodies. (B) Quantification of the levels of phosphorylation Chk1 in (A).
Author response image 1
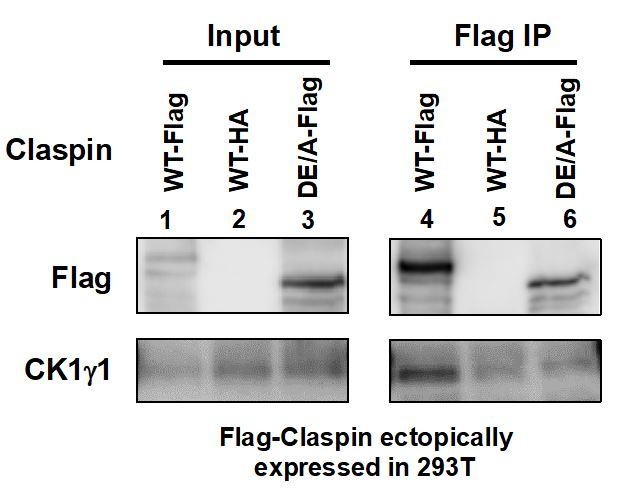
Flag-tagged wild-type (lanes 1 and 4) or APDE/A (lanes 3 and 6) or HA-tagged wild-type (lanes 2 and 5; negative control) Claspin was transiently expressed in 293T cells, and extracts were made with CSK buffer containing 0.1% Triton X-100.
Immnoprecipitates with anti-Flag antibody were analyzed for CK1γ1 (lanes 4-6). Inputs were also analyzed (lanes 1-3).
Additional files
-
Supplementary file 1
Key Resources Table.
- https://cdn.elifesciences.org/articles/50796/elife-50796-supp1-v2.docx
-
Supplementary file 2
List of the siRNA sequences used in this study.
- https://cdn.elifesciences.org/articles/50796/elife-50796-supp2-v2.docx
-
Transparent reporting form
- https://cdn.elifesciences.org/articles/50796/elife-50796-transrepform-v2.docx
Download links
A two-part list of links to download the article, or parts of the article, in various formats.
Downloads (link to download the article as PDF)
Open citations (links to open the citations from this article in various online reference manager services)
Cite this article (links to download the citations from this article in formats compatible with various reference manager tools)
Cdc7 activates replication checkpoint by phosphorylating the Chk1-binding domain of Claspin in human cells
eLife 8:e50796.
https://doi.org/10.7554/eLife.50796


