Cytomegalovirus protein m154 perturbs the adaptor protein-1 compartment mediating broad-spectrum immune evasion
- University of Rijeka, Croatia
- University of Barcelona, Spain
- Institut d'Investigacions Biomèdiques August Pi i Sunyer, Spain
- The Hebrew University, Israel
- Georg-August-Universität Göttingen, Germany
Figures
Figure 1 with 1 supplement

MCMV m154 gene product downregulates surface levels of CD155.
(A) Confocal images of DC2.4 and B12 mouse cell lines infected with 3 plaque forming units (PFU)/cell of wild-type (WT) MCMV for 20 hr or left uninfected. Cells were stained with an anti-mouse mPVR.01 monoclonal antibody (mAb) followed by anti-rat IgG F(ab')2-TRITC. (B) Confocal images of DC2.4 cells infected with Δm20.1 or control WT MCMV as described in (A) or left uninfected. CD155 was stained as described in (A) and endoplasmic reticulum marker calnexin was stained with anti-mouse calnexin followed by anti-rabbit IgG F(ab')2-FITC. For (A and B) scale bar equals 10 μm. (C) Flow cytometry analysis of surface CD155 expression on uninfected DC2.4 cells or infected as described in (A) with viral mutants lacking different gene regions or the control WT MCMV. Cells were stained with anti-mouse CD155-PE/Cy7 or isotype control. (D) Flow cytometry analysis of TIGIT-Fc and DNAM-1-Fc binding on DC2.4 cells infected with Δm154 or control WT MCMV as described in (A) or left uninfected. Cells were incubated with 2 µg/sample of TIGIT-Fc, DNAM-1-Fc or irrelevant Fc fusion protein, followed by anti-human IgG-FITC. Representative histograms are shown. ∆MFI (difference in median fluorescence intensity) is calculated as ‘sample MFI’- ‘isotype control MFI’ and expressed as a percentage of ∆MFI on uninfected cells. Data are representative of at least three independent experiments. Kruskal- Wallis test was used to asses statistical differences with *p<0.05 (p TIGIT-Fc = 0.0158; p DNAM-1-Fc = 0.1051).
Figure 1—figure supplement 1
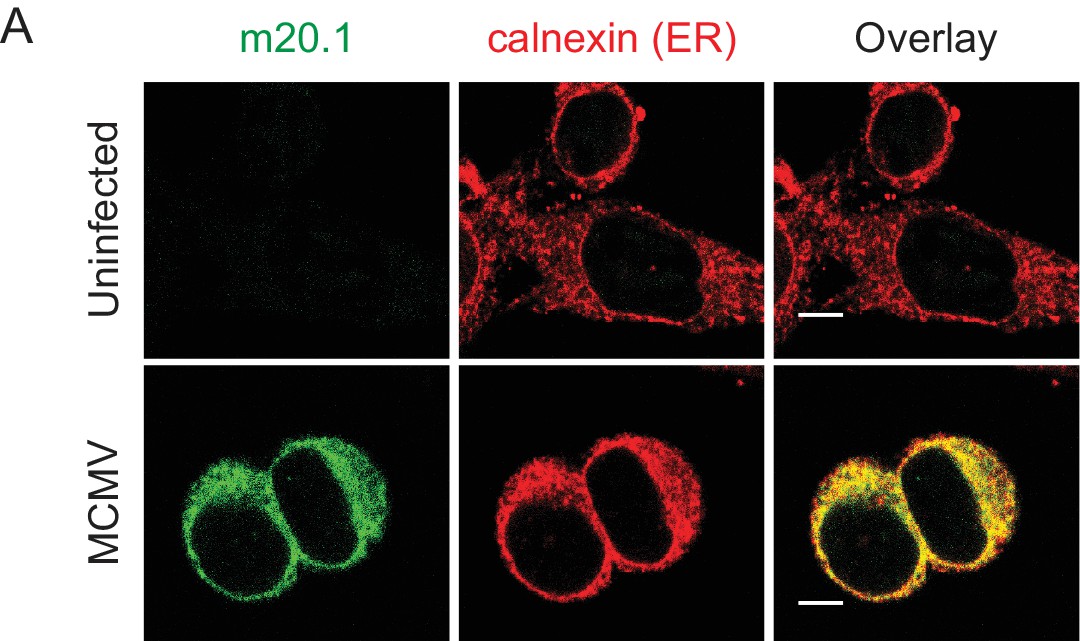
MCMV m20.1 protein resides in endoplasmic reticulum.
Confocal images of B12 mouse cell line infected with 3 PFU/cell of WT MCMV for 20 hr or left uninfected. Cells were stained with anti-m20.1 antibody followed by anti-rat IgG F(ab')2-FITC and with anti-mouse calnexin followed by anti-rabbit IgG F(ab')2-TRITC. Scale bar: 10 μm.
Figure 2 with 1 supplement
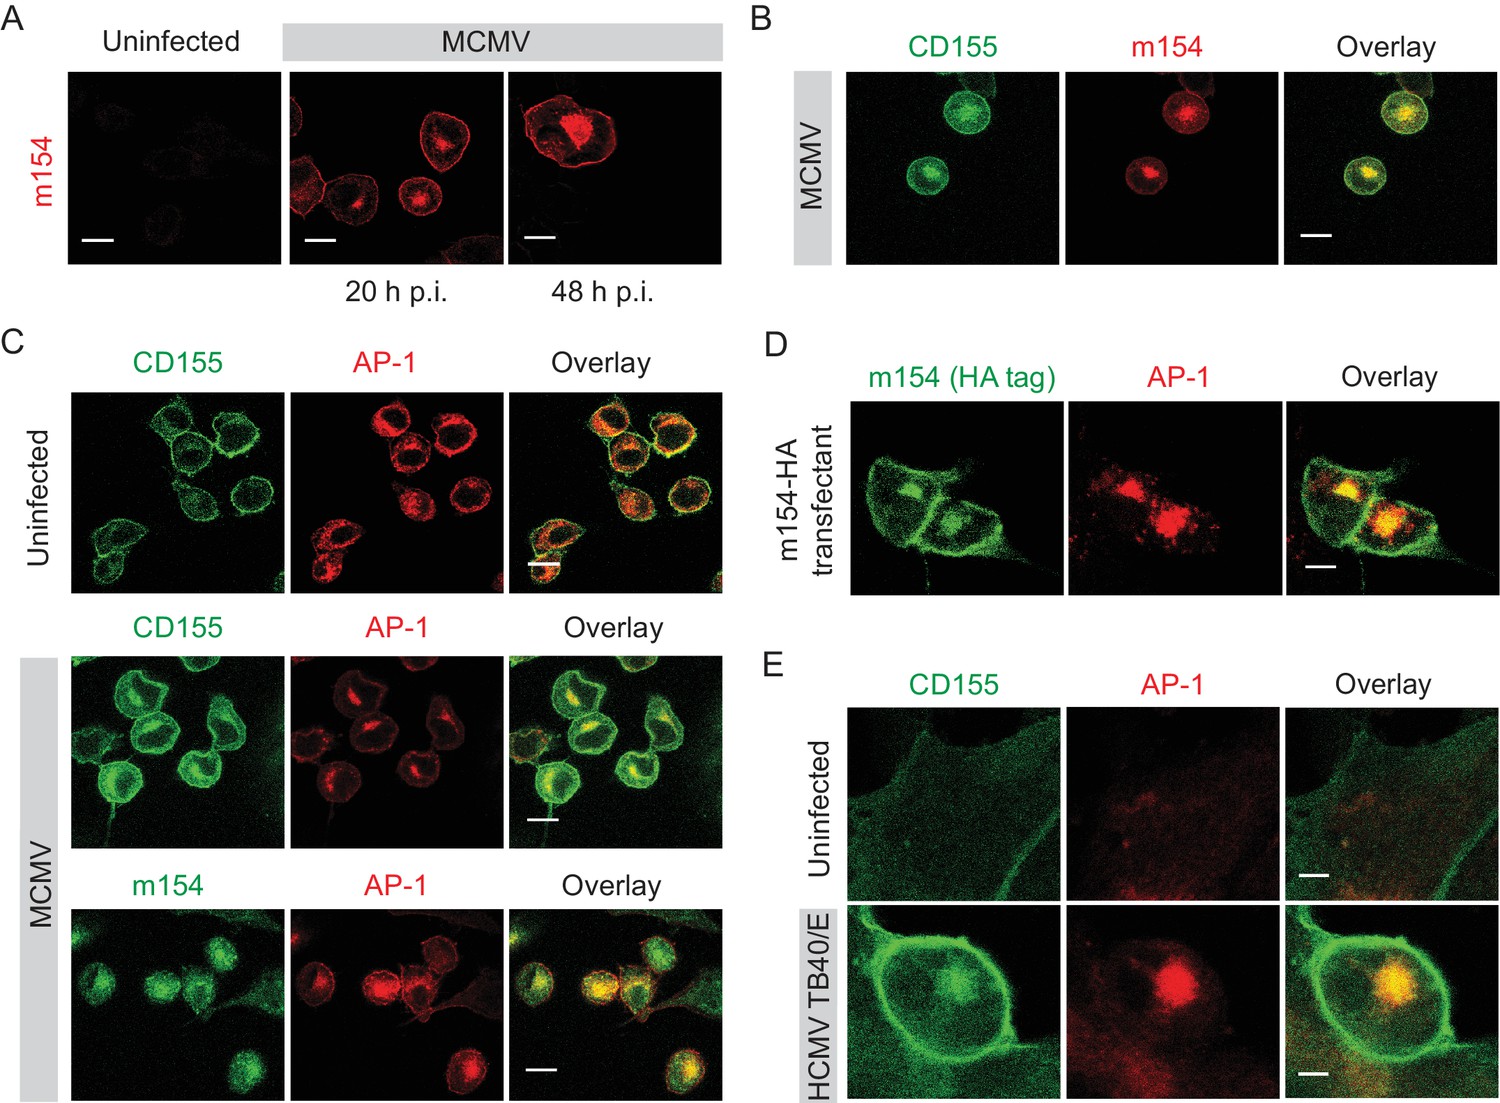
m154 protein and CD155 accumulate in the AP-1 compartment in CMV-infected cells.
(A) Confocal images of DC2.4 cells infected with 3 PFU/cell of WT MCMV. At indicated time points after infection, cells were processed for confocal microscopy and stained with anti-m154 followed by anti-mouse IgG F(ab')2-TRITC. (B and C) Confocal images of uninfected DC2.4 cells or infected as described in (A) and stained with anti-mouse mPVR.01 followed by anti-rat IgG F(ab')2-FITC, anti-m154 mAb followed by anti-rat IgG F(ab')2-TRITC or anti-mouse AP-1γ mAb followed by anti-rabbit F(ab')2-TRITC or FITC. (D) Confocal images of B12 m154-HA transfectants. Cells were stained with anti-HA followed by anti-rat F(ab')2- FITC, anti-mouse AP-1γ followed by anti-rabbit F(ab')2-TRITC. (E) Confocal images of human foreskin fibroblasts (HFF) infected with WT HCMV for 72 hr or left uninfected. Cells were stained with anti-human CD155 followed by anti-mouse F(ab')2-FITC, anti-human AP-1γ followed by anti-rabbit F(ab')2-TRITC. Data are representative of at least two independent experiments. Scale bar in (A, B, C and D) equals 10 μm, and in (E) 5 μm.
Figure 2—figure supplement 1
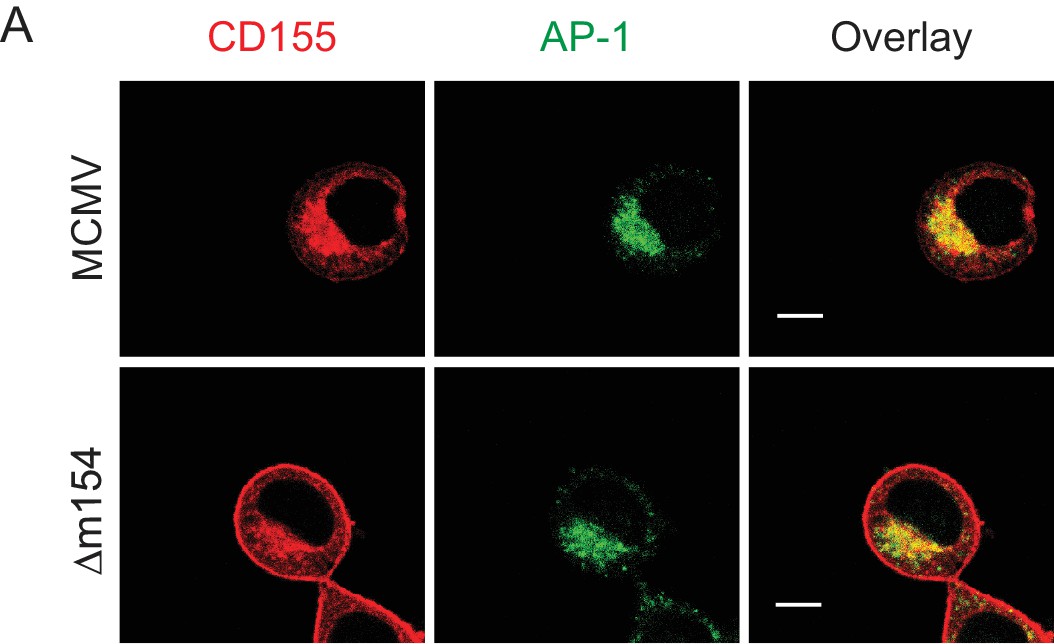
CD155 accumulates in AP-1 compartment in cells infected with the virus lacking m154.
Confocal images of DC2.4 cells infected with 3 PFU/cell of Δm154 or control WT MCMV for 20 hr. Cells were stained with anti-mouse mPVR.01 followed by anti-rat IgG F(ab')2-TRITC, and anti-mouse γ1-adaptin followed by anti-rabbit F(ab')2-FITC. Scale bar: 10 μm.
Figure 3
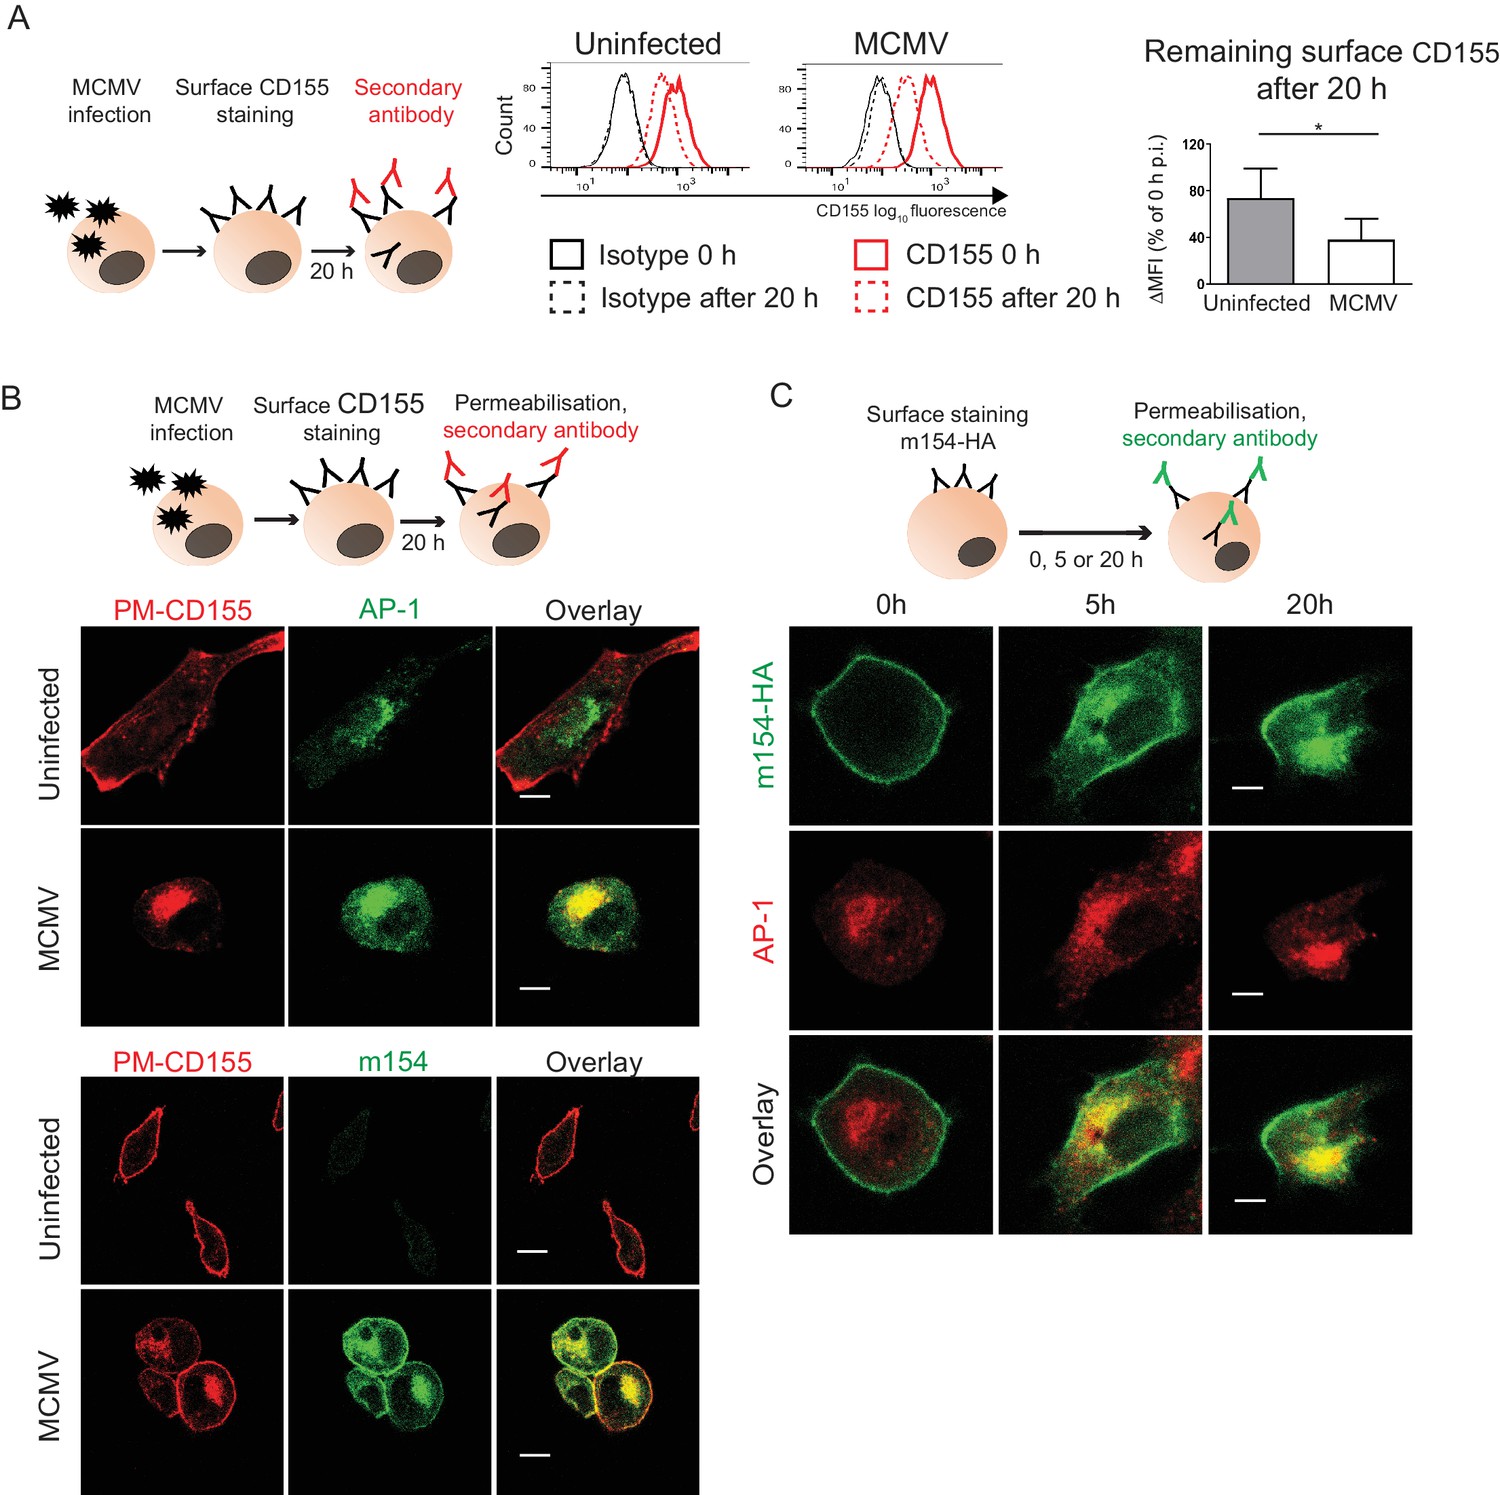
The accumulated CD155 in AP-1 compartment is derived from the plasma membrane.
(A) Model of surface CD155 staining and later detection. Plasma membrane CD155 (PM-CD155) was stained with anti-mouse mPVR.01 or isotype control on uninfected DC2.4 cells and on the cells that were just infected with 3 PFU/cell of Δm138 virus. After 20 h cells were stained with a secondary antibody anti-rat IgG F(ab')2-FITC and the remaining surface signal was detected by flow cytometry. ∆MFI (difference in median fluorescence intensity) is calculated as ‘sample MFI’- ‘isotype control MFI’ and expressed as a percentage of CD155 signal at 0 hr for the corresponding condition. Two-tailed t test was used to assess statistical differences with *p<0.05 (p=0.022, correlation coefficient = 0.95). (B) Confocal images of DC2.4 cells treated and stained as described in (A) and permeabilized 20 h p.i. In addition, cells were stained with anti-m154 followed by anti-mouse IgG F(ab')2-FITC and anti-mouse AP-1γ mAb followed by anti-rabbit F(ab')2-TRITC or FITC. Data are representative of at least three independent experiments. (C) Model of surface m154-HA staining and later detection. Plasma membrane m154-HA was stained on B12 transfectants with anti-HA mAb. At indicated time points cells were permeabilized and stained with secondary antibody anti-rat F(ab')2- FITC. In addition, cells were stained with anti-mouse AP-1γ mAb followed by anti-rabbit F(ab')2-TRITC. Data are representative of at least three independent experiments. Scale bar: 10 μm.
Figure 4
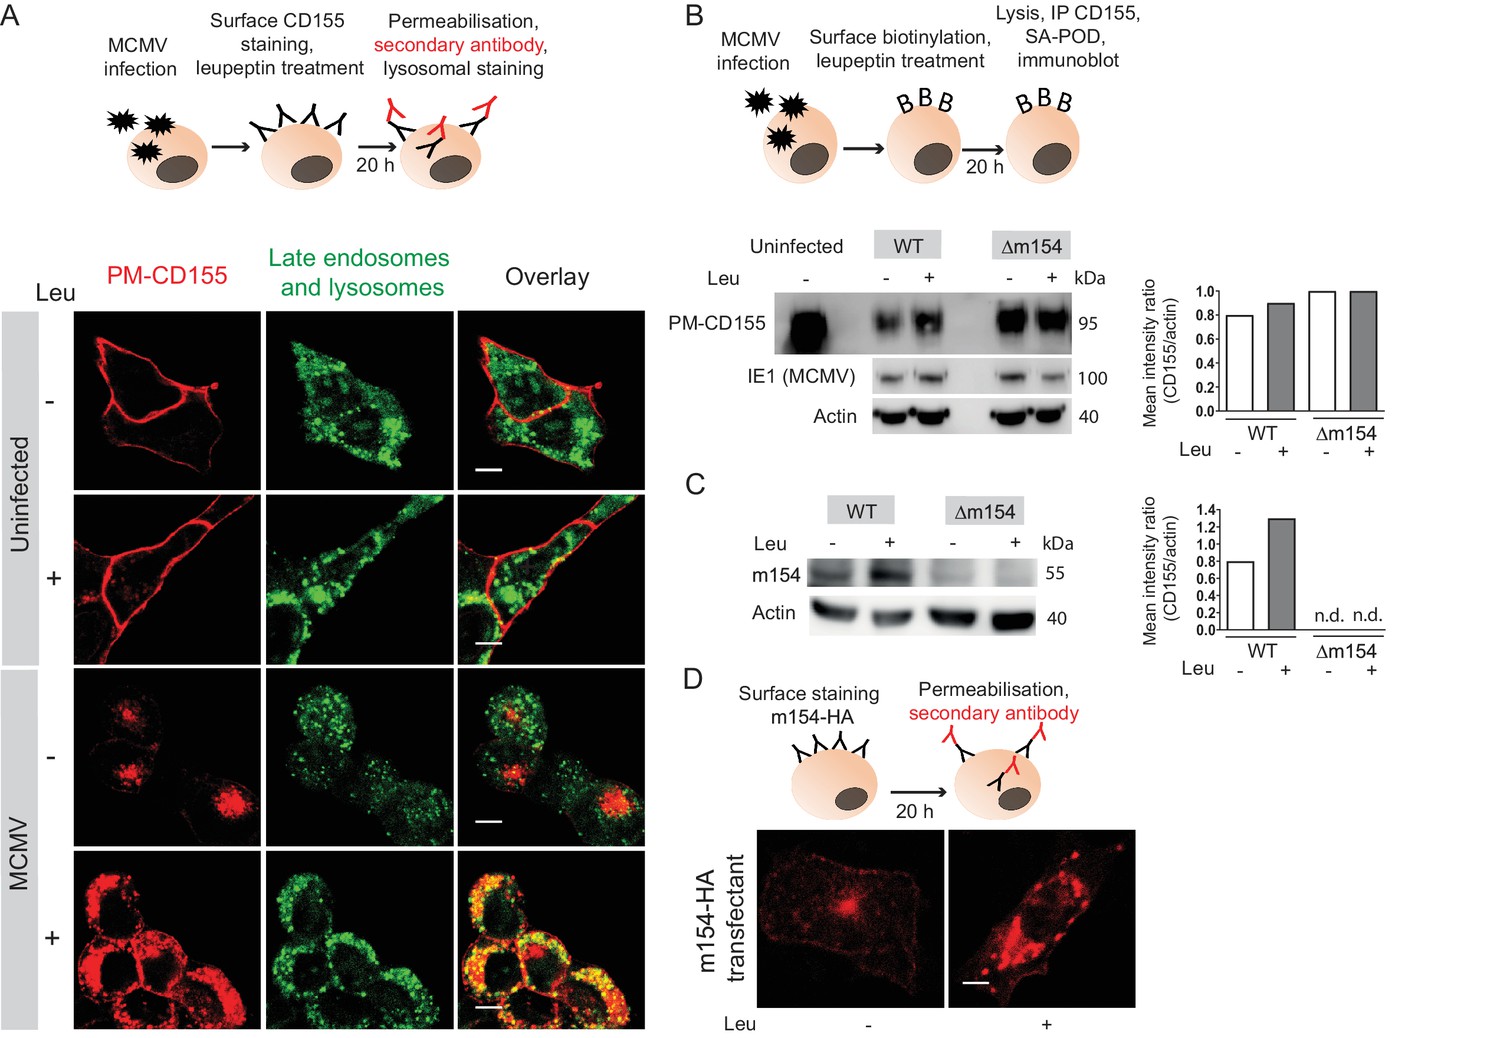
Plasma membrane CD155 is degraded in lysosomes following MCMV infection.
(A) DC2.4 cells were infected with Δm138 virus or left uninfected, and PM-CD155 was stained and tracked as described in Figure 3. Four h p.i. cells were treated with leupeptin at 75 µg/ml. 20 h p.i. live cells were stained with the acidic organelle probe DAMP (N-(3-[2,4-dinitrophenyl amino] propyl)-N-(3-aminopropyl)methylamine) for 30 min at 37°C and further processed for confocal microscopy. (B) Model of biotinylation of cell surface proteins. B12 cells were biotinylated, infected with 3 PFU/cell of WT MCMV or Δm154 virus or left uninfected. 4 h p.i. cells were treated with lysosomal inhibitor leupeptin and 20 h p.i. cells were lysed, immunoprecipitated with streptavidin and surface CD155 molecules were detected by western blot using mPVR.01 mAb followed by anti-rat IgG-HRP. As a loading control, anti-β-actin mAb was used followed by anti-mouse IgG-HRP, and as a control for infection, lysates were stained with an antibody directed against MCMV protein IE1 followed by anti-mouse IgG-HRP. (C) DC2.4 cells were infected with 3 PFU/cell of WT MCMV or Δm154 virus. 6 h p.i. as well as 24 h p.i. cells were treated with lysosomal inhibitor leupeptin and 42 h p.i. cells were lysed. m154 molecules were detected by western blot using anti-m154 mAb followed by anti-mouse IgG-HRP. For (B and C) Individual band intensity was calculated as mean gray value of CD155 or m154 band/mean gray value of the corresponding actin band. (D) The plasma membrane m154 was stained with anti-HA mAb on B12-m154-HA transfectant cells, either untreated or treated with leupeptin at 75 µg/ml. After 20 h cells were permeabilized and stained with a secondary antibody anti-rat IgG F(ab')2-FITC and further processed for confocal microscopy. Scale bar 10 μm.Data are representative of at least two independent experiments.
Figure 5 with 3 supplements
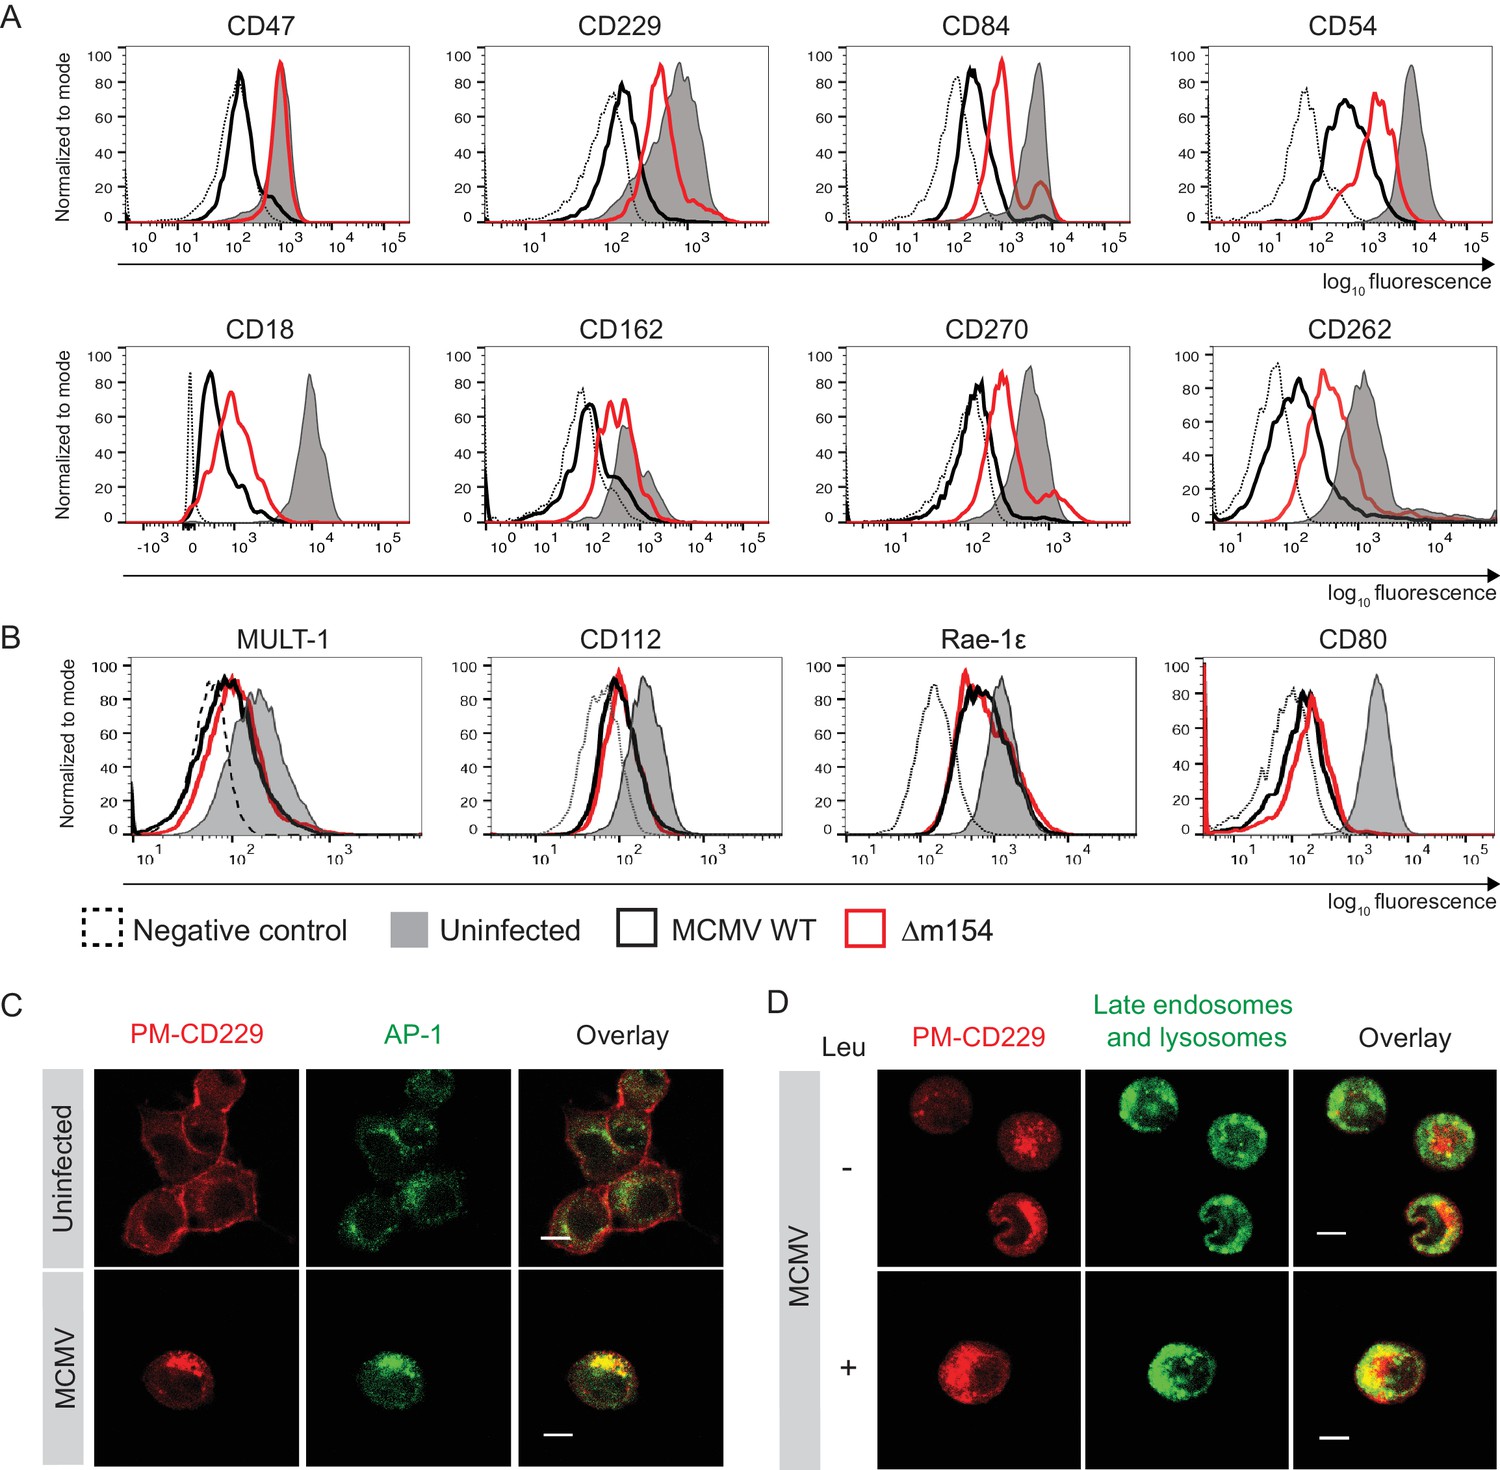
m154 redirects several immunologically relevant targets from the AP-1 compartment to lysosomes.
(A) Flow cytometry analysis of surface molecules of peritoneal macrophages (CD47, CD229, CD84, CD54, CD18, CD162, CD270) and DC2.4 cells (CD262) infected with 10 PFU/cell for 72 hr or 3 PFU/cell for 20 hr, respectively, or left uninfected. (B) Flow cytometry analysis of surface expression of MULT-1, CD112, and Rae-1ε on DC2.4 cells infected with 3 PFU/cell of Δm154 or control WT MCMV for 20 hr or left uninfected. For CD80 surface expression, peritoneal macrophages were infected with 10 PFU/cell for 72 hr or left uninfected. (C) Plasma membrane CD229 (PM-CD229) on DC2.4 cells was stained with anti-mouse CD229 or isotype control on uninfected DC2.4 cells and on the cells that were just infected with 3 PFU/cell of Δm138 virus. After 20 h cells were processed for confocal microscopy and stained with a secondary antibody anti-mouse IgG F(ab')2-TRITC, and anti-mouse AP-1γ mAb followed by anti-rabbit F(ab')2-FITC. (D) DC2.4 cells were infected and stained as described in (B) and 4 h p.i. treated with lysosomal inhibitor leupeptin as described previously. 20 h p.i. live cells were stained with lysosomal probe DAMP for 30 min at 37°C and further processed for confocal microscopy. Data are representative of 2 independent experiments. Scale bar: 10 μm.
Figure 5—figure supplement 1
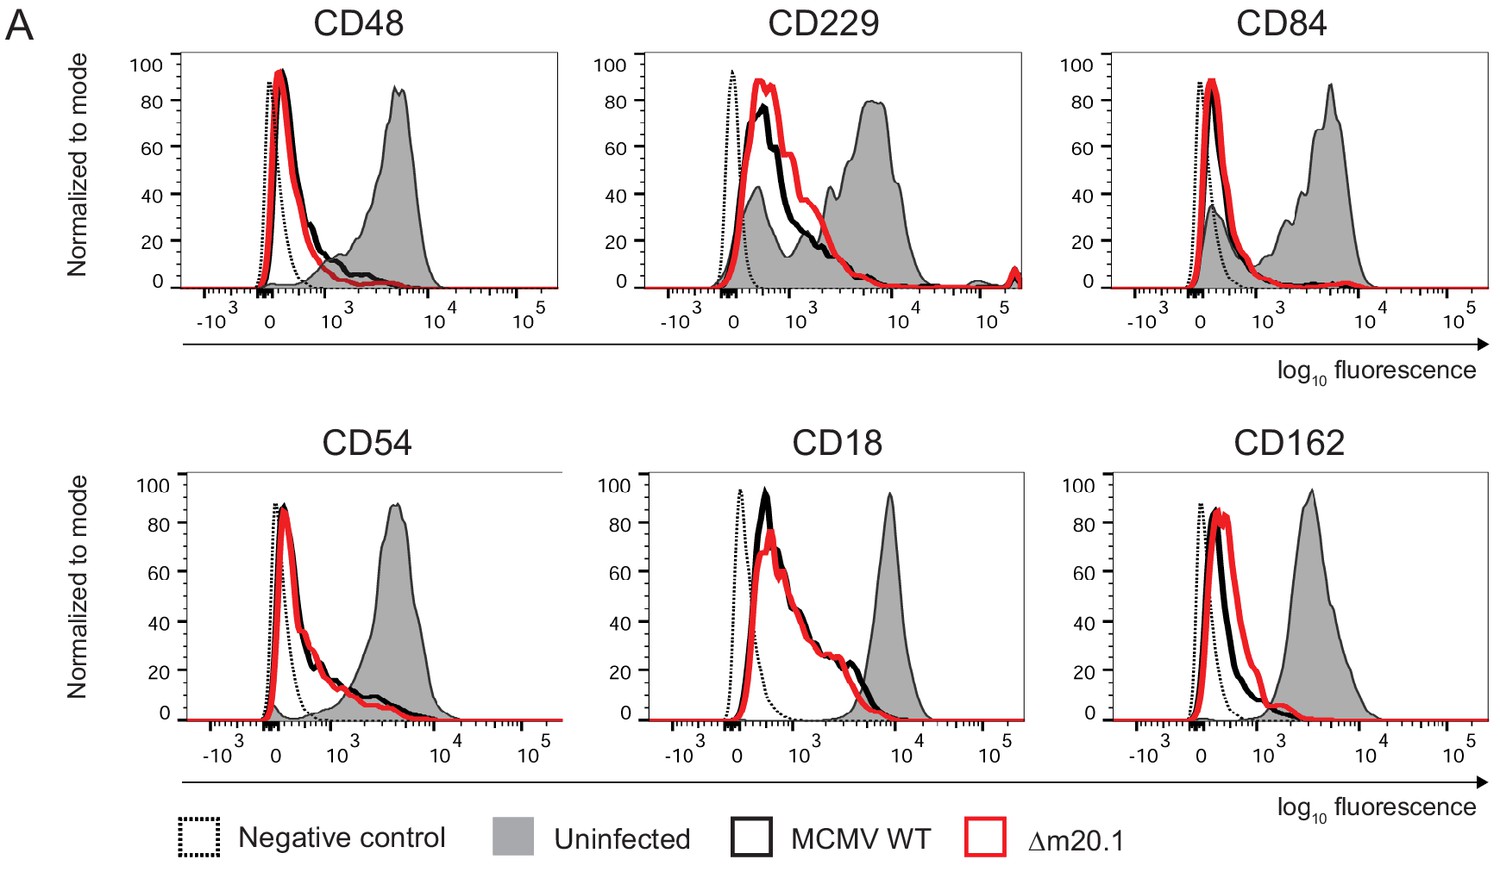
MCMV protein m20.1 is not involved in the regulation of surface molecules affected by m154.
Flow cytometry analysis of surface markers of peritoneal macrophages infected with 10 PFU/cell of Δm20.1 or control WT MCMV for 72 hr or left uninfected.
Figure 5—figure supplement 2
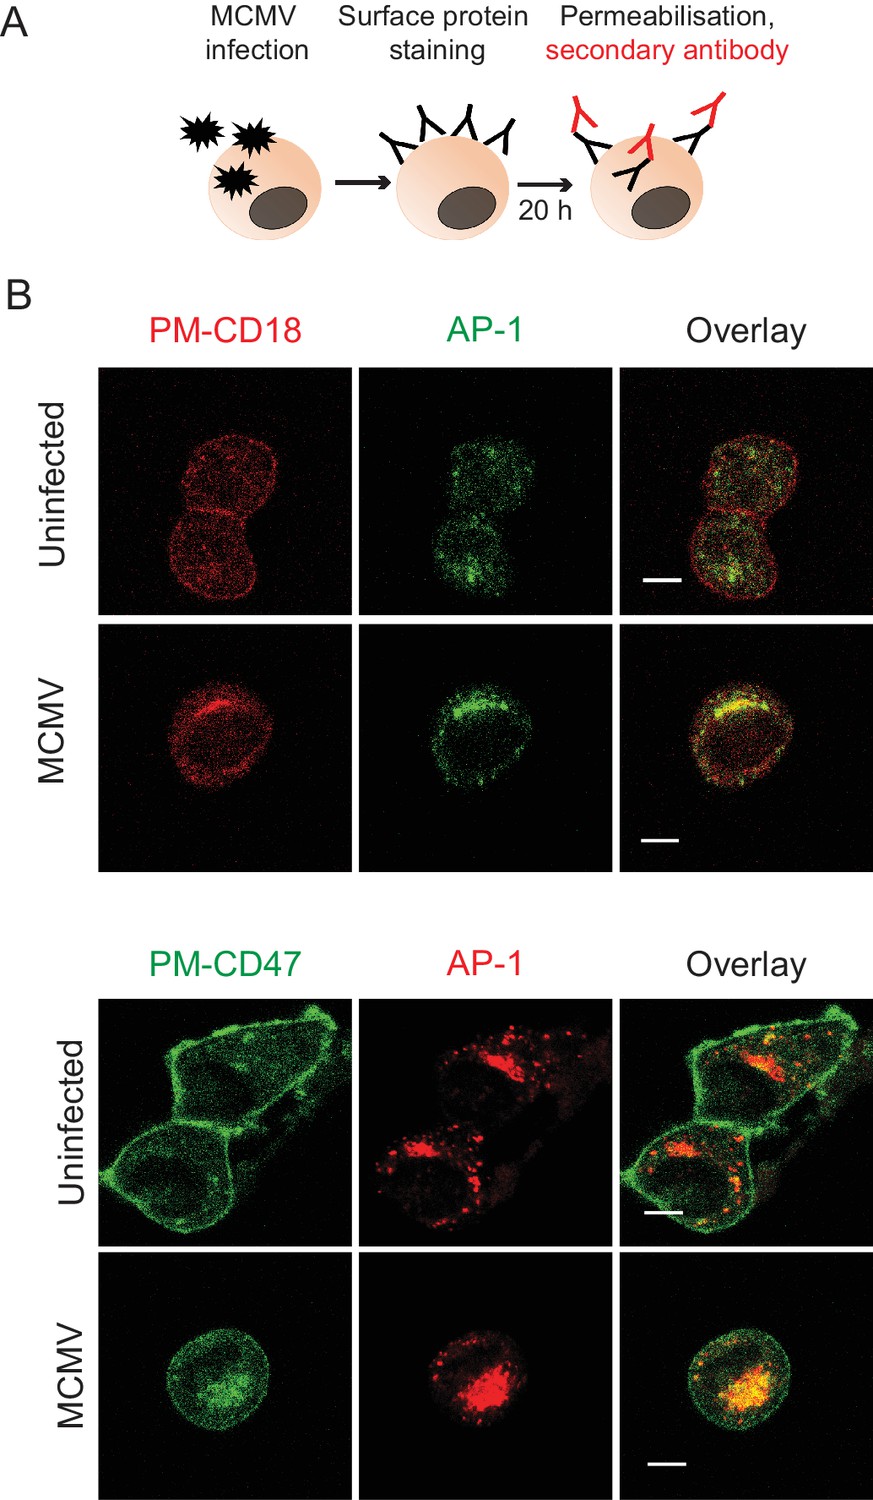
m154 targets CD18 and CD47 accumulate in the AP-1 compartment upon MCMV infection.
(A) Model of plasma membrane CD18 (PM-CD18) or CD47 (PM-CD47) staining and later detection. (B) DC2.4 cells were infected with 3 PFU/cell of WT MCMV or left uninfected. After 20 h cells were stained with anti-rat IgG F(ab')2-TRITC (for CD18) or FITC (for CD47), and anti-mouse γ1-adaptin followed by anti-rabbit F(ab')2-FITC or TRITC. Data are representative of at least two independent experiments. Scale bar: 10 μm.
Figure 5—figure supplement 3

Graphical model for the m154 mechanism of action.
(A) In WT MCMV-infected cells, AP-1-dependent TGN export of m154 target proteins is blocked by m154, leading to the accumulation of m154 targets in the TGN and their reduction on the plasma membrane. A fraction of m154 targets is transported to lysosomes and degraded. The m154 protein interferes with protein sorting, either by binding to the AP-1 complex, or by forming complexes with m154 targets. (B) m154 protein lacking DD motif is not able to localize to AP-1 compartment in infected cells. Thus, AP-1-dependent export of target proteins is not compromised and the m154 targets are successfully transported to the plasma membrane.
Figure 6 with 4 supplements
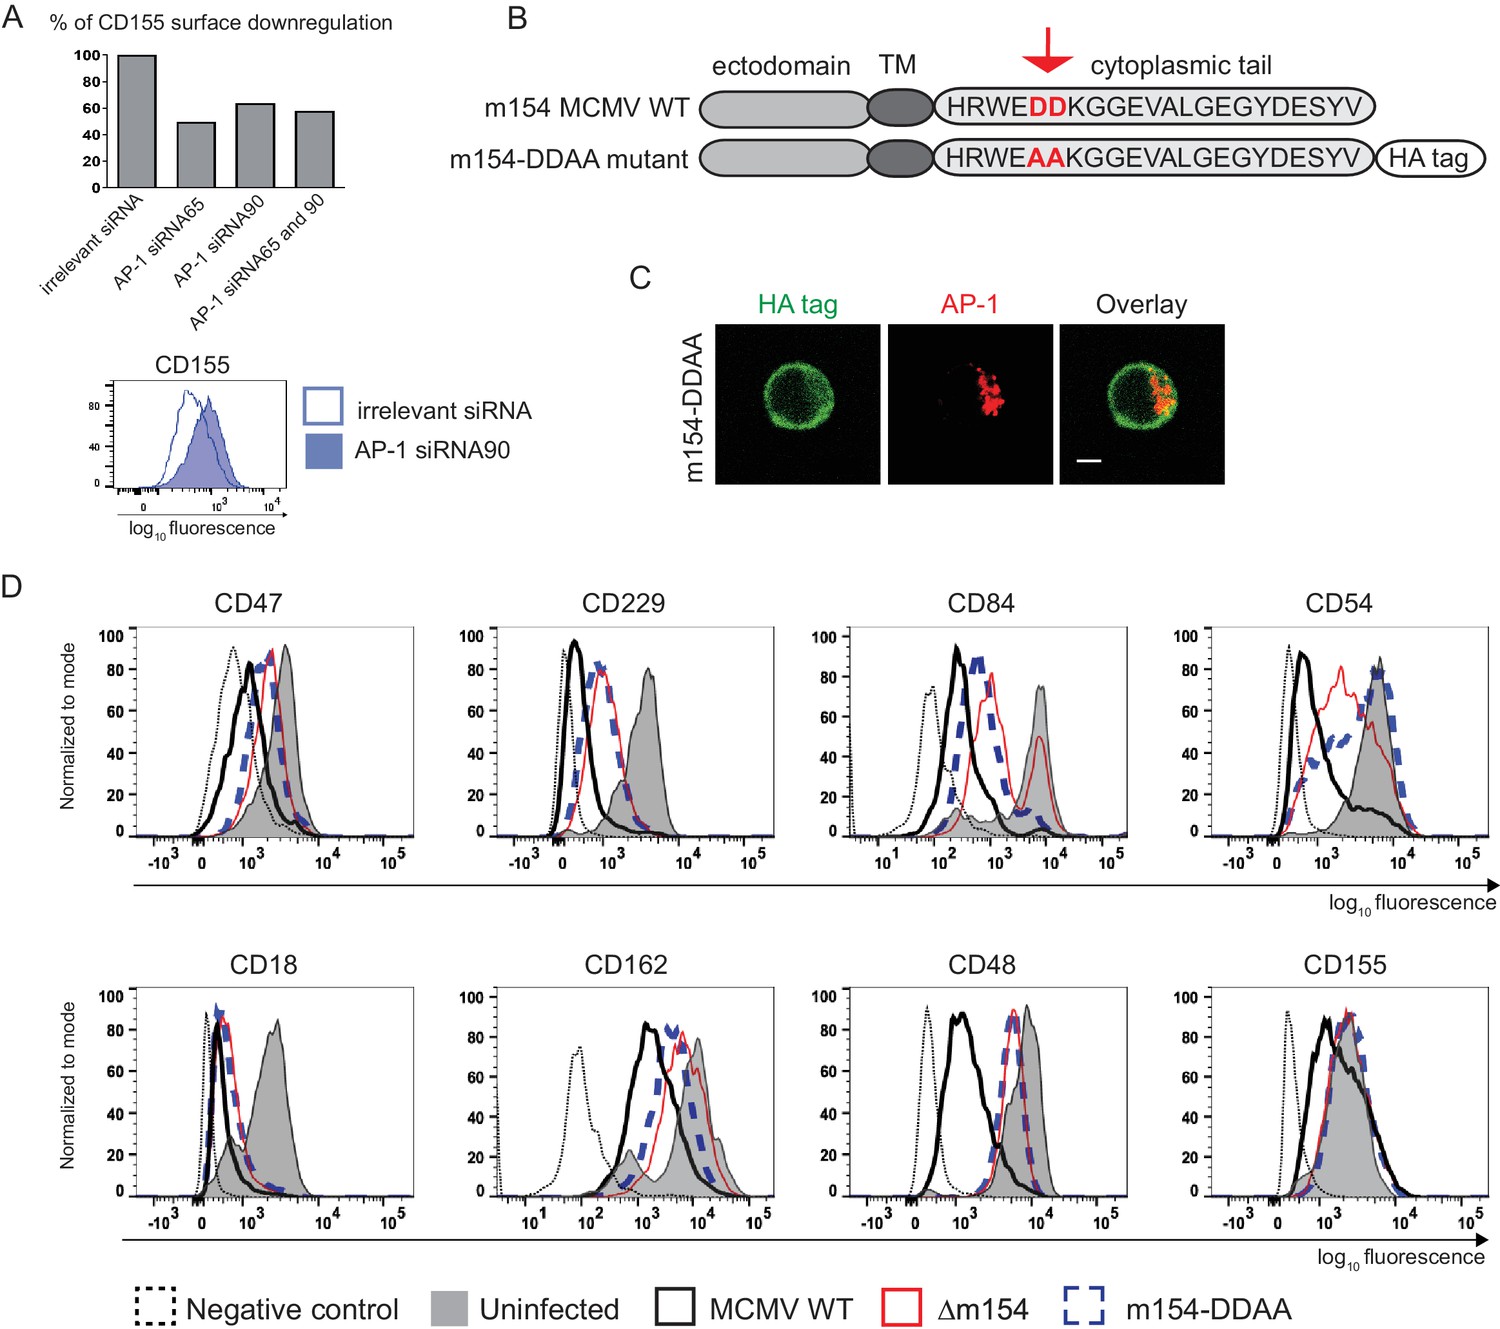
The DD motif in the cytoplasmic tail of m154 is necessary for its localization and function.
(A) Silencing of the AP-1MI gene was done by two independent siRNAs (named 65 and 90) or by their combination in B12 cell line. The surface level of CD155 on WT MCMV- infected AP-1 KD cells was analysed by flow cytometry. Relative % of CD155 downregulation (where irrelevant siRNA treatment represents 100% downregulation) and a representative histogram are shown. (B) Schematic representation (not drawn to scale) of m154 protein structure. Two aspartic acid residues in the cytoplasmic tail of WT m154 were substituted by two alanines (AA) (highlighted in red) to generate the MCMV recombinant virus m154-DDAA. TM = transmembrane domain. (C) Confocal images of DC2.4 cells infected with 3 PFU/cell m154-DDAA virus for 40 hr and stained with anti-HA followed by anti-rat F(ab')2-FITC, and anti-mouse AP-1γ followed by anti-rabbit F(ab')2-TRITC. Scale bar: 5 μm. (D) Flow cytometry analysis of surface molecules of peritoneal macrophages (CD47, CD229, CD84, CD54, CD18, CD162, CD48) and DC2.4 cells (CD155) infected with 10 PFU/cell for 72 hr or 3 PFU/cell for 20 hr, respectively. Data are representative of at least two independent experiments.
Figure 6—figure supplement 1

siRNA transfection controls.
Confocal images of B12 mouse cell line transfected with BLOCKIT ALEXA FLUOR RED OLIGO positive control of transfection (left) and short interfering RNAs (siRNAs) pre-designed by Thermofisher (right): Stealth siRNA MSS273190 (here referred siRNA90) used to silence adaptor-related protein complex AP-1, mu subunit one gene, and Stealth RNAI NEG CTL HI GC negative control siRNA. AP-1 compartment was visualized by staining with AP-1γ mAb followed by anti-rabbit F(ab')2-FITC. Data are representative of at least two independent experiments. Scale bar: 10 μm.
Figure 6—figure supplement 2
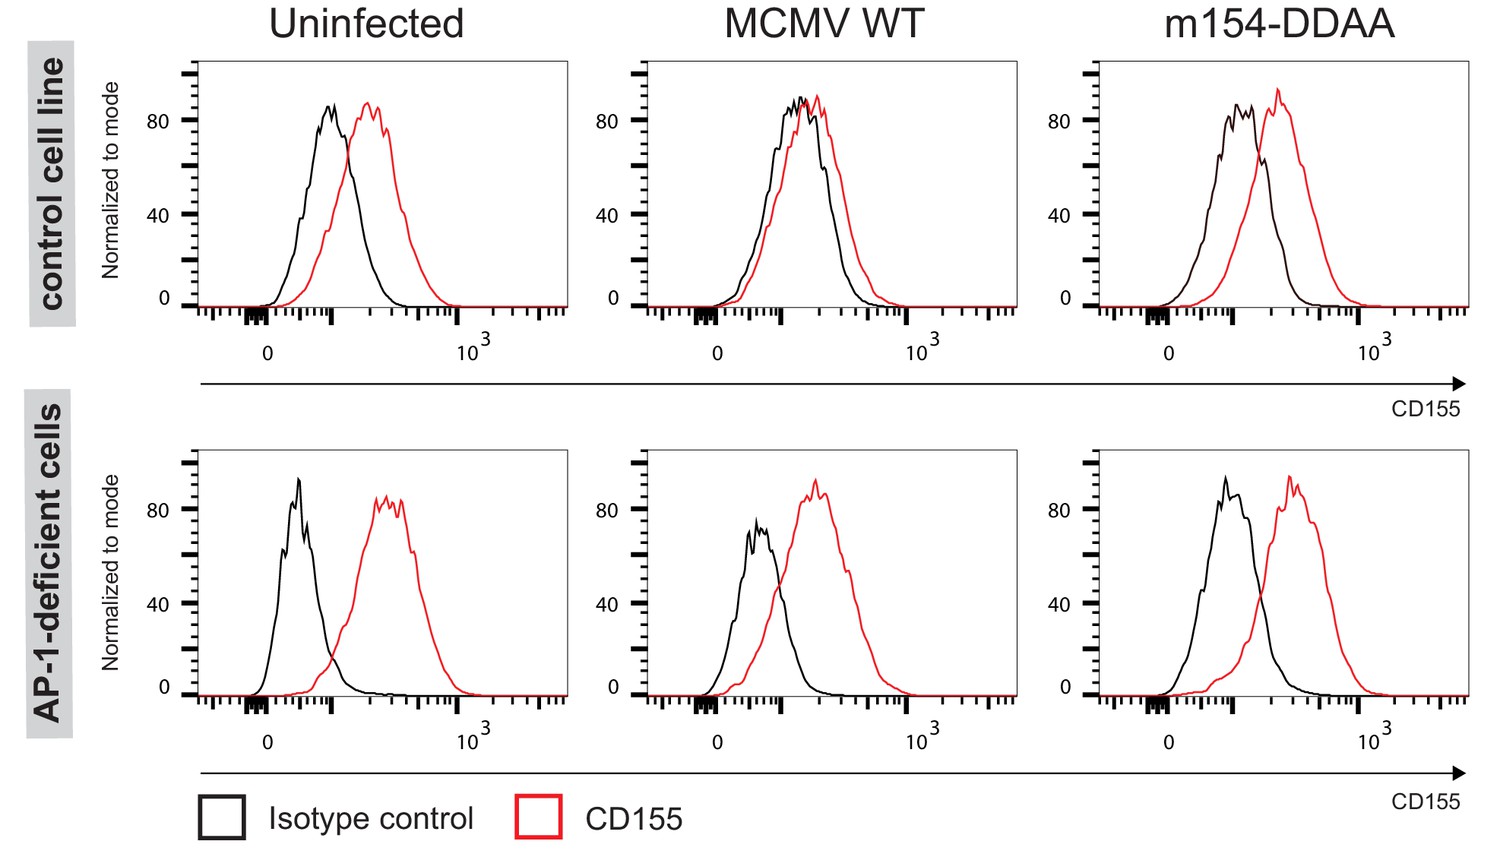
In absence of AP-1 complex, CD155 remains expressed on the membrane of MCMV-infected cells.
Flow cytometry analysis of surface CD155 on immortalized mouse embryonic cell lines: AP1µ1A-deficient cell line (AP-1 KO) and the rescued cell line which served as the control cell line, both infected with 3 PFU/cell for 40 h.
Figure 6—figure supplement 3
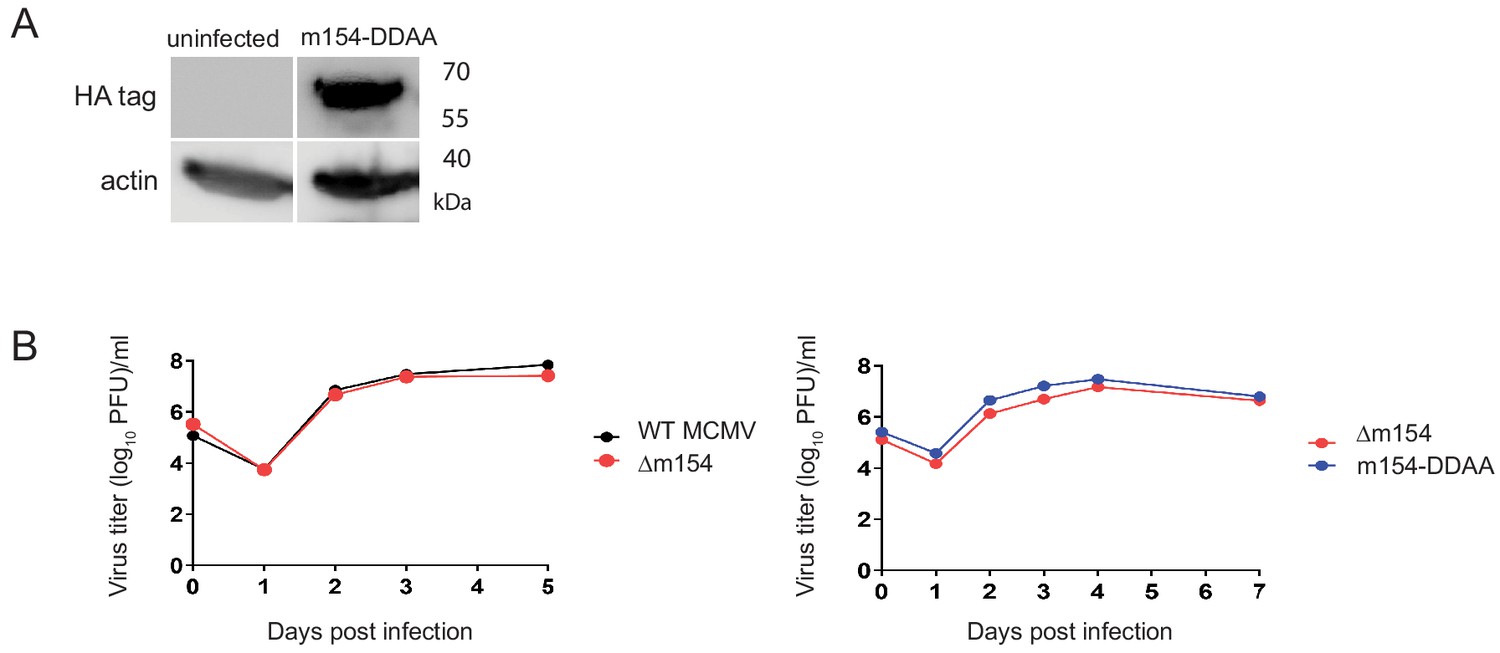
Characterization of mutated m154 expression and growth kinetics of m154-DDAA viral mutant.
(A) DC2.4 cells were infected with 3 PFU/cell of m154-DDAA virus for 40 h or left uninfected. HA tag was detected in cell lysates by western blot using an anti-HA Ab followed by anti-rat POD antibody. (B) MEFs were infected with 0.1 PFU/cell with WT MCMV, ∆m154, or m154-DDAA virus. At indicated days p.i. the amount of extracellular infectious virus present in the culture supernatant was determined by standard plaque assay. Each data point represents the average of three separate cultures.
Figure 6—figure supplement 4

Surface expression of CD54 and CD155 is downregulated in infection with MCMV WT m154-HA.
Two residues of aspartic acid in the cytoplasmic tail of WT m154 were substituted with two alanines (AA) to create the MCMV recombinant m154-DDAA virus, with the HA tag added to the end of the m154 protein. In the case of the WT m154-HA virus, the gene for the m154 protein is not mutated, only the HA tag is added to the end of the gene. (A) Western blot detection of m154-HA. (B) Flow cytometry analysis of surface molecules of DC2.4 cells (CD54) and B12 cells (CD155) infected with 3 PFU/cell for 40 h. Data are representative of 2 independent experiments.
Figure 7 with 1 supplement
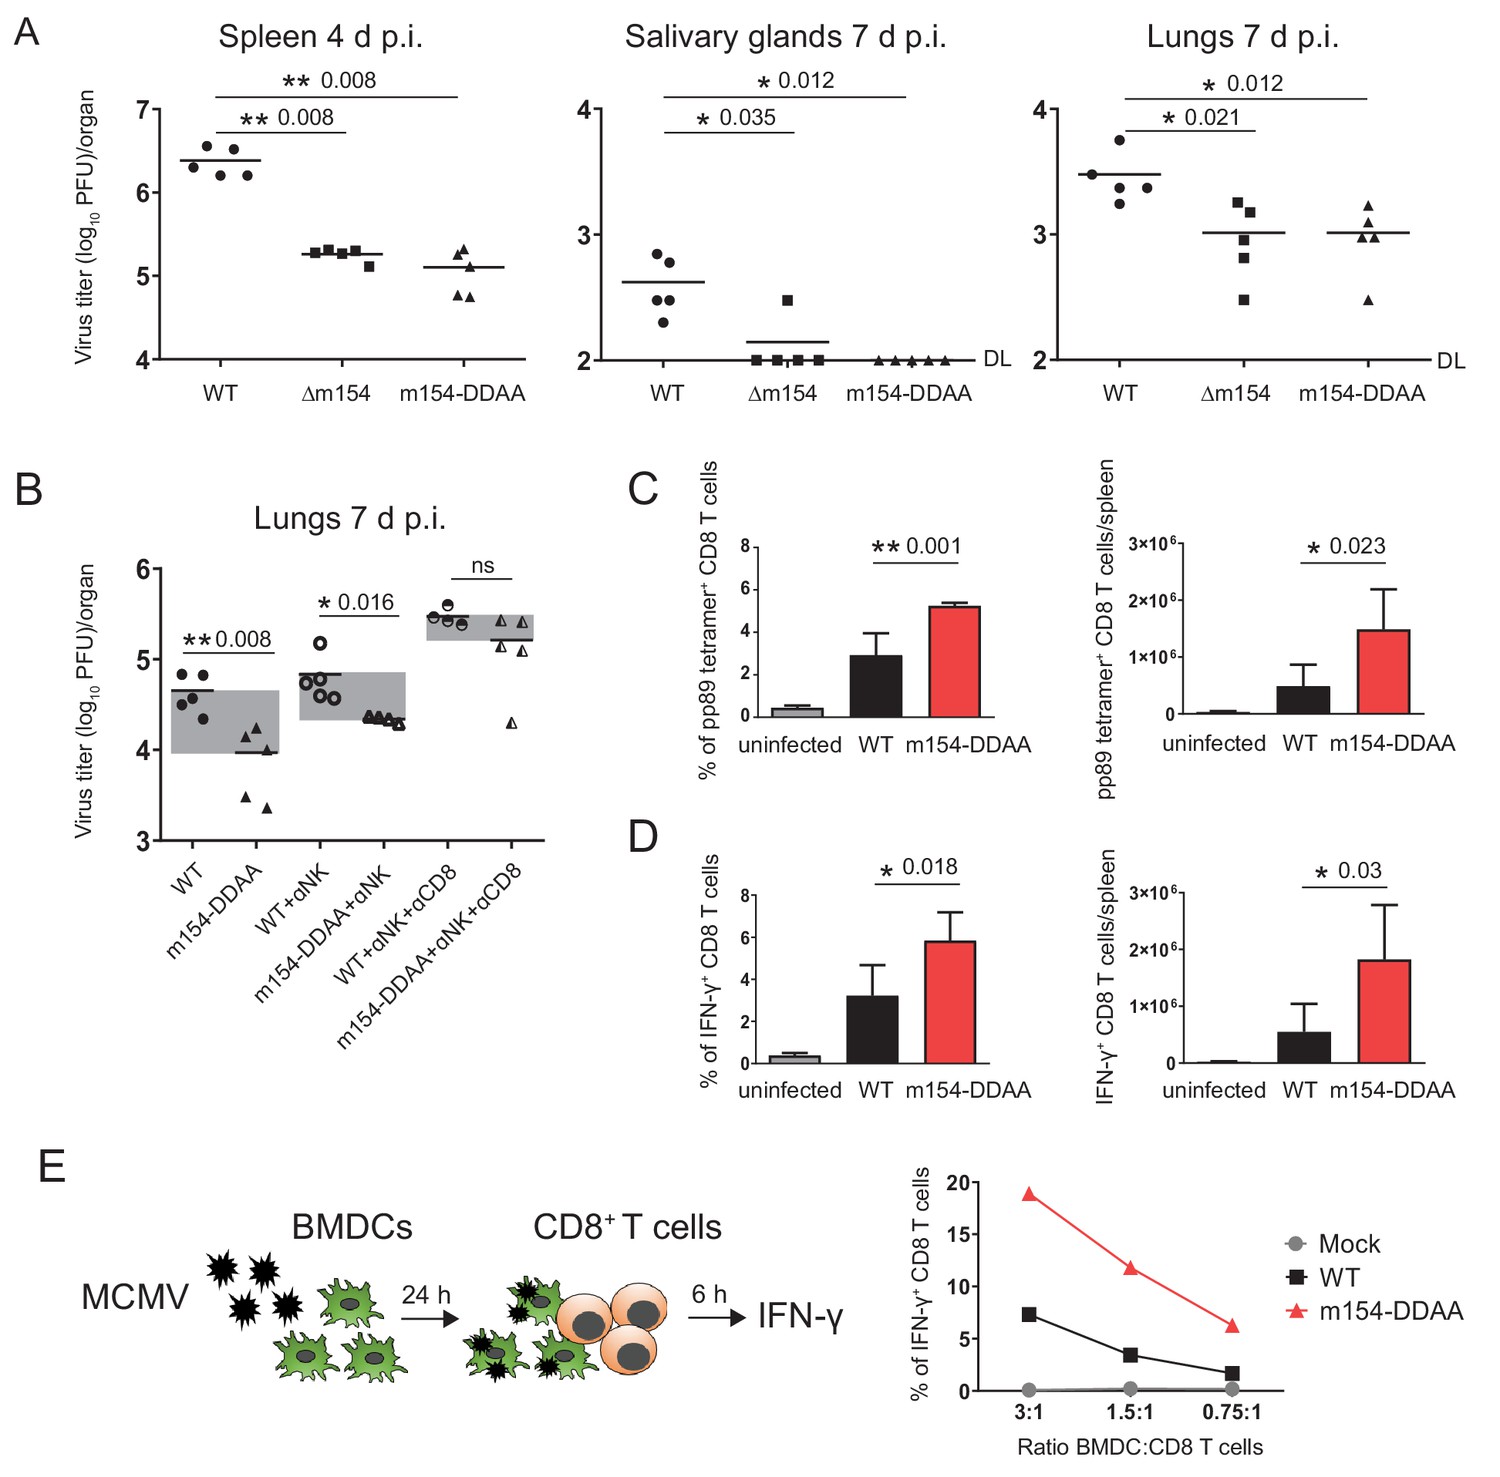
m154 suppresses CD8+ T cell response in vivo.
(A) BALB/c mice were intravenously (i.v.) injected with 2 × 10⁵ PFU/mouse of Δm154 MCMV, m154DDAA or WT MCMV as a control. At indicated time points viral titers in organs of individual mice (circles, squares, triangles) were determined by standard plaque assay. Horizontal bars indicate the median values. DL, detection limit. (B) BALB/c mice w/o NK and CD8+ cell depletion were infected as described in (A) and viral titers in lungs were determined 7 d.p.i. by standard plaque assay. For each group of mice in (A and B) n = 5. Two-tailed Mann–Whitney test was used to assess statistical differences between experimental groups. (C and D) Flow cytometry analysis of the percentages and absolute numbers of virus-specific (pp89 tetramer+) and IFN-γ+ splenic CD8+ T cells in mice infected as described in A) and sacrificed 7 d p.i. Two-tailed unpaired t test was used to assess statistical differences between experimental groups. (E) Schematic representation of in vitro antigen-presenting assay. BMDCs were infected with 3 PFU/cell of m154-DDAA mutant or WT MCMV for 24 hr or left uninfected and further co-cultured with naive CD8+ T cells from Maxi mice. After 6 hr, IFN-γ production by CD8+ T cells was determined by flow cytometry. Results are representative of at least two independent experiments. *p<0.05, **p<0.01, ns = not significant. The exact p values are indicated in the figure.
Figure 7—figure supplement 1
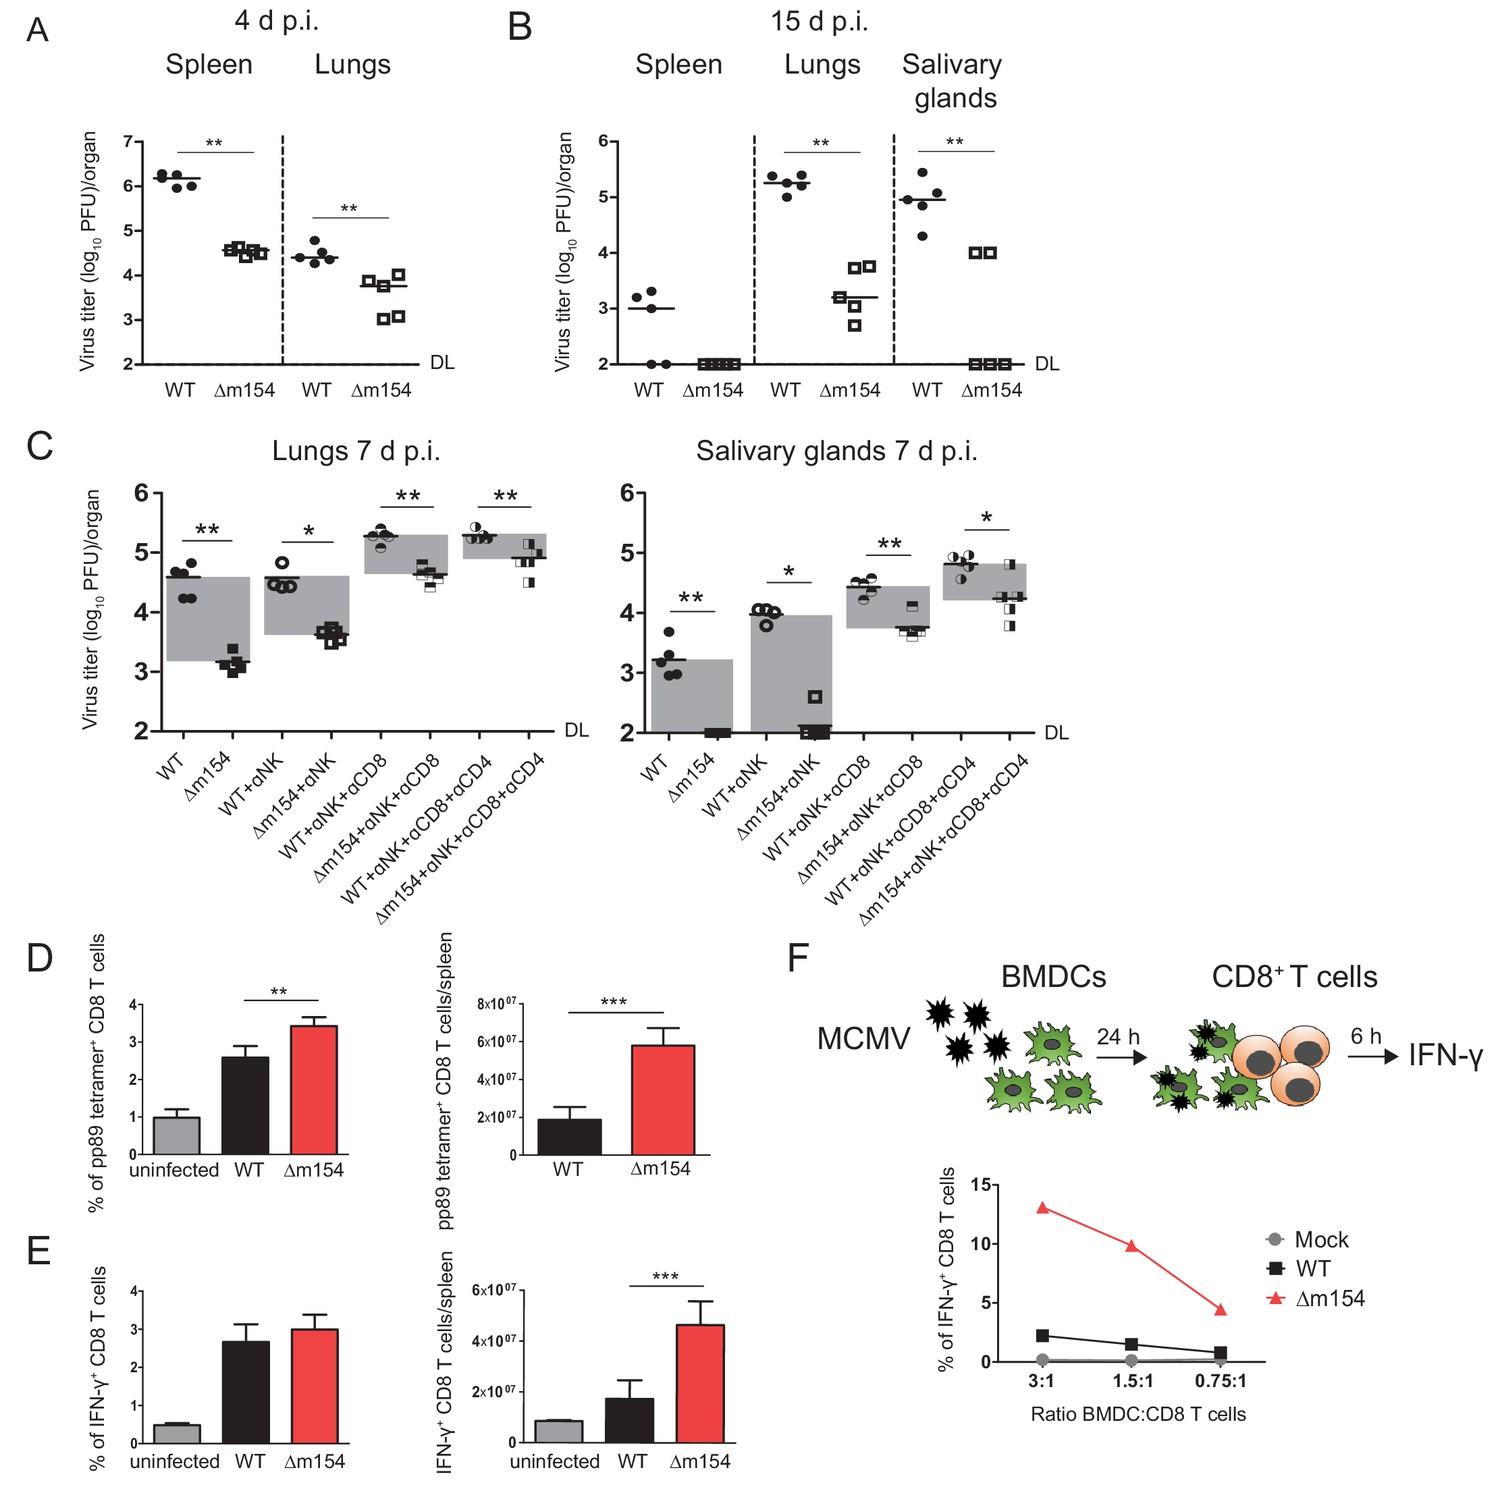
Δm154 exhibits attenuated phenotype in vivo and induces better CD8+ T cell response.
(A and B) BALB/c mice were i.v. infected with 2 × 10⁵ PFU/mouse of Δm154 or WT MCMV as a control. At indicated time points viral titers in organs of individual mice (circles, squares) were determined by standard plaque assay. Horizontal bars indicate the median values. (C) BALB/c mice w/o NK, CD8+, or CD4+ cell depletion were infected as described in A) and viral titers in lungs and salivary glands were determined 7 d.p.i. by standard plaque assay. DL, detection limit. Two-tailed Mann–Whitney test was used to assess statistical differences between experimental groups. For each group of mice in (A, B and C) n = 5. (D and E) Flow cytometry analysis of the percentages and absolute numbers of virus-specific (pp89 tetramer+) and IFN-γ+ splenic CD8+ T cells in mice infected as described in (A) and sacrificed 7 d p.i. Two-tailed unpaired t test was used to assess statistical differences between experimental groups. (F) Schematic representation of in vitro antigen-presenting assay. BMDCs were infected with 3 PFU/cell of Δm154 or WT MCMV for 24 h or left uninfected and further co-cultured with naive CD8+ T cells from Maxi mice. After 6 h, IFN-γ production by CD8+ T cells was determined by flow cytometry. Results are representative of at least two independent experiments. *p<0.05, **p<0.01, ***p<0.001.
Author response image 1
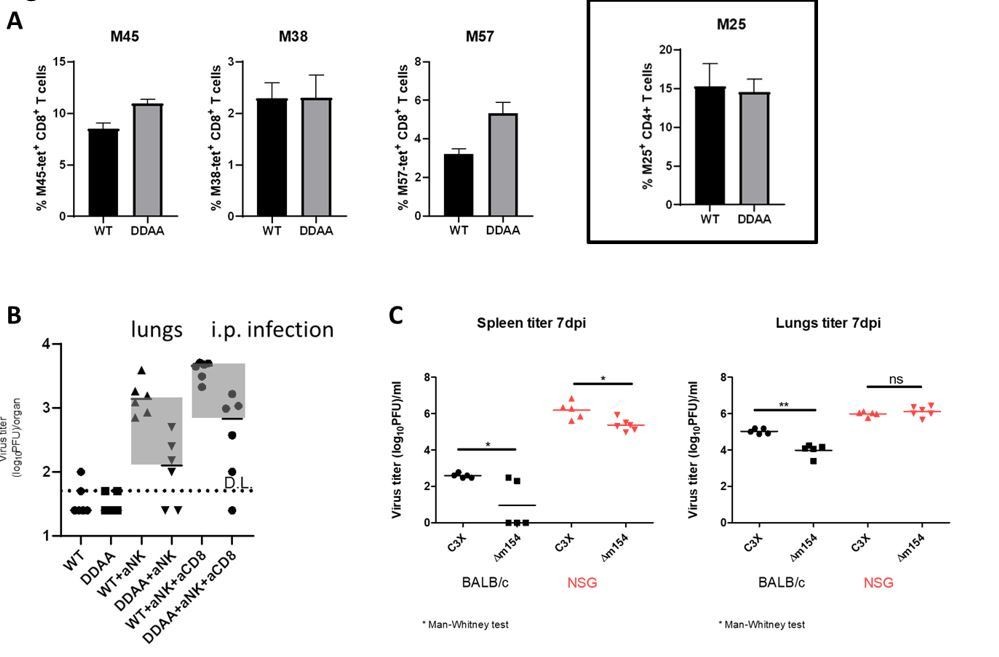
Effect of m154 distruption on immune control mediated by other immune cell populations.
(A) 105 of M25-II TCR-transgenic CD4+ T cells (CD45.1+) were adoptively transferred into Ly49H-/- C57BL/6 mice (CD45.2+). One day following adoptive transfer mice were i.v. infected with 2x10⁵ PFU of WT MCMV or m154-DDAA mutant. 7 days after infection the frequency of virus-specific splenic CD8+ T cells was determined by tetramer staining (left panels; M45, M38 and M57) and flow cytometry. The frequency of M25-II positive cells was determined by analysis of CD45.1 expression (right panel). (B) C57BL/6 mice were infected with 2x10⁵ PFU of WT MCMV or m154-DDAA mutant. NK and CD8+ T cells were depleted where indicated by the use of monoclonal antibodies. On day 7 p.i. viral titers in lungs of individual mice (circles, squares) were determined by standard plaque assay. (C) Balb/c and NSG mice were infected with 2x10⁵ PFU of WT MCMV or Δm154 mutant. On day 7 p.i. viral titers were determined as described in B. Horizontal bars indicate the median values. DL, detection limit. Two-tailed Mann-Whitney test was used to assess statistical differences between experimental groups. For each group of mice in B) n=6 and in C) n=5.
Additional files
-
Supplementary file 1
Key Resources Table.
- https://cdn.elifesciences.org/articles/50803/elife-50803-supp1-v1.docx
-
Transparent reporting form
- https://cdn.elifesciences.org/articles/50803/elife-50803-transrepform-v1.pdf
Download links
A two-part list of links to download the article, or parts of the article, in various formats.
Downloads (link to download the article as PDF)
Open citations (links to open the citations from this article in various online reference manager services)
Cite this article (links to download the citations from this article in formats compatible with various reference manager tools)
Cytomegalovirus protein m154 perturbs the adaptor protein-1 compartment mediating broad-spectrum immune evasion
eLife 9:e50803.
https://doi.org/10.7554/eLife.50803


