A widely distributed metalloenzyme class enables gut microbial metabolism of host- and diet-derived catechols
- Harvard University, United States
- University of California, Irvine, United States
- University of California, San Francisco, United States
- Chan Zuckerberg Biohub, United States
Figures
Figure 1 with 2 supplements
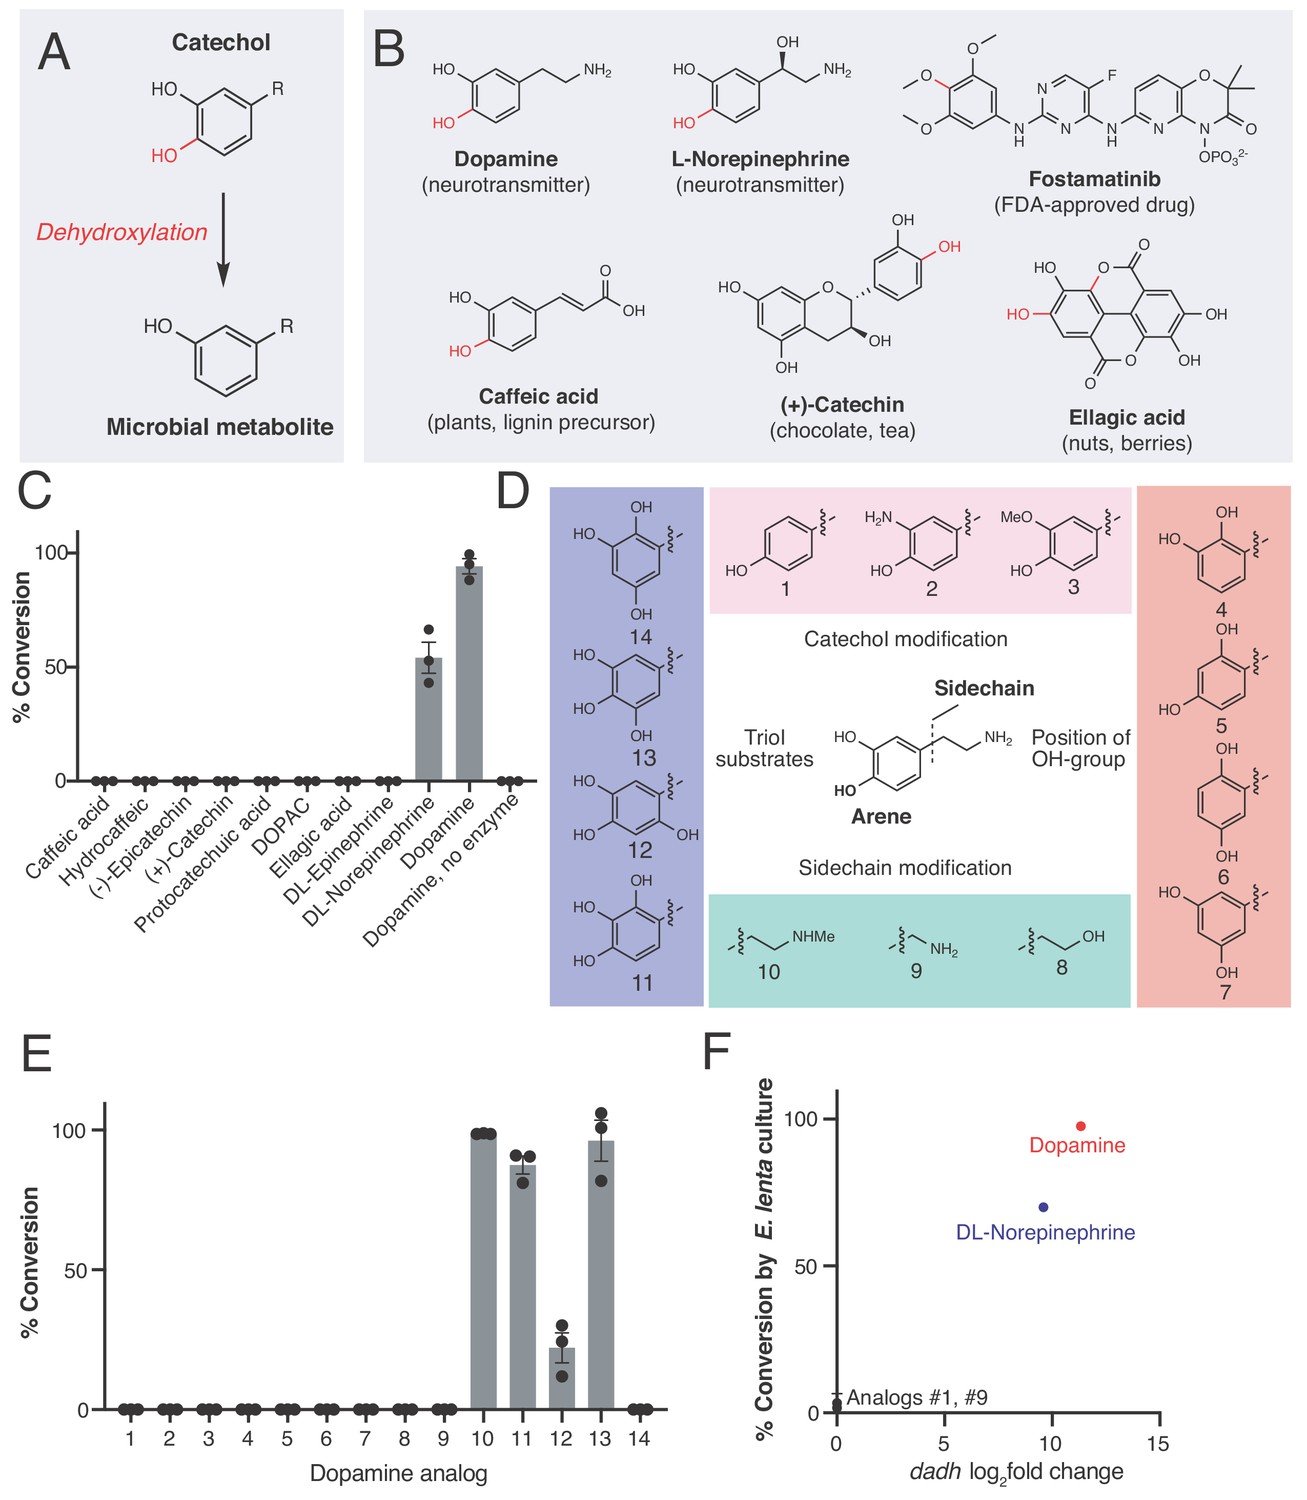
An enzyme from the prevalent human gut Actinobacterium Eggerthella lenta specifically metabolizes catecholamines that are available in the gut.
(A) The catechol structural motif is dehydroxylated by the gut microbiota. (B) Examples of catechols known to be dehydroxylated by gut microbes. Red indicates the carbon-oxygen bond that is broken or the hydroxyl group that is removed in the dehydroxylation reaction. (C) Activity of natively purified Dadh towards a panel of physiologically relevant catechol substrates. Enzyme (0.1 µM) was incubated with substrate (500 µM) for 22 hr at room temperature, followed by analysis using LC-MS. Bars represent the mean ±the standard error (SEM) of three biological replicates (enzyme reactions). This experiment was repeated three times. See Supplementary file 1a for the full chemical structures. (D) Dopamine analogs evaluated in this study. (E) Activity of natively purified Dadh towards dopamine analogs in C). Enzyme (0.1 µM) was incubated with substrate (500 µM) for 22 hr at room temperature, followed by analysis using LC-MS. Bars represent the mean ±the SEM of three biological replicates (enzyme reactions). See Supplementary file 1b for the full chemical structures. This experiment was performed three times. (F) Transcriptional induction and whole-cell dehydroxylation activity of E. lenta A2 in response to dopamine and a subset of dopamine analogs (500 µM each). Transcriptional induction was assessed using RNA-seq, with the fold induction shown on the x-axis (foldchange >2, FDR < 0.01). To assess whole-cell metabolism, E. lenta was grown anaerobically for 48 hr in BHI medium with 500 µM of each substrate, and the culture supernatant was analyzed for dehydroxylated metabolites using LC-MS. RNA-sequencing data represent the log2fold change from n = 3 independent cultures for each condition (compound/vehicle). The metabolism data represent the mean ±the SEM of three biological replicates (independent bacterial cultures). The culturing and analysis of metabolism was performed twice, while RNA-sequencing was done once. All raw data from Figure 1 can be found in Figure 1—source data 1.
-
Figure 1—source data 1
Data from Dadh enzyme reactions and from studies of dadh regulation (Figure 1).
- https://cdn.elifesciences.org/articles/50845/elife-50845-fig1-data1-v1.xlsx
Figure 1—figure supplement 1
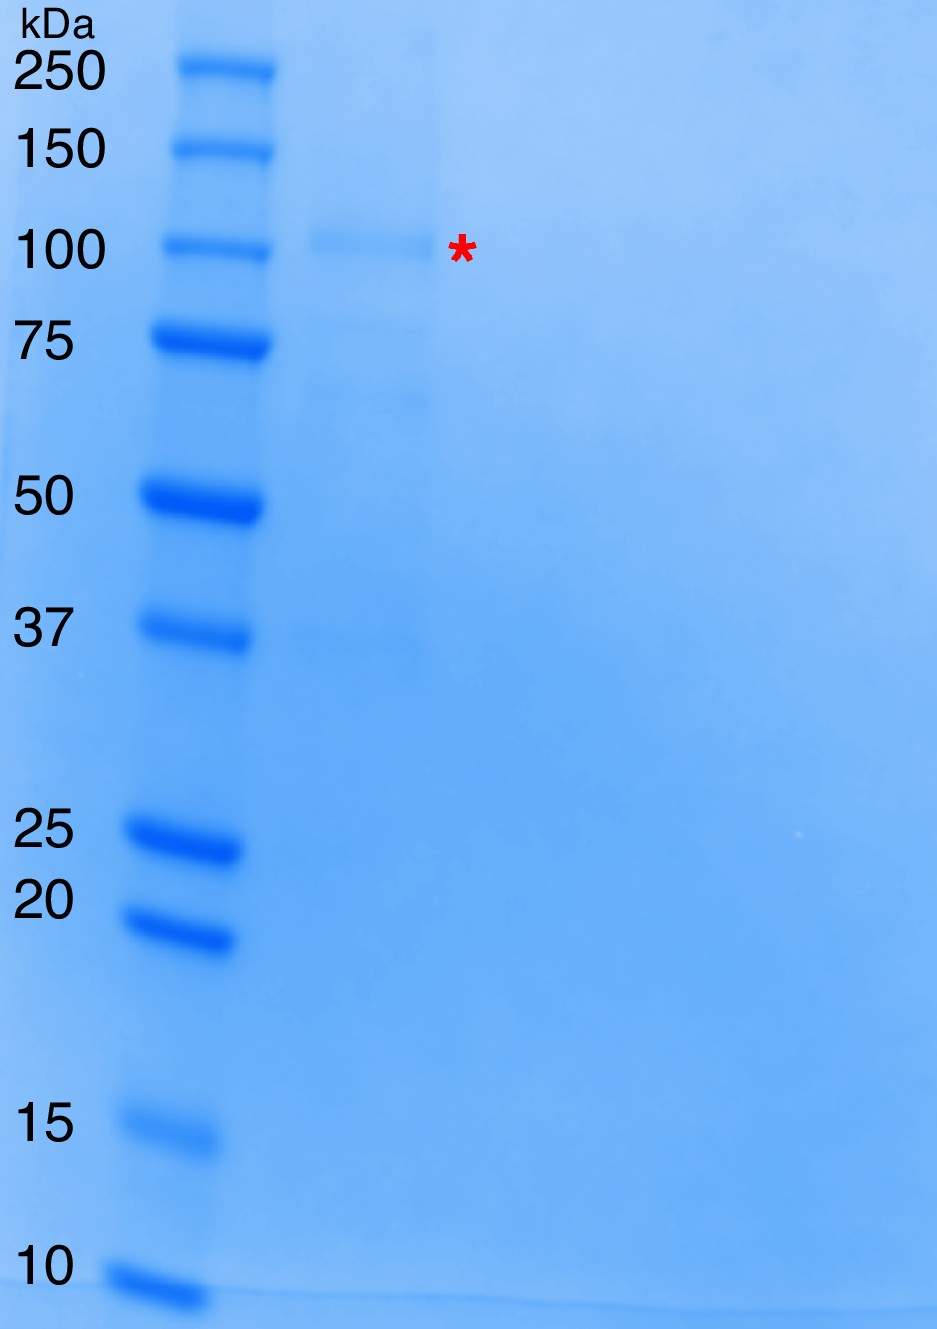
SDS-PAGE of natively purified dopamine dehydroxylase from E. lenta A2.
Ladder is the Precision Plus Protein All Blue Standards (first lane from the left), while the subsequent lane represents the combined dopamine-dehydroxylating fractions from the size exclusion column, the last chromatography step of the activity-based purification from E. lenta A2. The dopamine dehydroxylase (115 kDa predicted size) is highlighted with the red asterisk.
Figure 1—figure supplement 2
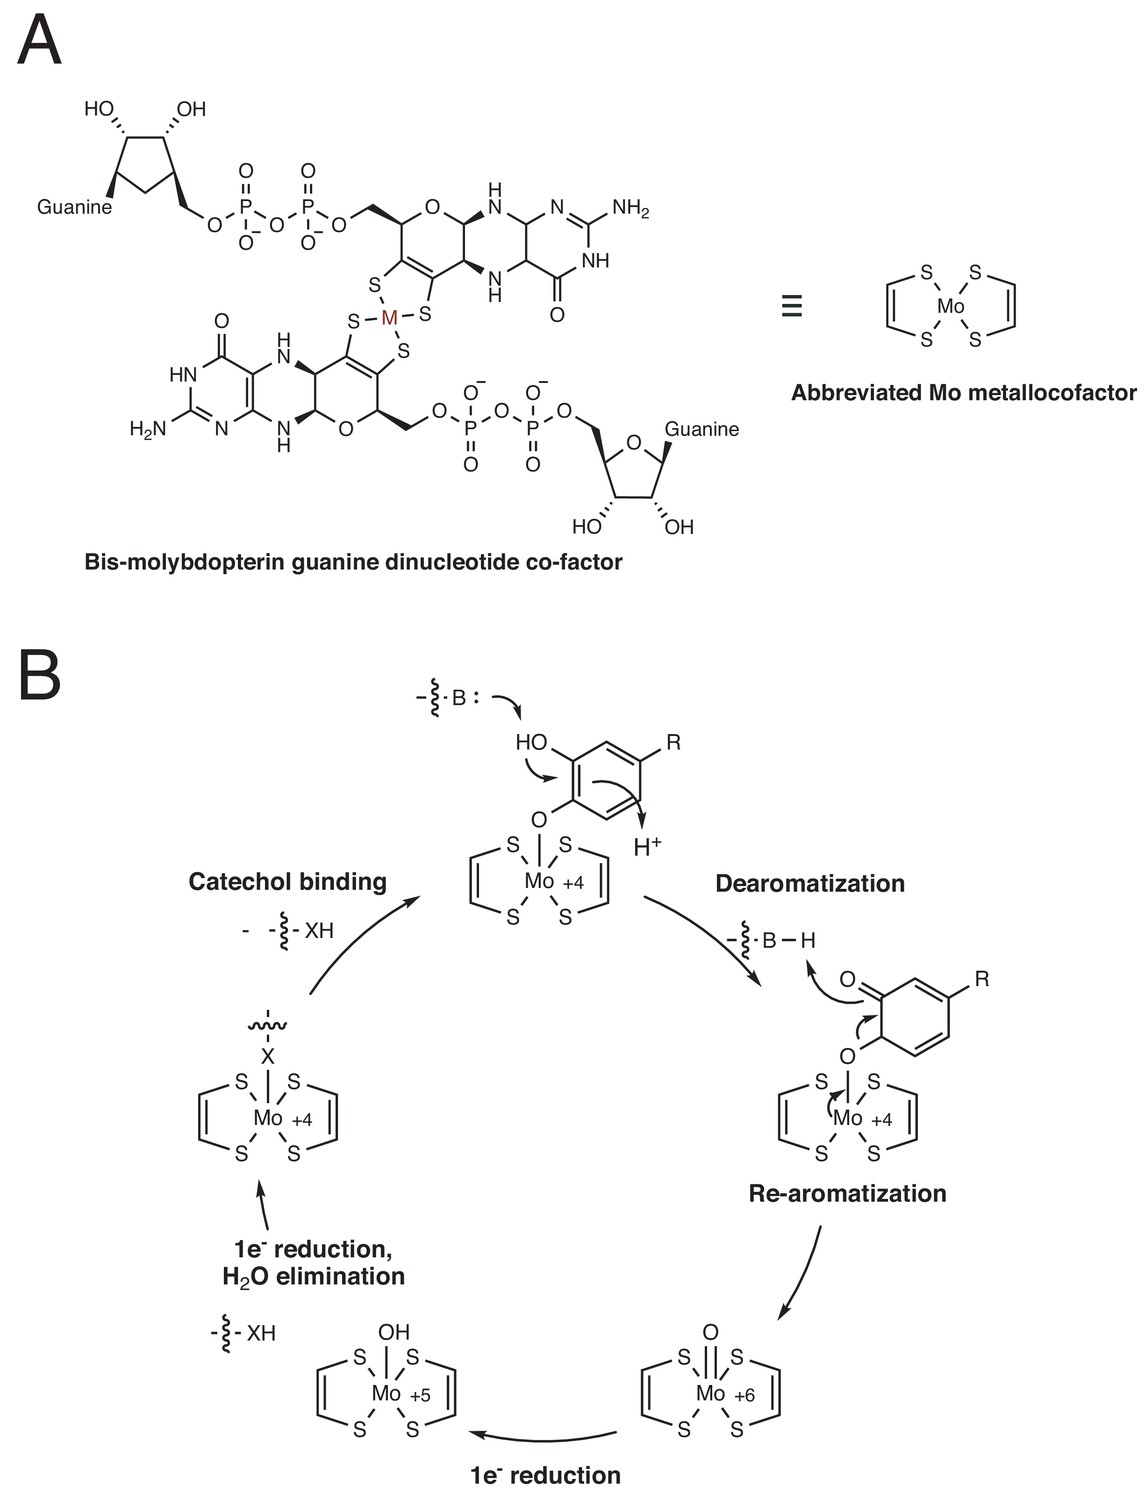
Proposed mechanism for dopamine dehydroxylation by E. lenta A2 dopamine dehydroxylase.
(A) Structure of the bis-molybdopterin guanine dinucleotide co-factor that coordinates the catalytically essential molybdenum atom. M = metal. This metal can be either molybdenum (Mo) or tungsten (W). The metal center is predicted to be molybdenum in the dopamine dehydroxylase. (B) Proposed mechanism for dopamine dehydroxylation involves de-aromatization and C–O bond cleavage driven by re-aromatization. The molybdenum atom is coordinated by an active site amino acid residue (here indicated as X, likely Aspartate or Cysteine), which is displaced upon catechol binding.
Figure 2 with 7 supplements
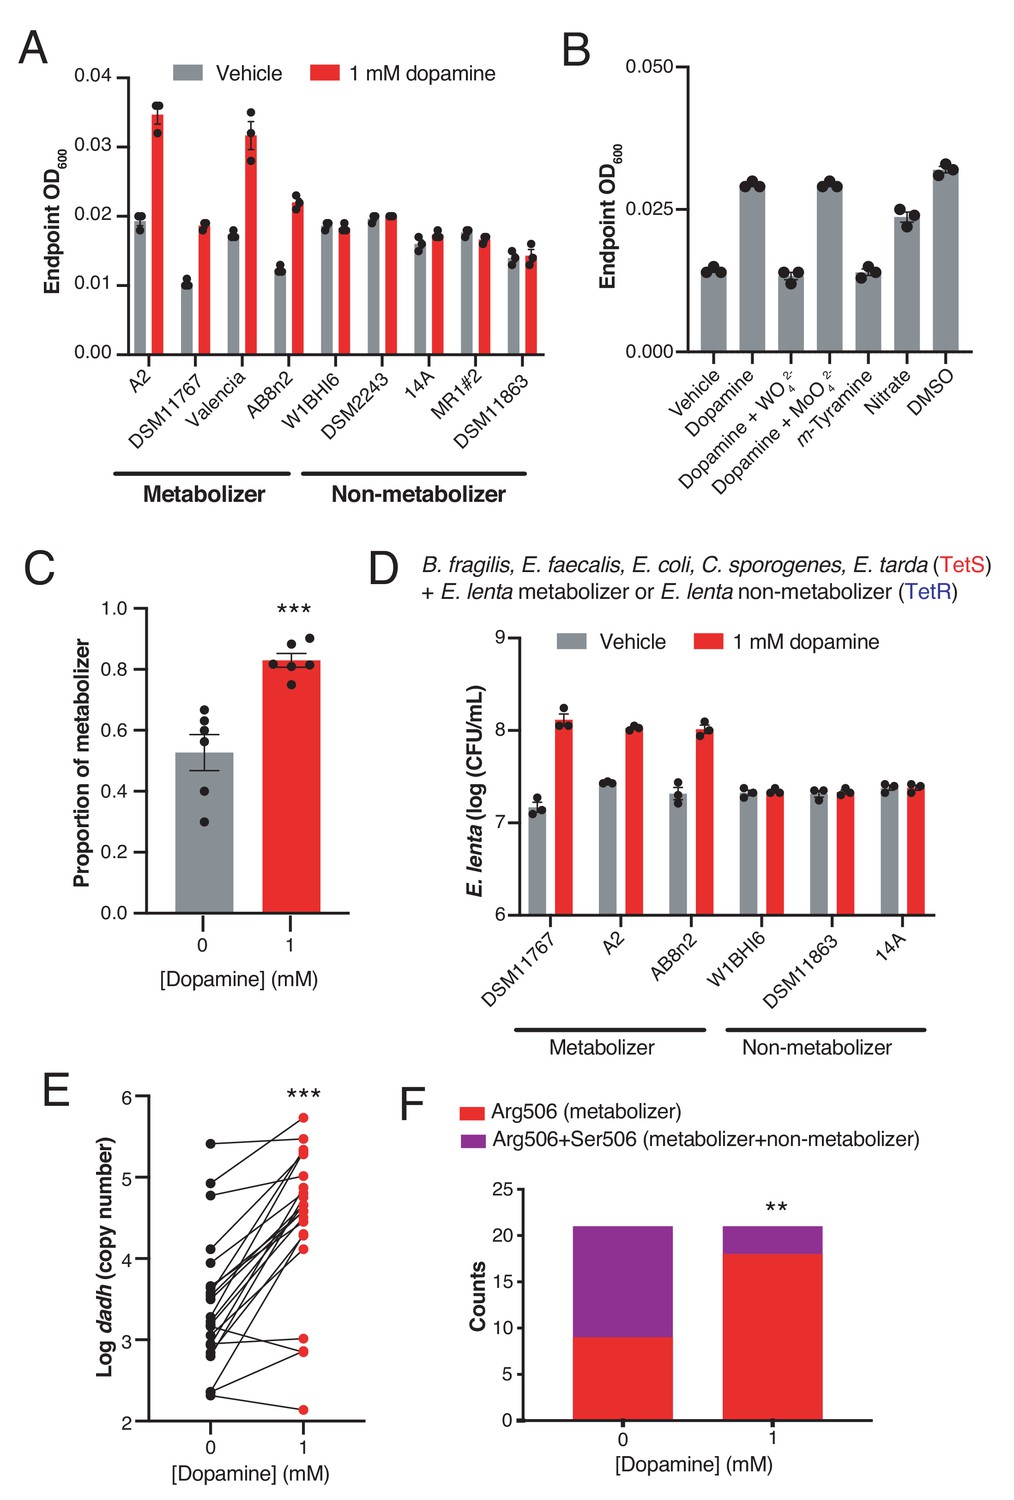
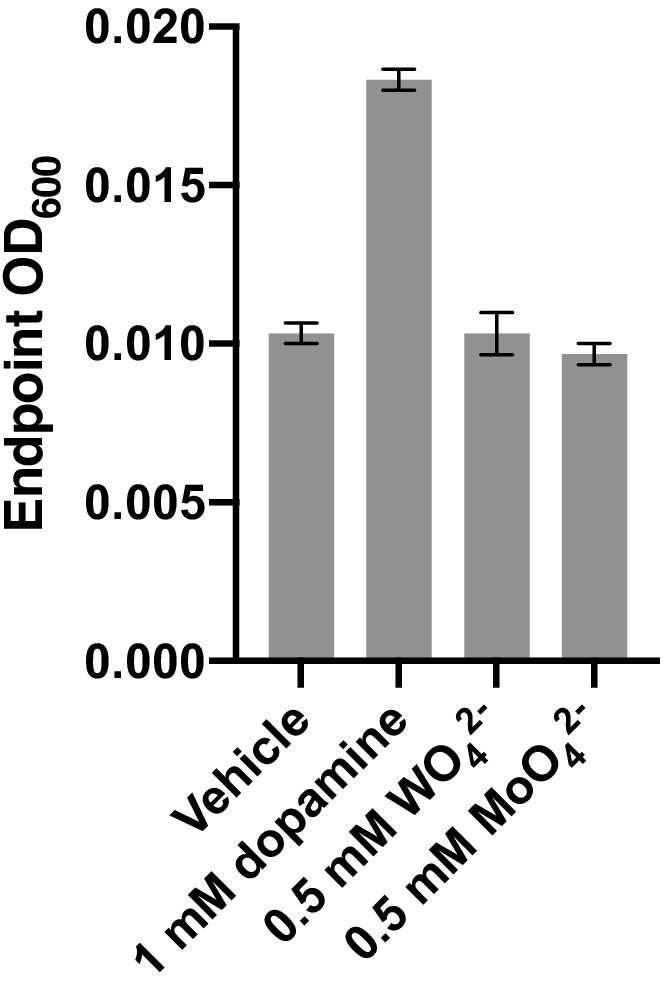
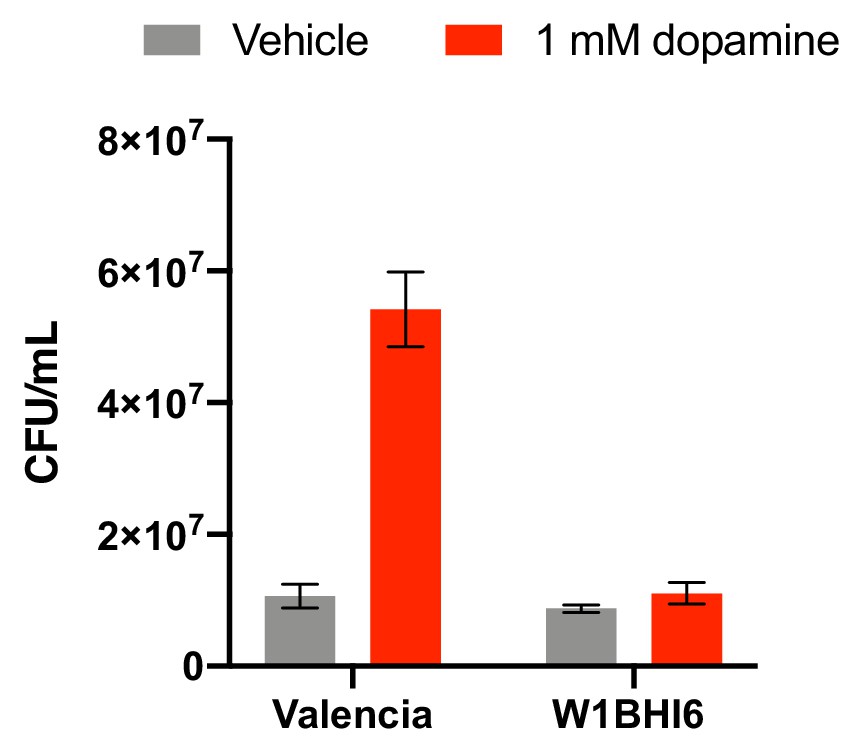
Dopamine increases gut bacterial growth by serving as an alternative electron acceptor.
(A) Growth of dopamine metabolizing and non-metabolizing E. lenta strains in minimal medium limited in electron acceptors (basal medium) containing 10 mM acetate. Strains were grown anaerobically for 48–72 hr at 37°C before growth was assessed. Bars represent the mean ±the SEM of three biological replicates (bacterial cultures). The experiment was performed once. (B) Tungstate inhibits of growth and dopamine metabolism by E. lenta A2 in basal medium containing 10 mM acetate. E. lenta was grown anaerobically for 48 hr at 37°C. Dopamine, m-tyramine, and nitrate were added to a final concentration of 1 mM, while DMSO was added to a final concentration of 14 mM at the time of inoculation. Tungstate (WO42–) and molybdate (MoO42–) were added to a final concentration of 0.5 mM. Bars represent the mean ±the SEM of three biological replicates (bacterial cultures). The experiment was performed twice. (C) Competition of dopamine metabolizing (Valencia) and non-metabolizing (W1BHI6) E. lenta strains in basal medium containing 10 mM acetate. Strains were grown together for 72 hr at 37°C and were then plated on BHI medium. Antibiotic resistance was used to determine strain identity. Bars represent the mean ±the SEM of six biological replicates (bacterial cultures). (***p=0.0007, two-tailed unpaired t-test). The experiment was performed twice. (D) Growth of defined gut bacterial consortia containing dopamine metabolizing and non-metabolizing E. lenta strains in basal medium containing 10 mM acetate. Tetracycline resistant (TetR) E. lenta strains were grown with tetracycline sensitive (TetS) gut isolates for 48 hr at 37°C. Plating on BHI medium containing tetracycline allowed enumeration of E. lenta. Bars represent the mean ±the SEM of three biological replicates (bacterial cultures). The experiment was performed twice. (E) Abundance of dadh in complex human gut communities cultured ex vivo. Samples from unrelated individuals (n = 24) were grown for 72 hr at 37°C in basal medium containing 10 mM acetate with or without dopamine and qPCR was used to assess abundance of dadh. Two individuals were excluded from this analysis as they did not demonstrate quantitative metabolism of dopamine after incubation. Each point represents a different individual. Lines connect data from the same individual between the two conditions. (***p=0.0005, two-tailed unpaired t-test, n = 22 samples per group). The experiment was performed twice. (F) Counts of dadh variants in the presence and absence of dopamine. The same gDNA used in E) was used to amplify full-length dadh and determine the SNP status at position 506 using Sanger sequencing. As in panel E, two individuals were removed prior to analysis as they did not demonstrate quantitative metabolism of dopamine after incubation. In addition, one individual was not included in this analysis due to failure of obtaining high quality sequencing data. (**p=0.008, Fisher’s exact test, n = 9 CGC samples and n = 12 CGC/AGC samples for vehicle; n = 18 CGC samples and n = 3 CGC/AGC samples for dopamine). The sequencing was performed once. All data , and details of the statistical tests, can be found in Figure 2—source data 1.
-
Figure 2—source data 1
Growth data from studies of impact of dopamine on E. lenta growth in basal medium lacking electron acceptors (Figure 2).
- https://cdn.elifesciences.org/articles/50845/elife-50845-fig2-data1-v1.xlsx
Figure 2—figure supplement 1
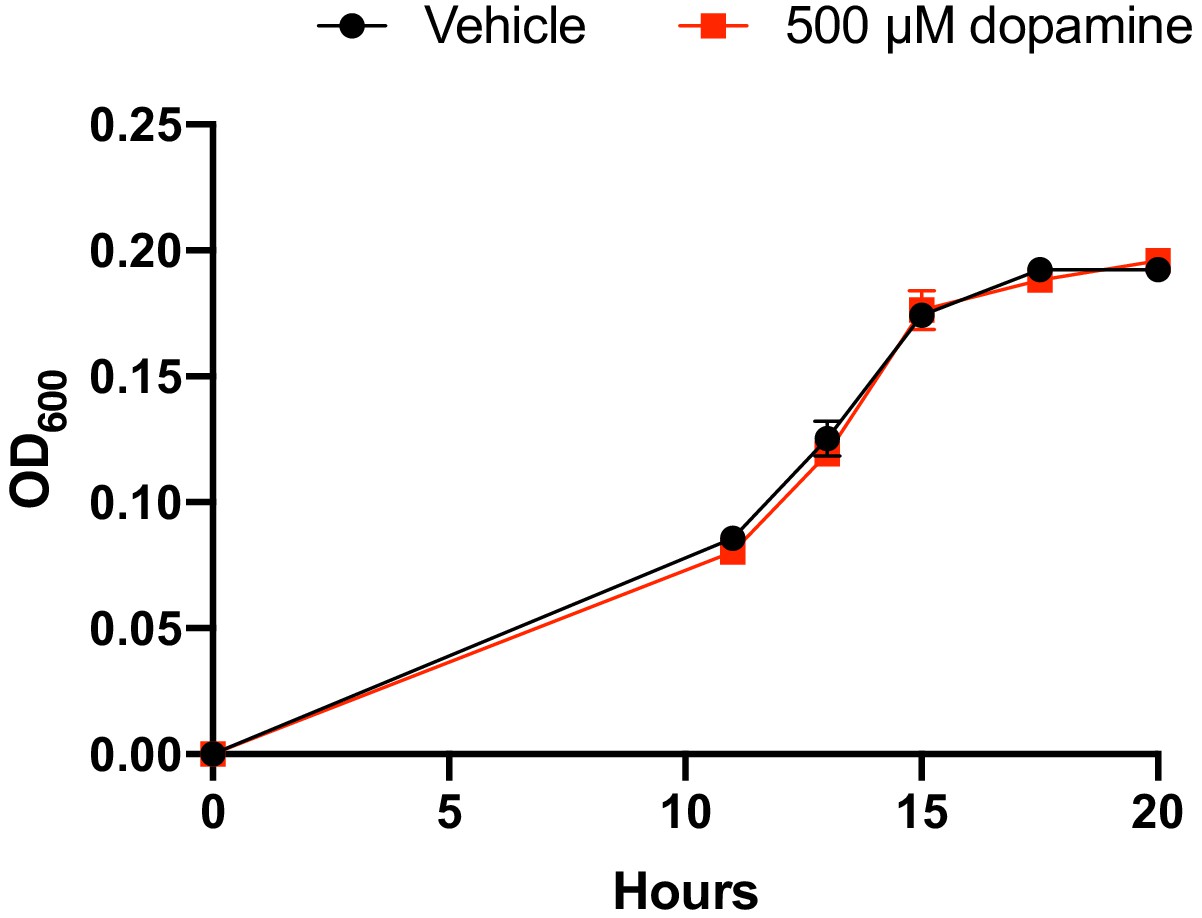
Growth of E. lenta A2 in BHI medium with and without dopamine.
E. lenta A2 was grown anaerobically in BHI medium at 37°C with and without dopamine. The data shown are the mean ±the SEM (n = 3 replicate growth experiments). The experiment was performed once.
Figure 2—figure supplement 2
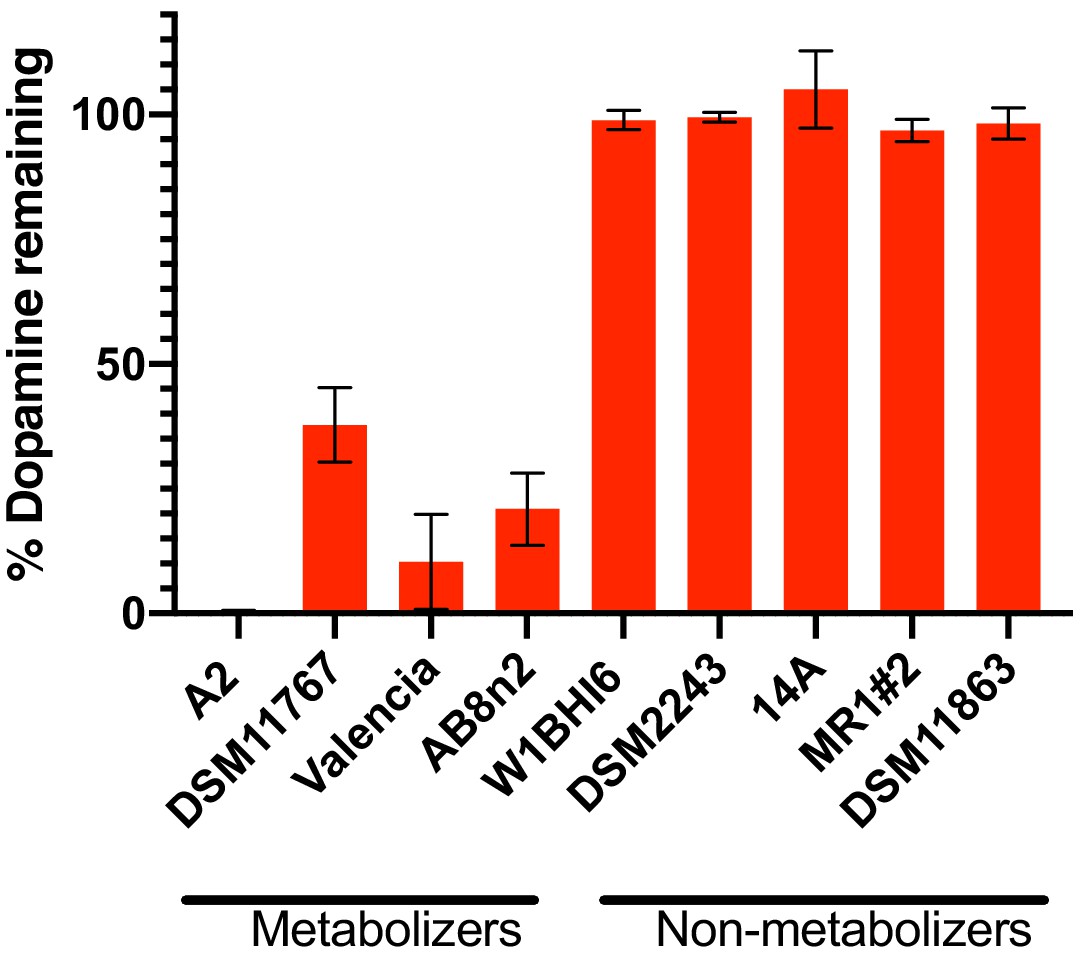
Dehydroxylation of dopamine by E. lenta strains grown in in basal medium.
Strains were grown anaerobically for 48–72 hr at 37°C in basal medium containing 10 mM acetate before metabolism was assessed using the catechol colorimetric assay. Bars represent mean ±the SEM (n = 3 replicate cultures for each strain). The experiment was performed once. Source data can be found in Figure 2—source data 1.
Figure 2—figure supplement 3
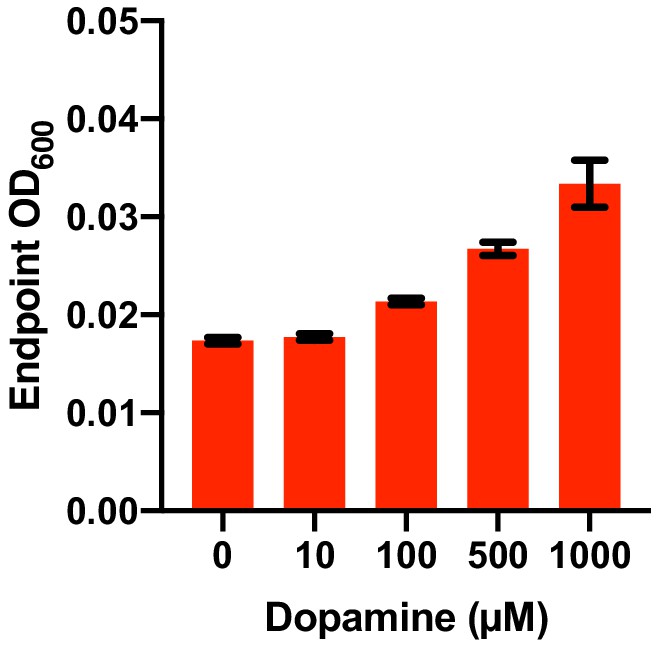
Dose dependence of dopamine-promoted growth of E. lenta A2 in basal medium.
E. lenta was grown anaerobically in basal medium containing 10 mM acetate at 37°C with varying concentrations of dopamine for 48 hr. Bars represent the mean ±the SEM (n = 3 replicate cultures for each strain). The experiment was performed once.
Figure 2—figure supplement 4
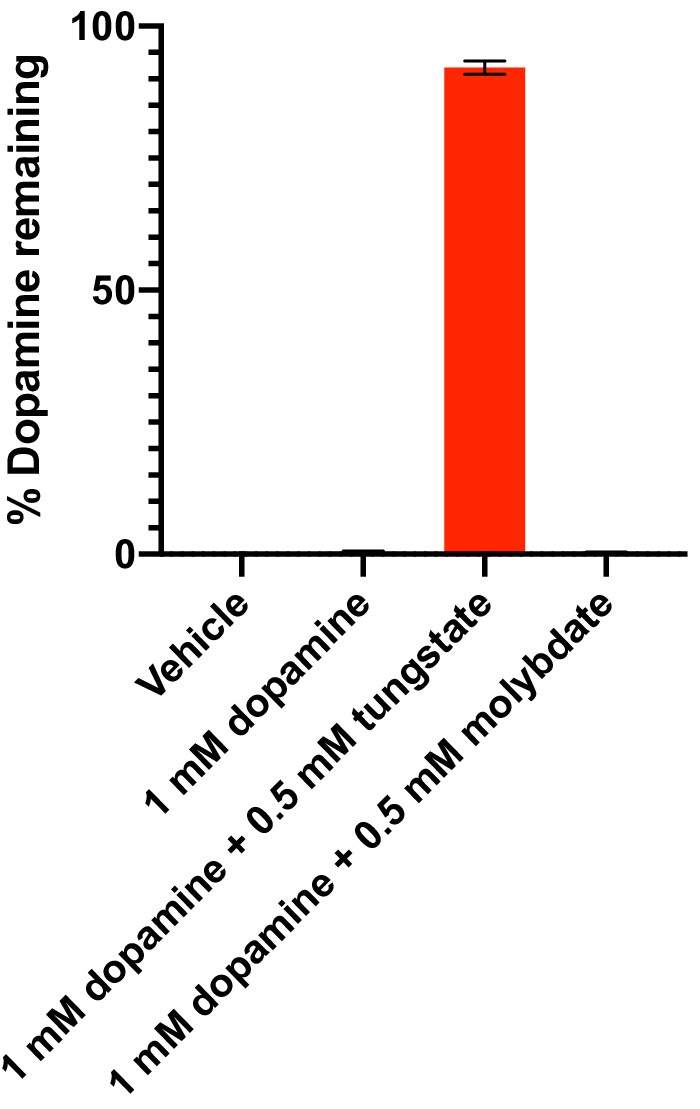
Dehydroxylation of dopamine by E. lenta A2 in the presence of tungstate and molybdate in basal medium.
E. lenta was grown anaerobically in basal medium containing 10 mM acetate at 37°C and 1 mM dopamine and either tungstate or molybdate (0.5 mM each) for 48 hr. Metabolism was assessed using the catechol colorimetric assay. Bars represent the mean ±the SEM of three biological replicates (independent cultures). The experiment was performed once. Source data can be found in Figure 2—source data 1.
Figure 2—figure supplement 5
Impact of tungstate and molybdate on E. lenta A2 growth in basal medium.
E. lenta was grown anaerobically in basal medium containing 10 mM acetate at 37°C with either 1 mM dopamine, tungstate, or molybdate (0.5 mM each) for 36 hr before growth was assessed. Bars represent the mean ±the SEM of three biological replicates (independent cultures). The experiment was performed once.
Figure 2—figure supplement 6
CFU counts of E. lenta strains W1BHI6 and Valencia co-cultured in basal medium with and without dopamine.
Strains were grown together in basal medium containing 10 mM acetate for 72 hr at 37°C and were then plated. Antibiotic resistance was used to determine strain identity. Bars represent the mean ±the SEM of six biological replicates (independent growth cultures). The experiment was performed once. Source data can be found in Figure 2—source data 1.
Figure 2—figure supplement 7

E. lenta qPCR abundance in human fecal samples cultured with and without dopamine ex vivo.
Samples from unrelated individuals (n = 24) were grown for 72 hr at 37°C in basal medium containing 10 mM acetate with or without dopamine. qPCR was used to assess abundance of E. lenta. Two individuals were excluded from this analysis as they did not demonstrate quantitative metabolism of dopamine after incubation. Each point represents a different individual. Lines connect data from the same individual between the two conditions. (**p<0.005, two-tailed unpaired t-test). The experiment was performed twice. Source data can be found in Figure 2—source data 1.
Figure 3 with 1 supplement
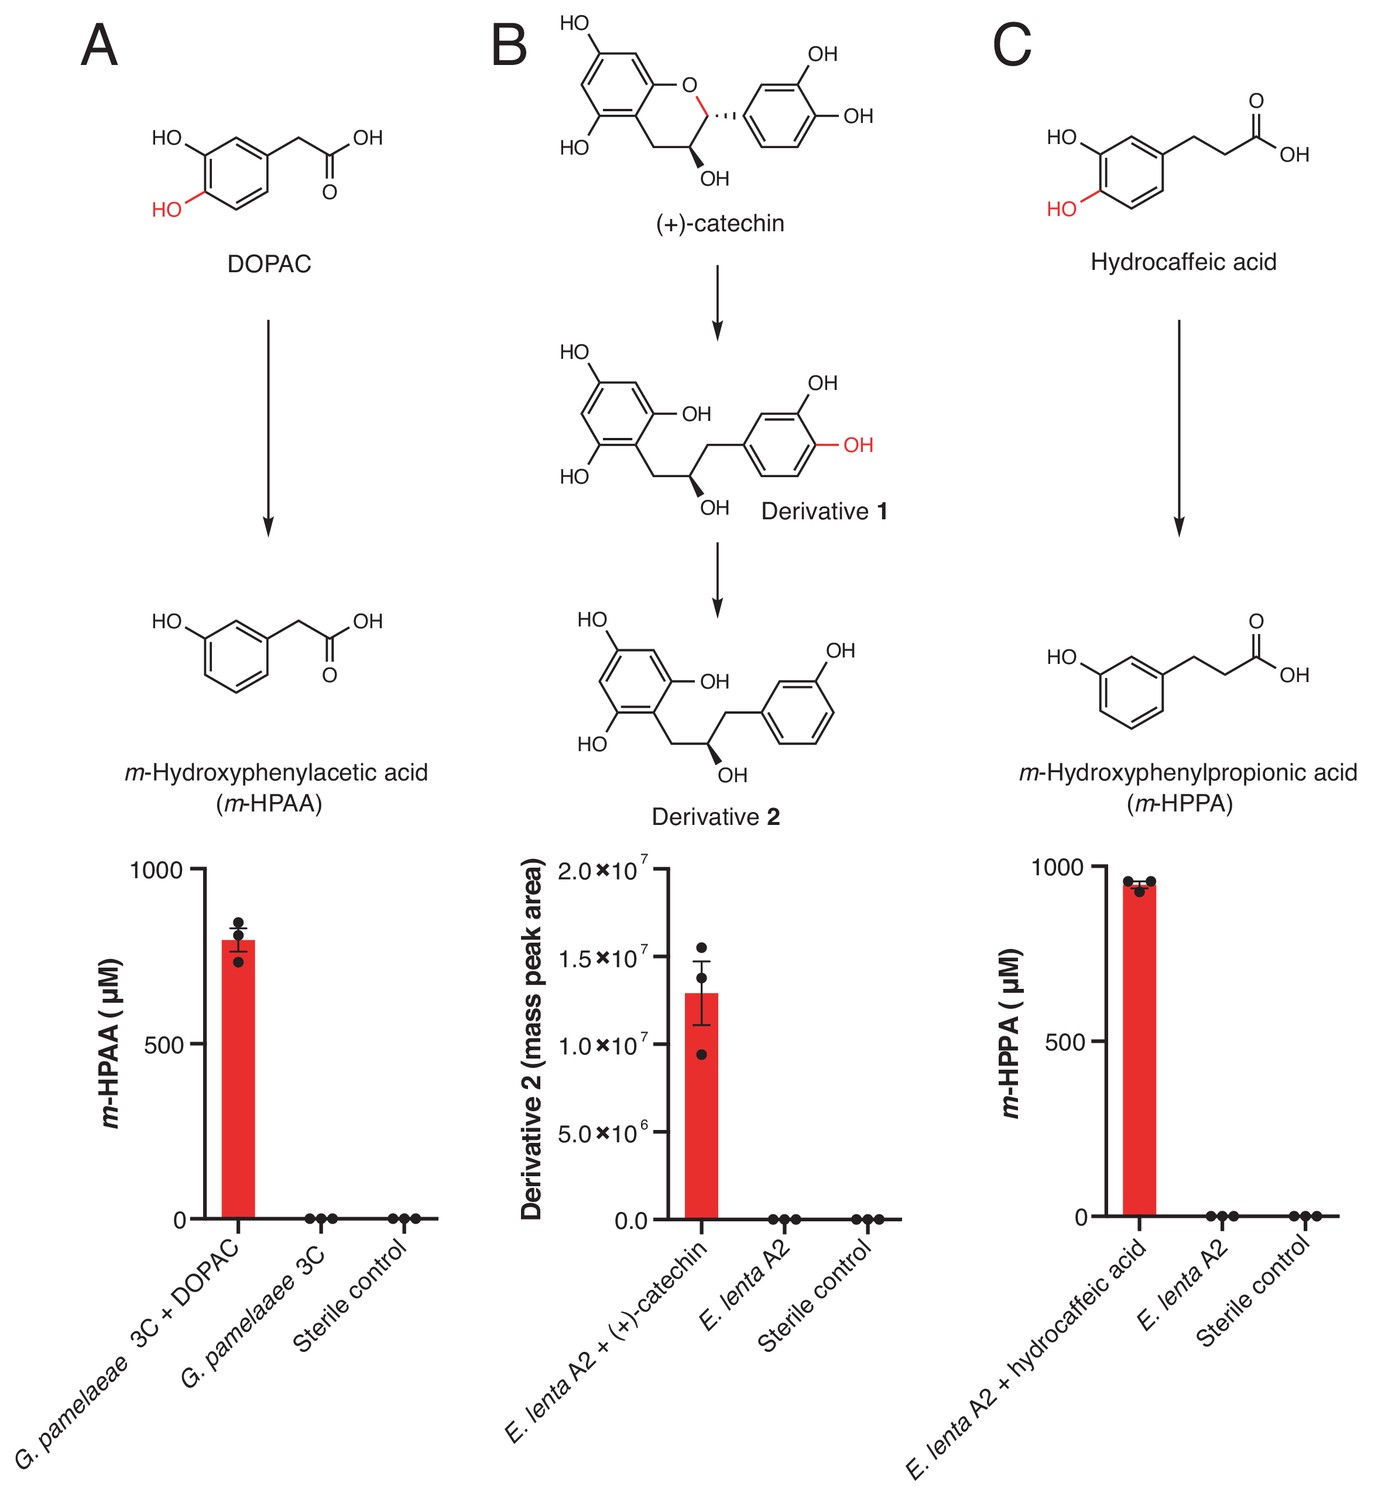
Dehydroxylation of DOPAC, (+)-catechin, and hydrocaffeic acid by Gordonibacter pamelaeae 3C and Eggerthella lenta A2.
(A-C) Pathways for metabolism of (A) DOPAC, (B) (+)-catechin, (C) and hydrocaffeic acid by human gut Actinobacteria. While DOPAC and hydrocaffeic acid are dehydroxylated directly, (+)-catechin metabolism proceeds by initial benzyl ether reduction followed by dehydroxylation of the catecholic derivative. (A) Metabolism of DOPAC by G. pamelaeae 3C. This strain was grown in BHI medium with and without 1 mM DOPAC for 48 hr at 37°C. Metabolism was assessed using LC-MS/MS. Bars represent the mean ±the SEM concentration of the metabolite m-hydroxyphenylacetic acid (m-HPAA) resulting from direct DOPAC dehydroxylation (three biological replicates, e.g. bacterial cultures). The experiment was performed twice. (B) (+)-catechin metabolism by E. lenta A2. This strain was grown in BHI medium with and without 1 mM (+)-catechin for 48 hr at 37°C. Metabolism was assessed using high resolution LC-MS. Bars represent the mean ±the SEM mass peak area of the Extracted Ion Chromatogram (EIC) for the dehydroxylated derivative 2 shown above the bar graph in B) (three biological replicates, e.g. bacterial cultures). Due to the absence of an authentic standard, integrated peak area of the high-resolution mass is displayed. The experiment was performed twice. C) Metabolism of hydrocaffeic acid by E. lenta A2. This strain was grown in BHI medium with and without 1 mM hydrocaffeic acid for 48 hr at 37°C. Metabolism was assessed using LC-MS/MS. Bars represent the mean ±the SEM concentration of m-hydroxyphenylpropionic acid (m-HPPA) resulting from the direct dehydroxylation of hydrocaffeic acid (three biological replicates, e.g. bacterial cultures). The experiment was performed twice. All data can be found in Figure 3—source data 1.
-
Figure 3—source data 1
Metabolism data from incubations of G. pamelaeae 3C with DOPAC and from E. lenta A2 with hydrocaffeic acid and (+)-catechin (Figure 3).
- https://cdn.elifesciences.org/articles/50845/elife-50845-fig3-data1-v1.xlsx
Figure 3—figure supplement 1
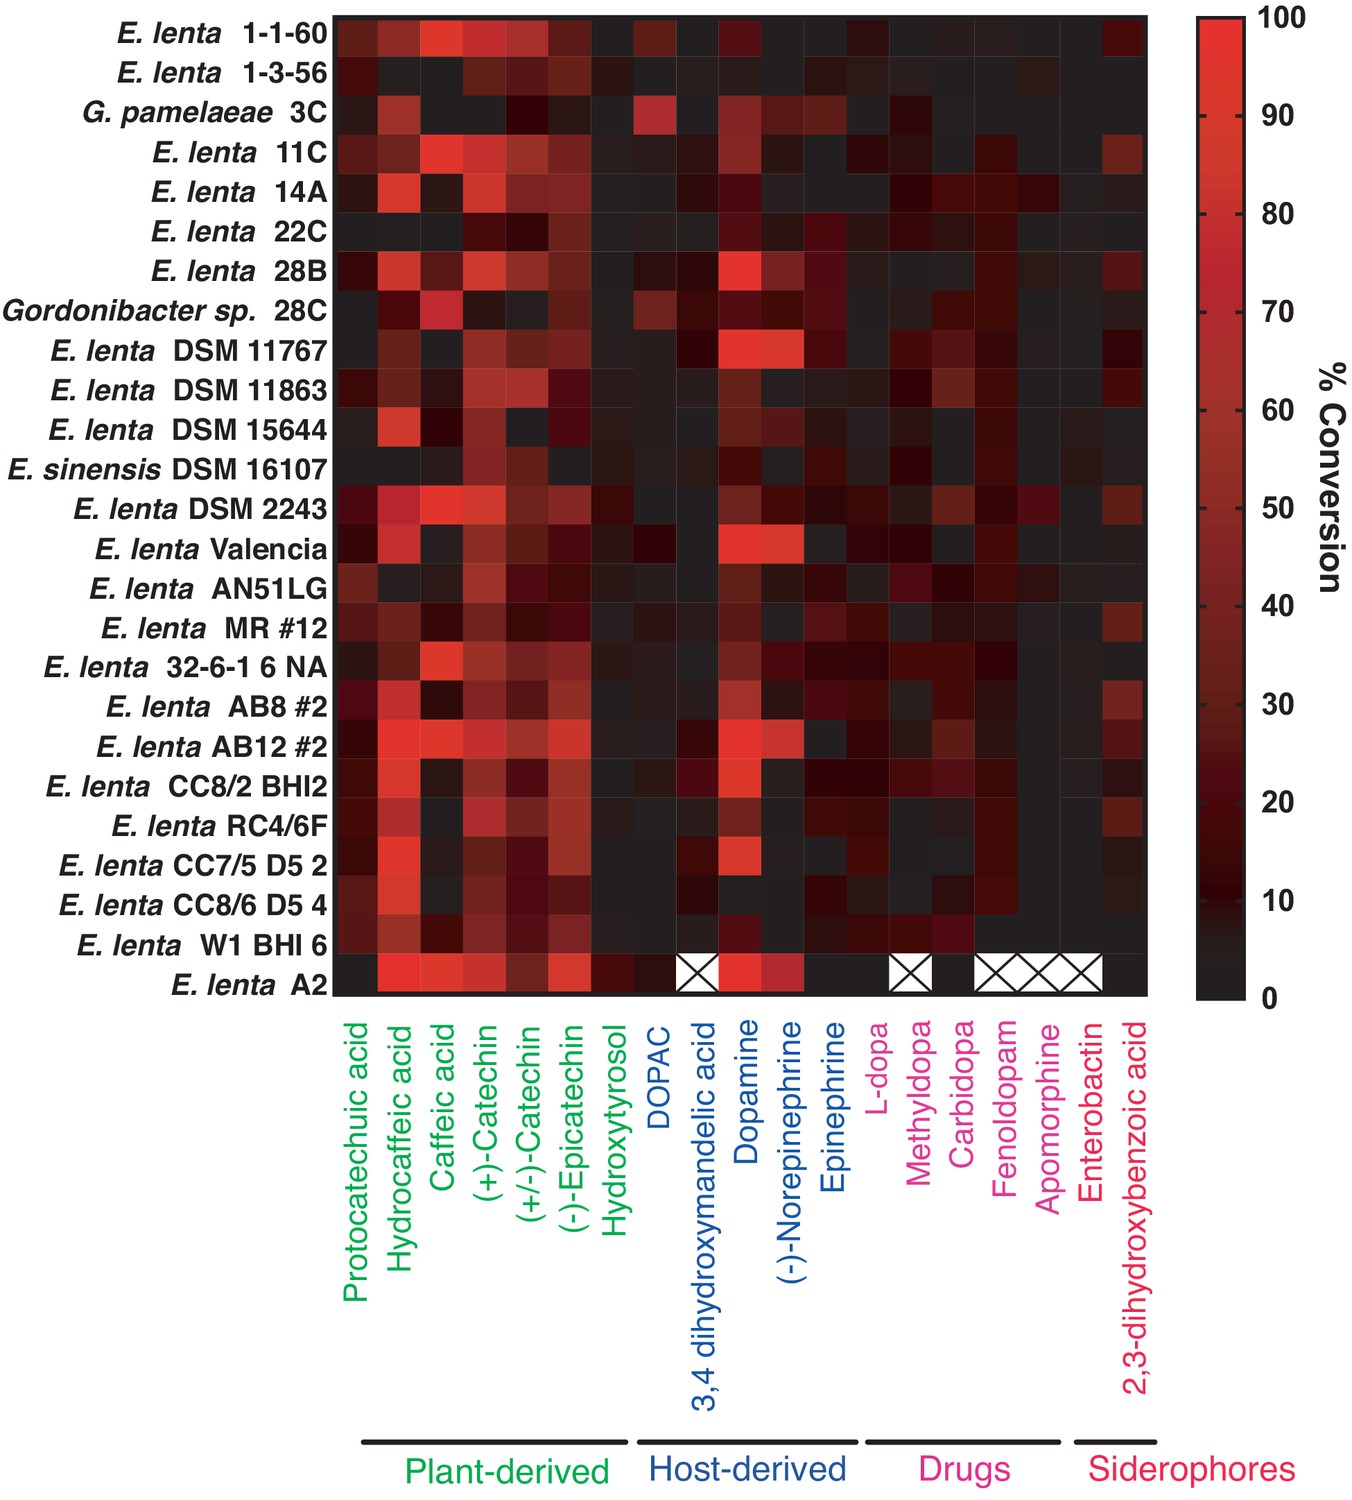
Colorimetric screen for catechol dehydroxylation by human gut Actinobacteria.
Individual strains were grown in the presence of a single catechol substrate for 24–48 hr at 37°C in BHI medium containing 10 mM formate and 1% arginine (w/v). Metabolism was assessed using a colorimetric assay that detects the catechol functional group. Data from bacterial incubations were normalized to the sterile control. Data represent the mean of three biological replicates (independent bacterial cultures). An X means that the strain was not screened for metabolism of the specific compound. The experiment was performed once.
Figure 4 with 6 supplements

Gut Actinobacteria dehydroxylate individual catechols using distinct enzymes.
(A) Specificity of dehydroxylase regulation and activity in E. lenta A2. E. lenta A2 was grown anaerobically in BHI medium containing 1% arginine and 10 mM formate. 0.5 mM of catechol was added to induce dehydroxylase expression, followed by anaerobic lysis and enzyme assays. Crude lysates were exposed to different substrates (500 µM) and reactions were allowed to proceed anaerobically for 20 hr. Assays mixtures were analyzed using LC-MS. Heat map represents the mean of three biological replicates (lysate reactions). The experiment was performed twice. (B) Specificity of DOPAC dehydroxylase regulation and activity in G. pamelaeae A2. G. pamelaeae 3C was grown anaerobically in BHI medium containing 10 mM formate. 0.5 mM of catechol was added to induce dehydroxylase expression, followed by anaerobic lysis and enzyme assays. Crude lysates were exposed to different substrates (500 µM) and reactions were allowed to proceed anaerobically for 20 hr. Assays mixtures were analyzed using LC-MS. Heat map represents the mean of three biological replicates (lysate reactions). The experiment was performed twice. (C) Distribution of putative catechol dehydroxylases and their associated metabolic activities across the gut Actinobacterial library used in our study. The tree represents the phylogeny of gut Actinobacterial strains adapted from Koppel et al. (2018). El = Eggerthella lenta, Es = Eggerthella sinesis, Ph = Paraggerthella, Gs = Gordonibacter sp., Gp = Gordonibacter pamelaeae. Squares represent gene presence/absence of select dehydroxylases across gut Actinobacterial strains (90% coverage, 75% amino acid identity cutoff, e-value = 0). To evaluate catechol metabolism, individual strains were grown in triplicate in the presence of a single catechol substrate for 48 hr at 37°C in BHI medium. Metabolism was assessed using LC-MS/MS. A red dot indicates that the mass of the dehydroxylated product was detected in cultures from this strain, while a black dot indicates lack of metabolism. The experiment was performed once. (D) In vitro activity of Hcdh-containing fractions purified from E. lenta A2. EICs for detection of hydrocaffeic acid (MRM m/z 181- > 137) and m-hydroxyphenylpropionic acid (m-HPPA) (MRM m/z 165- > 121) after 26 hr of anaerobic incubation of enzyme preparation with 500 µM hydrocaffeic acid, 500 µM methyl viologen, and 1 mM sodium dithionite at room temperature. Peak heights show the relative intensity of each mass, and all chromatograms are shown on the same scale. The experiment was performed under anaerobic conditions unless otherwise indicated. The experiment was performed once. (E) Substrate scope of Hcdh-containing fractions purified from E. lenta A2. The enzyme preparation used in D) was diluted 1:5 in buffer and was incubated with 500 µM catechol substrate, 500 µM methyl viologen, and 1 mM sodium dithionite at room temperature for 26 hr under anaerobic conditions. The enzyme reactions were analyzed by LC-MS/MS. Bars represent the mean ±the SEM of three independent enzyme reactions. The experiment was performed once. All data can be found in Figure 4—source data 1.
-
Figure 4—source data 1
Data from lysate assays in E. lenta A2 and G. pamelaeae 3C, screening of Actinobacterial library for metabolism of DOPAC, hydrocaffeic acid, and (+)-catechin, and enzyme assays with hydrocaffeic acid dehydroxylase (Figure 4).
- https://cdn.elifesciences.org/articles/50845/elife-50845-fig4-data1-v1.xlsx
Figure 4—figure supplement 1
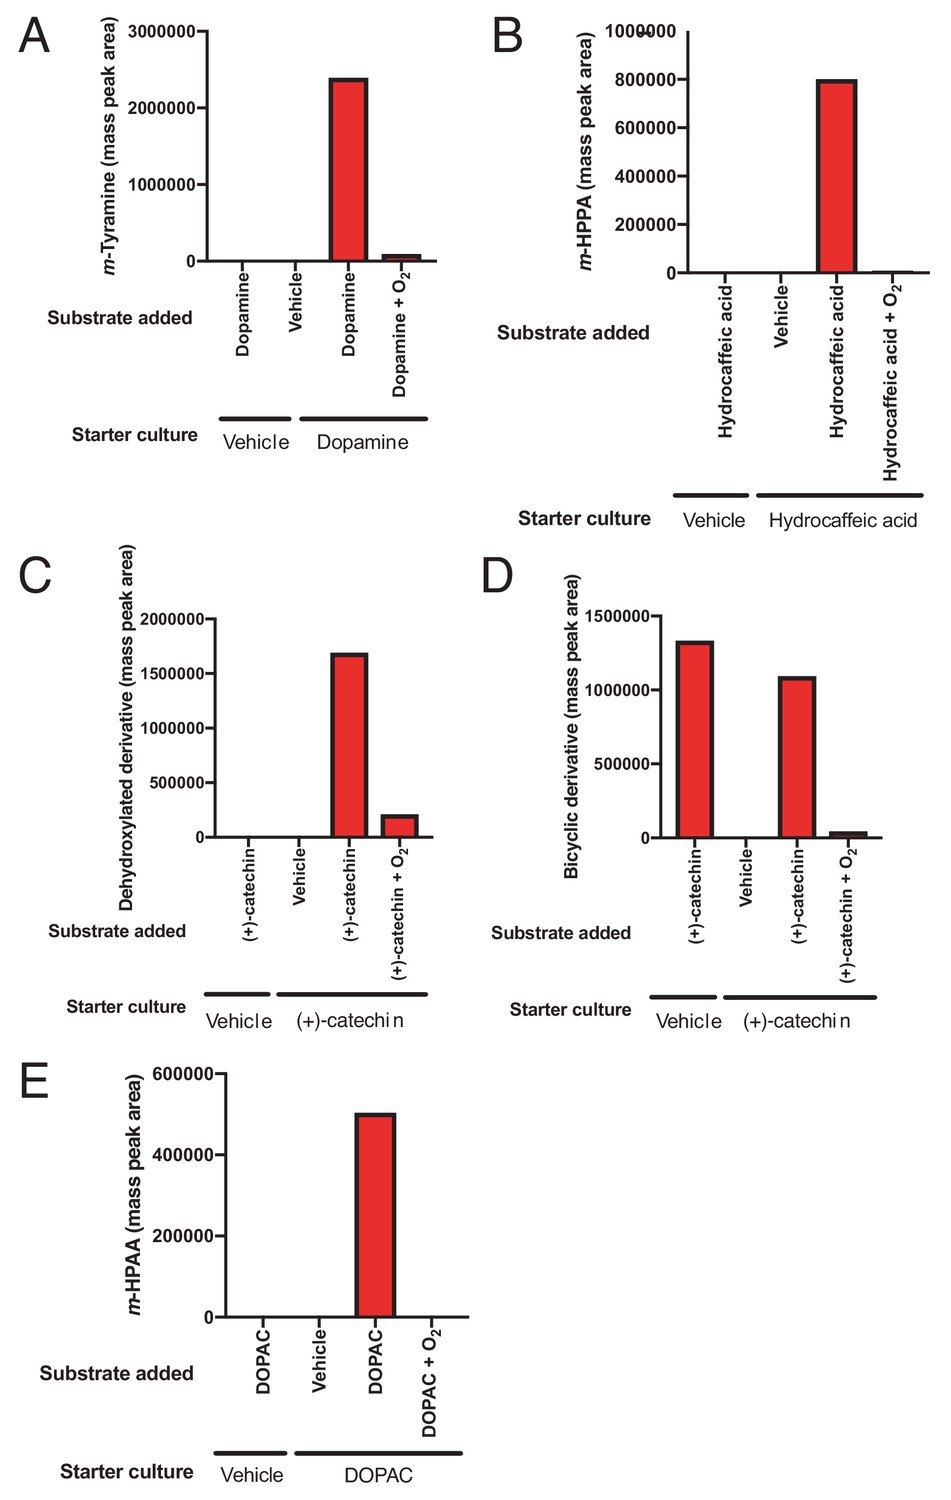
Inducibility and oxygen sensitivity of catechol dehydroxylation by whole cell suspensions of E. lenta A2 and G. pamelaeae 3C.
(A) Inducibility and oxygen sensitivity of dopamine dehydroxylase activity in E. lenta A2. E. lenta A2 was grown anaerobically in BHI medium containing 1% arginine and 10 mM formate. 0.5 mM of dopamine was added to induce dehydroxylase expression, followed by pelleting of cells and resuspension in PBS. Whole cell suspensions were exposed to dopamine (500 µM) or vehicle (water), and reactions were allowed to proceed anaerobically or aerobically for 20 hr. Assays mixtures were analyzed using LC-MS. Bar graph displays the mass peak area for a single sample. (B) Inducibility and oxygen sensitivity of hydrocaffeic acid dehydroxylase activity in E. lenta A2. E. lenta A2 was grown anaerobically in BHI medium containing 1% arginine and 10 mM formate. 0.5 mM of hydrocaffeic acid was added to induce dehydroxylase expression, followed by pelleting of cells and resuspension in PBS. Whole cell suspensions were exposed to hydrocaffeic acid (500 µM) or vehicle (water) and reactions were allowed to proceed anaerobically or aerobically for 20 hr. Assays mixtures were analyzed using LC-MS. Bar graph displays the mass peak area of m-hydroxyphenylpropionic acid (m-HPPA) for a single sample. (C) Inducibility and oxygen sensitivity of catechin dehydroxylase activity in E. lenta A2. E. lenta A2 was grown anaerobically in BHI medium containing 1% arginine and 10 mM formate. 0.5 mM of (+)-catechin was added to induce dehydroxylase expression, followed by pelleting of cells and resuspension in PBS. Whole cell suspensions were exposed to (+)-catechin (500 µM) or vehicle (DMF) and reactions were allowed to proceed anaerobically or aerobically for 20 hr. Assays mixtures were analyzed using LC-MS. Bar graph displays the mass peak area of the dehydroxylated catechin derivative in a single sample. (D) Inducibility and oxygen sensitivity of (+)-catechin benzyl ether reduction activity in E. lenta A2. E. lenta A2 was grown anaerobically in BHI medium containing 1% arginine and 10 mM formate. 0.5 mM of (+)-catechin was added to induce dehydroxylase expression, followed by pelleting of cells and resuspension in PBS. Whole cell suspensions were exposed to (+)-catechin (500 µM) or vehicle (DMF) and reactions were allowed to proceed anaerobically or aerobically for 20 hr. Assays mixtures were analyzed using LC-MS. Bar graph displays the mass peak area of the benzyl ether reduced catechin derivative in a single sample. Benzyl ether reduction was constitutive but oxygen sensitive in E. lenta A2. (E) Inducibility and oxygen sensitivity of DOPAC acid dehydroxylase activity G. pamelaeae 3C. G. pamelaeae 3C was grown anaerobically in BHI medium containing 10 mM formate. 0.5 mM of DOPAC was added to induce dehydroxylase expression, followed by pelleting of cells and resuspension in PBS. Whole cell suspensions were exposed to DOPAC (500 µM) or vehicle (water) and reactions were allowed to proceed anaerobically or aerobically for 20 hr. Assays mixtures were analyzed using LC-MS. Bar graph displays the mass peak area m-hydroxyphenylacetic acid (m-HPAA) for a single sample. All experiments described in this figure were performed once.
Figure 4—figure supplement 2
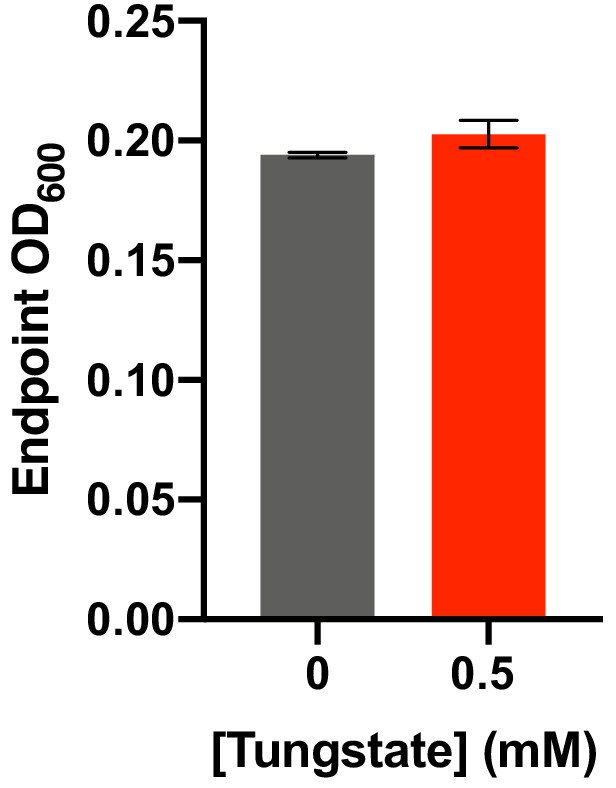
Impact of tungstate on E. lenta A2 growth in BHI medium.
E. lenta was grown anaerobically in BHI at 37°C with 0.5 mM tungstate for 48 hr before growth was assessed. Bars represent the mean ±the SEM of three biological replicates. At 0.5 mM, the concentration at which tungstate inhibits catechol dehydroxylation by E. lenta, there is no effect on growth. The experiment was performed twice.
Figure 4—figure supplement 3
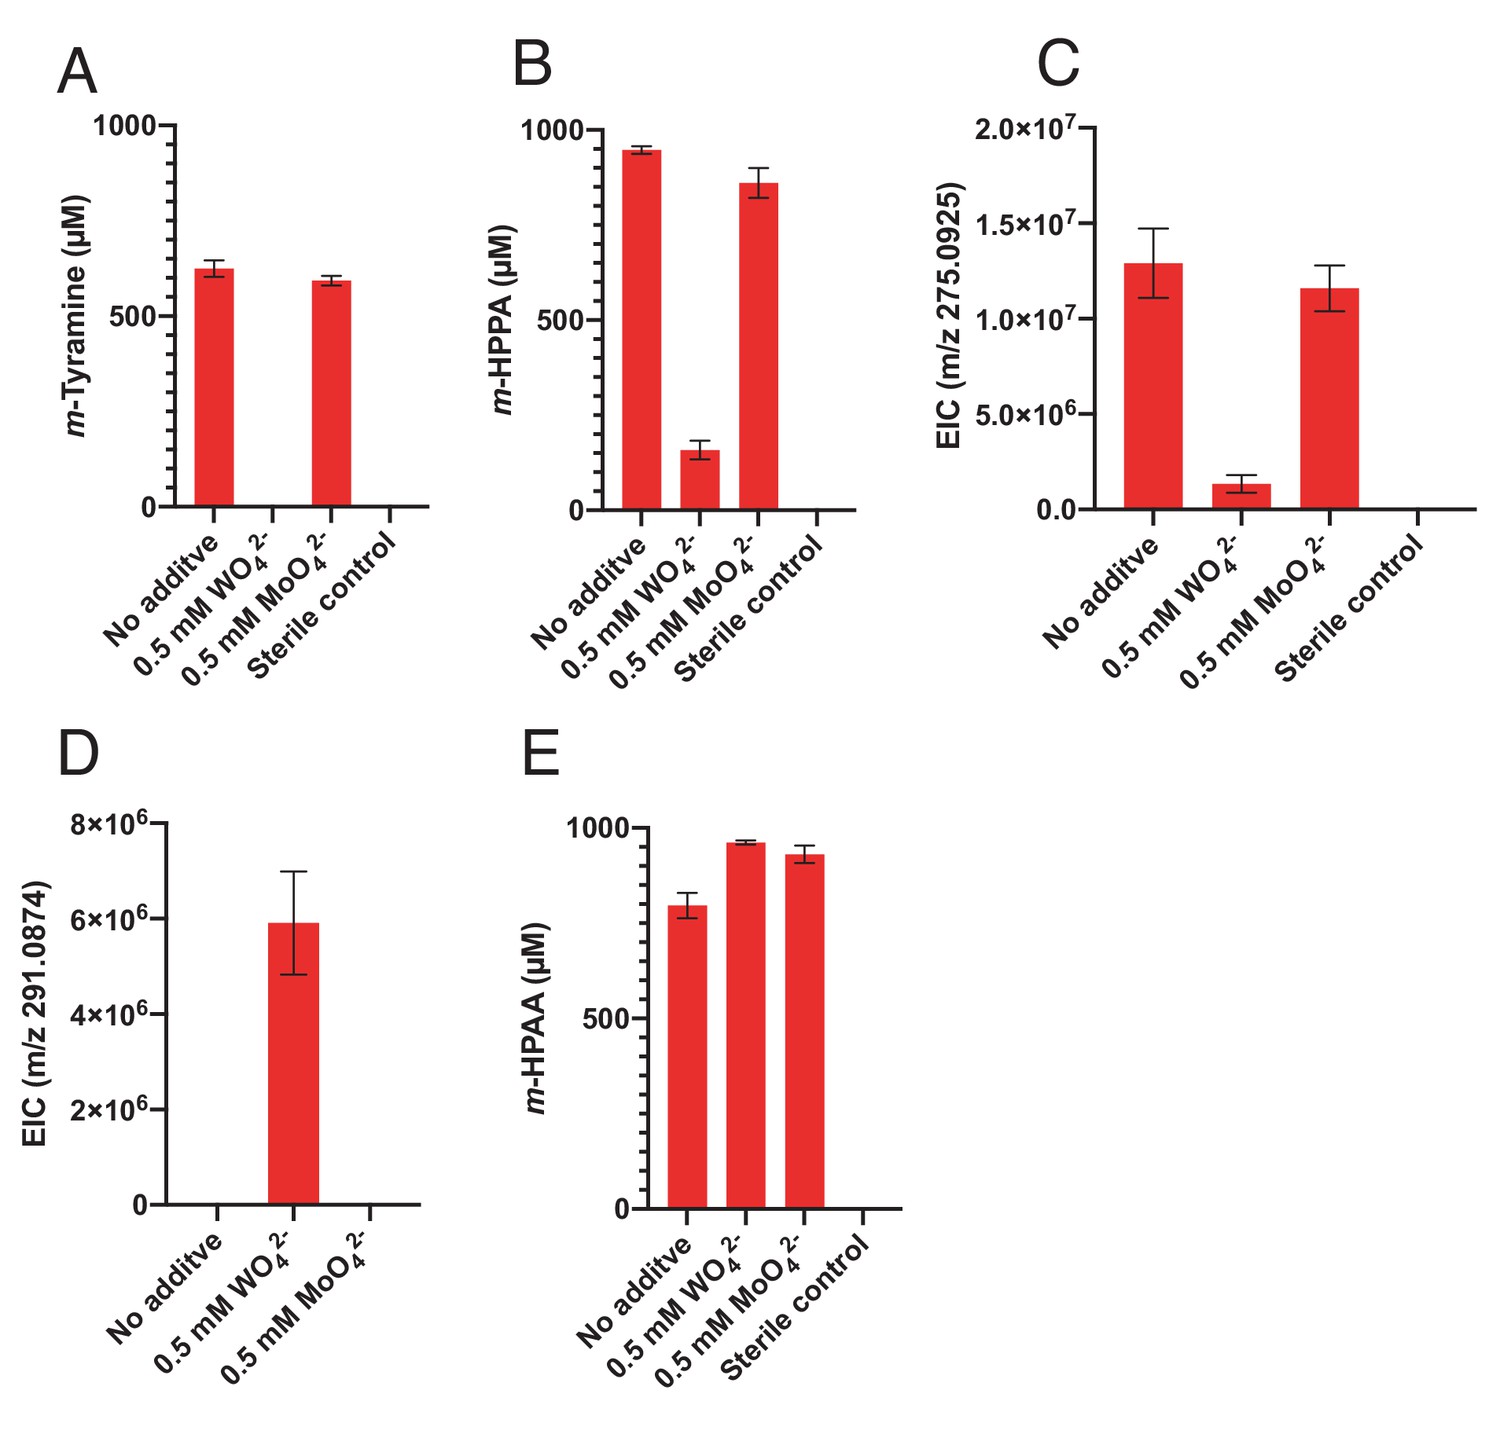
Impact of tungstate on catechol metabolism by E. lenta A2 and G. pamelaeae 3C.
(A-C) Culturing in the presence of tungstate reveals the molybdenum dependence of catechol dehydroxylation by E. lenta A2. The strain was grown anaerobically with 1 mM dopamine (A), hydrocaffeic acid (B), or (+)-catechin (C) and with 0.5 mM tungstate (WO42-) or molybdate (MoO42-) for 48 hr 37°C. Metabolites in culture supernatants were analyzed by LC-MS. Bars represent the mean ±the SEM of three biological replicates (bacterial cultures). The mass corresponding to m/z 275.0925 corresponds to the benzyl ether reduced, dehydroxylated catechin derivative. The experiment was performed twice. (D) Tungstate does not inhibit benzyl ether reduction of (+)-catechin by E. lenta A2. E. lenta was grown anaerobically in BHI at 37°C with 1 mM (+)-catechin and either molybdate (MoO42-) or tungstate (WO42-) (0.5 mM each) for 48 hr. Culture supernatants were analyzed by LC-MS/MS. Bars represent the mean ±the SEM mass peak area of the benzyl ether reduced catechin derivative (three biological replicates). Treatment of cultures with tungstate blocks dehydroxylation, thus leading to build-up of the benzyl ether reduced catechin derivative (m/z 291.0874). The experiment was performed twice. (E) Tungstate does not inhibit DOPAC dehydroxylation by G. pamelaeae 3C. G. pamelaeae 3C was grown anaerobically with 1 mM DOPAC and either tungstate (WO42-) or molybdate (MoO42-) (0.5 mM each) for 48 hr 37°C. The concentration of m-HPAA, the product of direct DOPAC dehydroxylation, in culture supernatants was analyzed by LC-MS. Bars represent the mean ±the SEM of three biological replicates (bacterial cultures). The experiment was performed twice.
Figure 4—figure supplement 4

SDS-PAGE of partially purified hydrocaffeic acid dehydroxylase from E. lenta A2.
Ladder is the Precision Plus Protein All Blue Standards (first lane from the left), while the subsequent lane represents the combined hydrocaffeic acid-dehydroxylating fractions from the size exclusion column, the last chromatography step of the activity-based purification from E. lenta A2. The band highlighted with the red asterisk was cut out, submitted for proteomics, and was confirmed to contain the hydrocaffeic acid dehydroxylase (134 kDa predicted size with TAT signal sequence; 130.5 kDa predicted size without signal sequence – see Figure 4—figure supplement 5 for coverage map and Supplementary file 2f for proteomics results).
Figure 4—figure supplement 5
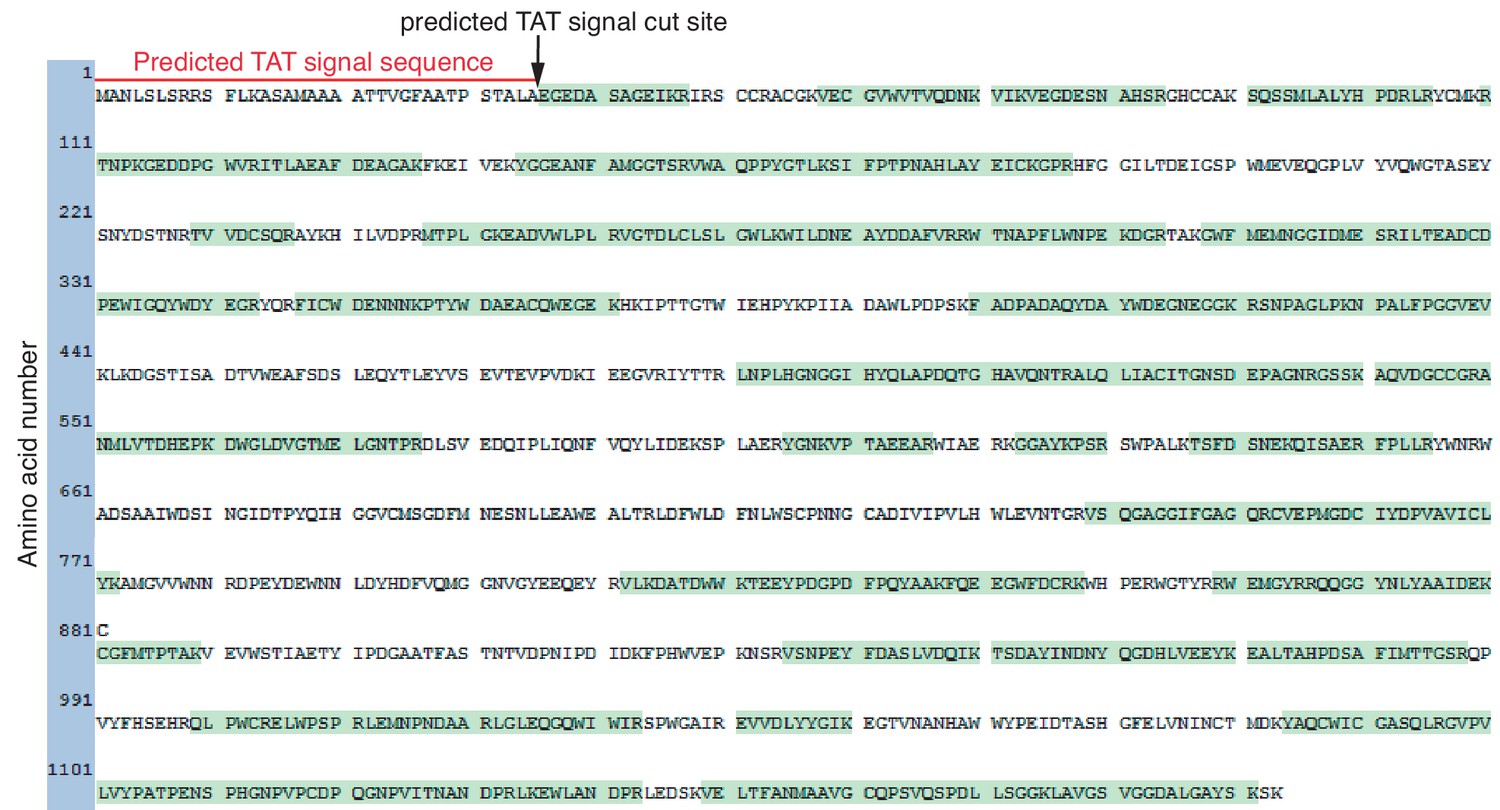
Peptide coverage of the hydrocaffeic acid dehydroxylase from E. lenta A2 from proteomics.
The band highlighted with a red asterisk in Figure 4—figure supplement 4. was cut out and subjected to proteomics analysis. The sequence is the full hydrocaffeic acid dehydroxylase sequence (Uniprot accession #A0A369MIX7), and green indicates peptides identified in the proteomics experiment that were mapped to this sequence. As expected, there was no coverage at the beginning of the peptide sequence corresponding to the predicted TAT signal sequence, suggesting that it is cleaved during protein maturation. Whereas the predicted size of the non-processed hydrocaffeic acid dehydroxylase is 133.9 kDa, the mature peptide that has undergone TAT signal sequence cleavage is expected to have a size of 130.5 kDa. The details of the proteomics are found in table Supplementary file 2f.
Figure 4—figure supplement 6
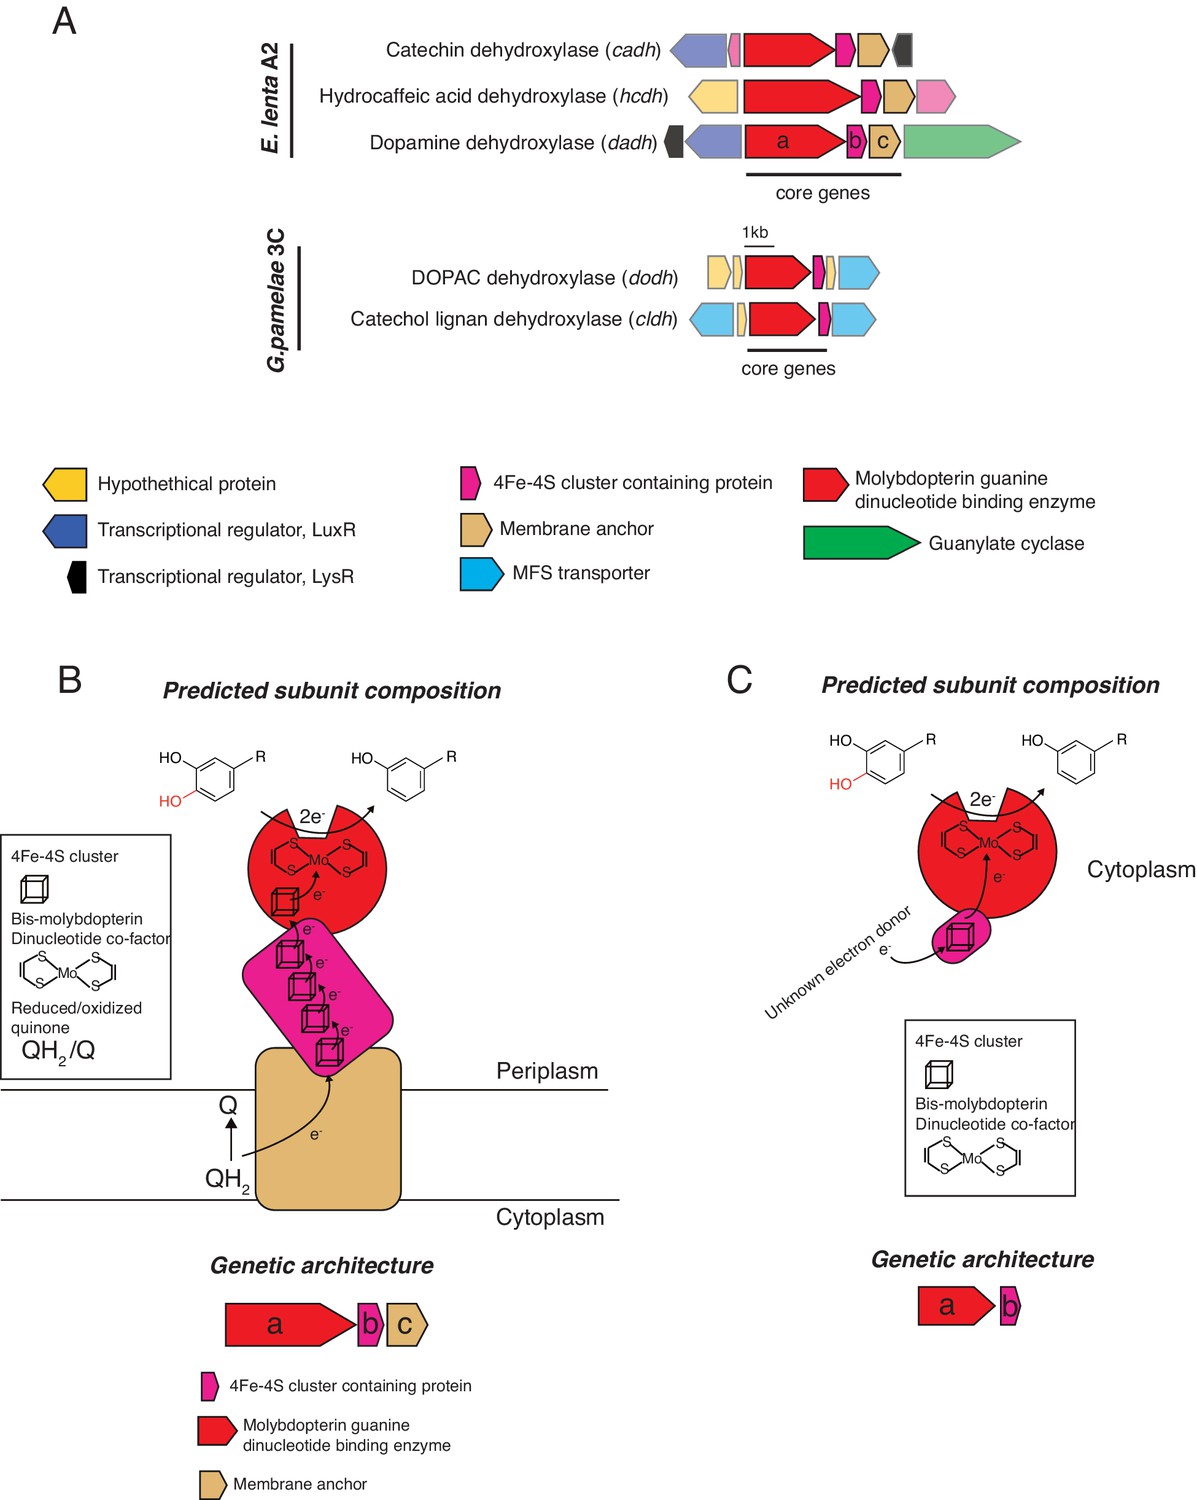
Genomic contexts and predicted subunit composition of Gordonibacter and E. lenta dehydroxylases.
(A) Genomic contexts of putative catechol dehydroxylases. Opaque ORFs encode core genes (ranging from a to c). Transparent ORFs encode genes not expected to directly participate in dehydroxylation. The E. lenta enzymes (Dadh, Hcdh, Cadh) are predicted to share similar subunit architectures. The molybdenum-dependent enzyme (a, red) associates with an electron shuttling 4Fe-4S ferredoxin (b, purple) and a membrane anchor (c, beige). In contrast, the G. pamelaeae predicted molybdenum-dependent enzymes are composed of a catalytic molybdenum subunit (a, red) and a small associated ferredoxin (b, purple). (B) Model for E.lenta dehydroxylases. The predicted catalytic molybdenum-containing subunit (a, red) is co-localized with a predicted 4Fe-4S cluster-containing protein (b, purple) and a predicted membrane anchor (c, gold) in the genome. The molybdenum-containing enzyme is also predicted to contain an N-terminal 4Fe-4S cluster. Interestingly, the molybdenum-containing enzyme carries a Twin-Arginine-Translocation (TAT) signal sequence, suggesting it is exported. There, it could form a membrane-anchored complex that receives electrons from quinone oxidation in the membrane. Electrons from quinone oxidation could move through the iron sulfur clusters of the various subunits to ultimately reduce the molybdenum cofactor that performs the 2e- reduction of the catechol substrate. (C) Model for Gordonibacter dehydroxylases. The predicted catalytic molybdenum-containing subunit (a, red) is co-localized with a 4Fe-4S cluster-containing protein (b, purple) in the genome. These enzymes are not predicted to be translocated across the periplasm as they lack the TAT signal sequence. The molybdenum cofactor-containing subunit also does not encode for a canonical 4Fe-4S cluster. In contrast to the E. lenta dehydroxylases, the Gordonibacter dehydroxylases are predicted to be free-standing as there is no membrane anchor encoded nearby. Electrons from could derive from an as-yet-unknown donor and be transferred to the iron sulfur cluster of the predicted 4Fe-4S cluster-containing protein to reduce the molybdenum cofactor that performs the 2e- reduction of the catechol substrate.
Figure 5
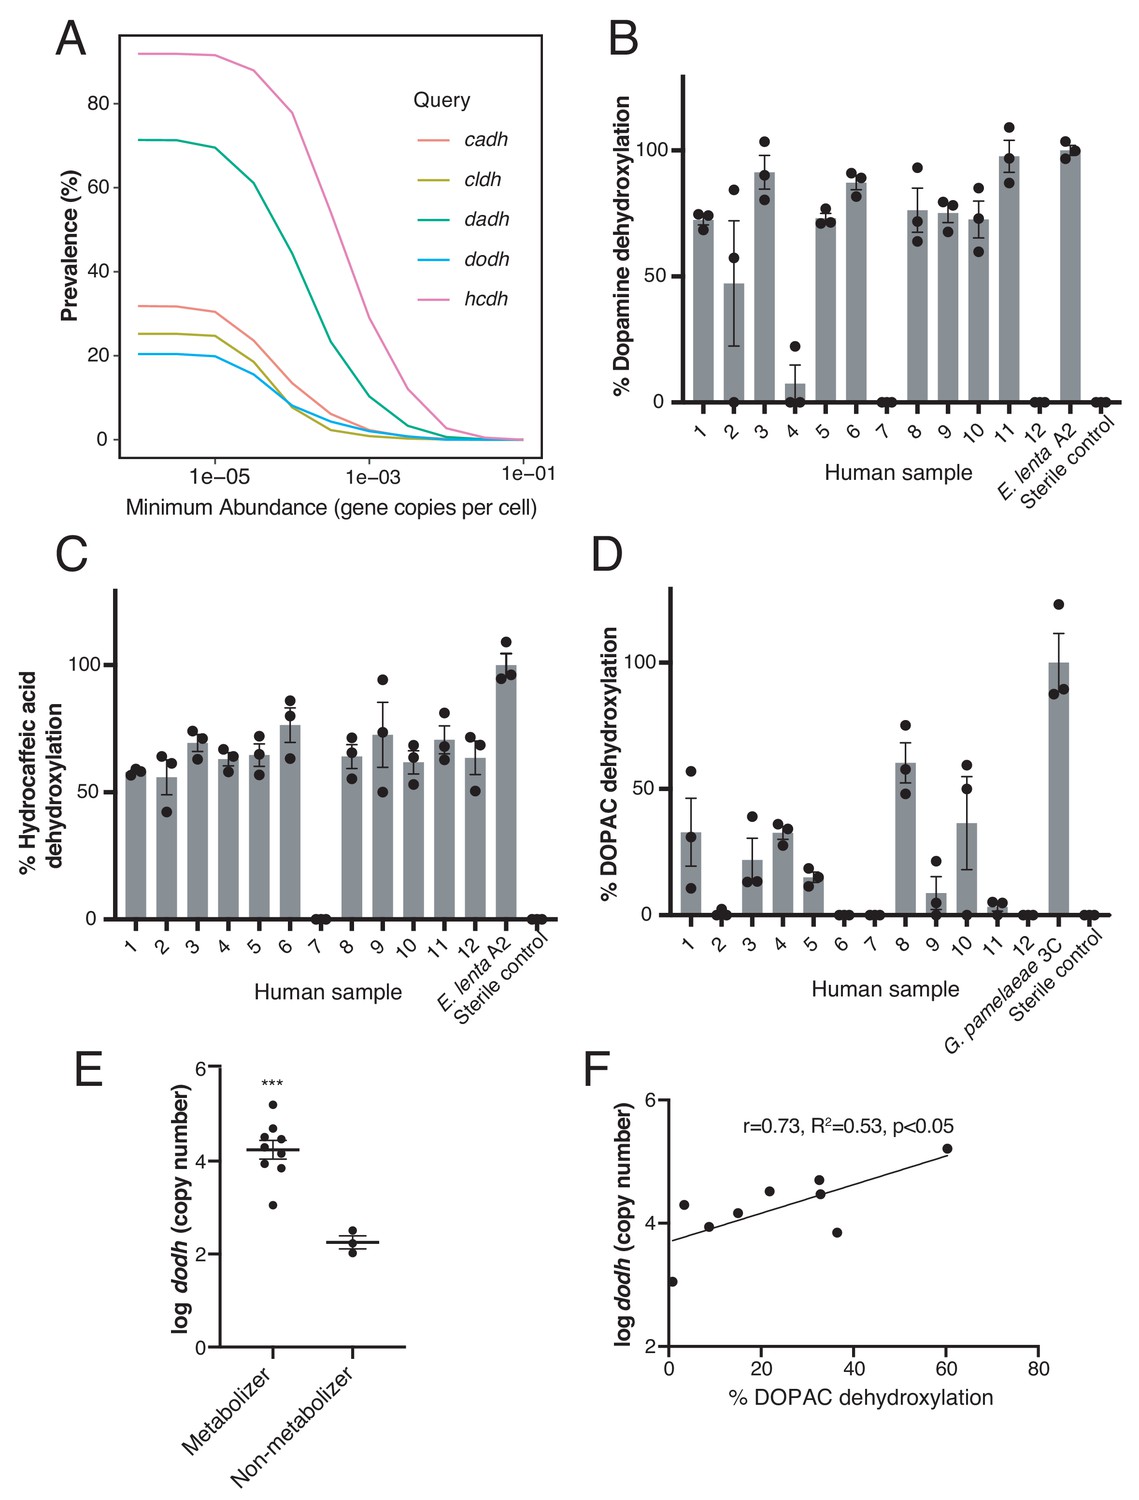
Catechol dehydroxylases are variably distributed in human gut metagenomes and correlate with metabolism by complex gut microbiota samples ex vivo.
(A) Prevalence estimates (%) as a function of minimum abundance reveals that the candidate dehydroxylases are variably distributed but prevalent in human gut metagenome samples at low relative abundances. B-D) Metabolism of d4-dopamine (B), hydrocaffeic acid (C), and d5-DOPAC (D) by 12 unrelated human gut microbiota samples ex vivo. Samples were cultured anaerobically in BHI medium with 500 µM substrate for 72 hr and metabolism was analyzed by LC-MS/MS. Bars are mean % dehydroxylation ± SEM (n = 3 independent cultures for each fecal sample). Metabolizing E. lenta A2 or G. pamelaeae 3C strains were included as positive controls. The experiment was performed once. (E) The abundance of dodh correlates with DOPAC dehydroxylation in human gut microbiota samples. Data represent the average dodh abundance (as assessed with qPCR) across the three replicates for samples in (D). Results are mean abundance ± SEM (***p<0.001, two-tailed t- test). (F) The abundance of dodh among metabolizers correlates with DOPAC dehydroxylation. The data plotted represent the average dodh abundance (as assessed with qPCR) and the average % dehydroxylation across the three replicates for metabolizing samples in (D) (all samples except 6,7, and 12). The line represents the best-fit trendline for linear regression. There was a significant linear correlation between dodh abundance and % DOPAC dehydroxylation (Pearson’s correlation, r = 0.73, R2 = 0.53, p<0.05). All data can be found in Figure 5—source data 1.
-
Figure 5—source data 1
Data from incubations of human fecal samples with catechols (Figure 5).
- https://cdn.elifesciences.org/articles/50845/elife-50845-fig5-data1-v1.xlsx
Figure 6
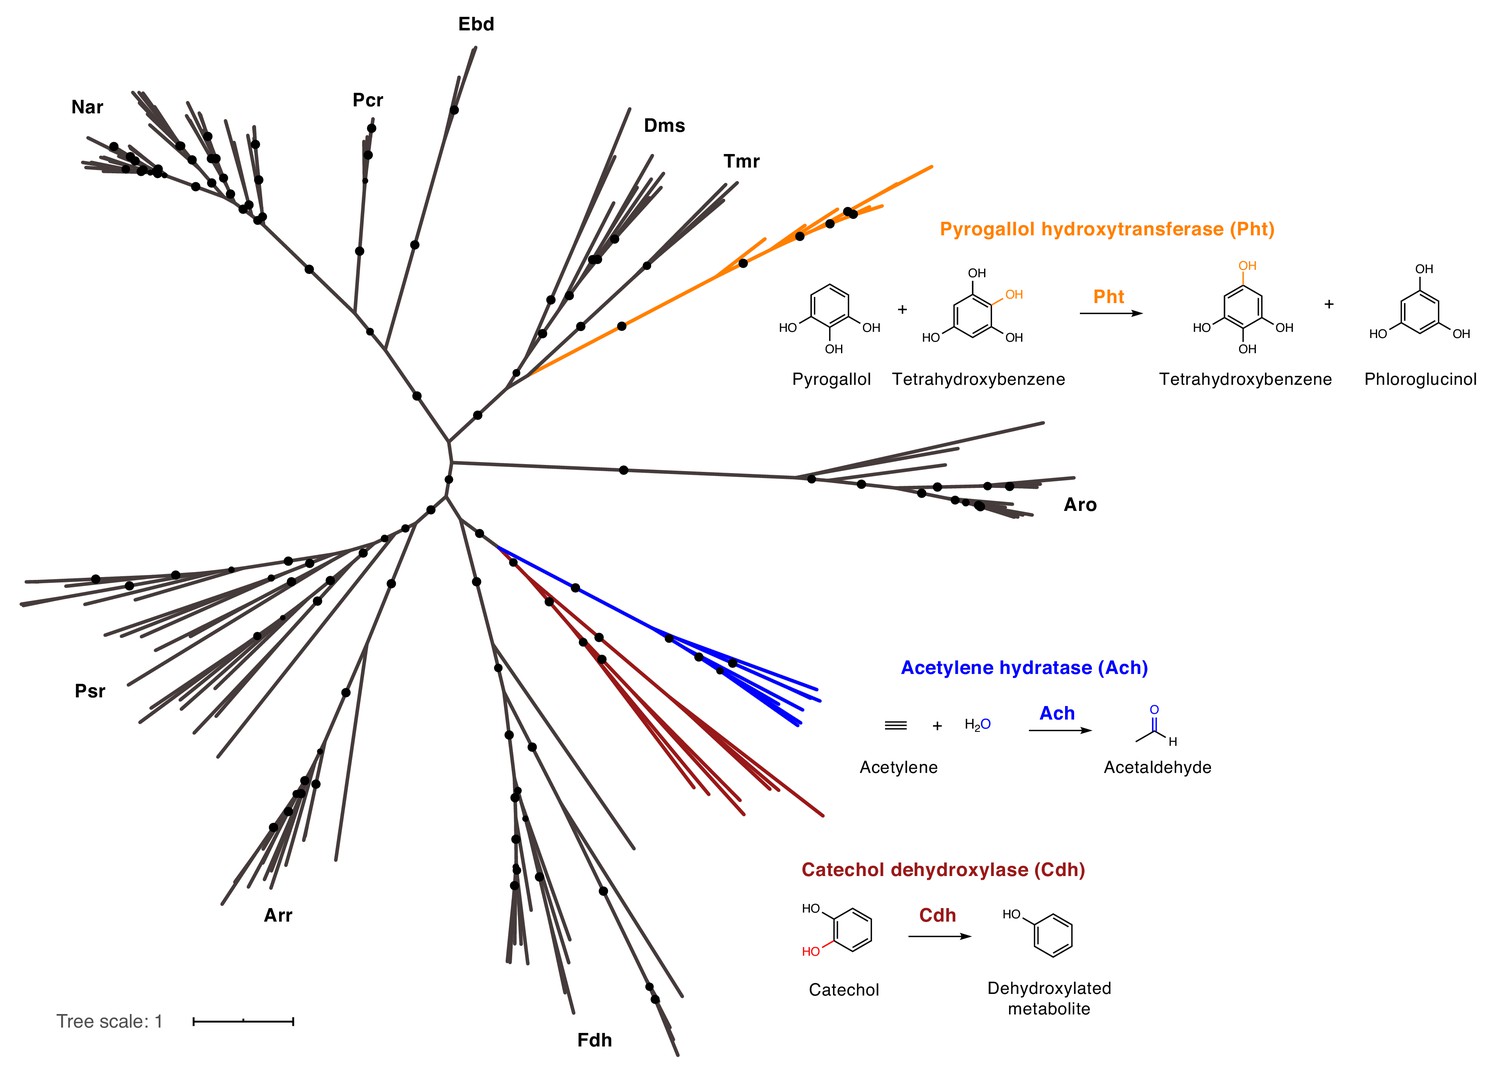
Catechol dehydroxylases are distinct from other molybdenum-dependent enzymes.
Phylogenetic analysis of newly discovered catechol dehydroxylases reveals a unique evolutionary origin and relationship to acetylene hydratase. Psr = polysulfide reductase; Arr = arsenate reductase; Fdh = formate dehydrogenase; Pht = phloroglucinol transhydroxylase; Dms = DMSO reductase; Tmr = TMAO reductase; Aro = arsenite oxidase; Ebd = ethylbenzene dehydrogenase; Pcr = perchlorate reductase; Nar = nitrate reductase; Cdh = catechol dehydroxylase. The maximum likelihood tree was constructed using sequences from Schoepp-Cothenet et al. (2012) as well as additional family members and reproduced the previously reported phylogeny of this enzyme family. Black circles on branches indicate bootstrap values greater than 0.7. Alignment and tree files can be found in Figure 6 alignment.fasta and Figure 6 tree file.nex, respectively.
-
Figure 6—source data 1
Alignment file for bis-MGD family tree (Figure 6).
- https://cdn.elifesciences.org/articles/50845/elife-50845-fig6-data1-v1.txt
-
Figure 6—source data 2
Tree file for bis-MGD family tree (Figure 6).
- https://cdn.elifesciences.org/articles/50845/elife-50845-fig6-data2-v1.txt
Figure 7 with 4 supplements
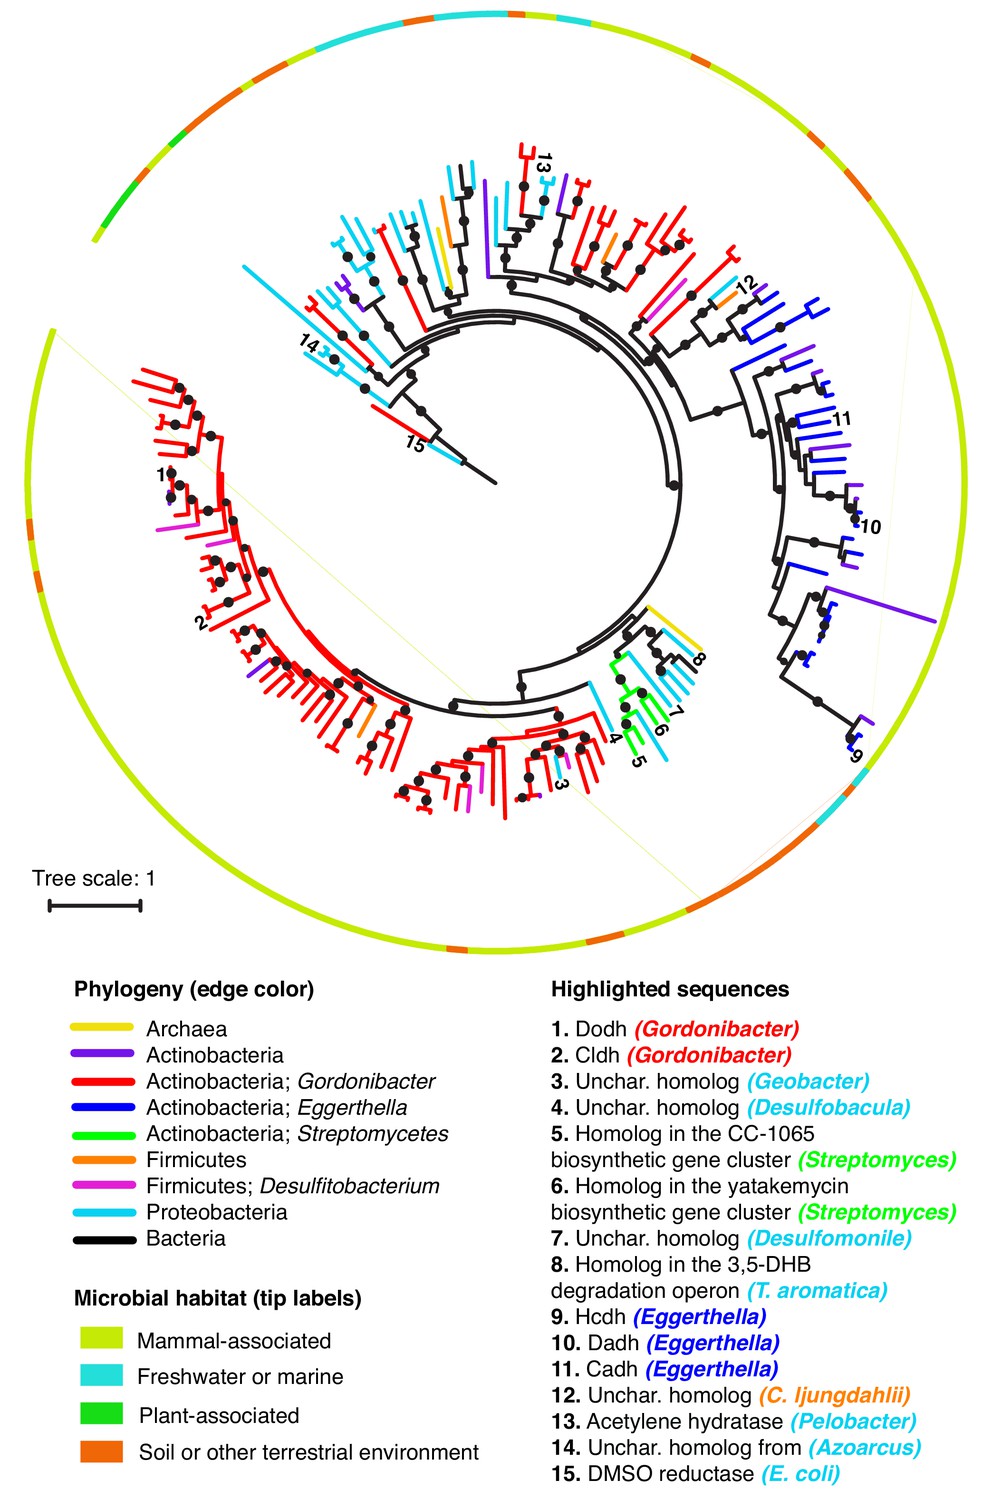
Catechol dehydroxylases are widely distributed across sequenced microbes.
Maximum likelihood phylogenetic tree for catechol dehydroxylase homologs identified by querying 26 gut Actinobacterial genomes (Bisanz et al., 2018) and the NCBI nucleotide collection for Dadh and Cldh homologs (see Materials and methods for details). The color of the lines indicates the phylogeny of the organism harboring the homolog. The color of the border indicates the primary habitat from which the organism was originally isolated. Numbers at the end of the branches indicate highlighted sequences, which are specified in the legend above. Unchar. stands for uncharacterized. The color of the organism matches the phylogeny of the organism. DMSO reductase from E. coli (sequence #15) was used as an outgroup to root the tree. All of the sequences highlighted in the figure in the figure are mentioned in the main text. Black circles on branches indicate bootstrap values greater than 0.7. Alignment and tree files can be found in Figure 7 alignment.fasta and Figure 7 tree file.newick, respectively.
-
Figure 7—source data 1
Alignment file for tree displaying catechol dehydroxylase diversity and distributionamong sequenced microbes (Figure 7).
- https://cdn.elifesciences.org/articles/50845/elife-50845-fig7-data1-v1.txt
-
Figure 7—source data 2
Tree file for tree displaying catechol dehydroxylase diversity and distribution among sequenced microbes (Figure 7).
- https://cdn.elifesciences.org/articles/50845/elife-50845-fig7-data2-v1.txt
Figure 7—figure supplement 1

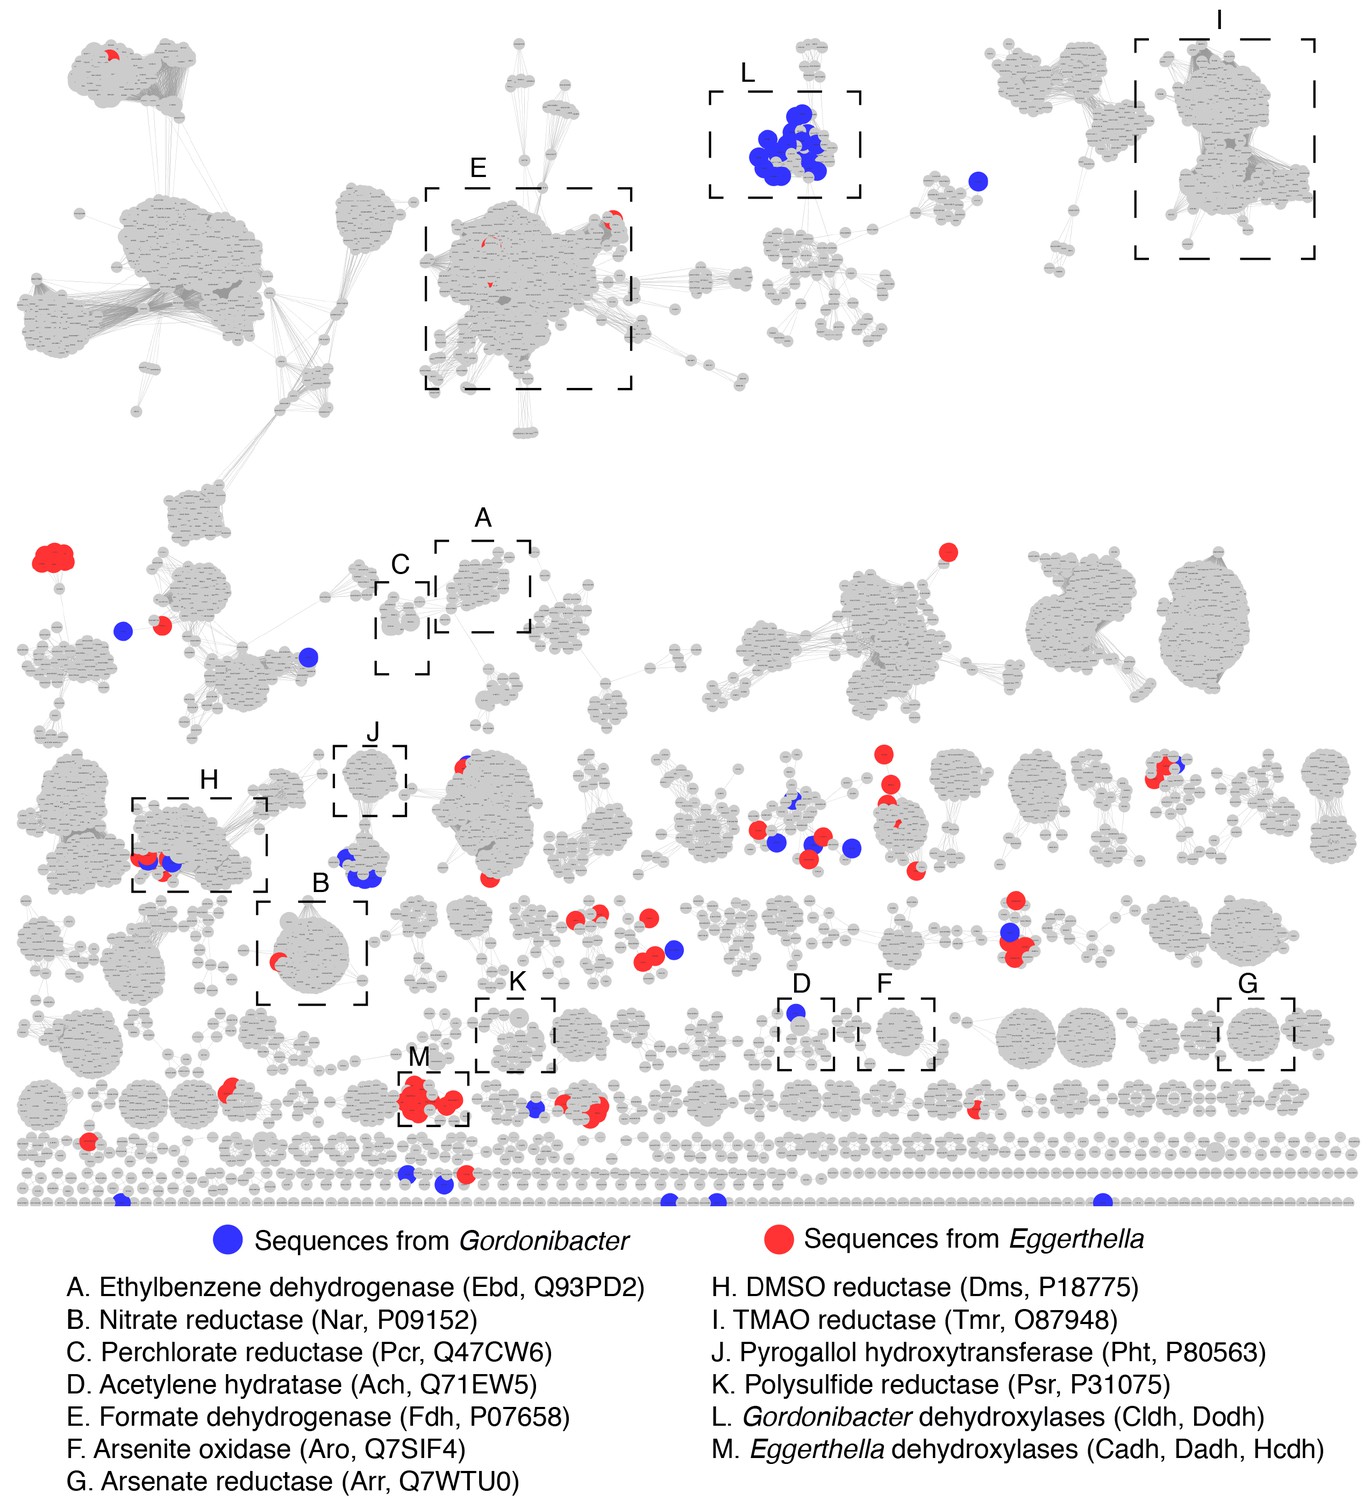
Sequence similarity network of the bis-MGD enzyme family reveals that the Gordonibacter and Eggerthella dehydroxylases belong to distinct, uncharacterized clusters.
The SSN was constructed using molybdopterin dinucleotide binding domain enzyme superfamily (PF01568) from Uniprot. Nodes represent proteins with 75% sequence identity. SSN displayed with an e-value threshold of 10−167. Clusters containing the representative biochemically characterized enzymes included in the phylogenetic analysis presented in Figure 6 are indicated with black boxes (a cluster includes all connected nodes). Clusters with blue nodes contain the dehydroxylases identified in this study. Red nodes represent sequences that have been reviewed in the Uniprot database and have been annotated with evidence for their function at the genetic, transcriptional, or biochemical level. ∫.
Figure 7—figure supplement 2
Sequence similarity network of the bis-MGD enzyme family reveals that Gordonibacter and Eggerthella bis-MGD enzymes are widely distributed across the enzyme family.
The SSN is the exact same as the one presented in Figure 7—figure supplement 1. Clusters containing the biochemically characterized enzymes included in the phylogenetic analysis presented in Figure 6 as well as the candidate dehydroyxlases in our study are indicated with black boxes (a cluster includes all connected nodes). Red nodes represent sequences from Eggerthella, while blue nodes represent sequences from Gordonibacter. This network indicates that the clustering does not simply reflect the phylogeny of the host organisns as Gordonibacter and Eggerthella enzymes are widely distributed acress the network.
Figure 7—figure supplement 3

Phylogenetic analysis of representative catechol dehydroxylase homologs highlighting sequences included in further analyses.
This phylogenetic tree is the same as in Figure 7 in the main text. However, here the numbers indicate homologs that were selected as representative sequences across the tree for further phylogenetic analysis. The accession numbers of these sequences can be found in Supplementary file 3c.
Figure 7—figure supplement 4

Phylogenetic analysis of putative catechol dehydroxylase sequences from diverse bacterial phyla reveals a relationship with the biochemically characterized molybdenum-dependent enzyme acetylene hydratase.
The representative sequences from Figure 7—figure supplement 3 were added to the tree containing biochemically characterized members of the bis-MGD enzyme family (see main text Figure 6). Psr = polysulfide reductase; Arr = arsenate reductase; Fdh = formate dehydrogenase; Pht = phloroglucinol transhydroxylase; Dms = DMSO reductase; Tmr = TMAO reductase; Aro = arsenite oxidase; Ebd = ethylbenzene dehydrogenase; Pcr = perchlorate reductase; Nar = nitrate reductase. Black circles on branches indicate bootstrap values greater than 0.7. This analysis revealed that all of these representative catechol dehydroxylase homologs are more closely related to each other and the acetylene hydratase sequences than they are to any other biochemically characterized bis-MGD enzyme family member. Acetylene hydratases are shown in blue and the representative sequences selected from Figure 7—figure supplement 3 are shown in black.
Figure 8 with 1 supplement
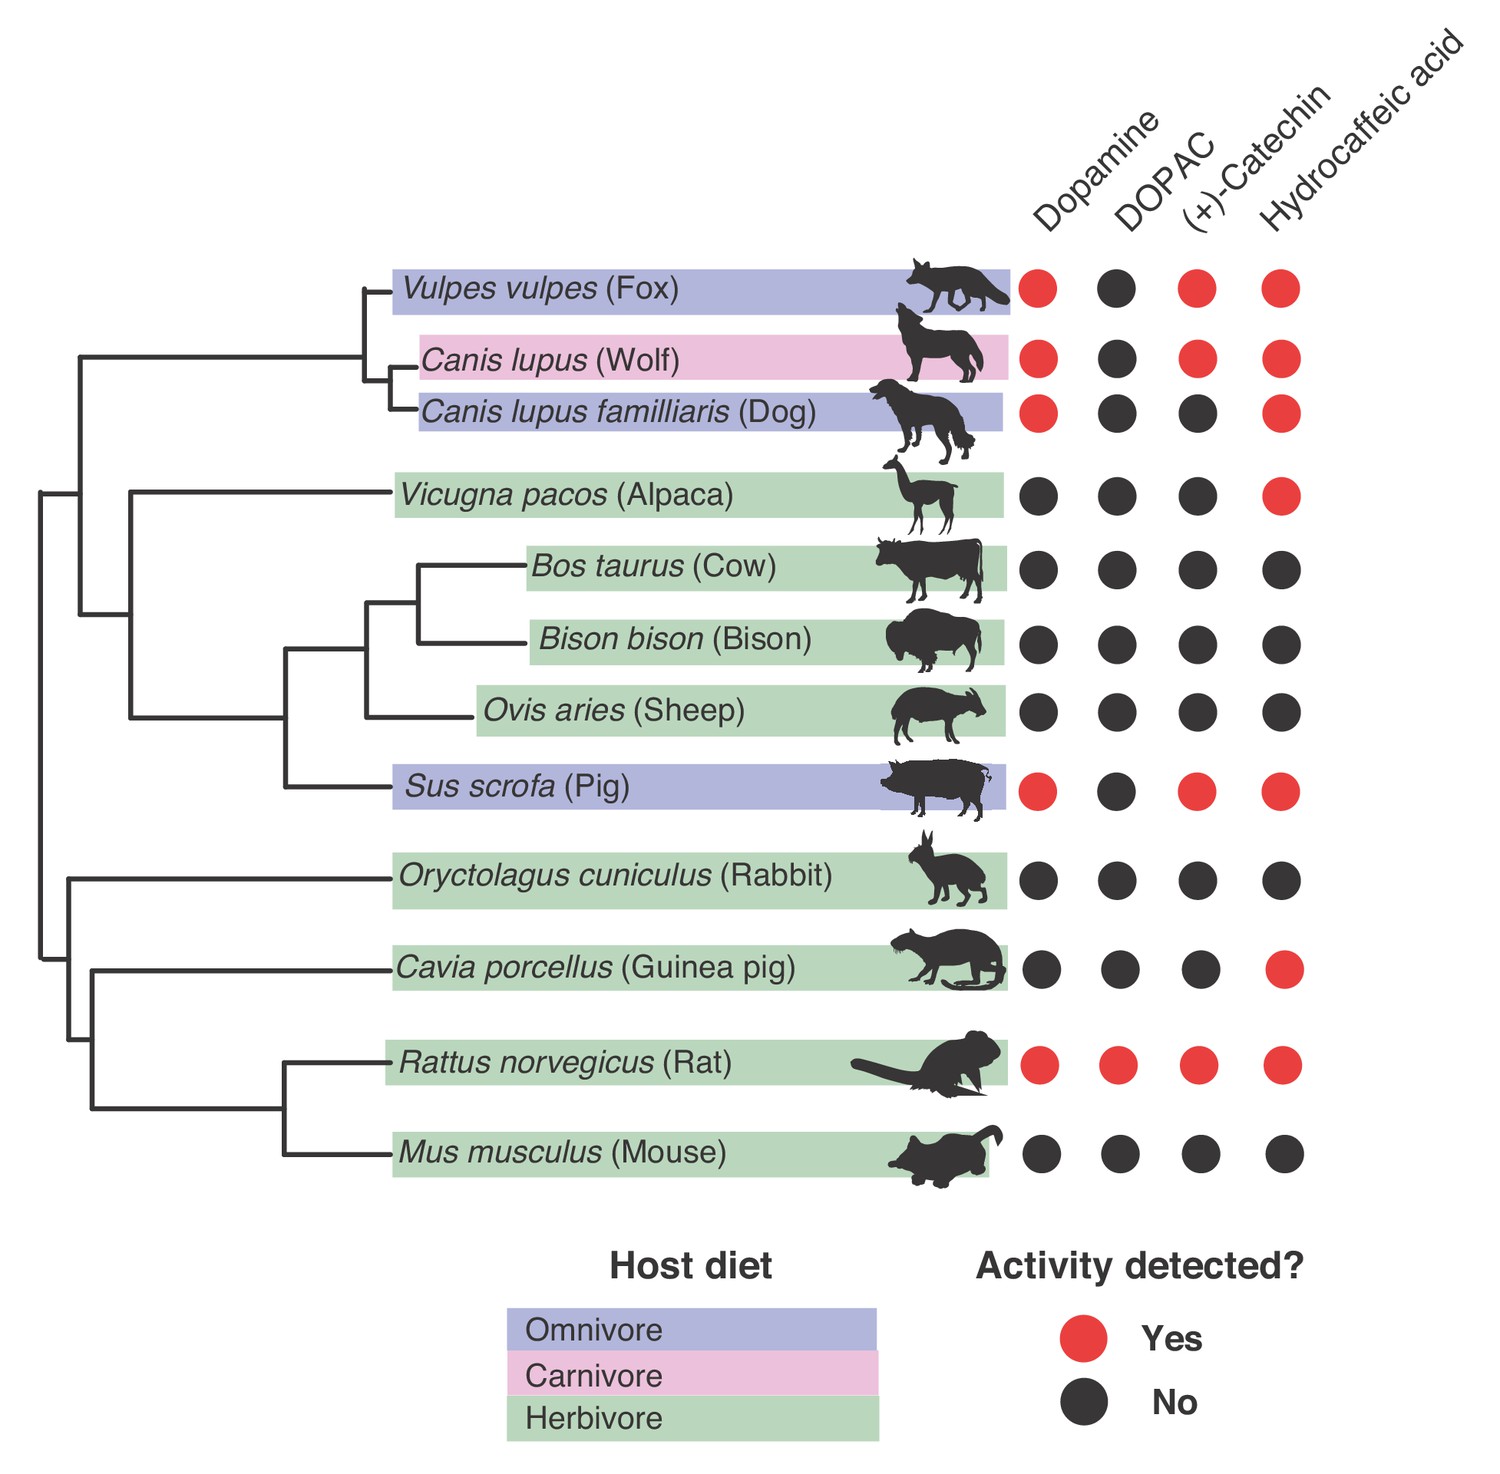
Gut microbiotas of mammals representing distinct diets and phylogenetic origins can dehydroxylate catechols.
Catechol dehydroxylation of dopamine, DOPAC, (+)-catechin, and hydrocaffeic acid by gut microbiota samples from mammals spanning distinct diets and phylogenetic groups. Gut communities from 12 different mammals and three individuals per animal were cultured anaerobically for 96 hr in basal medium with 0.5 mM catechol at 37°C. The results summarize animals and individuals where the known dehydroxylation pathways examined in human gut Actinobacteria took place, as assessed by LC-MS/MS. Red indicates that metabolism took place in at least one of the individuals, and black indicates lack of metabolism, as assessed by the detection of the dehydroxylated metabolite using LC-MS/MS. The experiment was performed once. The phylogenetic tree was created using the aptg plugin in R and missing branches were added manually based on mammalian phylogeny. The icons were adapted under a Creative Commons license (https://creativecommons.org/licenses/by/3.0/) at phylopic (http://phylopic.org), including Alpaca logo (made my Steven Traver), Bison (Lukasiniho). Cow (Steven Traver), Dog (Tracy A Heath), Fox (Anthony Caravaggi), Guinea pig (Zimices), Mouse (Madeleine Price Ball), Pig (Steven Traver), Rabbit (Steven Traver), Rabbit (Steven Traver), Rat (Rebecca Groom), Sheep (Zimices), and Wolf (Tracy A Heath). All data can be found in Figure 8—source data 1.
-
Figure 8—source data 1
Screen for catechol metbabolism by mammalian gut microbiota samples (Figure 8).
- https://cdn.elifesciences.org/articles/50845/elife-50845-fig8-data1-v1.xlsx
Figure 8—figure supplement 1
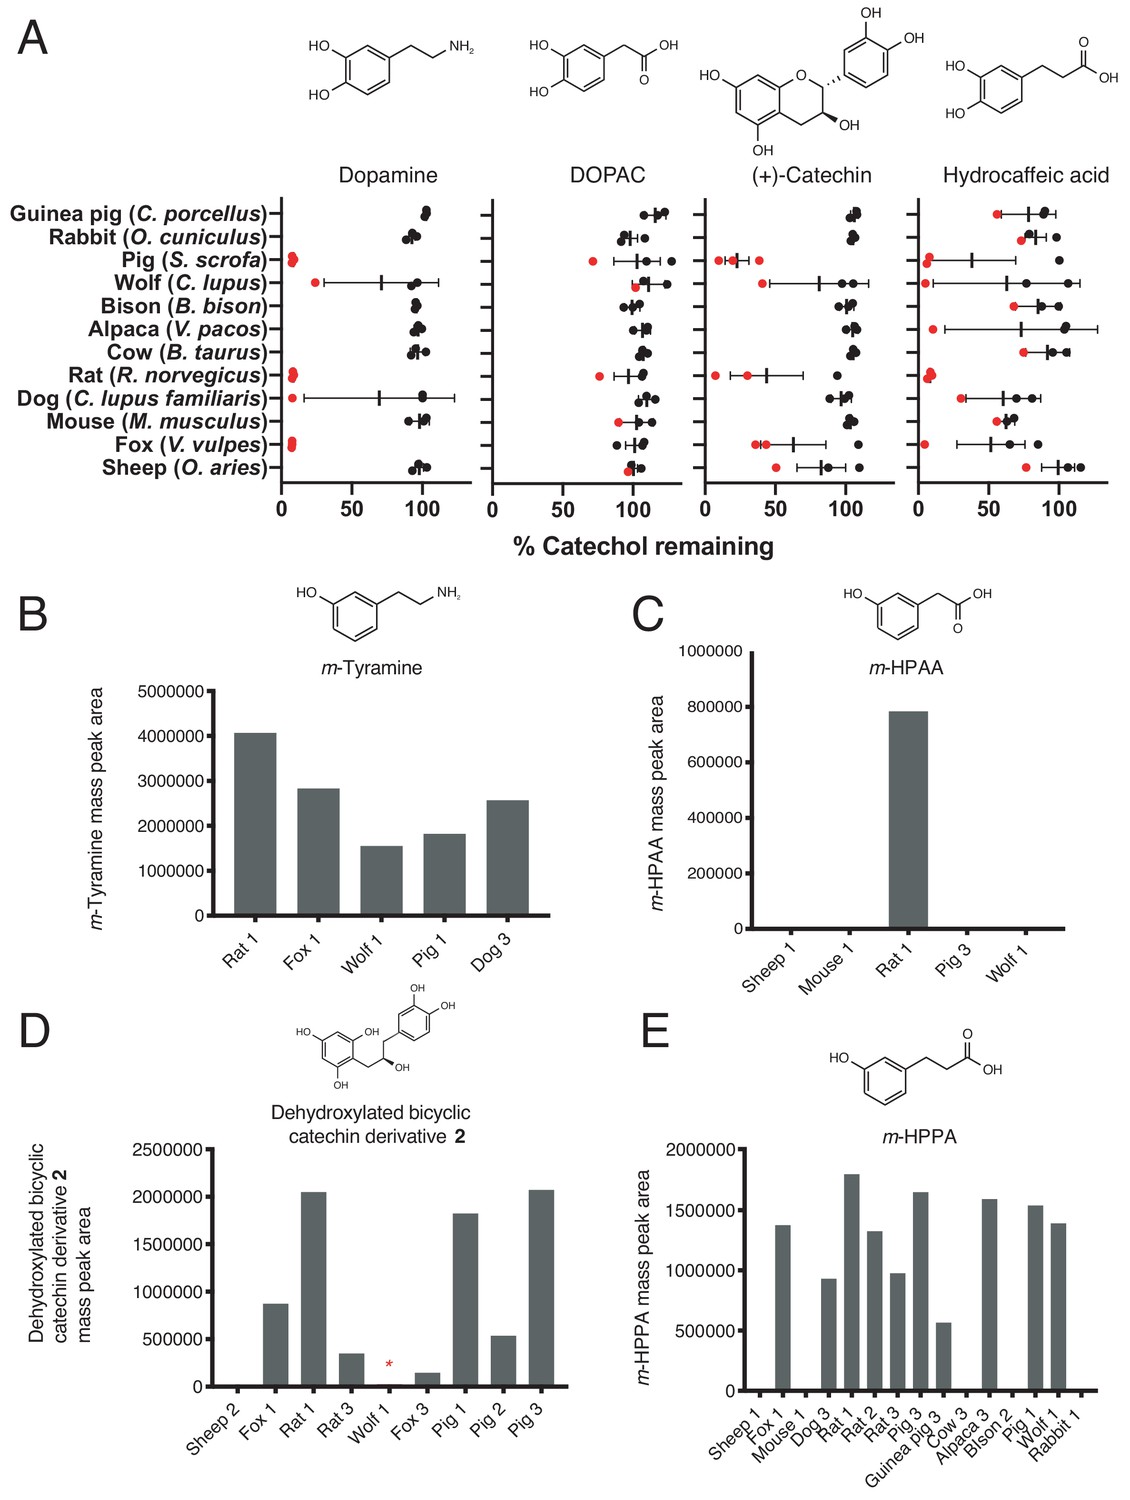
Screen for catechol dehydroxylation by gut microbiota samples from diverse mammals.
(A) Dehydroxylation of dopamine, DOPAC, (+)-catechin, and hydrocaffeic acid by gut microbiota samples from mammals spanning distinct diets and phylogenetic groups. Gut communities from n = 12 different mammals and n = 3 individuals per animal were cultured anaerobically for 96 hr in basal medium with 0.5 mM catechol at 37°C. Metabolism was then assessed using a colorimetric assay for catechol detection. Data were normalized to the sterile control. Each dot represents a different individual for each animal, and the red color indicates samples that were selected for further LC-MS/MS analysis. Bars display the mean and standard deviation. (B) m-Tyramine mass peak area in select mammalian gut microbiota samples incubated with dopamine and selected for LC-MS/MS analysis. Samples that displayed catechol depletion in A) performed dehydroxylation of dopamine. (C) m-HPAA mass peak area in select mammalian gut microbiota samples incubated with DOPAC and selected for LC-MS/MS analysis. Only the rat microbiota (individual 1) had activity towards DOPAC. (D) Dehydroxylated catechin derivative mass peak area in select mammalian gut microbiota samples incubated with (+)-catechin and selected for LC-MS/MS analysis. All samples selected for further analysis except the sheep microbiota displayed the full two-step conversion of (+)-catechin into the dehydroxylated derivative. The red asterisk indicates that the wolf microbiota had activity based on LC-MS/MS even though the mass peak area was lower than what is clearly visible with the current scale of the Y-axis. (E) C) m-HPPA mass peak area in select mammalian gut microbiota samples incubated with hydrocaffeic acid and selected for LC-MS/MS analysis. The screen for metabolism of all compounds across the animals was performed once. All data can be found in Source data – Figure 8.
Appendix 1—scheme 1
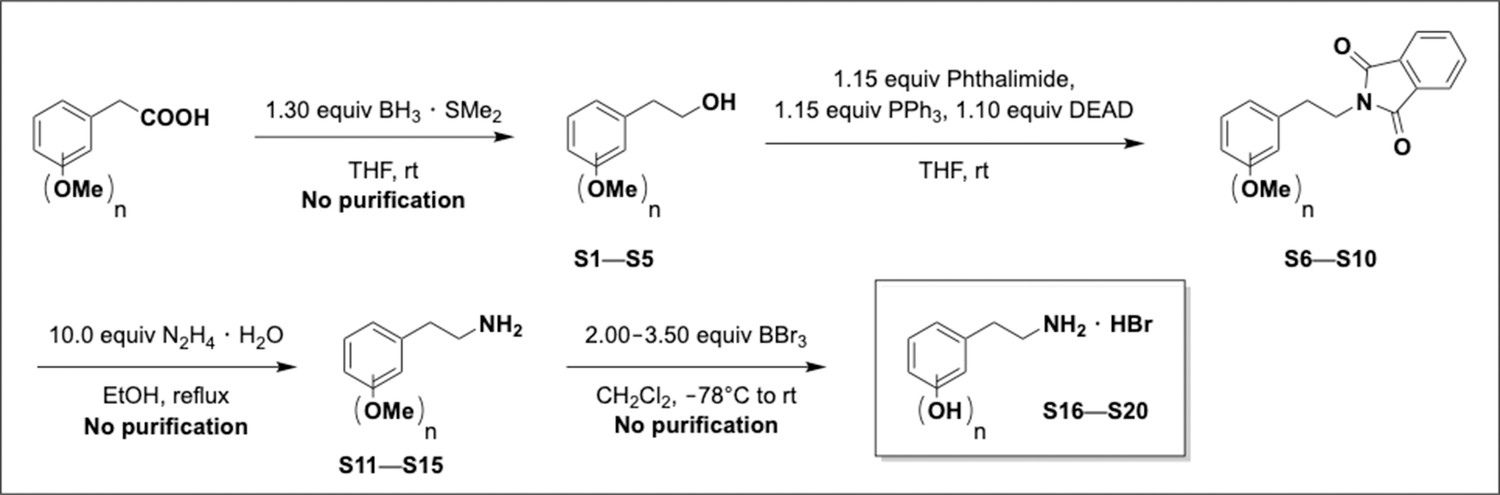
Preparation of 2-phenylacetic acid derivatives.
Appendix 1—scheme 2
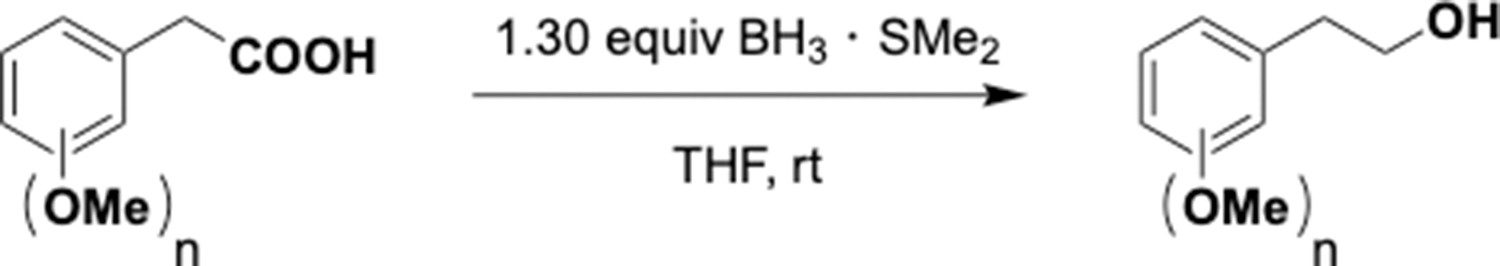
Reduction of benzyl carboxylic acids.
Appendix 1—chemical structure 1
Dimethoxyphenethyl alcohol (S1).
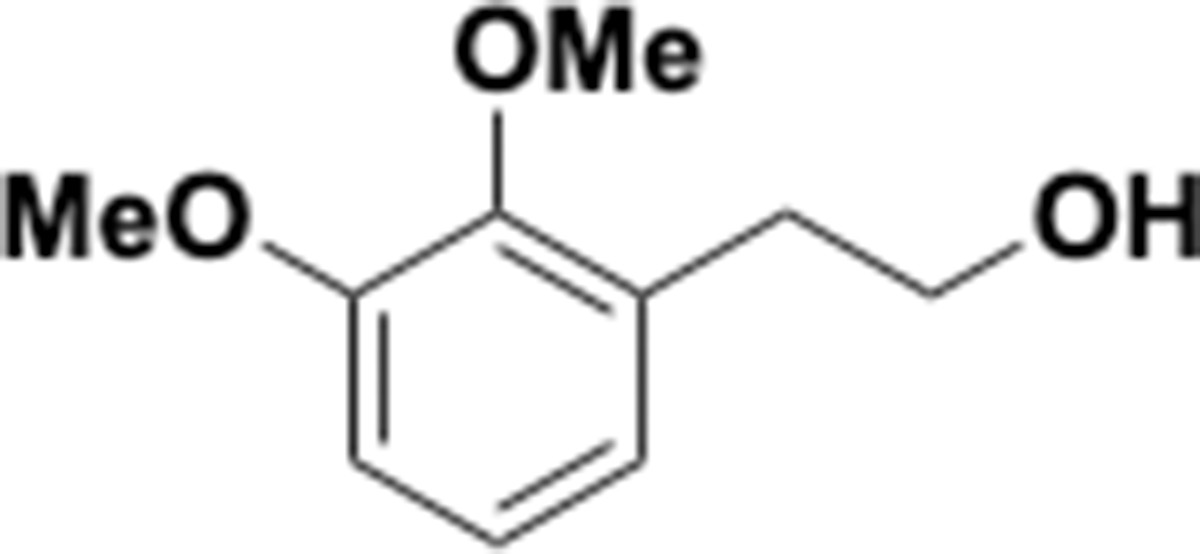
Appendix 1—chemical structure 2
Dimethoxyphenethyl alcohol (S2).
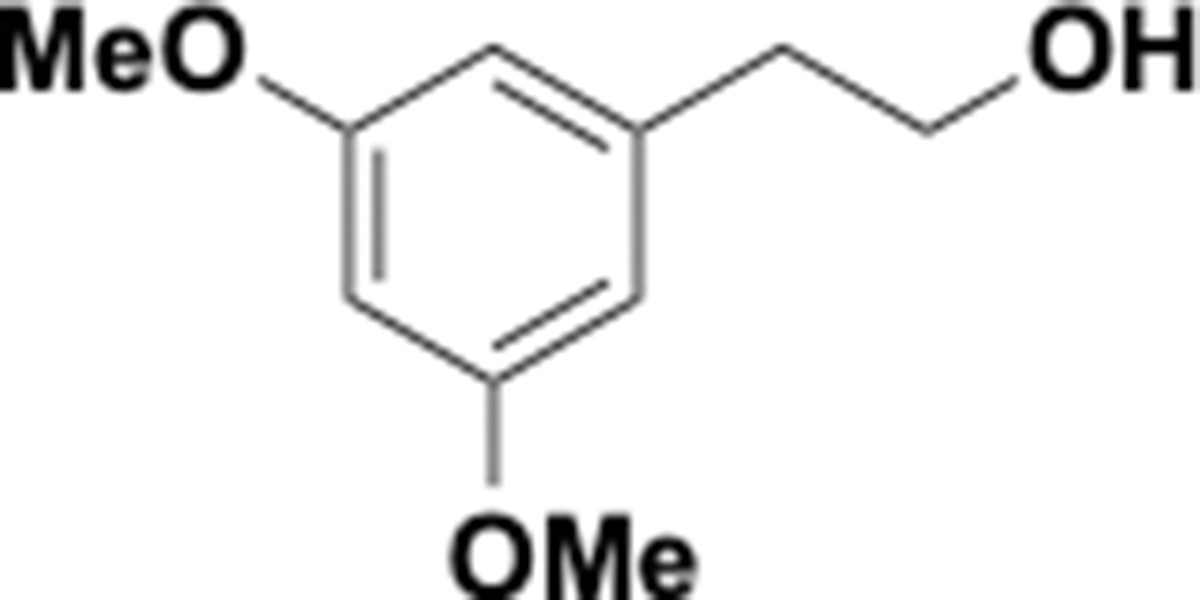
Appendix 1—chemical structure 3

Dimethoxyphenethyl alcohol (S3).
Appendix 1—chemical structure 4
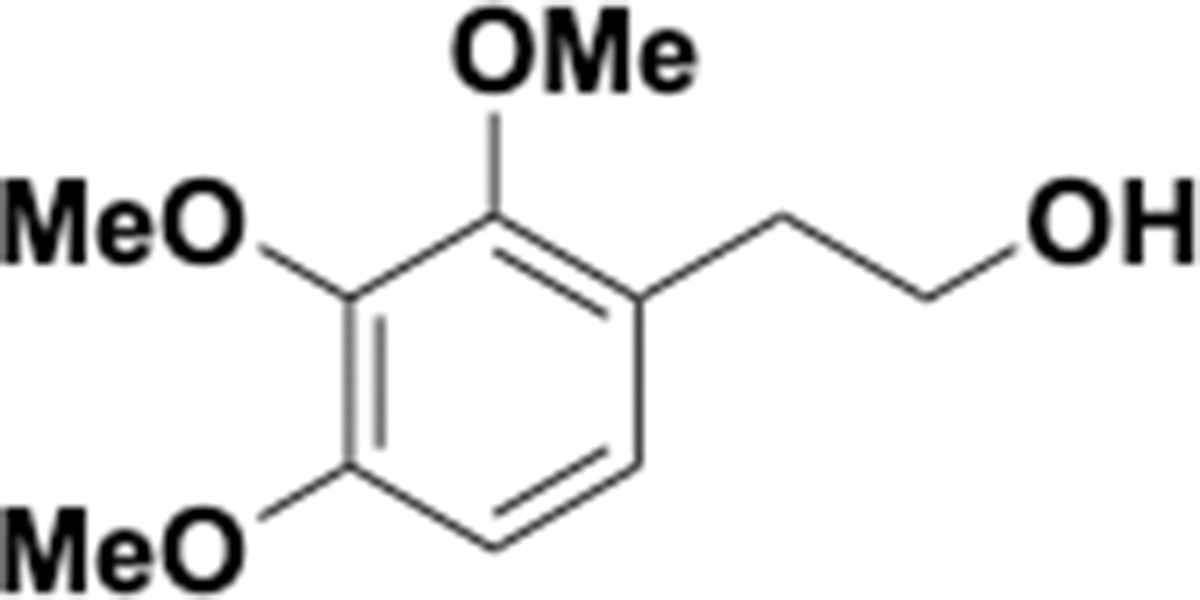
Trimethoxyphenethyl alcohol (S4).
Appendix 1—chemical structure 5
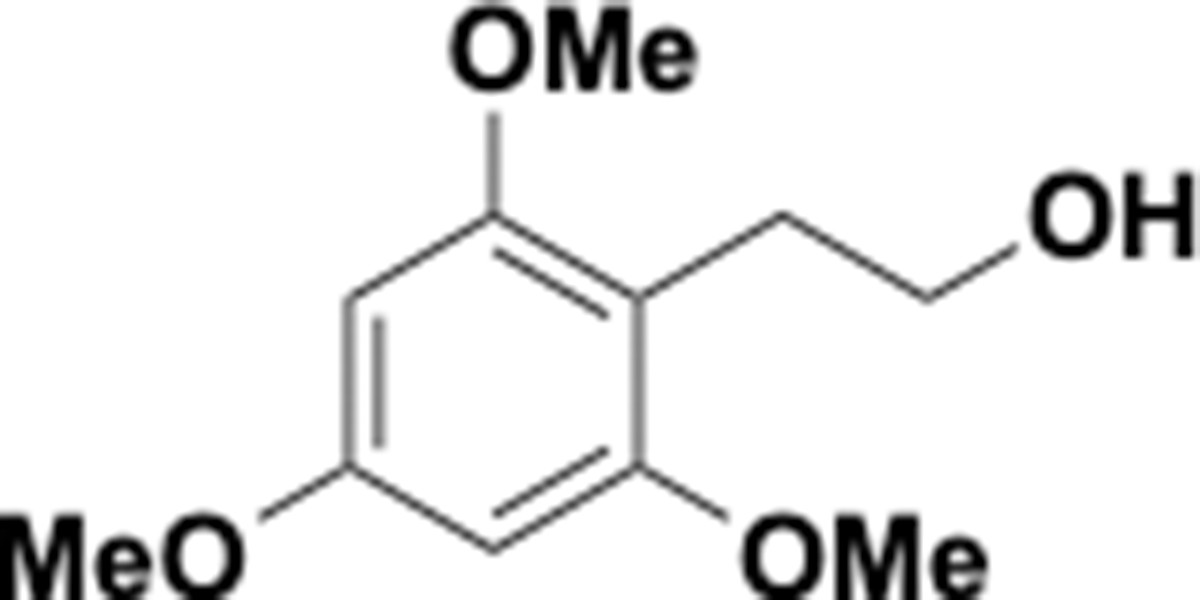
Trimethoxyphenethyl alcohol (S5).
Appendix 1—scheme 3
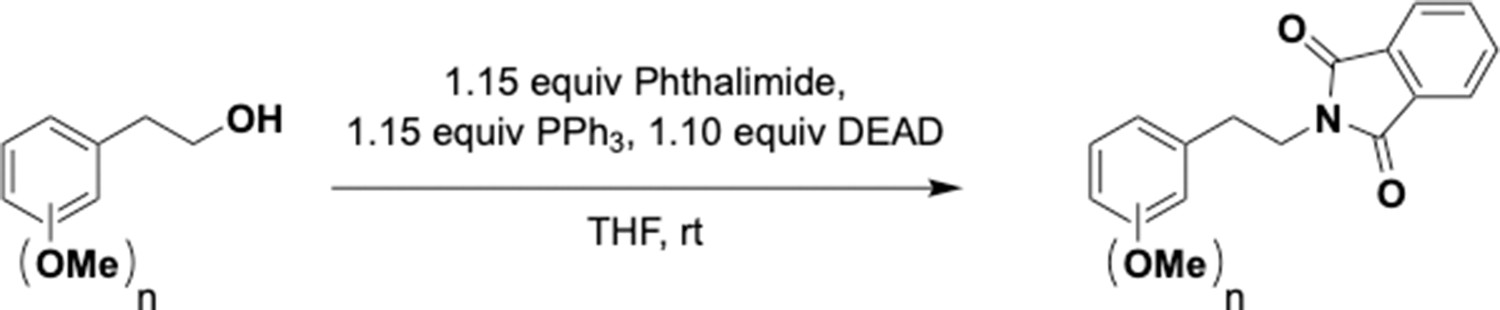
Mitsunobu reaction on phenethyl alcohols.
Appendix 1—chemical structure 6
Dimethoxyphenethyl phthalimide (S6).
Appendix 1—chemical structure 7
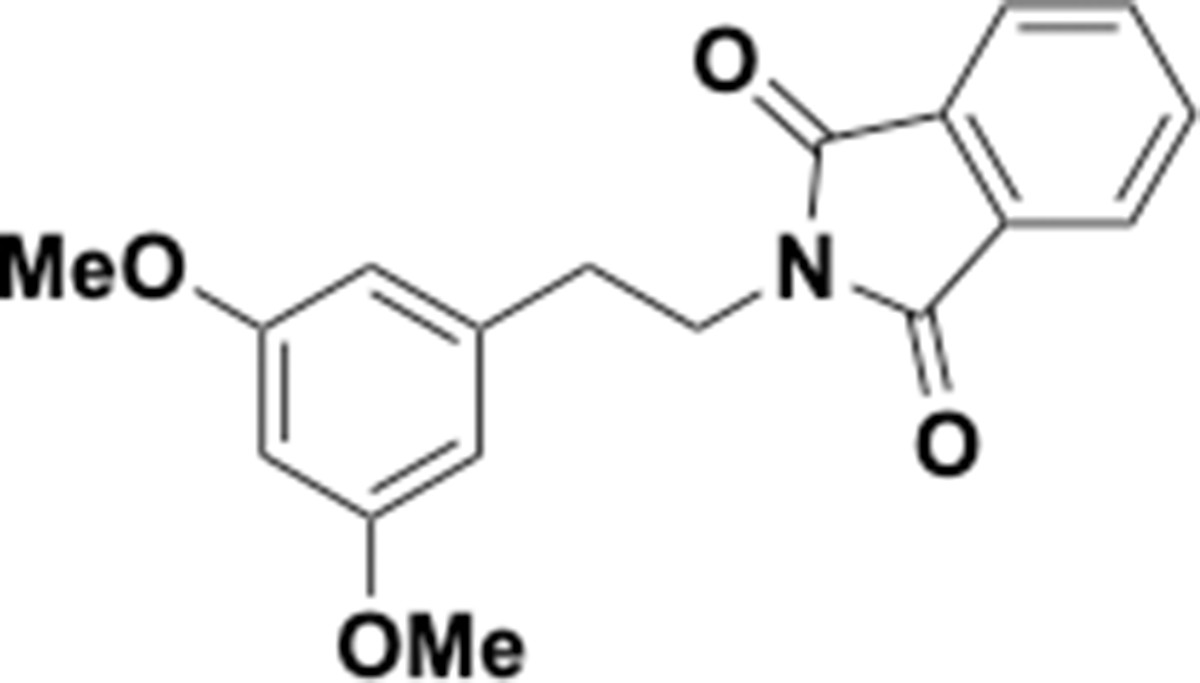
Dimethoxyphenethyl phthalimide (S7).
Appendix 1—chemical structure 8
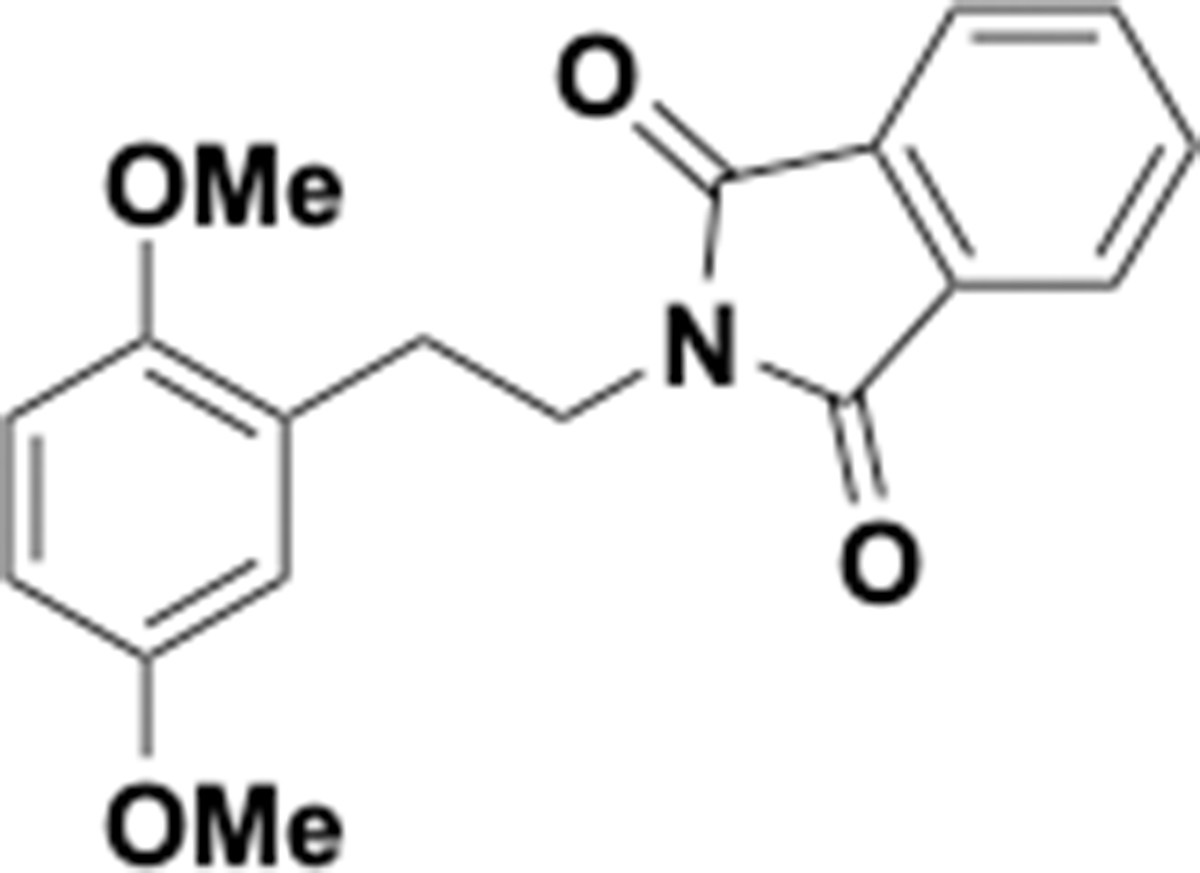
Dimethoxyphenethyl phthalimide (S8).
Appendix 1—chemical structure 9
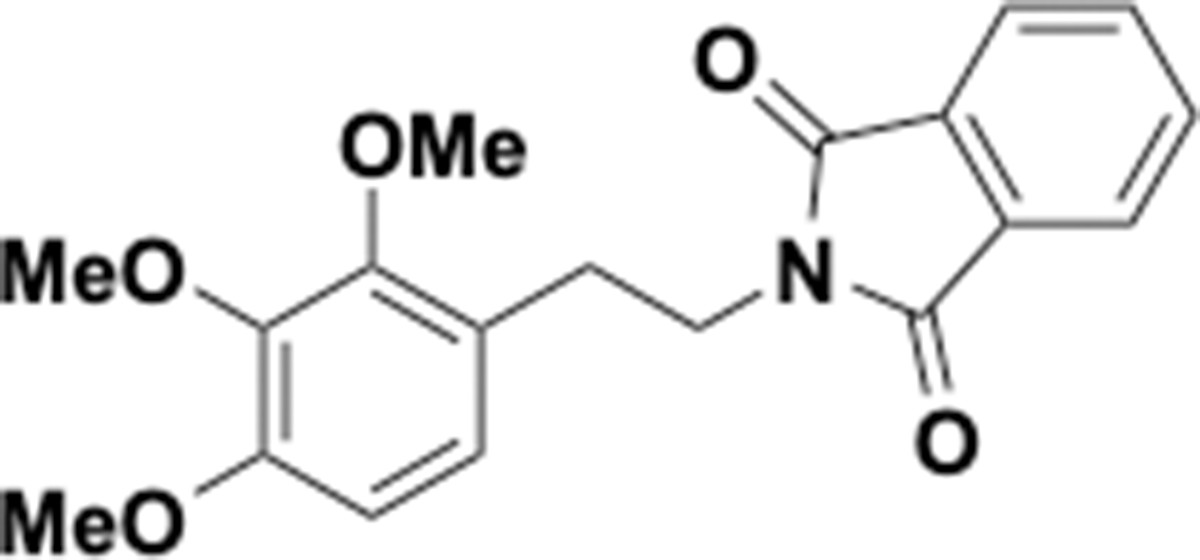
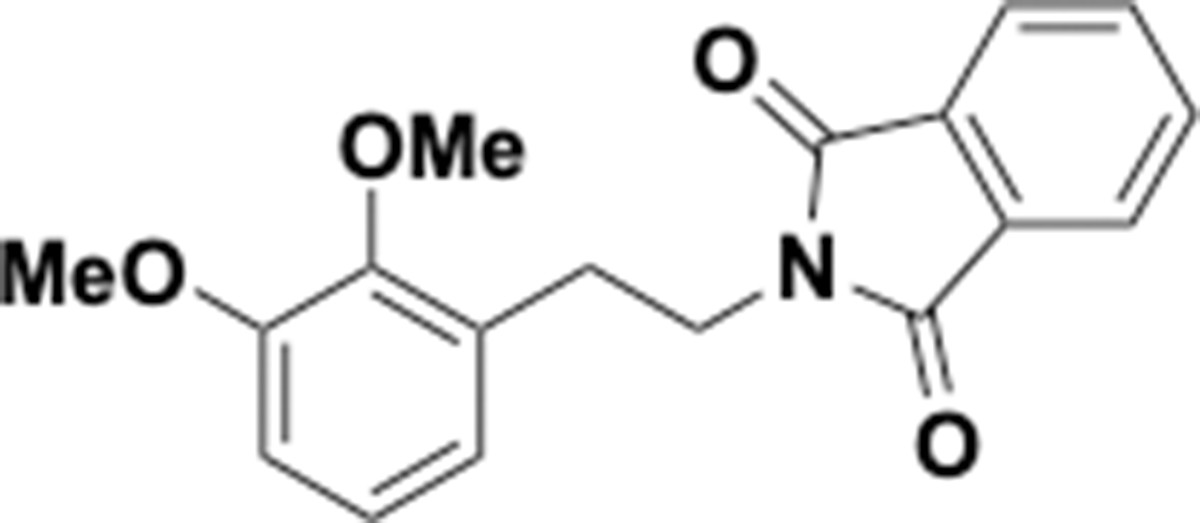
Trimethoxyphenethyl phthalimide (S9).
Appendix 1—chemical structure 10
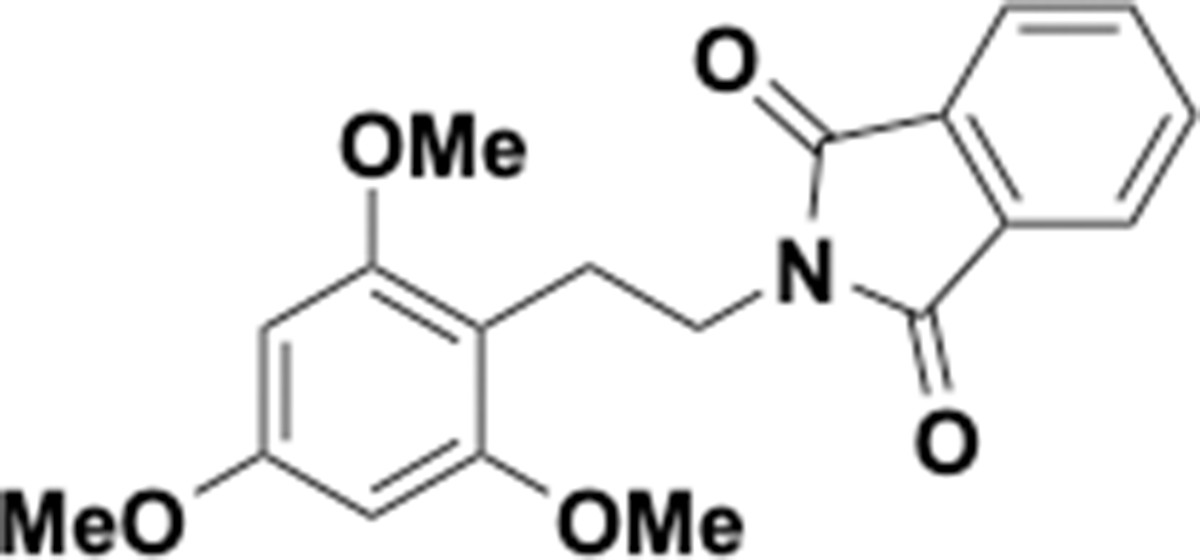
Trimethoxyphenethyl phthalimide (S10).
Appendix 1—scheme 4
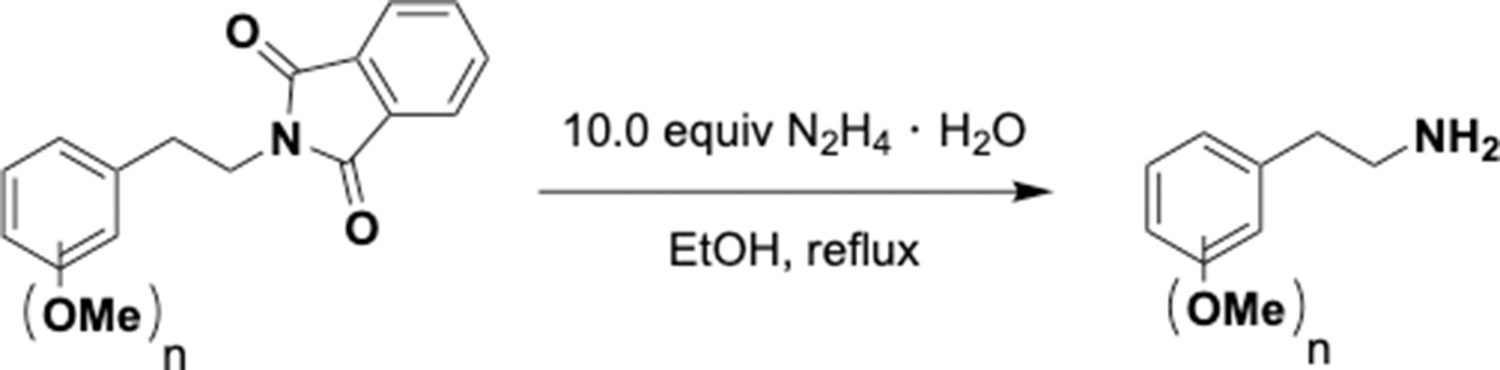
Hydrazinolysis of phenethyl phthalimides.
Appendix 1—chemical structure 11
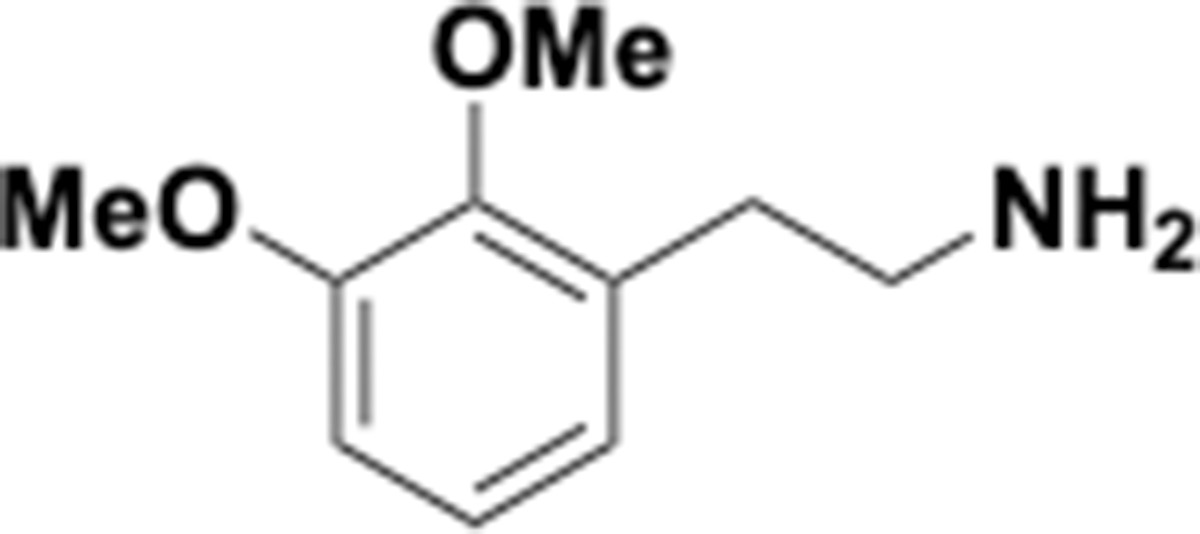
Dimethoxyphenethyl amine (S11).
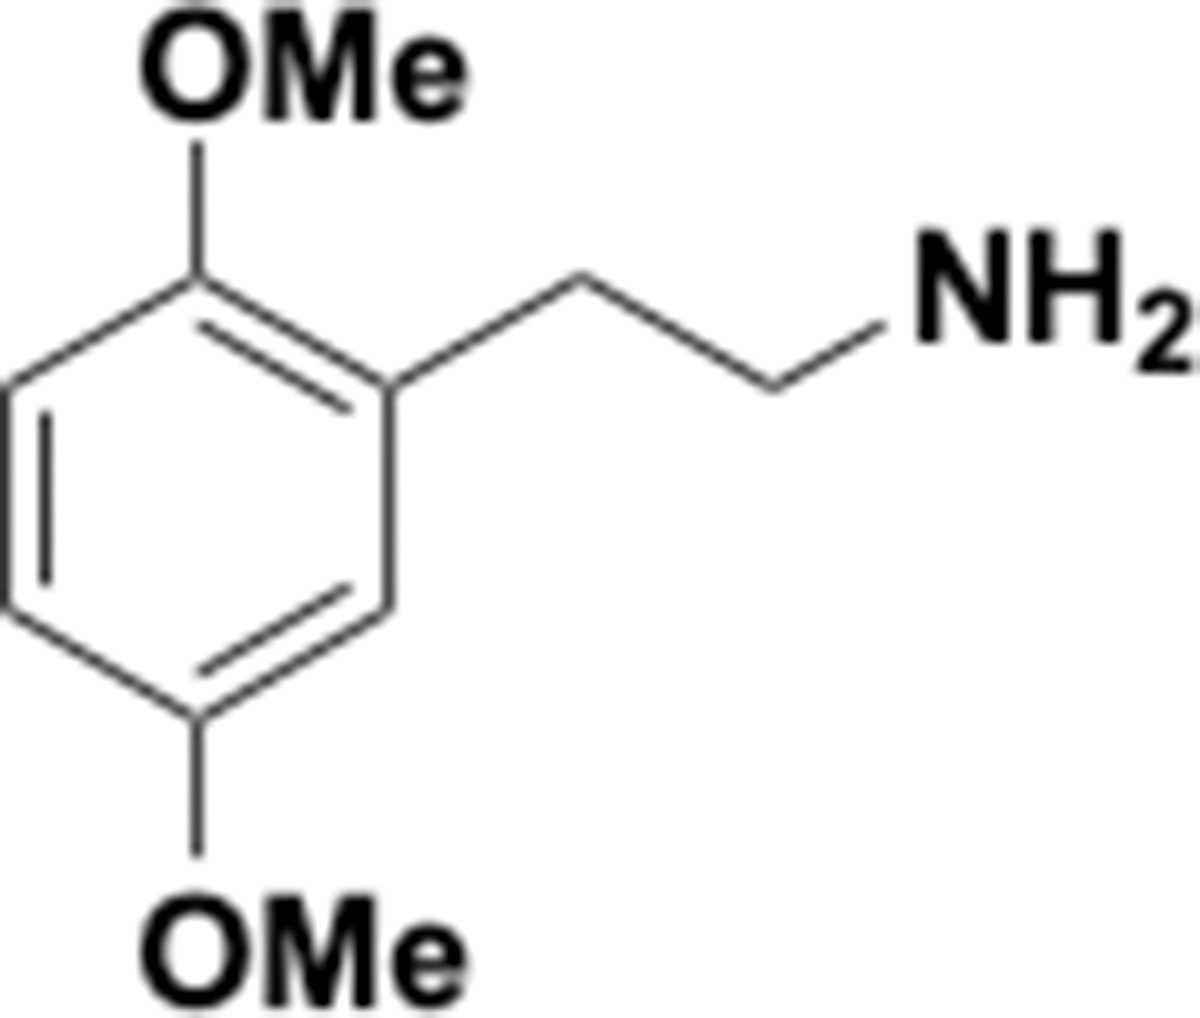
Appendix 1—chemical structure 12

Dimethoxyphenethyl amine (S12).
Appendix 1—chemical structure 13
Dimethoxyphenethyl amine (S13).
Appendix 1—chemical structure 14
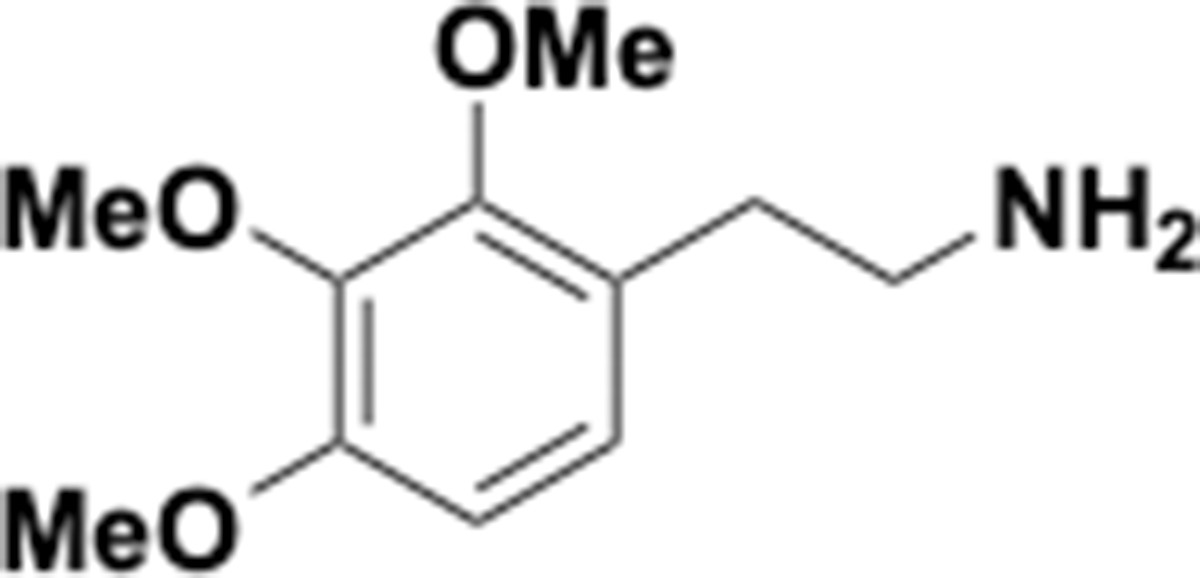
Trimethoxyphenethyl amine (S14).
Appendix 1—chemical structure 15
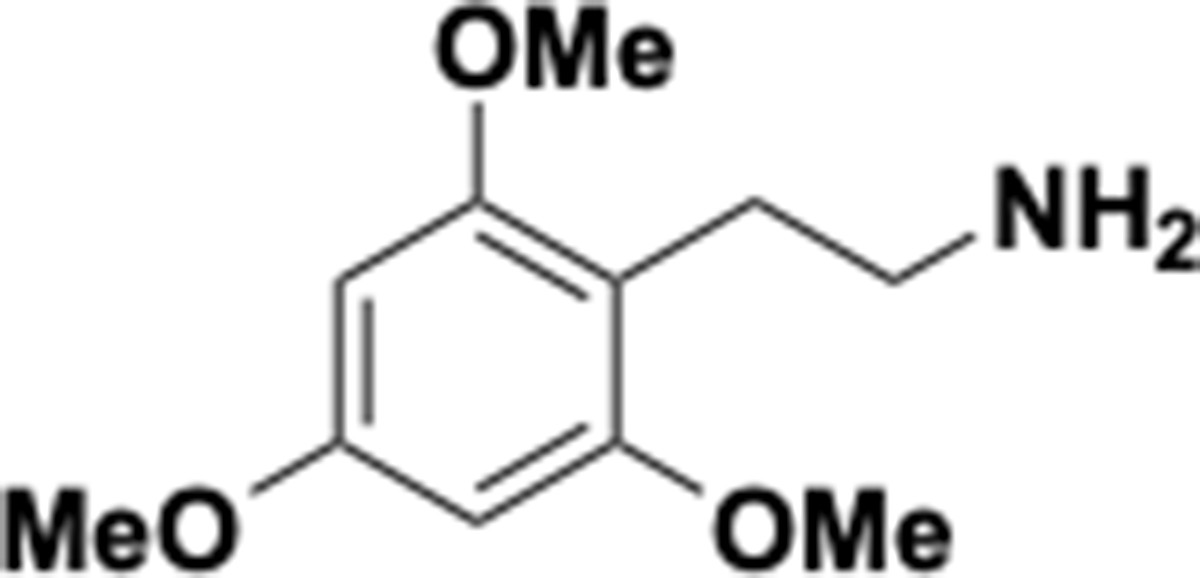
Trimethoxyphenethyl amine (S15).
Appendix 1—scheme 5
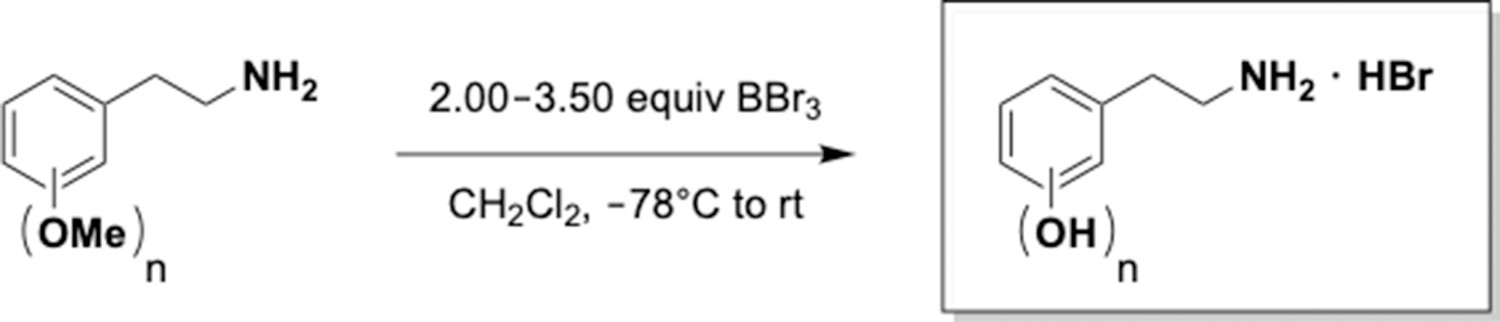
Practical demethylation of aryl methyl ethers.
Appendix 1—chemical structure 16
Aminoethylbenzene diol hydrobromide (S16).
Appendix 1—chemical structure 17

Aminoethylbenzene diol hydrobromide (S17).
Appendix 1—chemical structure 18

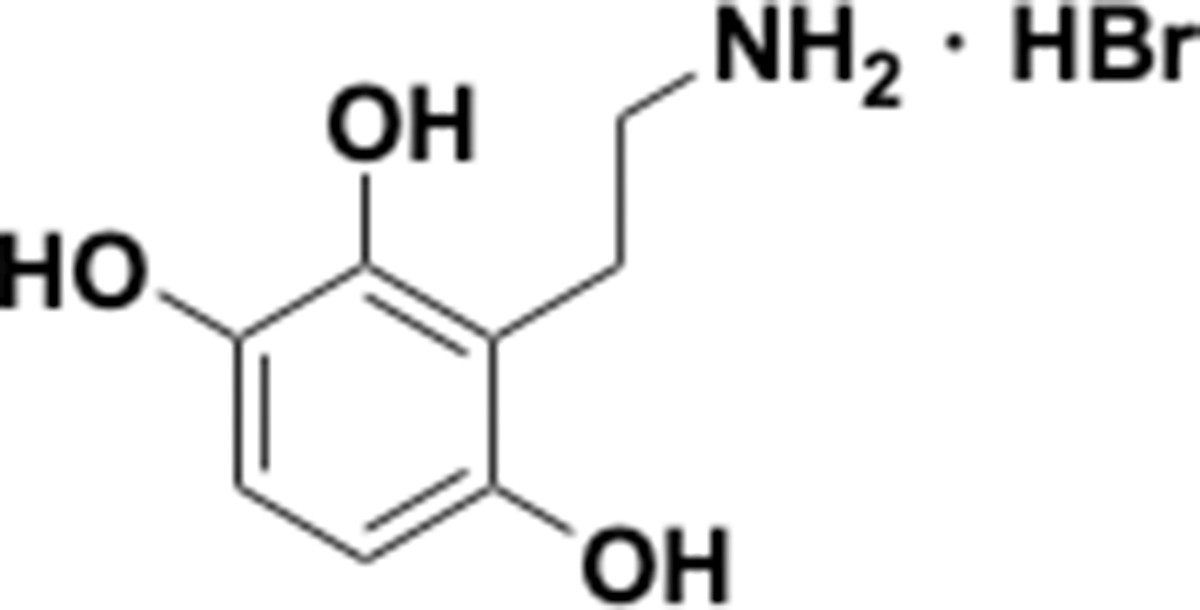
5-(2-Aminoethyl)benzene-1,4-diol hydrobromide (S18).
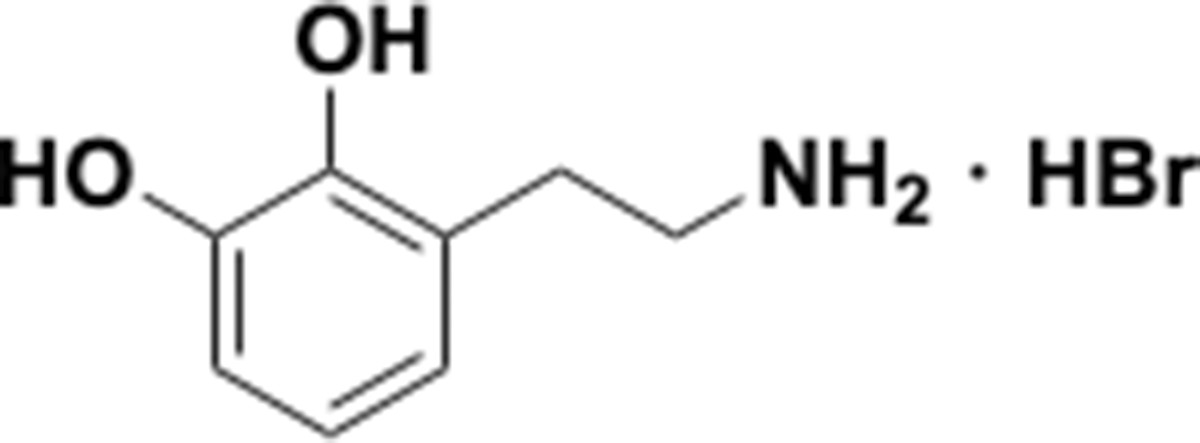
Appendix 1—chemical structure 19
Aminoethylbenzene triol hydrobromide (S19).
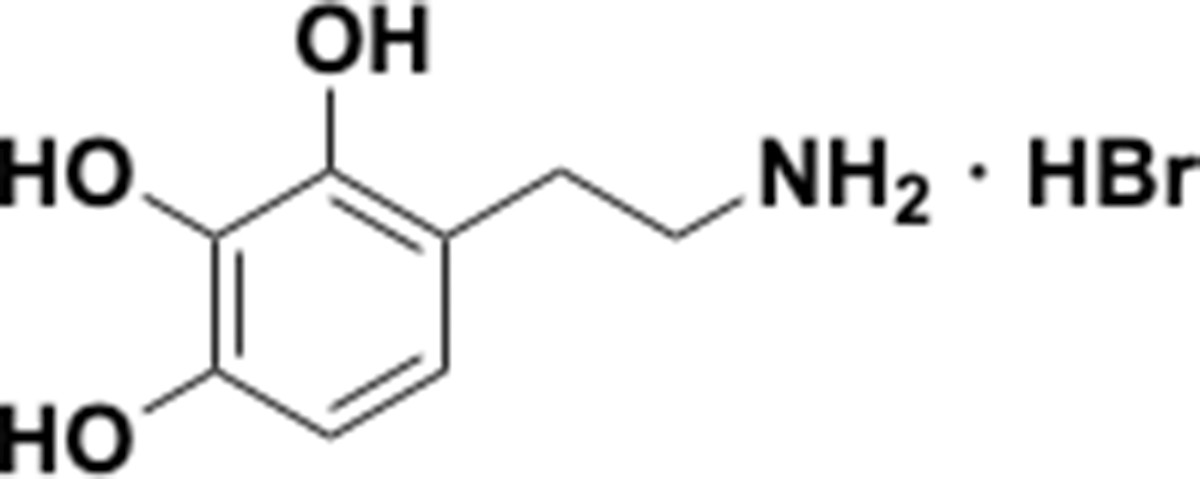
Appendix 1—chemical structure 20
Aminoethylbenzene triol hydrobromide (S20).
Appendix 1—scheme 6
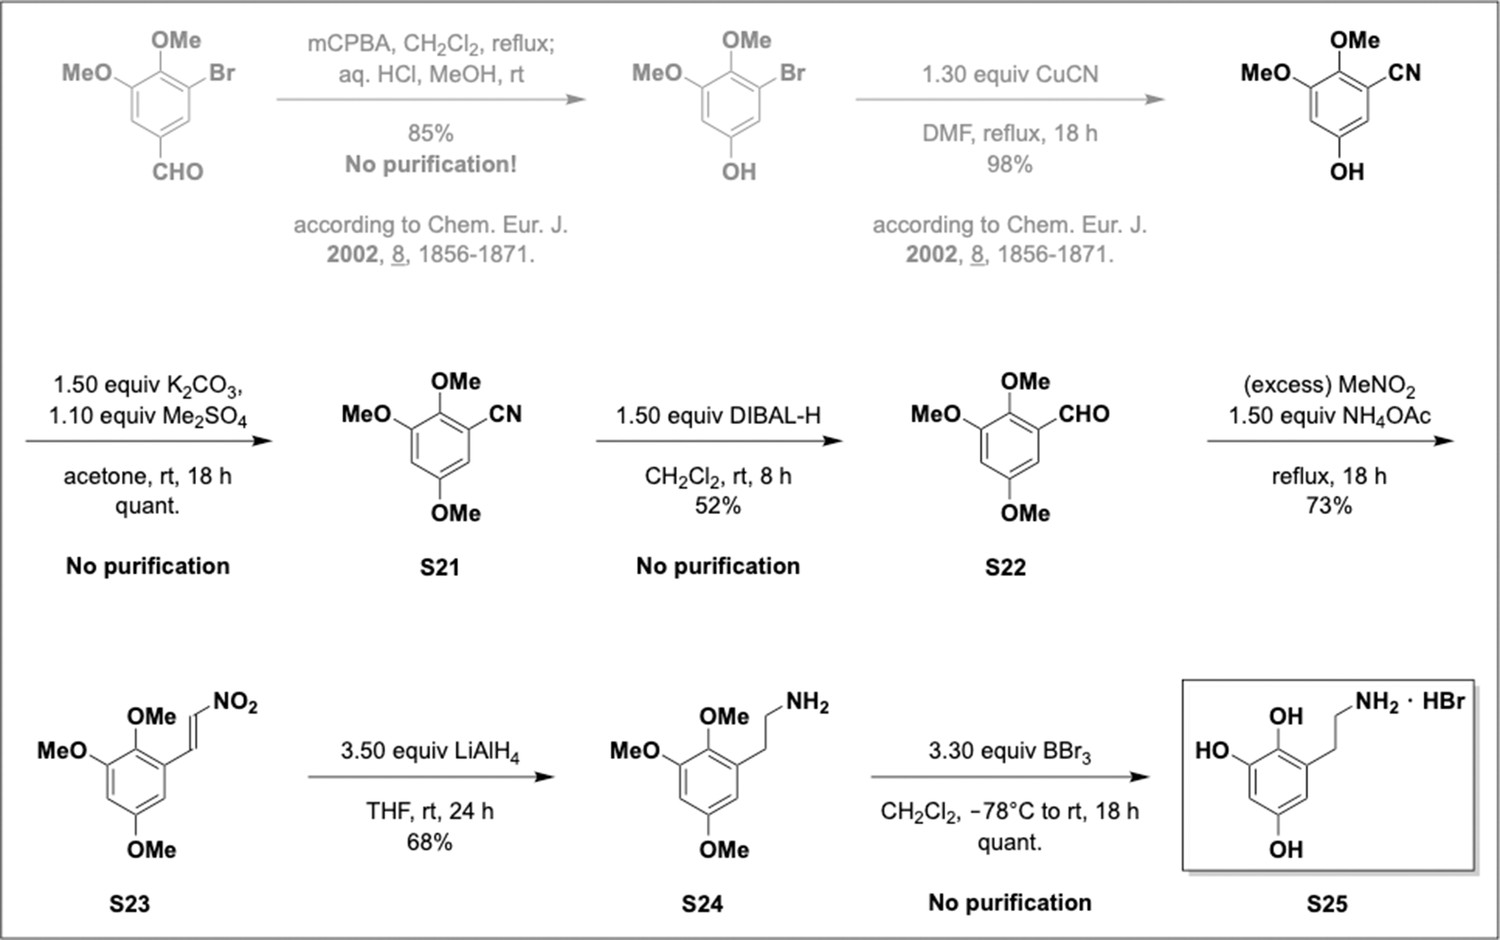
Preparation of aminoethylbenzene triol hydrobromide from aryl nitriles.
Appendix 1—chemical structure 21
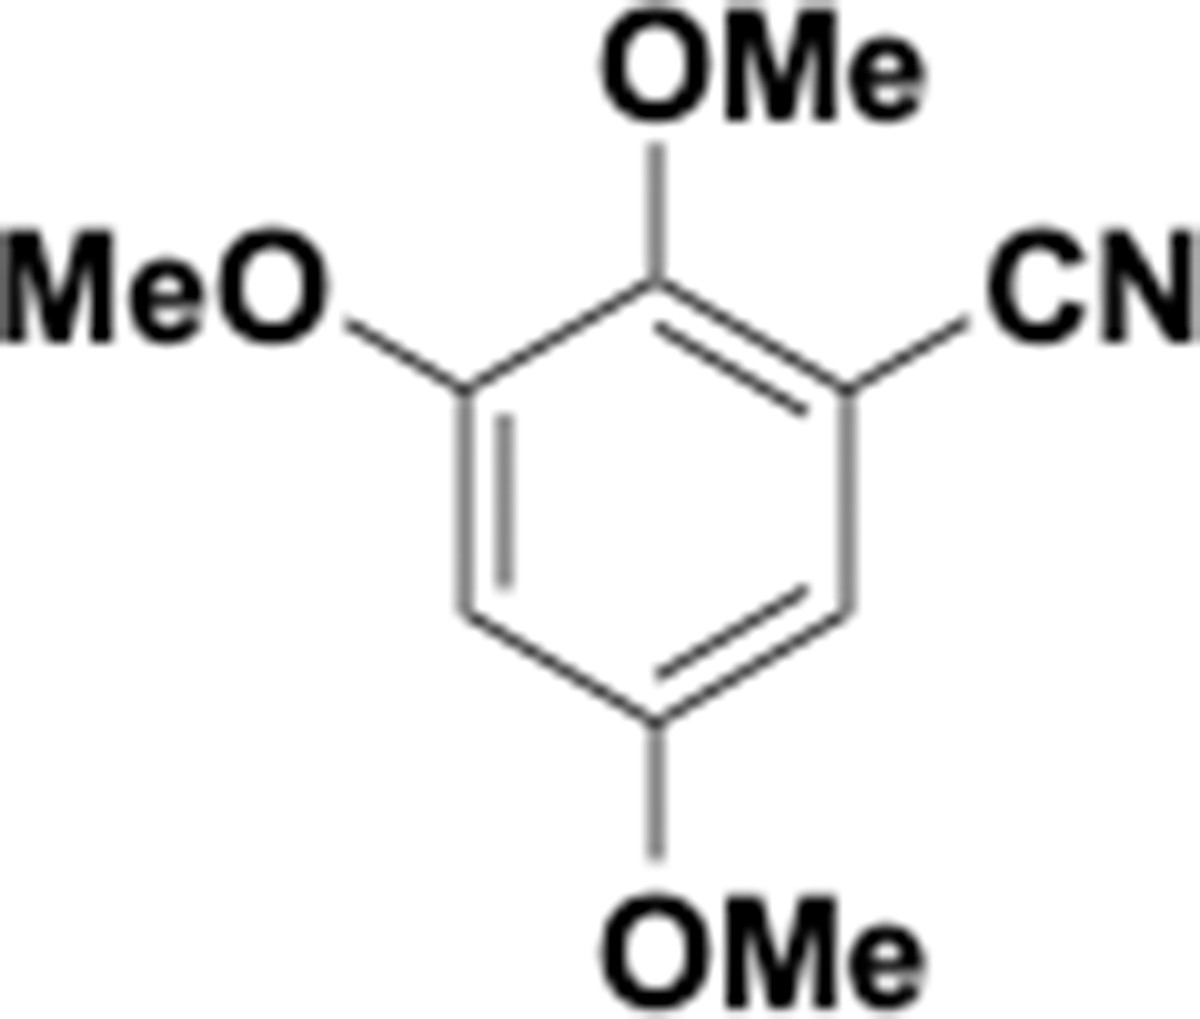
Trimethoxybenzonitrile (S21).
Appendix 1—chemical structure 22
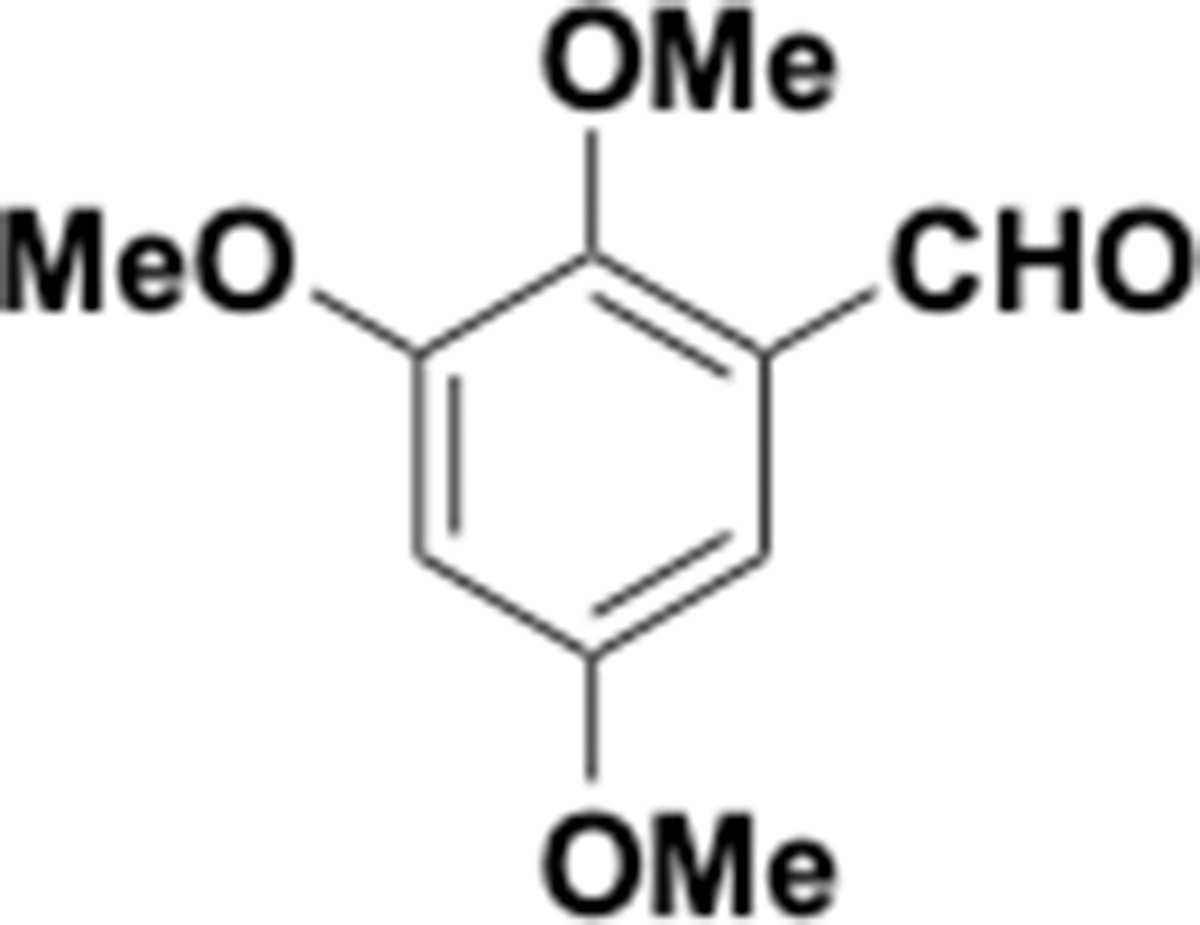
Trimethoxybenzaldehyde (S22).
Appendix 1—chemical structure 23
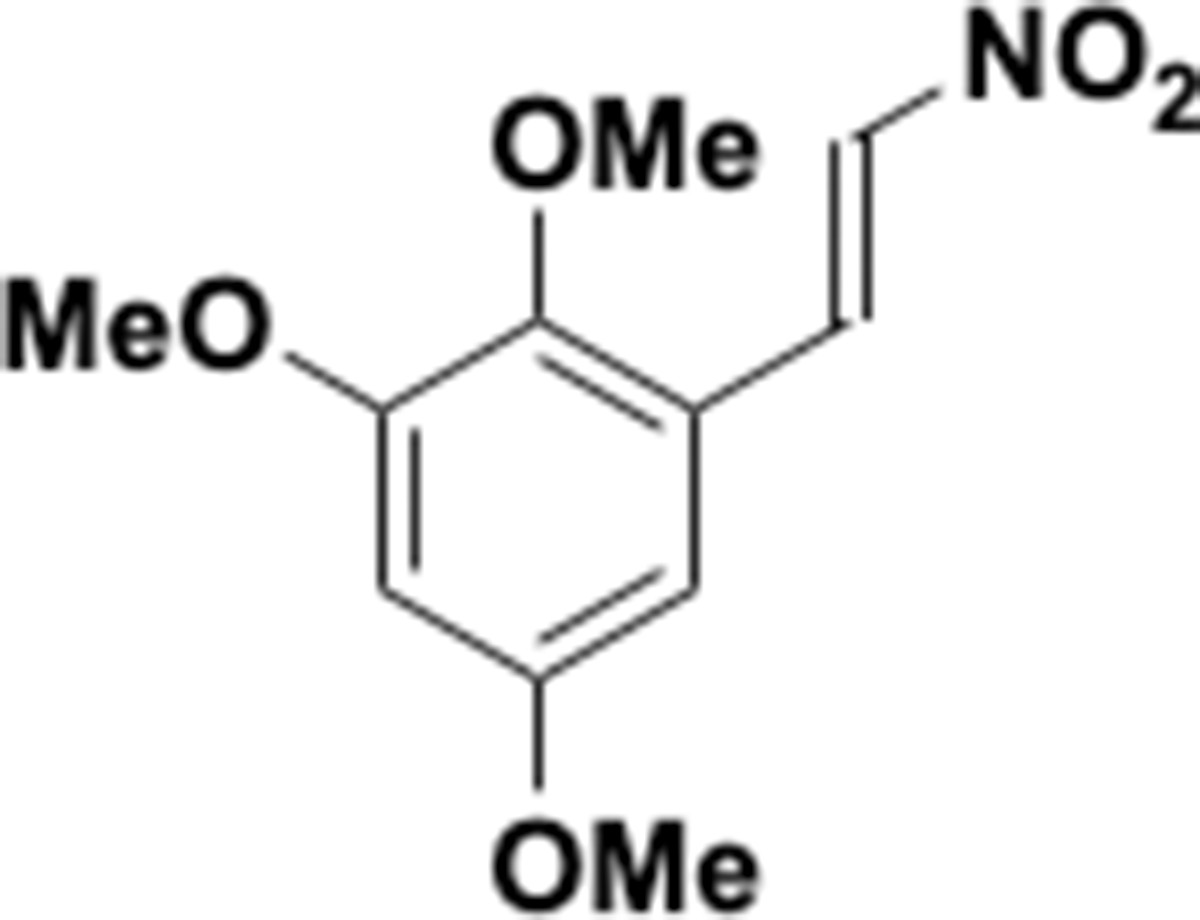
Nitrovinyl benzene (S23).
Appendix 1—chemical structure 24

Trimethoxyphenethyl amine (S24).
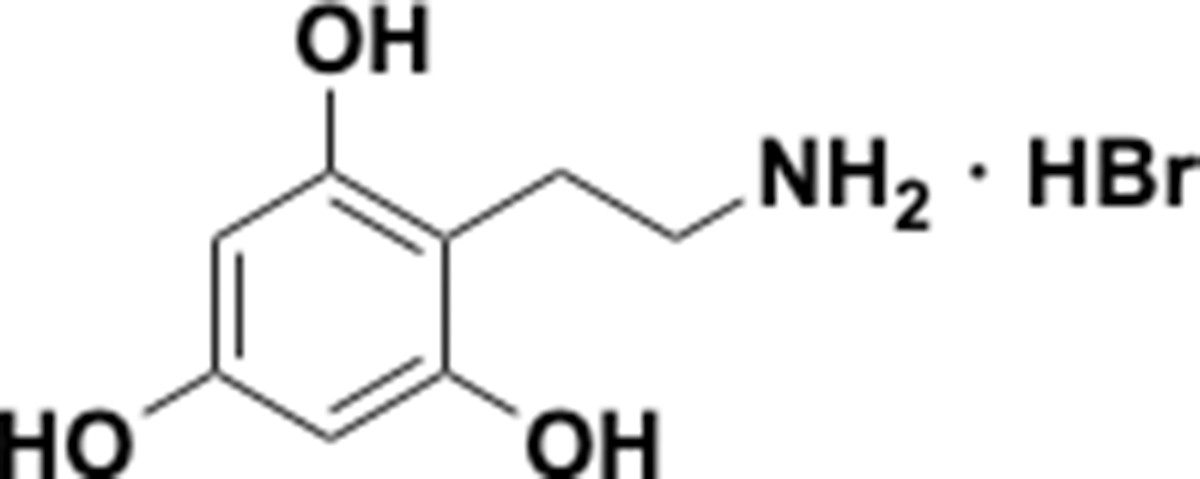
Appendix 1—chemical structure 25
Aminoethylbenzene triol hydrobromide (S25).
Appendix 1—scheme 7
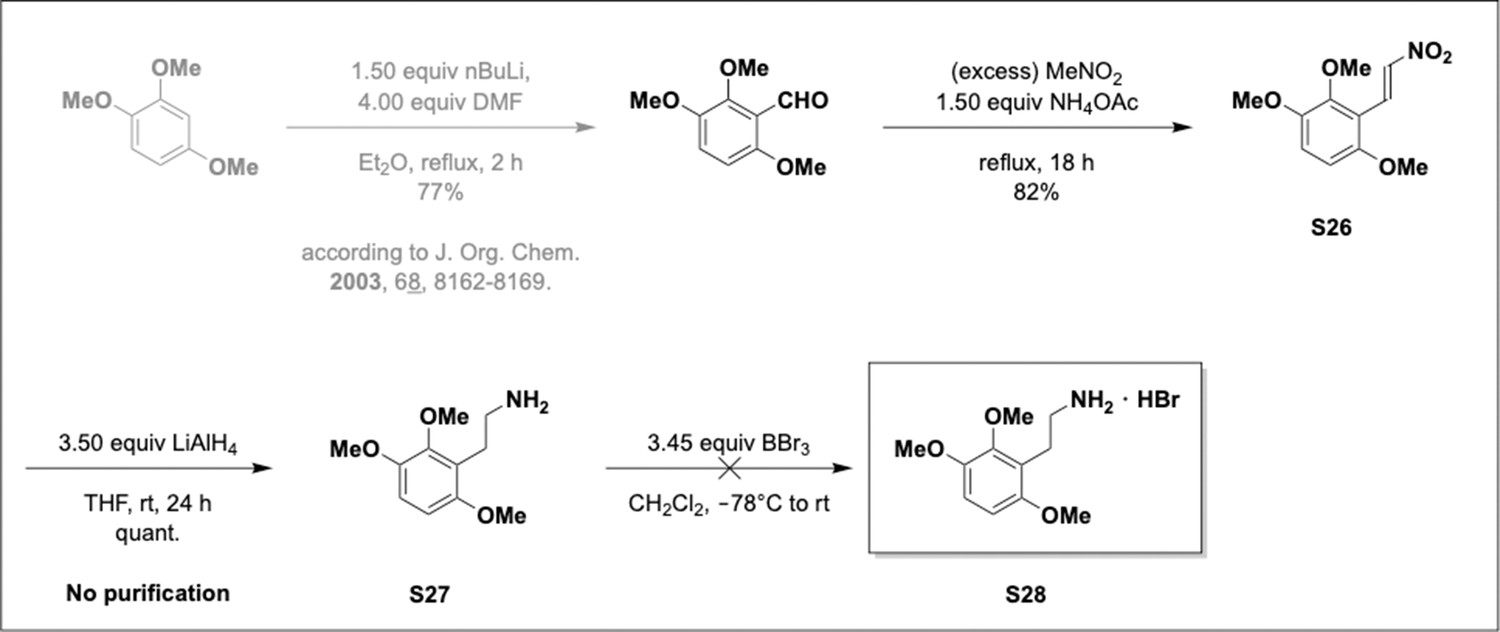
Preparation of aminoethylbenzene triol hydrobromide derivatives from trimethoxybenzene.
Appendix 1—chemical structure 26
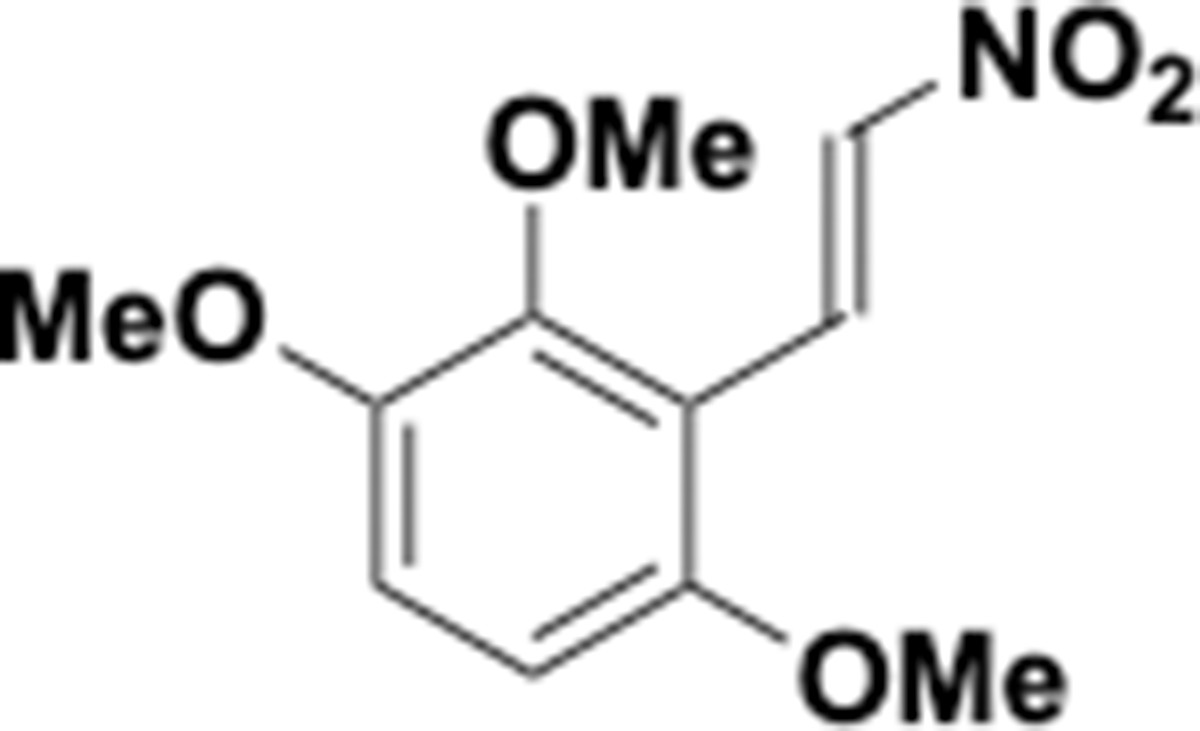
Trimethoxy nitrovinyl benzene (S26).
Appendix 1—chemical structure 27
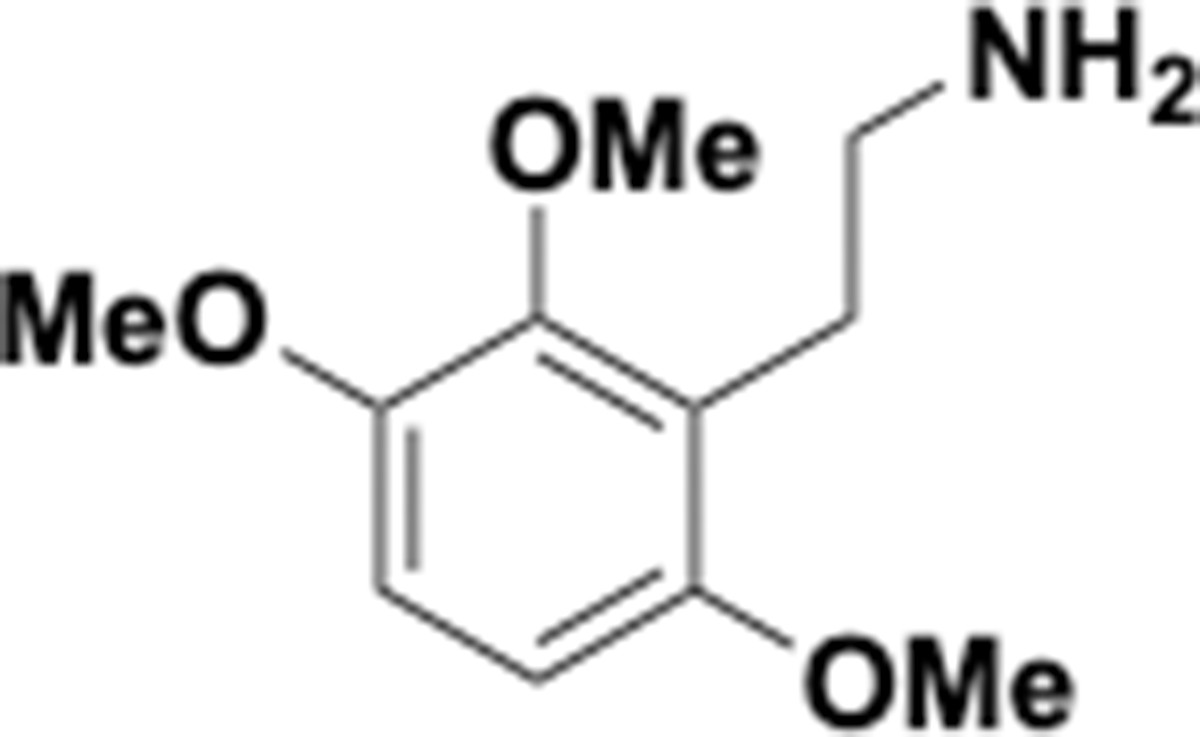
Trimethoxyphenethyl amine (S27).
Appendix 1—chemical structure 28
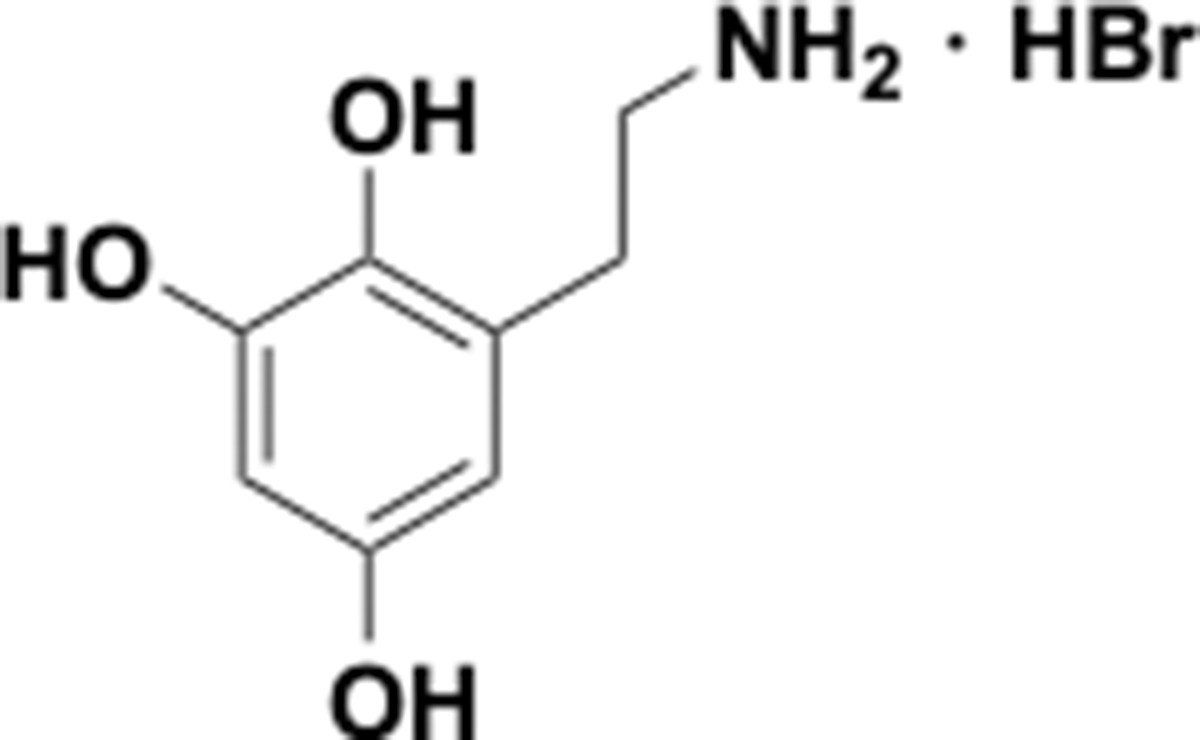
Aminoethylbenzene triol hydrobromide (S28).
Appendix 1—scheme 8
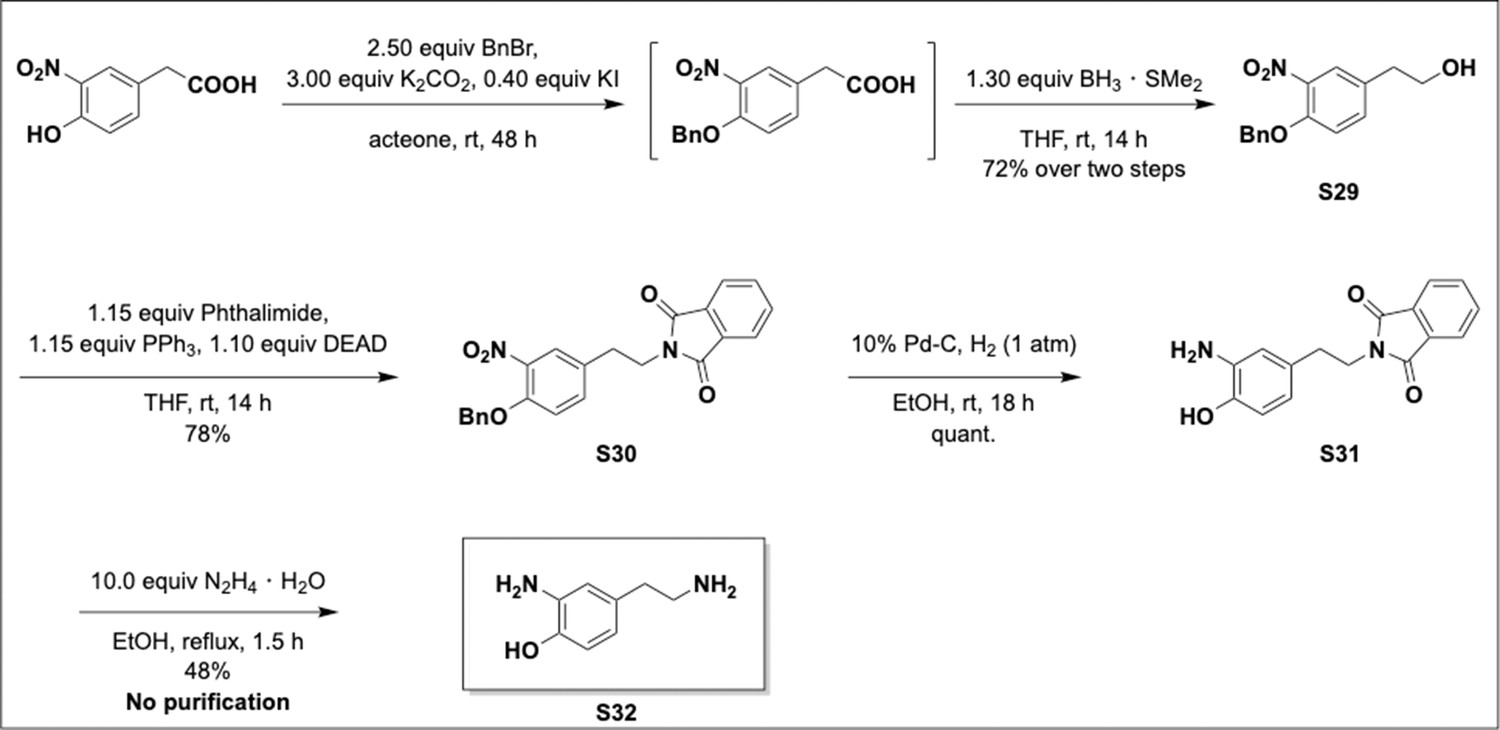
2-Amino-4-(2-aminoethyl)phenol via Mitsunobu strategy.
Appendix 1—chemical structure 29
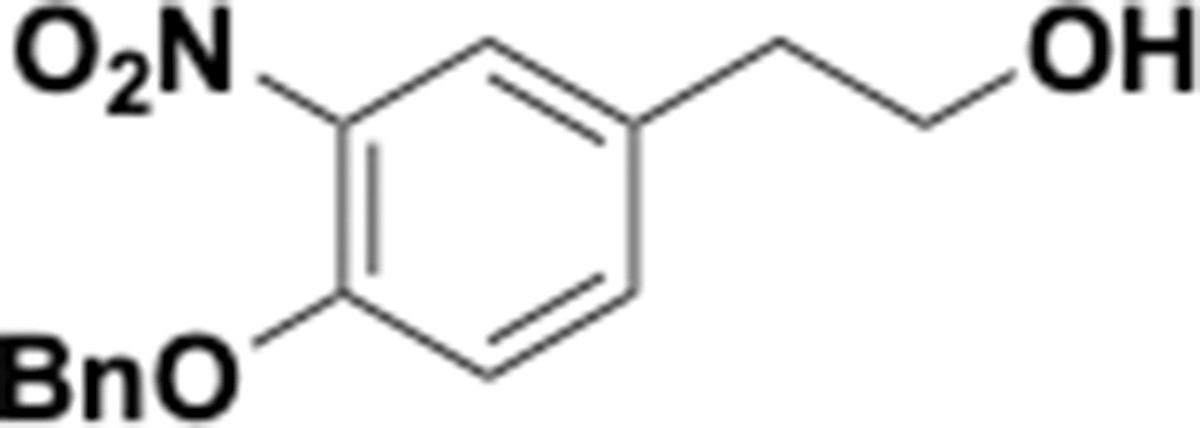
Benzyloxy nitrophenethyl alcohol (S29).
Appendix 1—chemical structure 30
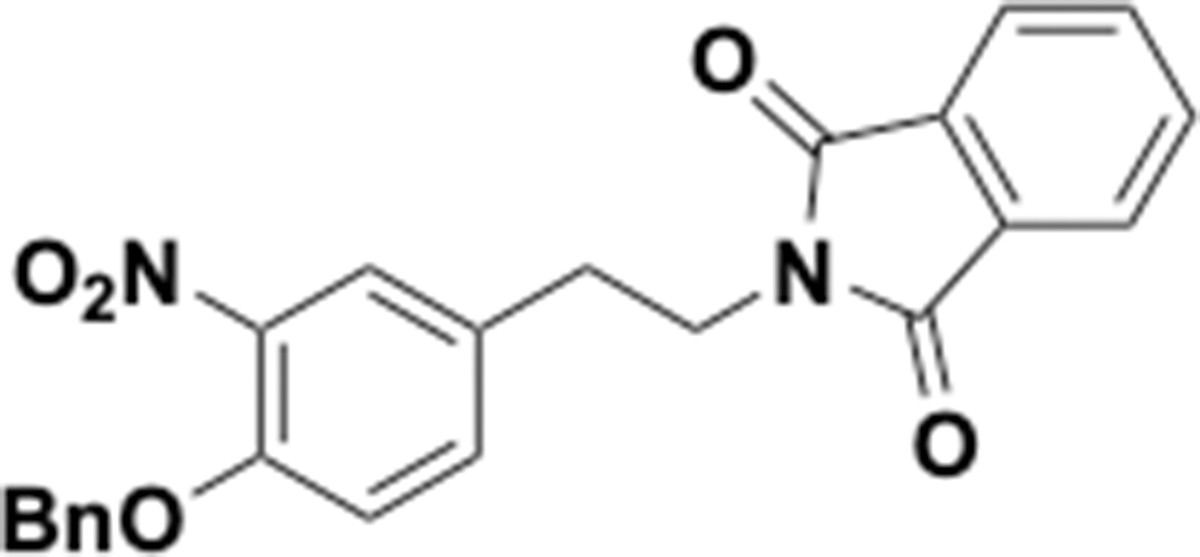
Benzyloxy nitrophenethyl phthalimide (S30).
Appendix 1—chemical structure 31

Amino alcohol (S31).
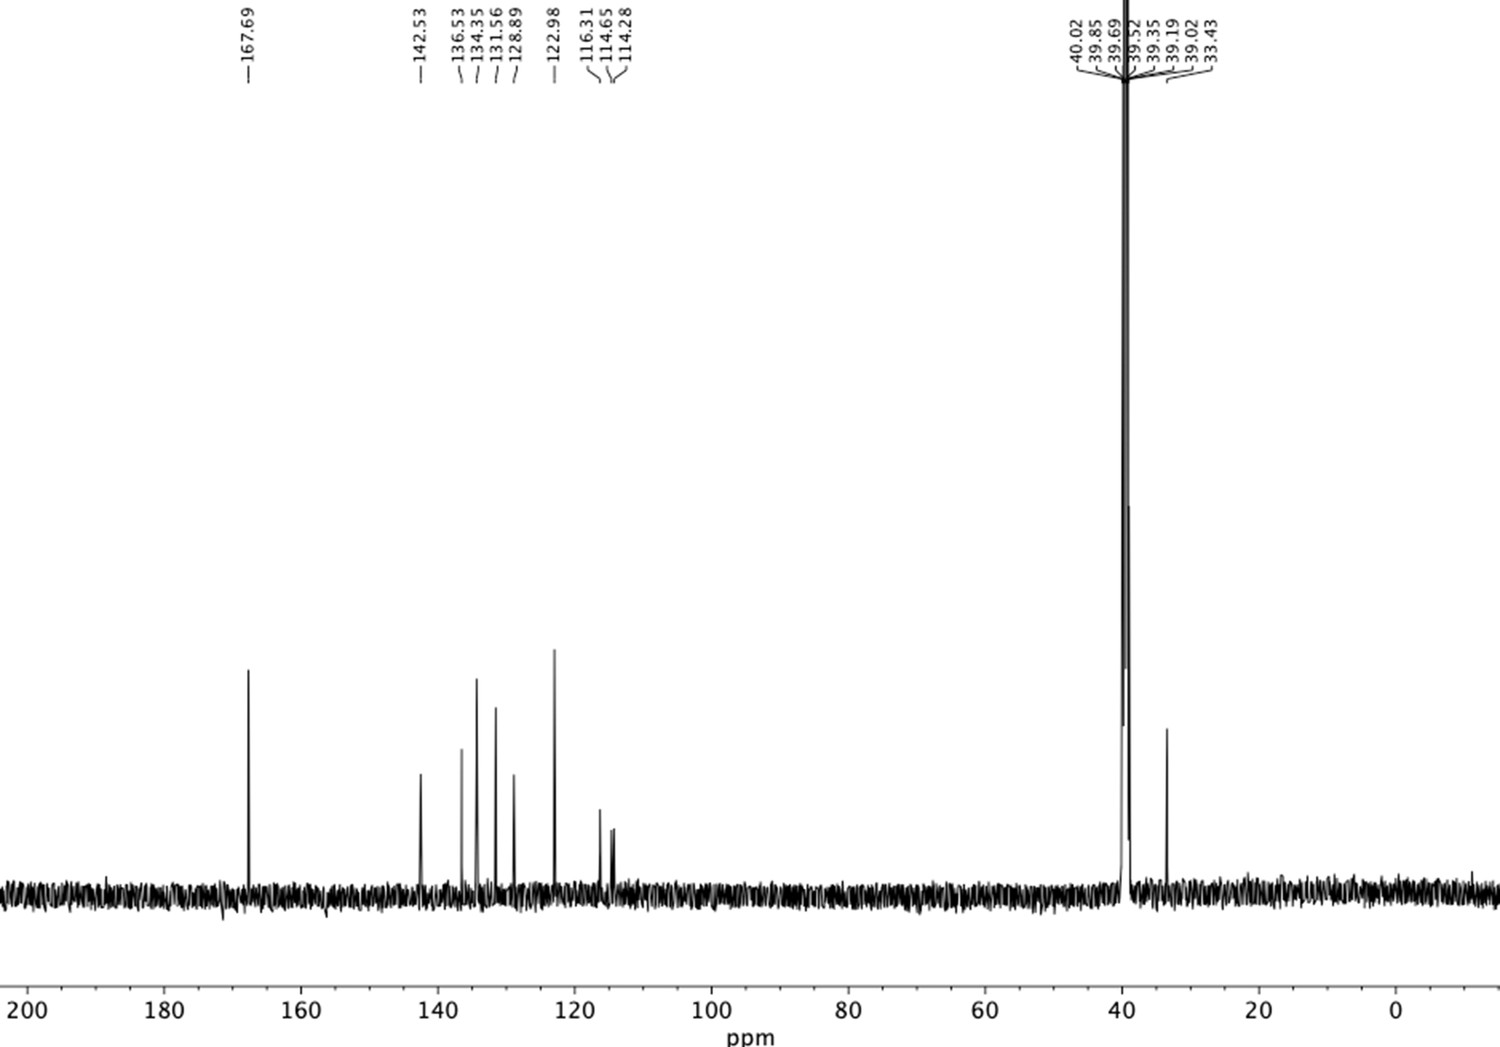
Appendix 1—chemical structure 32
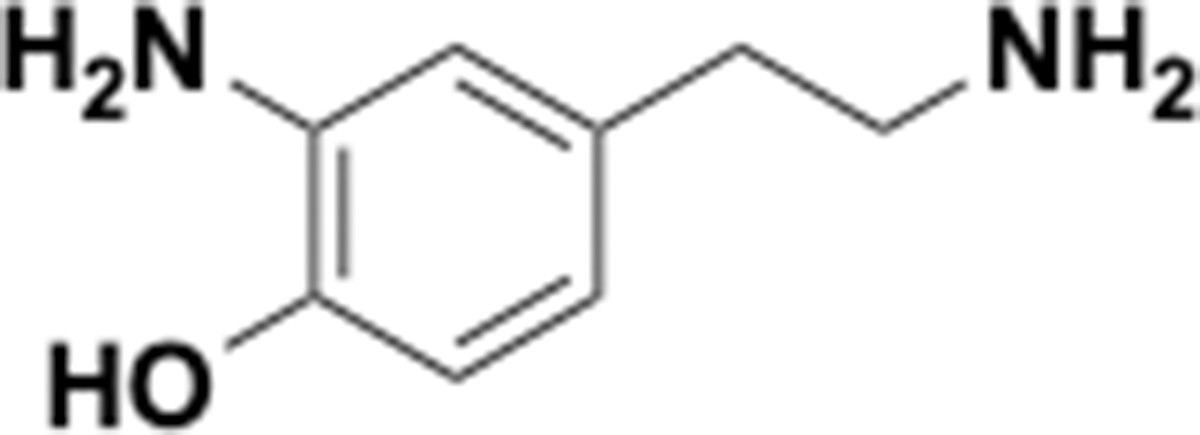
2-Amino-4-(2-aminoethyl)phenol (S32).
Appendix 1—scheme 9

Reduction of a dihydroxyphenyl acetic acid.
Appendix 1—figure 1
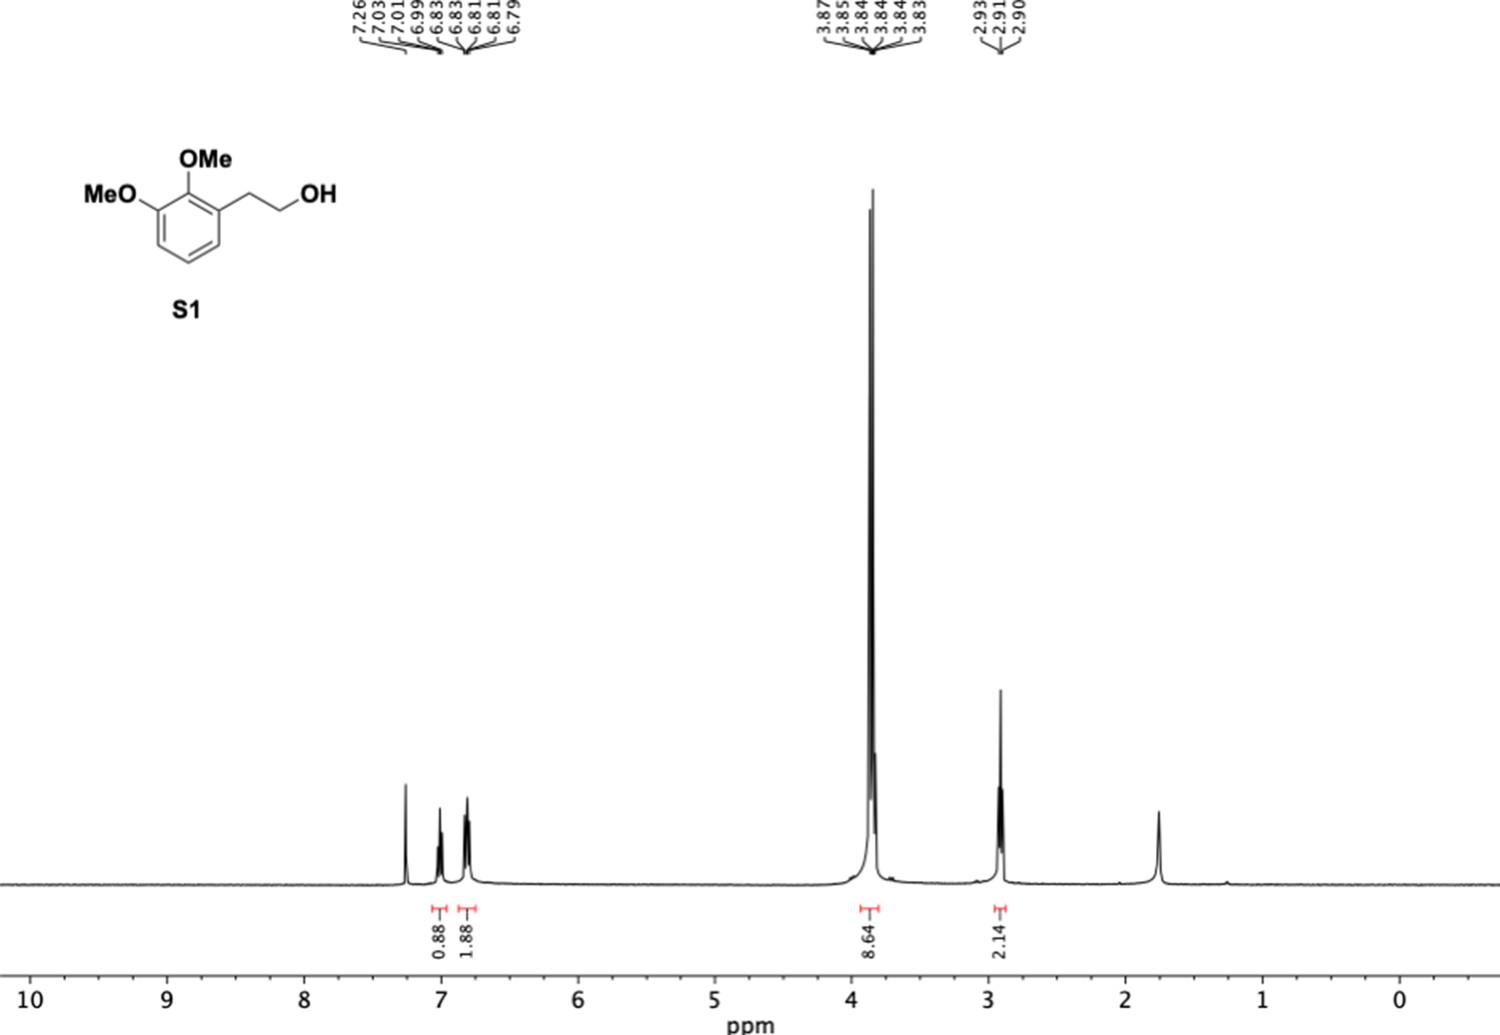
1H NMR of dimethoxyphenethyl alcohol (S1).
Appendix 1—figure 2
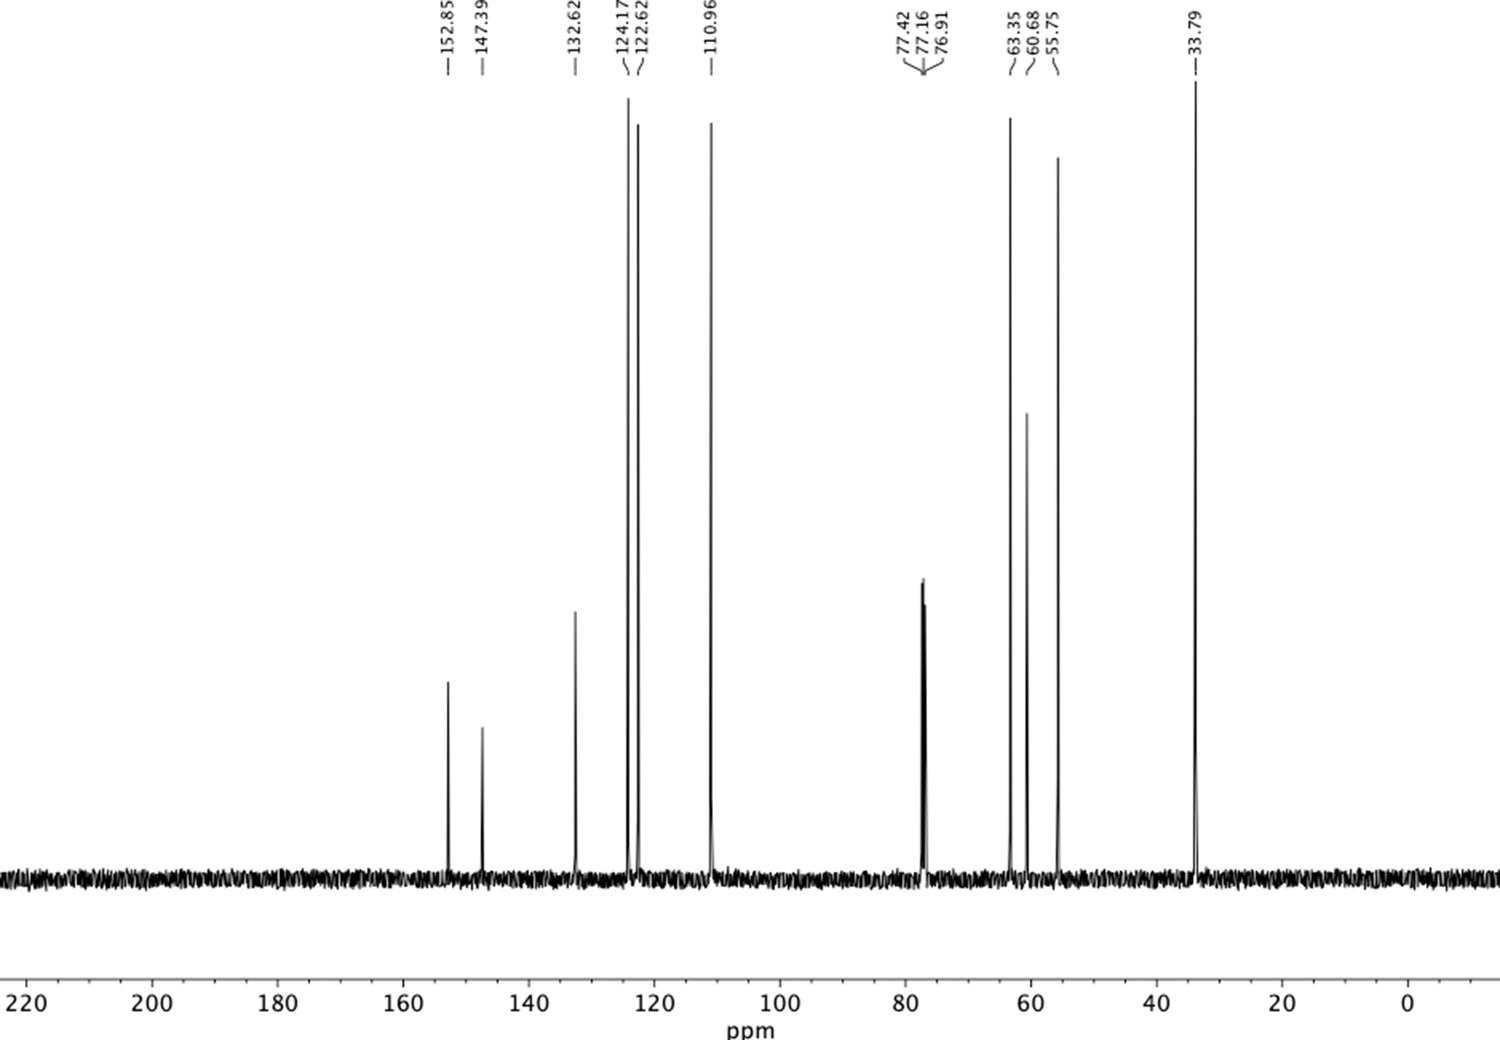
13C NMR of dimethoxyphenethyl alcohol (S1).
Appendix 1—figure 3
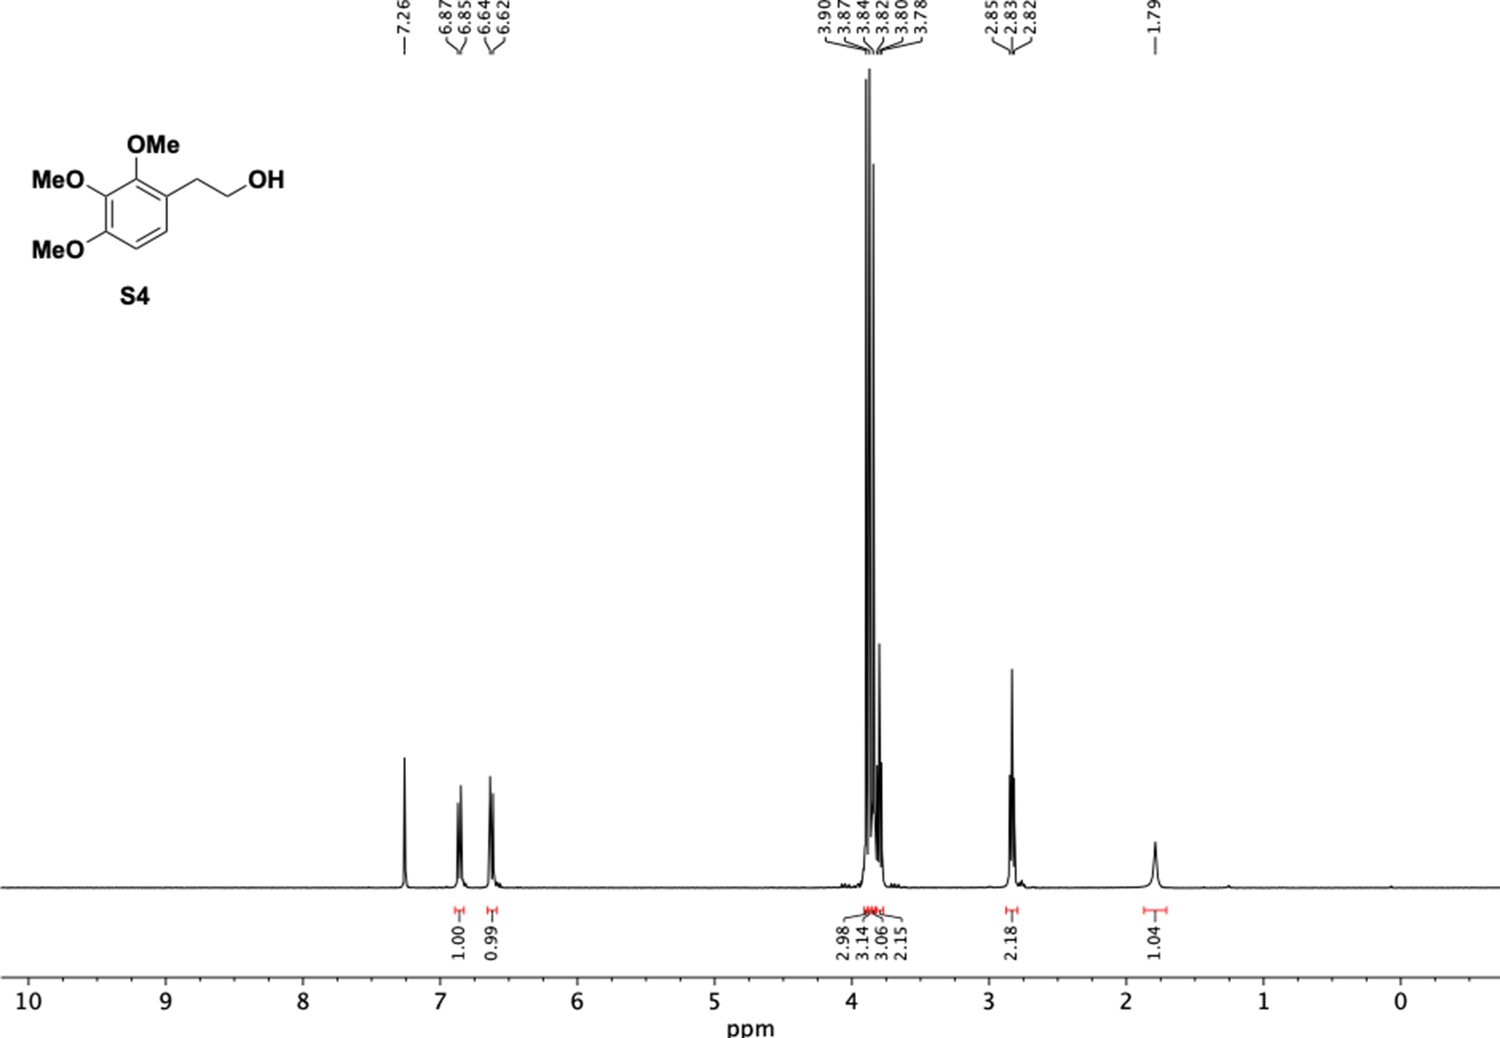
1H NMR of trimethoxyphenethyl alcohol (S4).
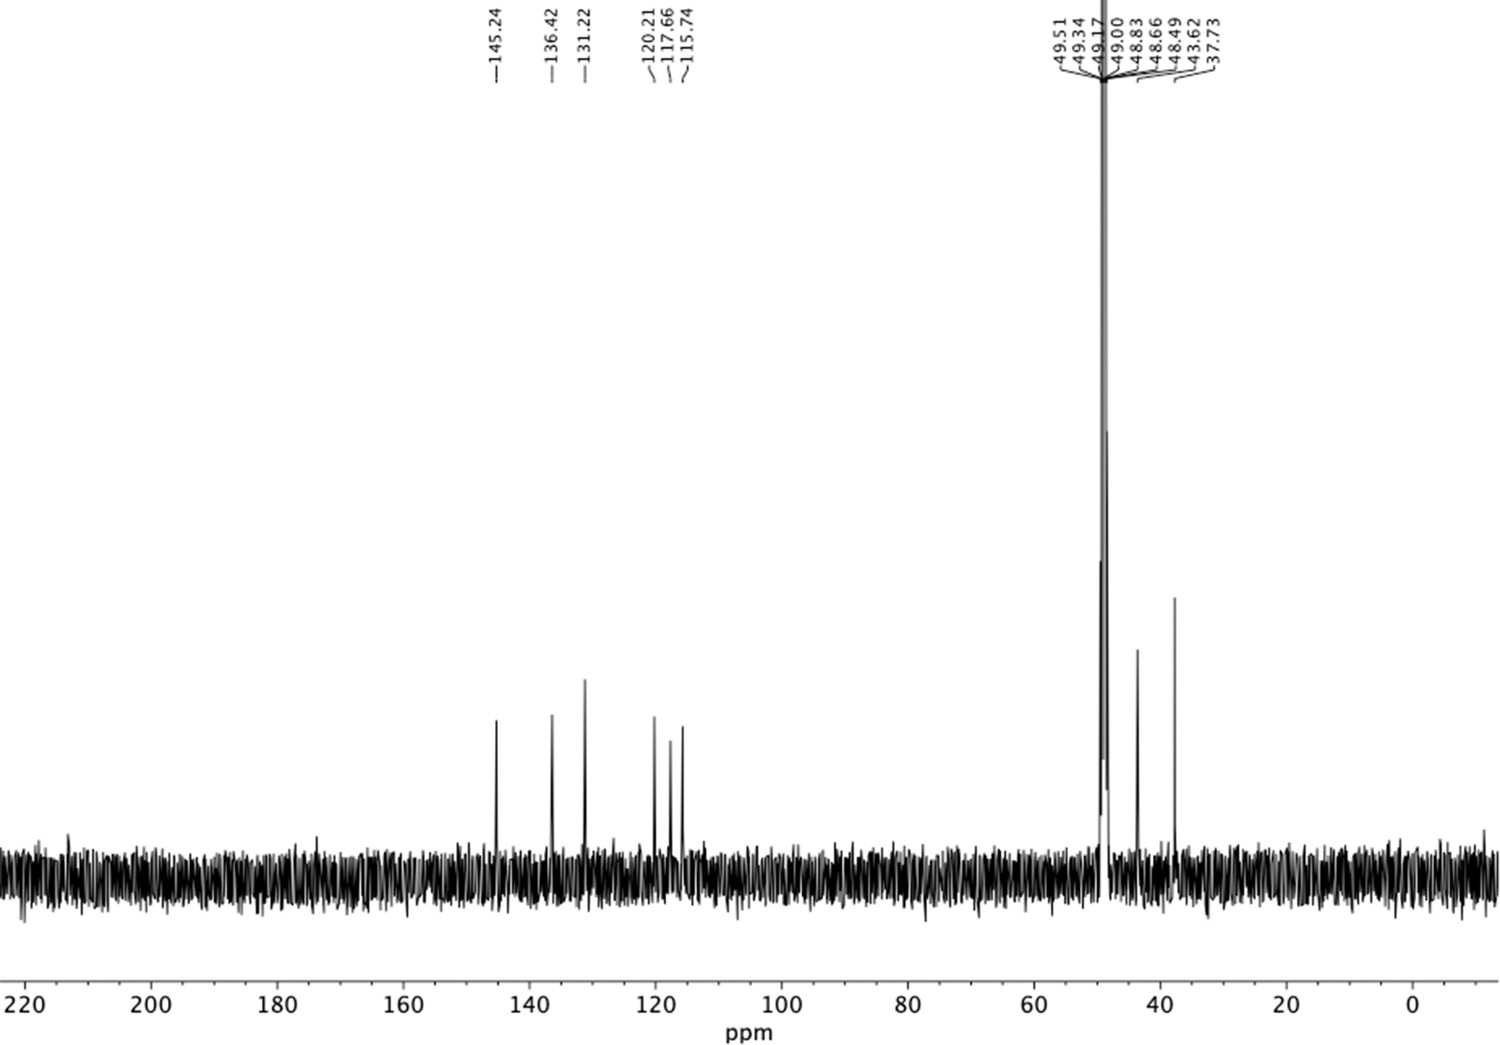
Appendix 1—figure 4
13C NMR of trimethoxyphenethyl alcohol (S4).
Appendix 1—figure 5
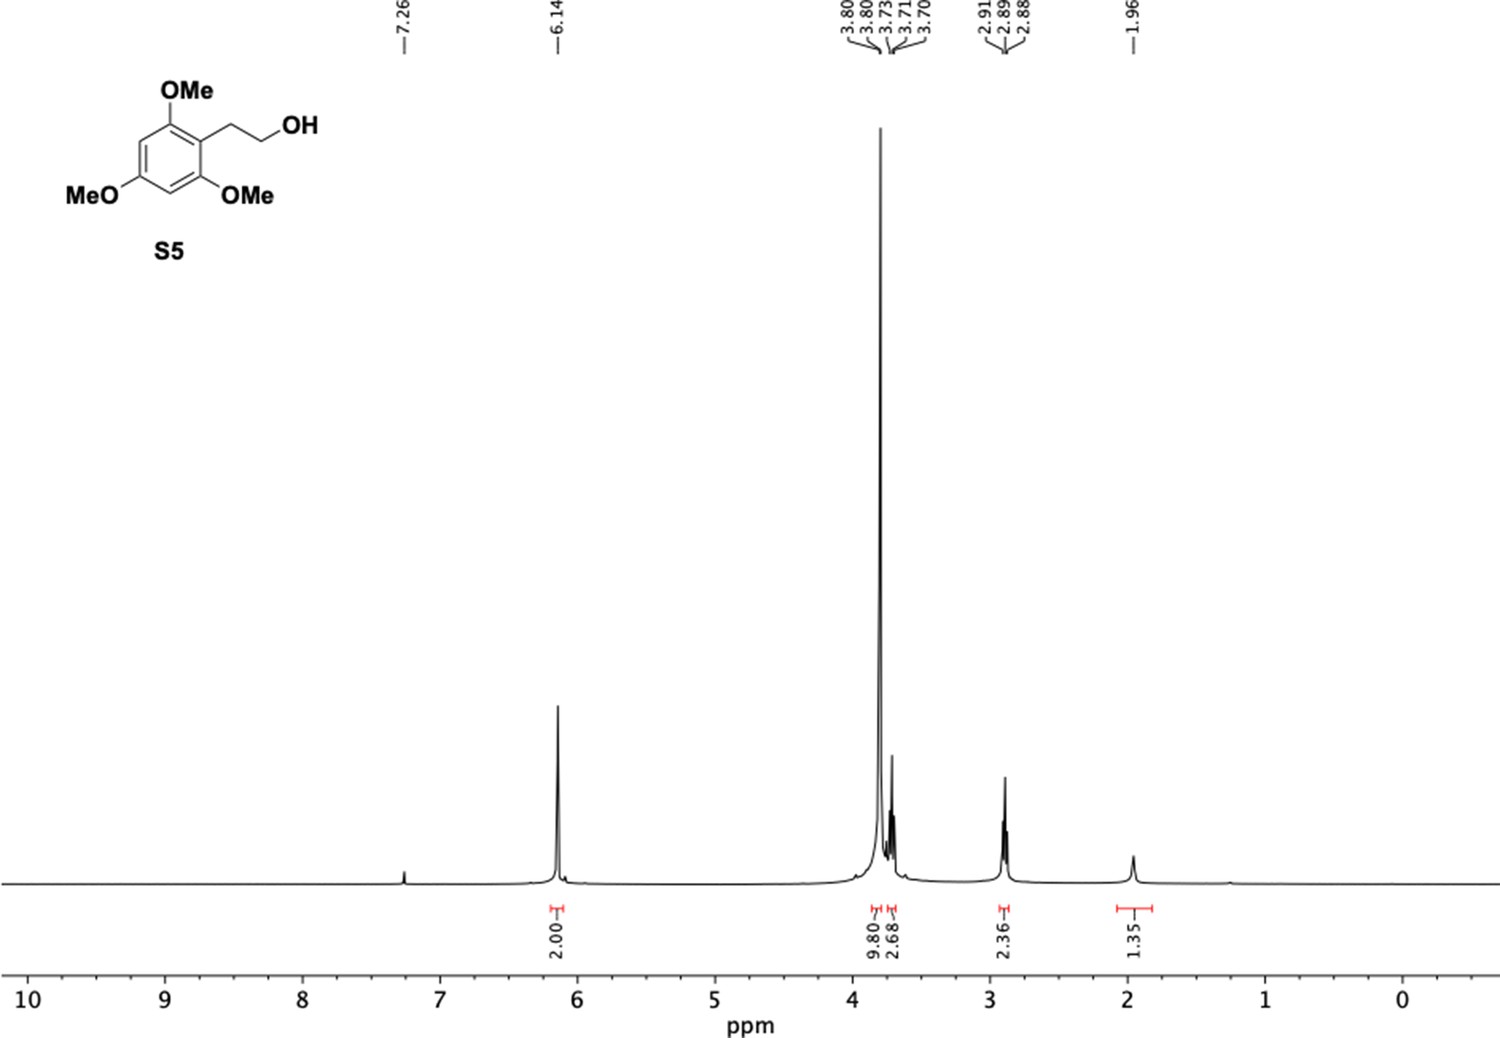
1H NMR of trimethoxyphenethyl alcohol (S5).
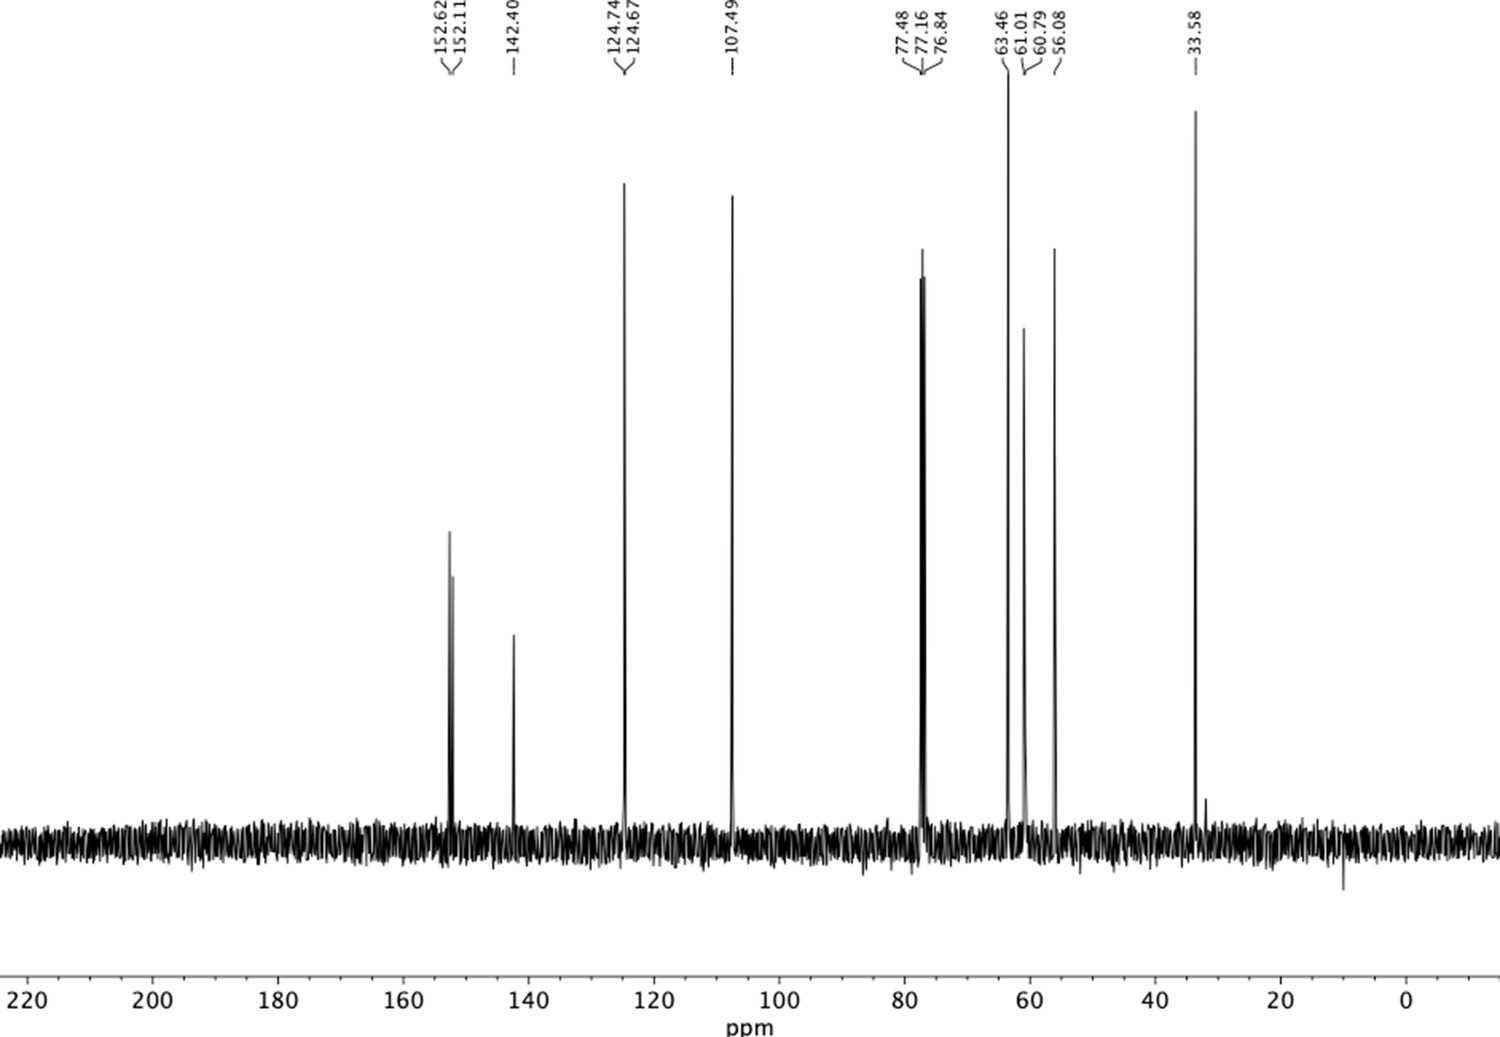
Appendix 1—figure 6

13C NMR of trimethoxyphenethyl alcohol (S5).
Appendix 1—figure 7
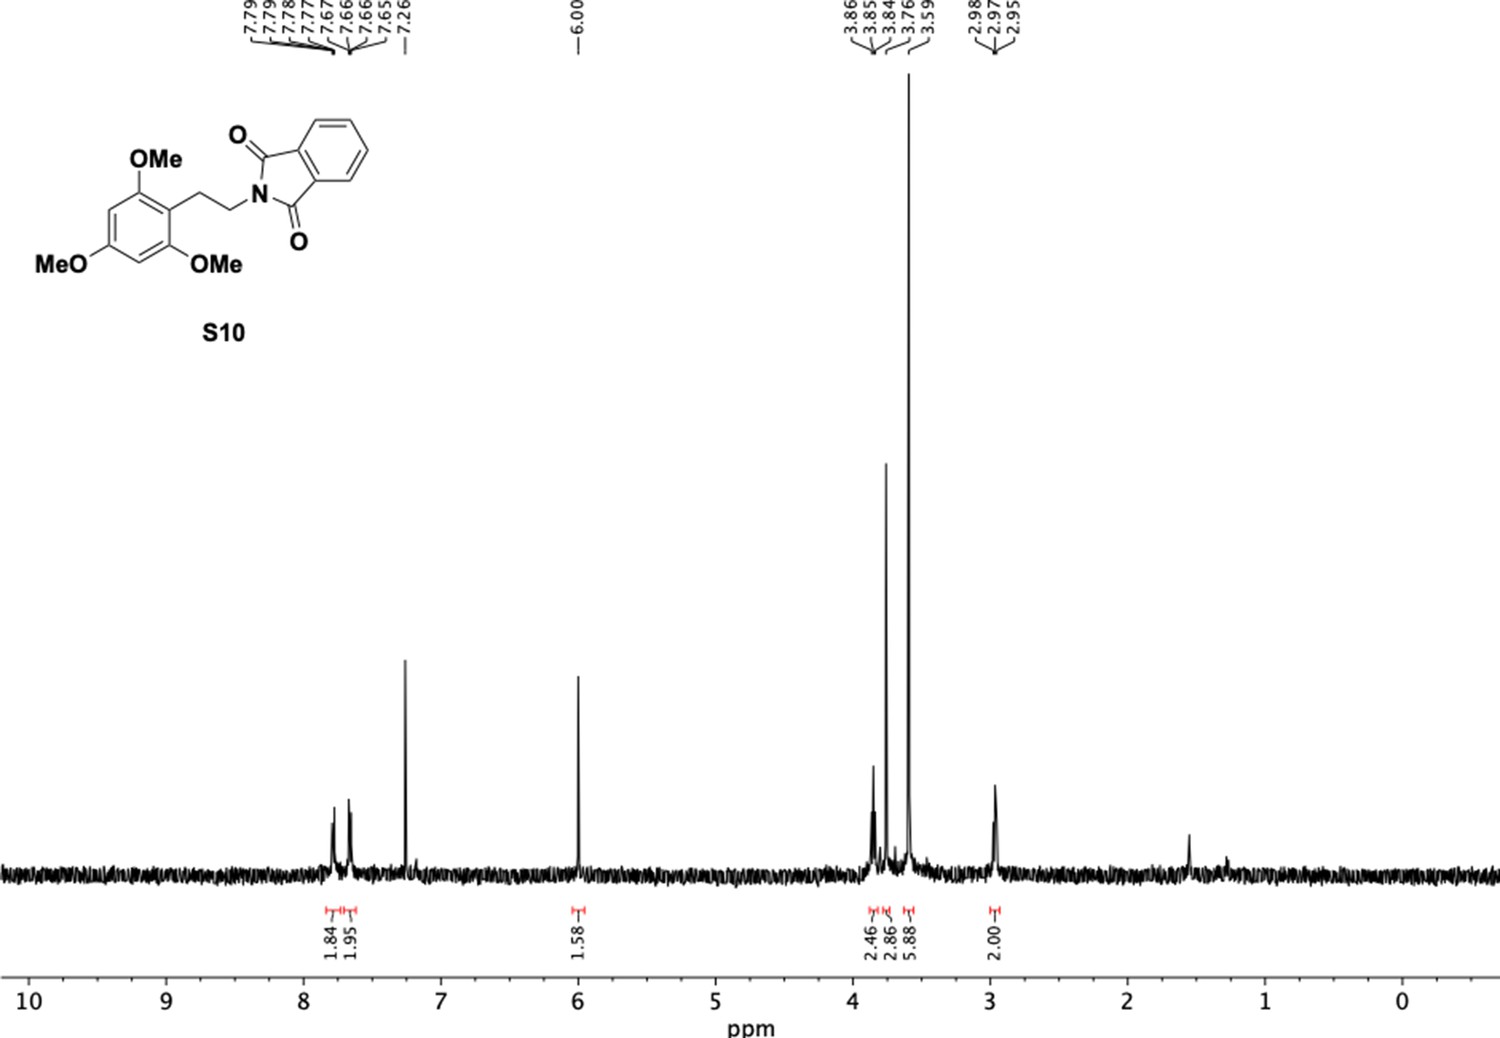
1H NMR of trimethoxyphenethyl phthalimide (S10).
Appendix 1—figure 8
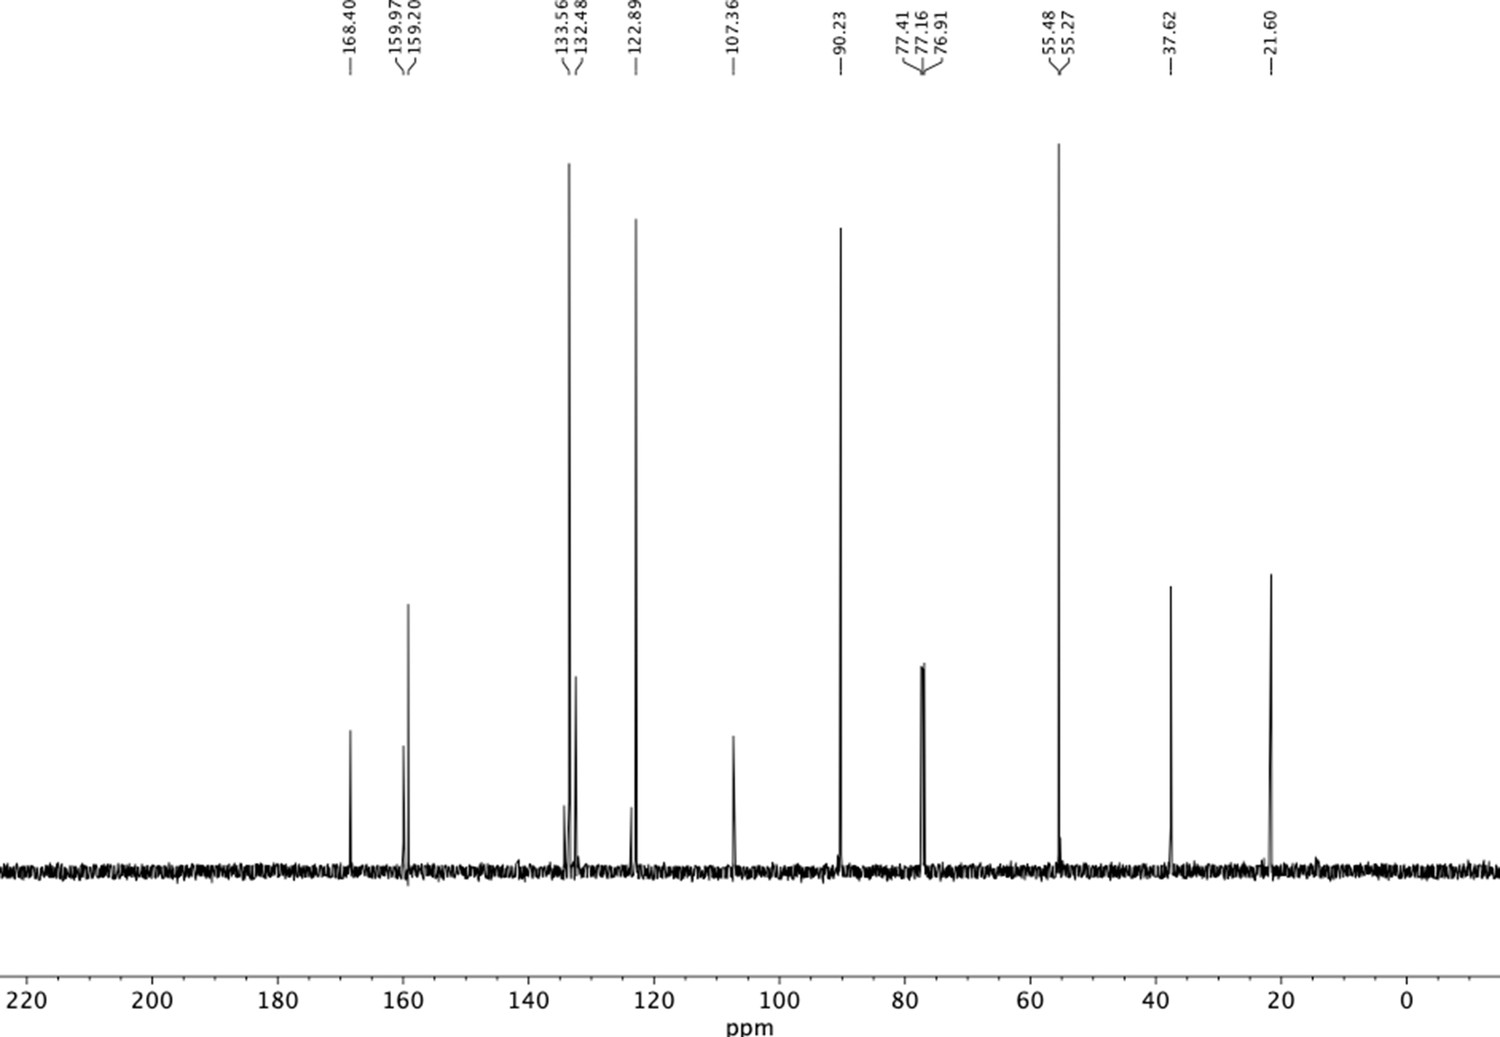
13C NMR of trimethoxyphenethyl phthalimide (S10).
Appendix 1—figure 9
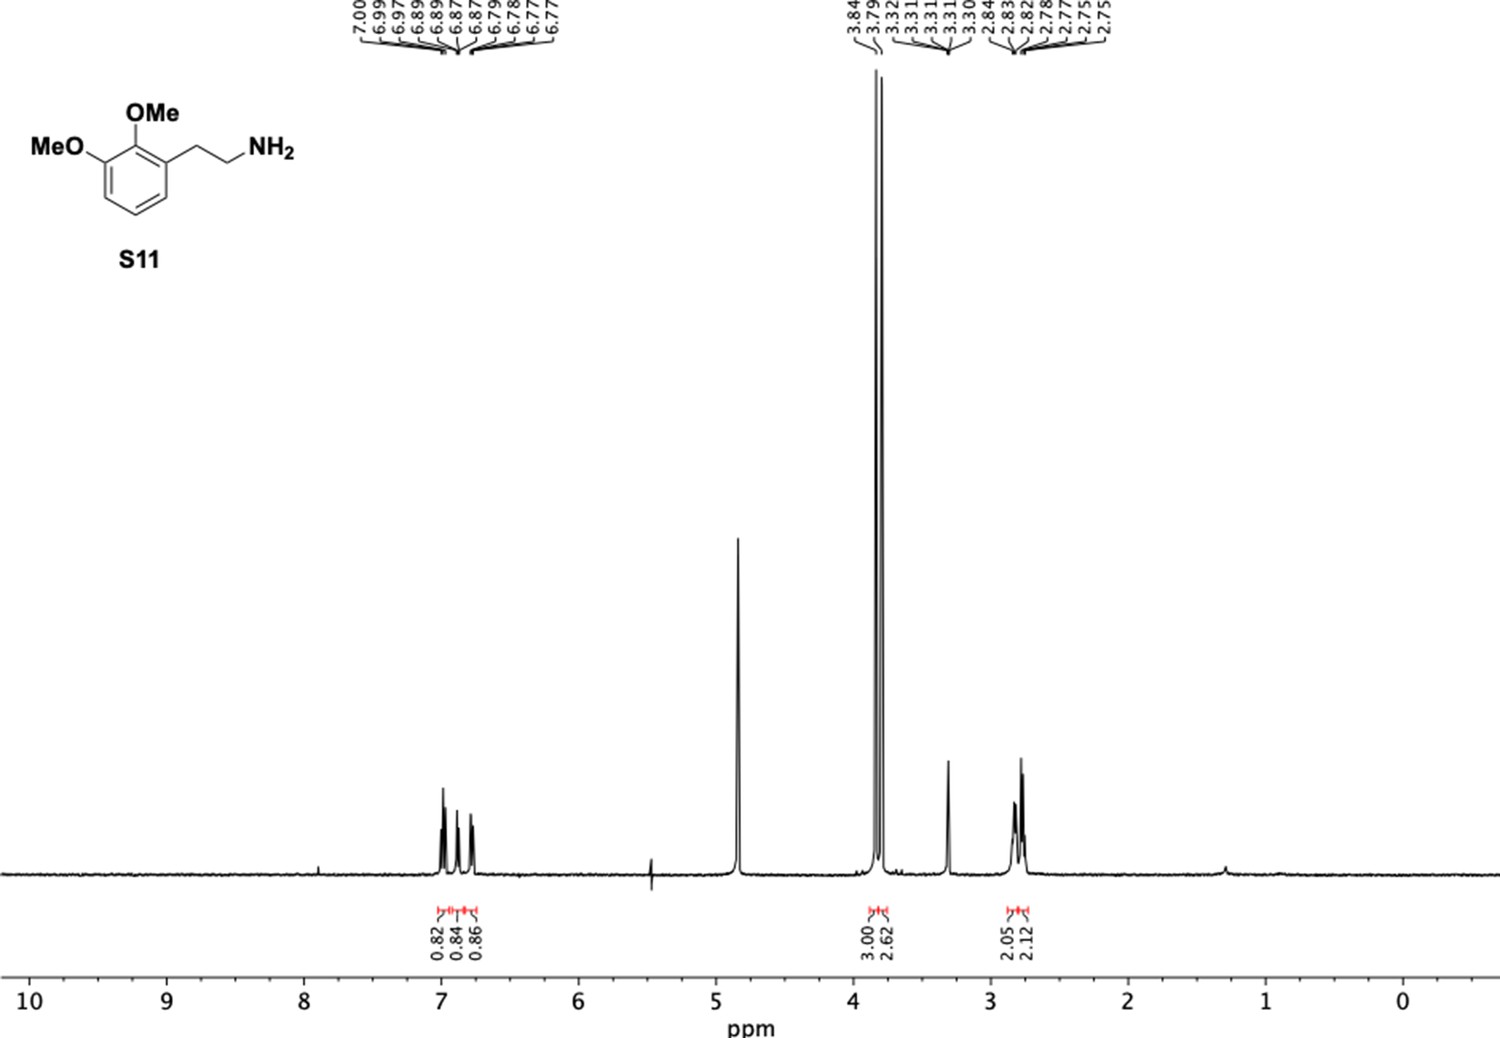
1H NMR of dimethoxyphenethyl amine (S11).
Appendix 1—figure 10
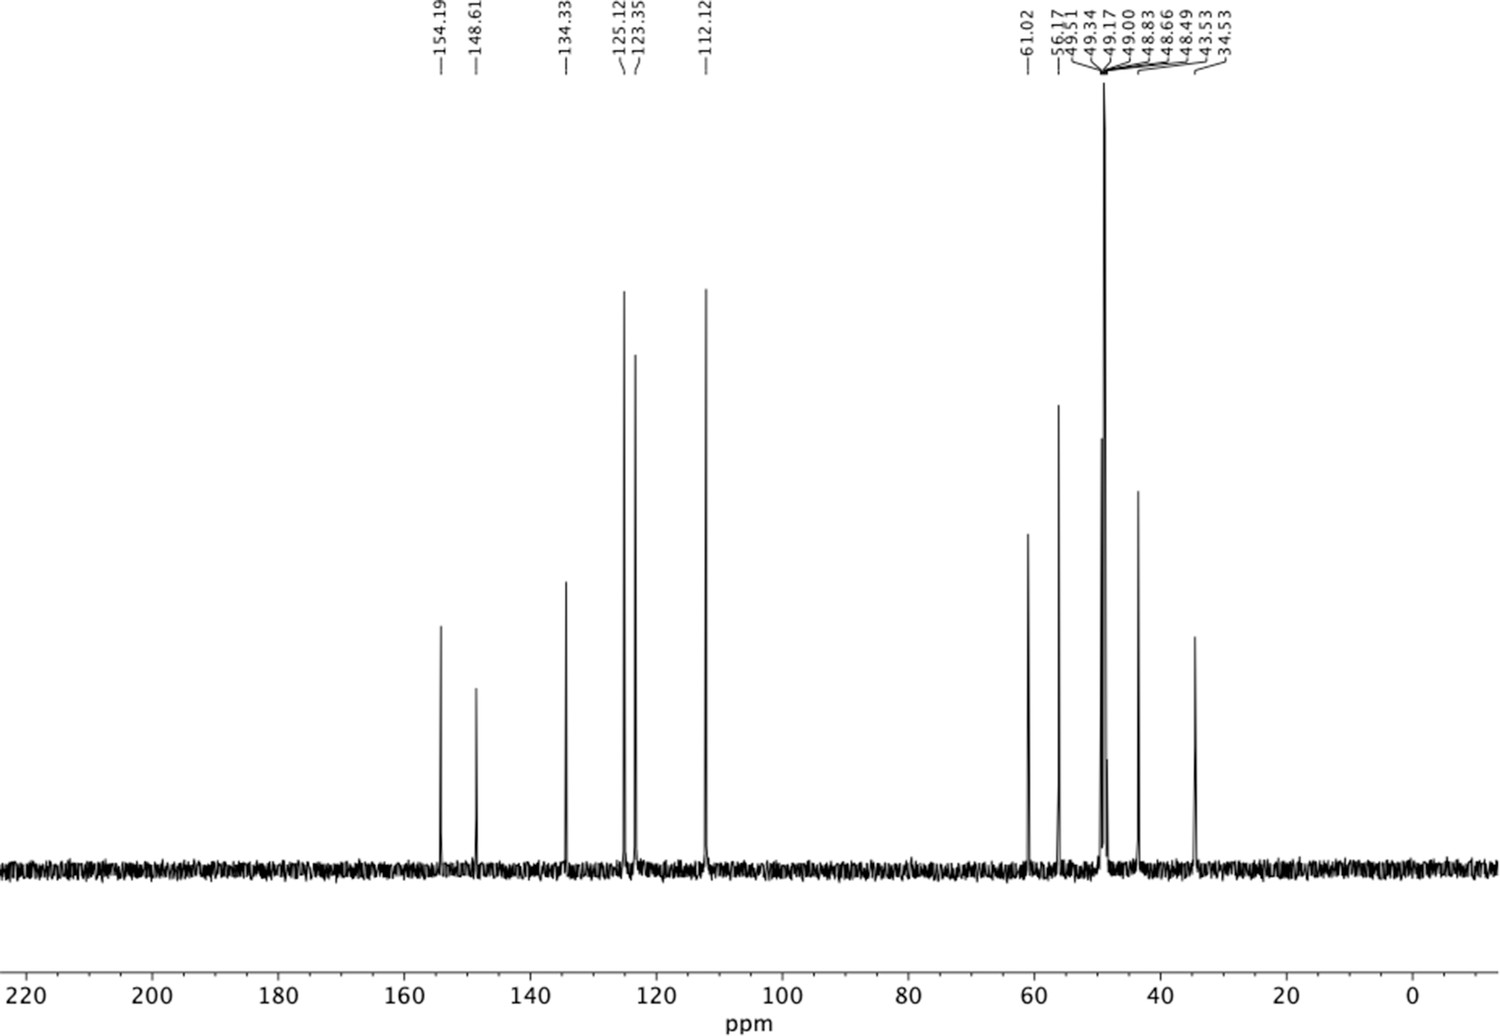
13C NMR of dimethoxyphenethyl amine (S11).
Appendix 1—figure 11
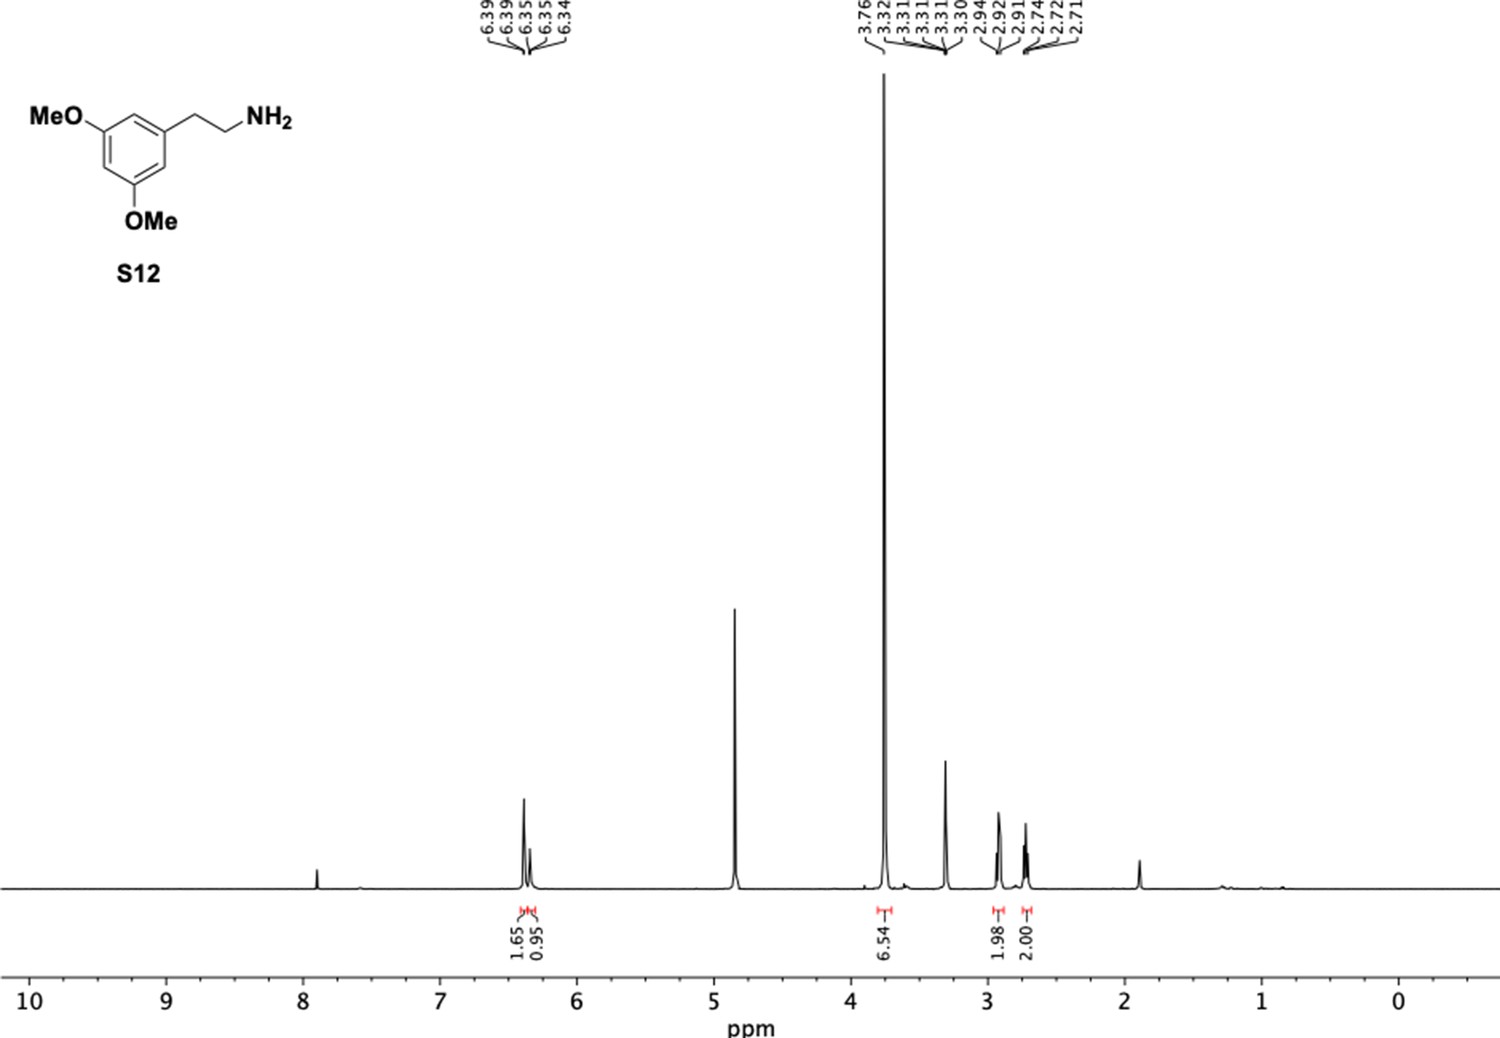
1H NMR of dimethoxyphenethyl amine (S12).
Appendix 1—figure 12
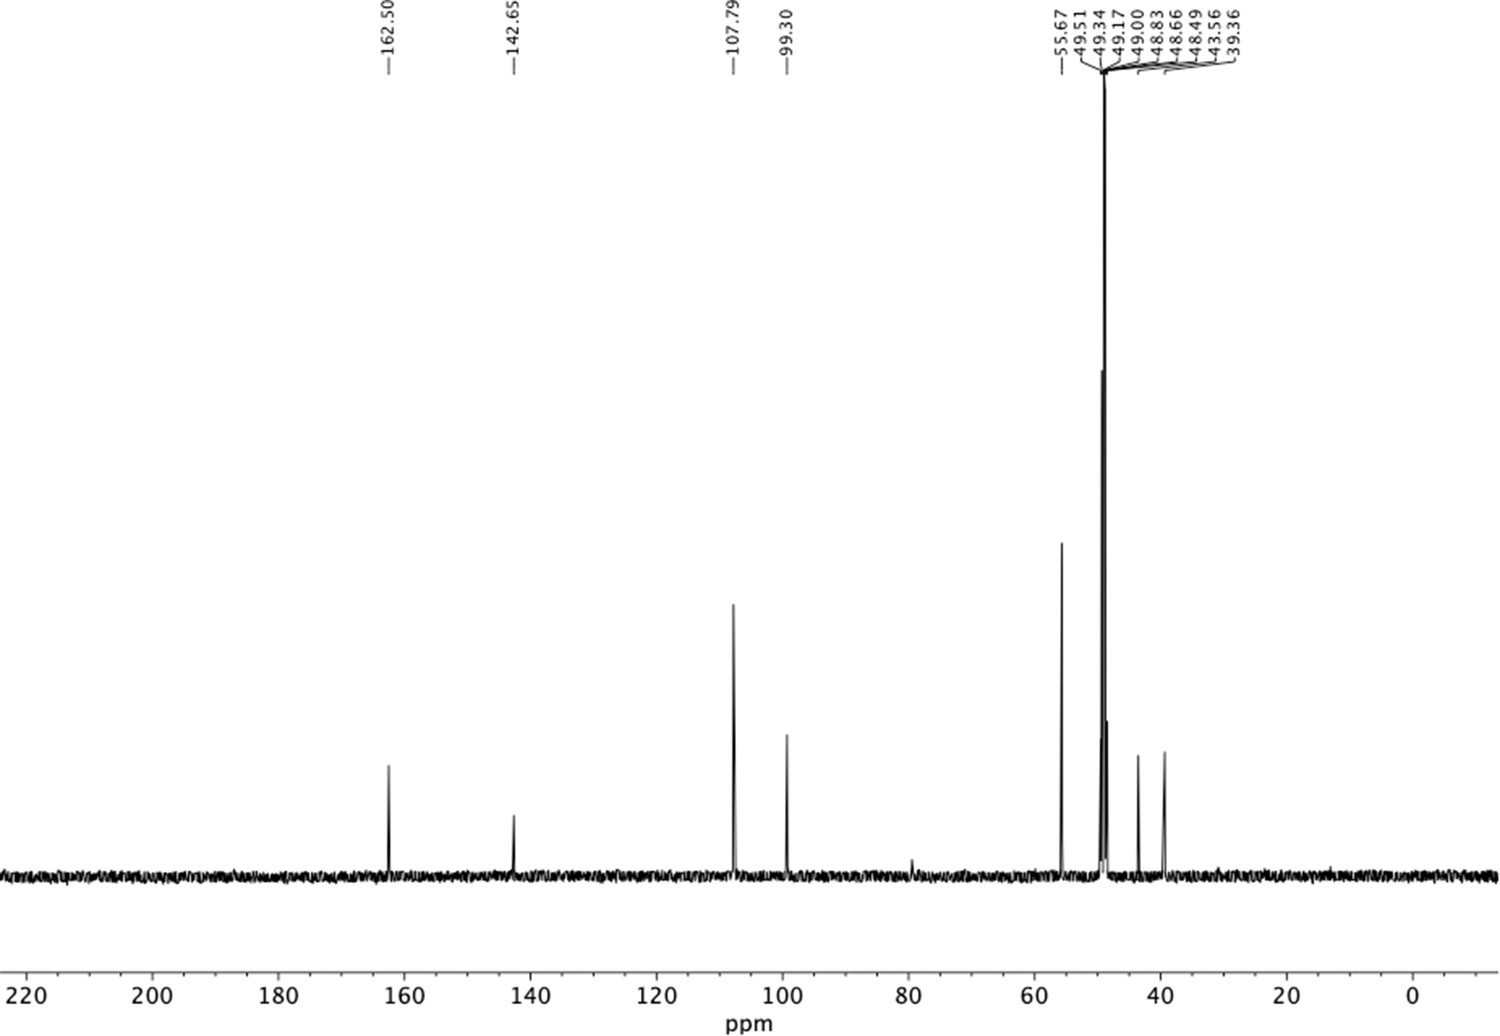
13C NMR of dimethoxyphenethyl amine (S12).
Appendix 1—figure 13
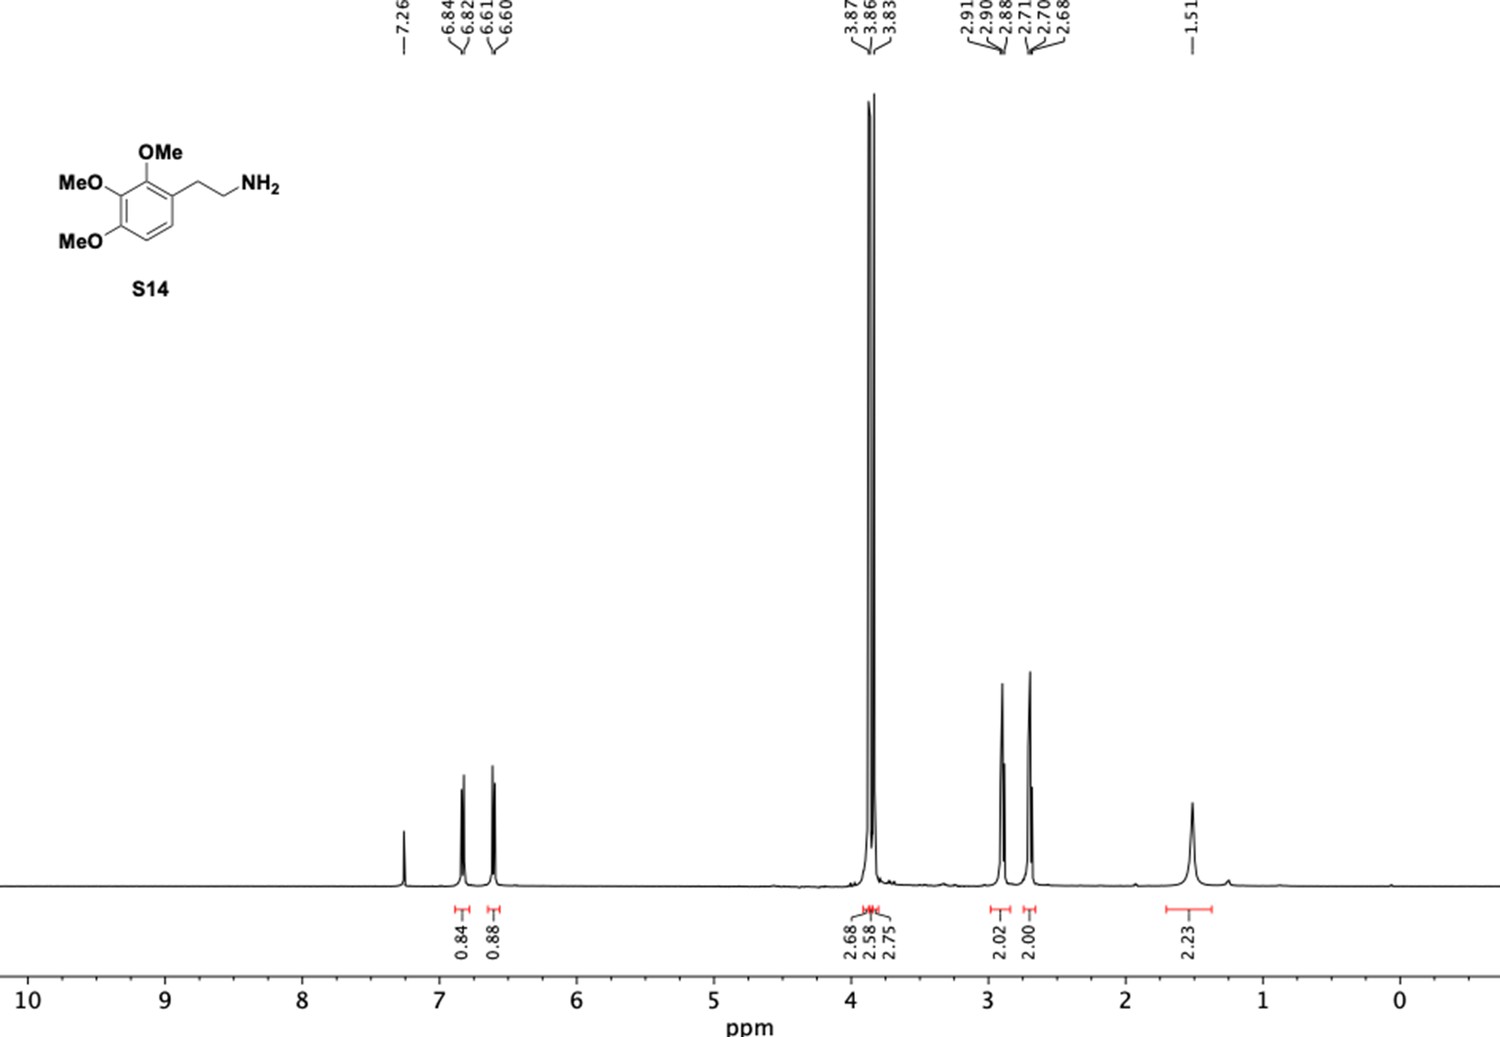
1H NMR of trimethoxyphenethyl amine (S14).
Appendix 1—figure 14
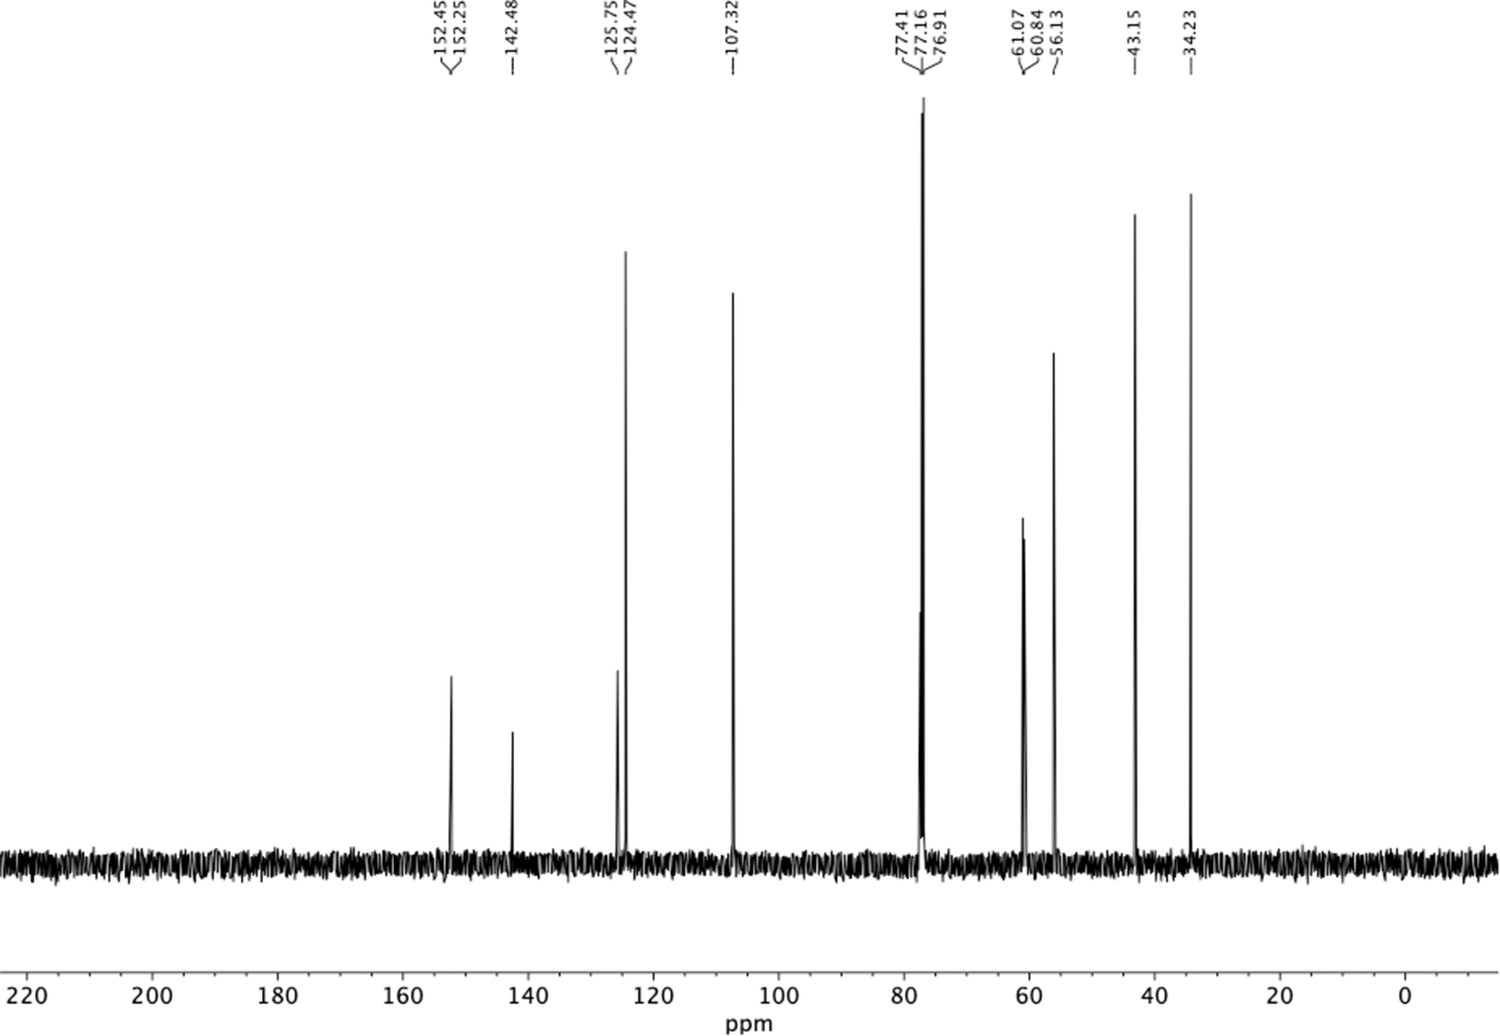
13C NMR of trimethoxyphenethyl amine (S14).
Appendix 1—figure 15

1H NMR of trimethoxyphenethyl amine (S15).
Appendix 1—figure 16
13C NMR of trimethoxyphenethyl amine (S15).
Appendix 1—figure 17

1H NMR of aminoethylbenzene diol hydrobromide (S16).
Appendix 1—figure 18
13C NMR of aminoethylbenzene diol hydrobromide (S16).
Appendix 1—figure 19
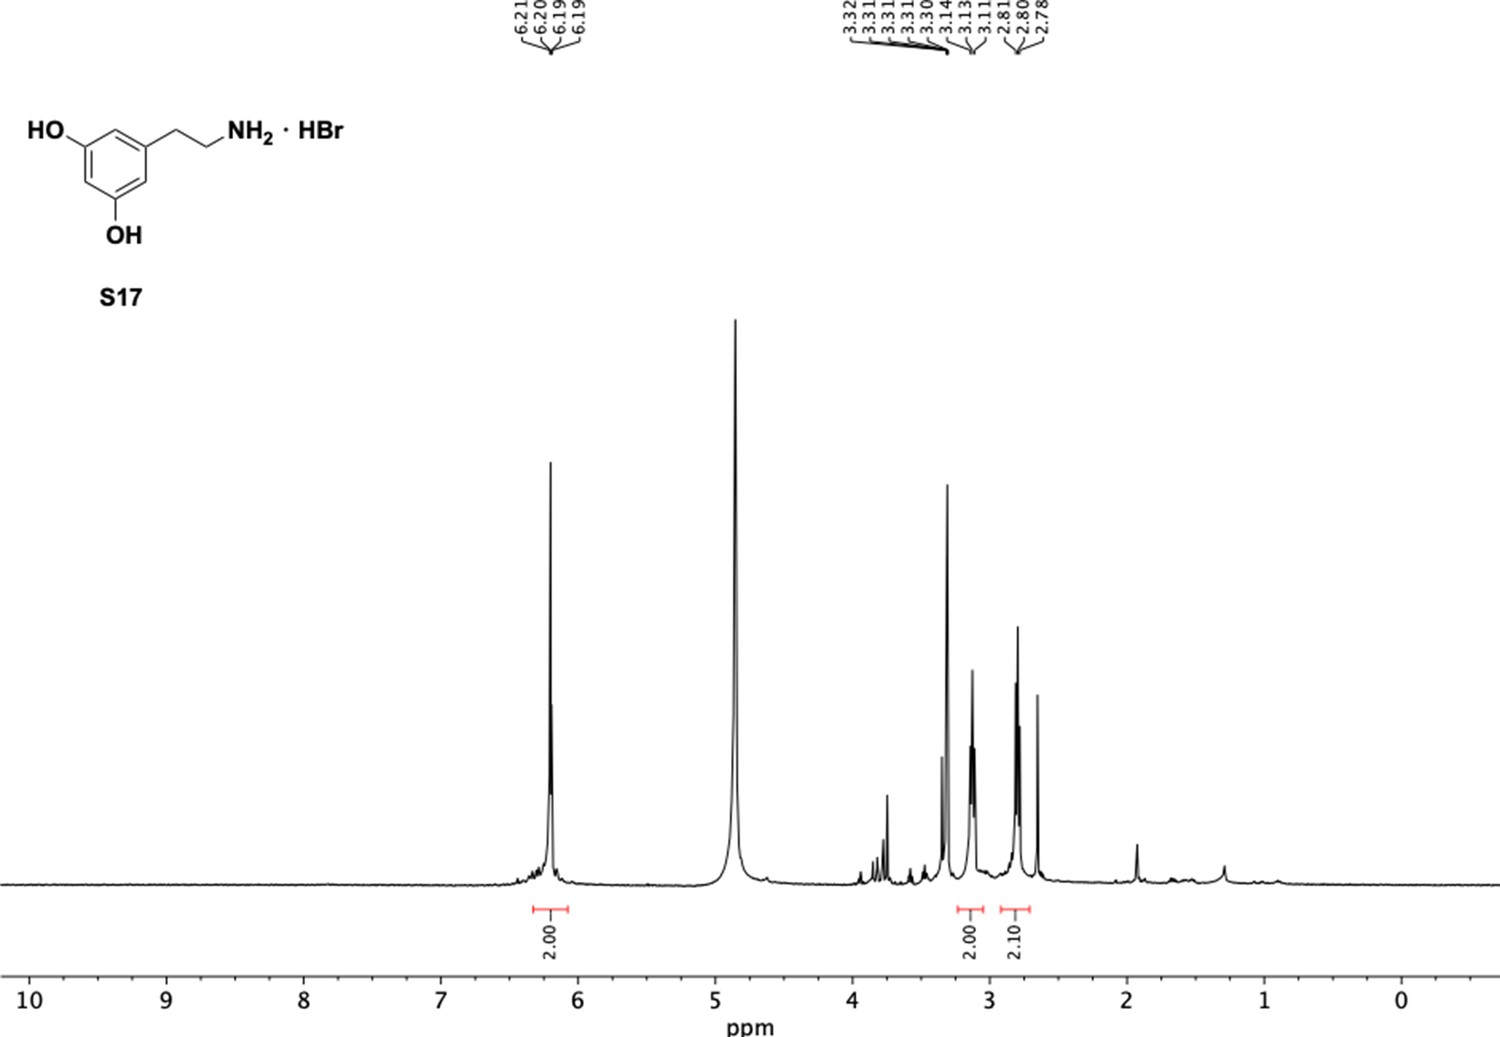
1H NMR of aminoethylbenzene diol hydrobromide (S17).
Appendix 1—figure 20
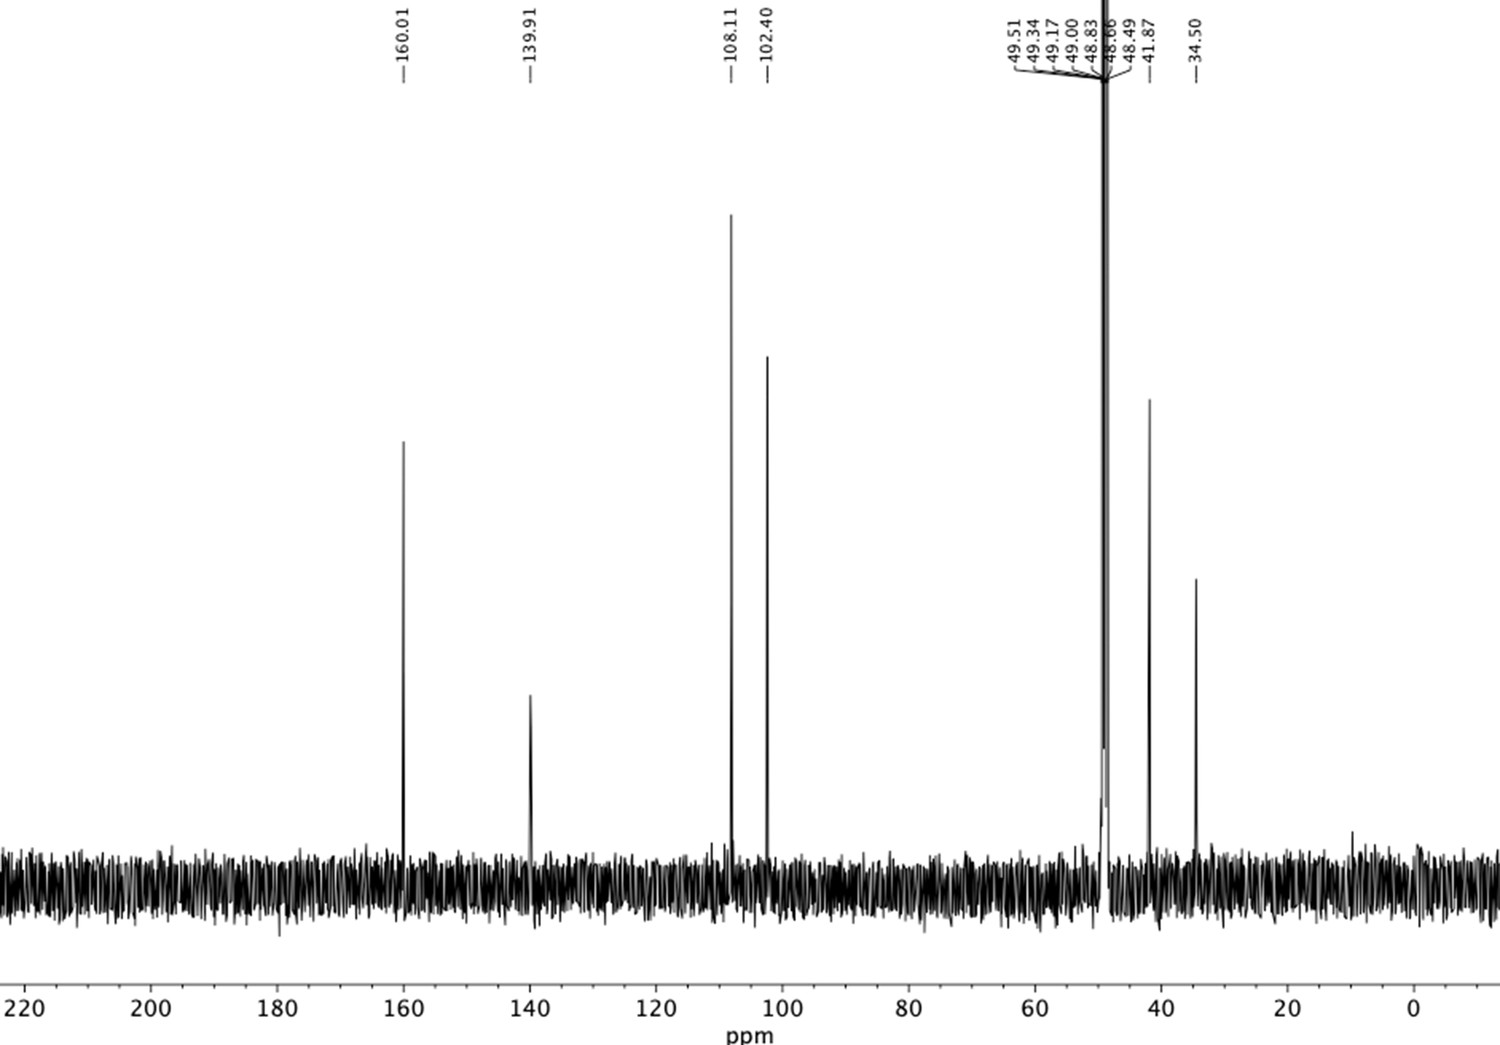
13C NMR of aminoethylbenzene diol hydrobromide (S17).
Appendix 1—figure 21
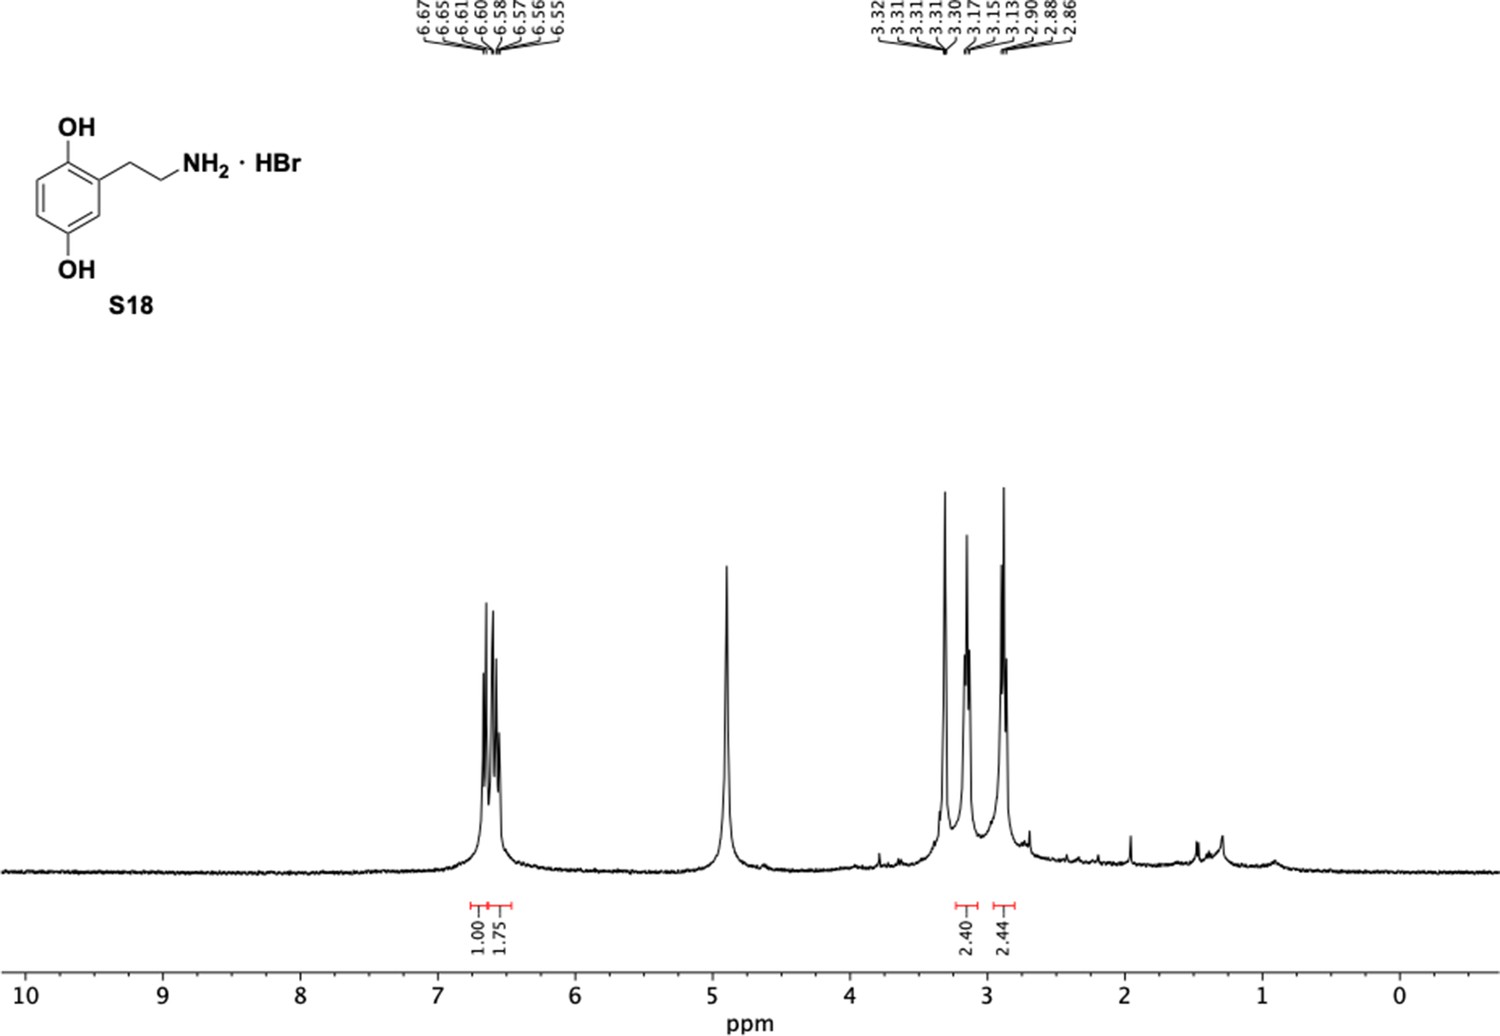
1H NMR of aminoethylbenzene diol hydrobromide (S18).
Appendix 1—figure 22
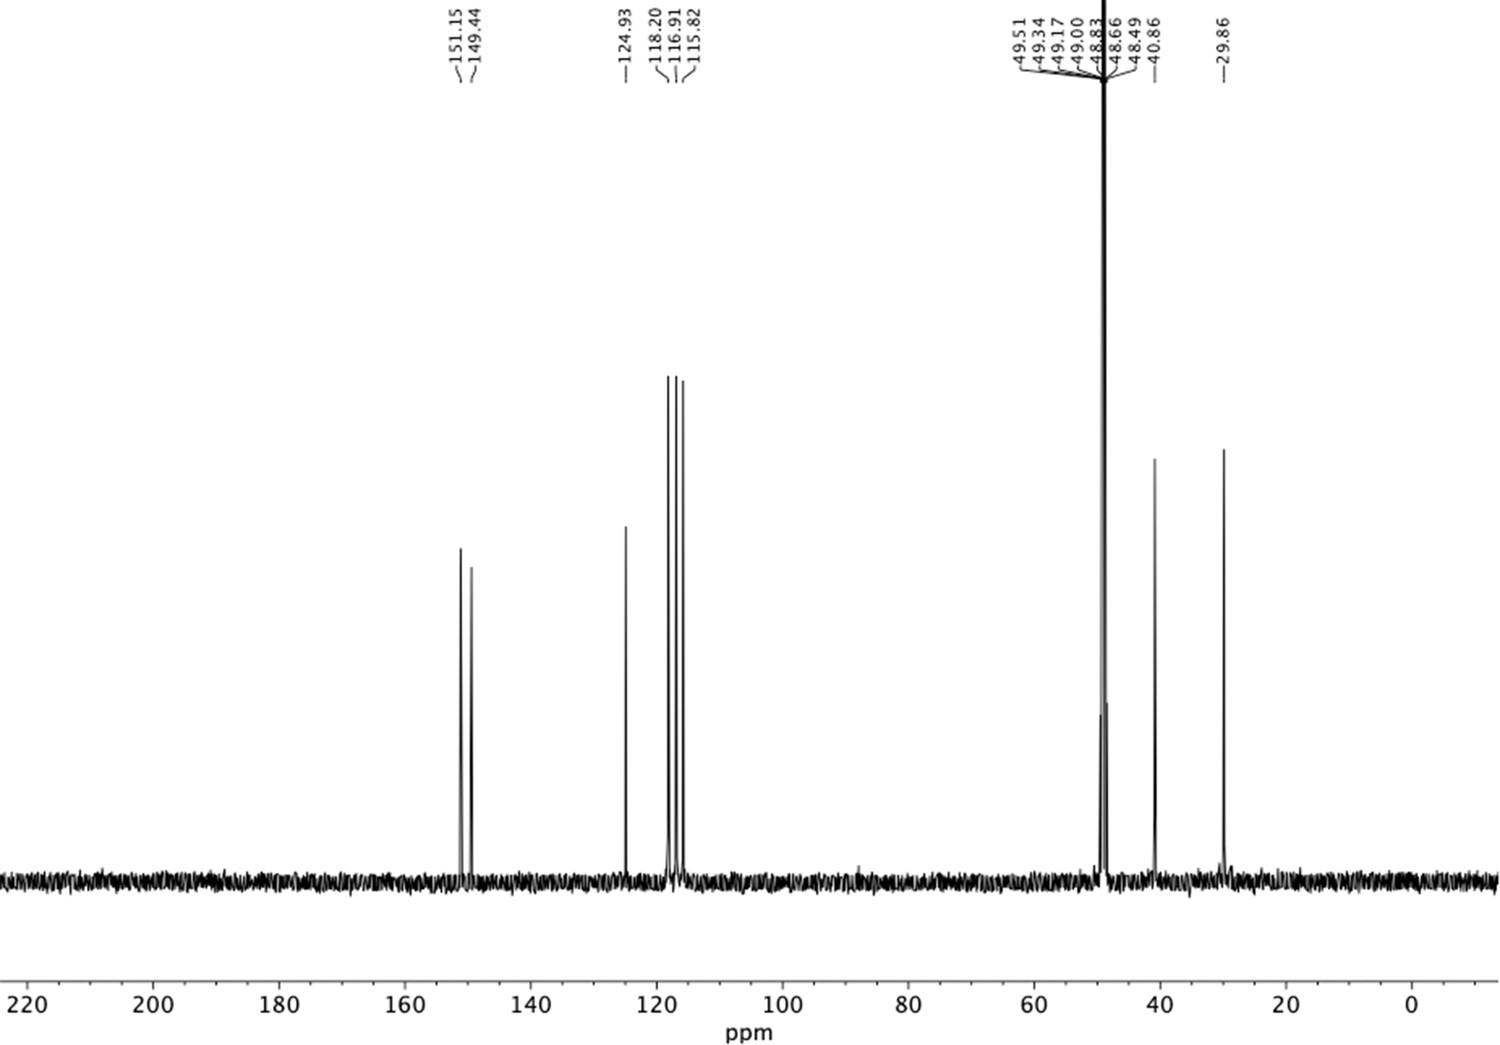
13C NMR of aminoethylbenzene diol hydrobromide (S18).
Appendix 1—figure 23
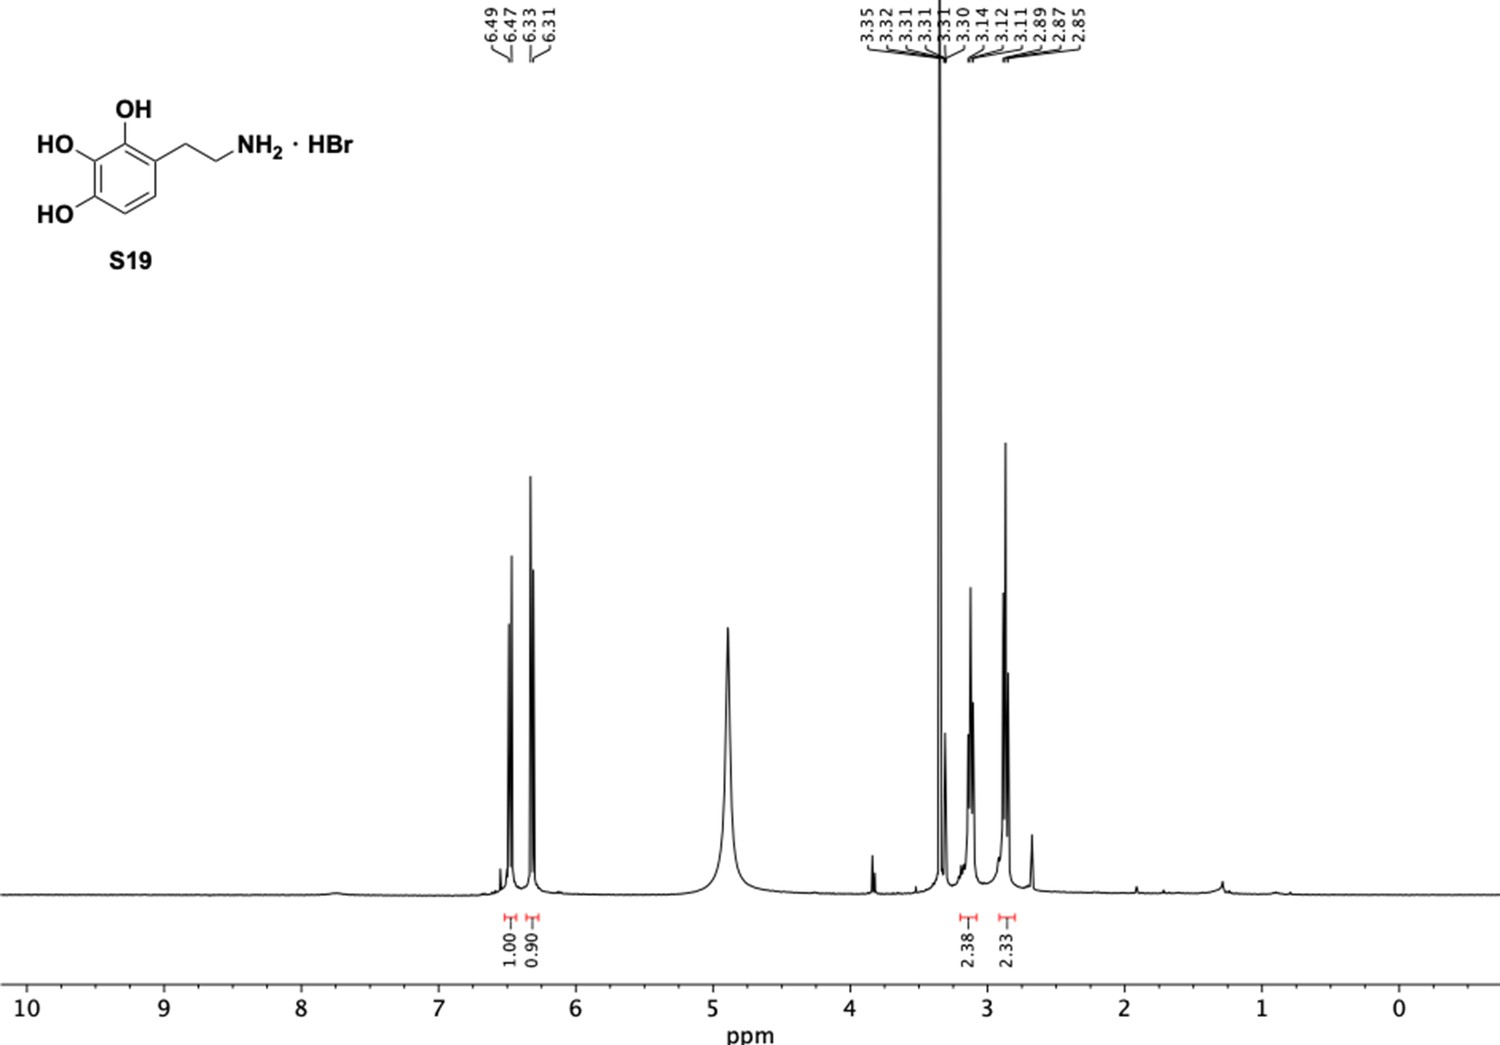
1H NMR of aminoethylbenzene triol hydrobromide (S19).
Appendix 1—figure 24
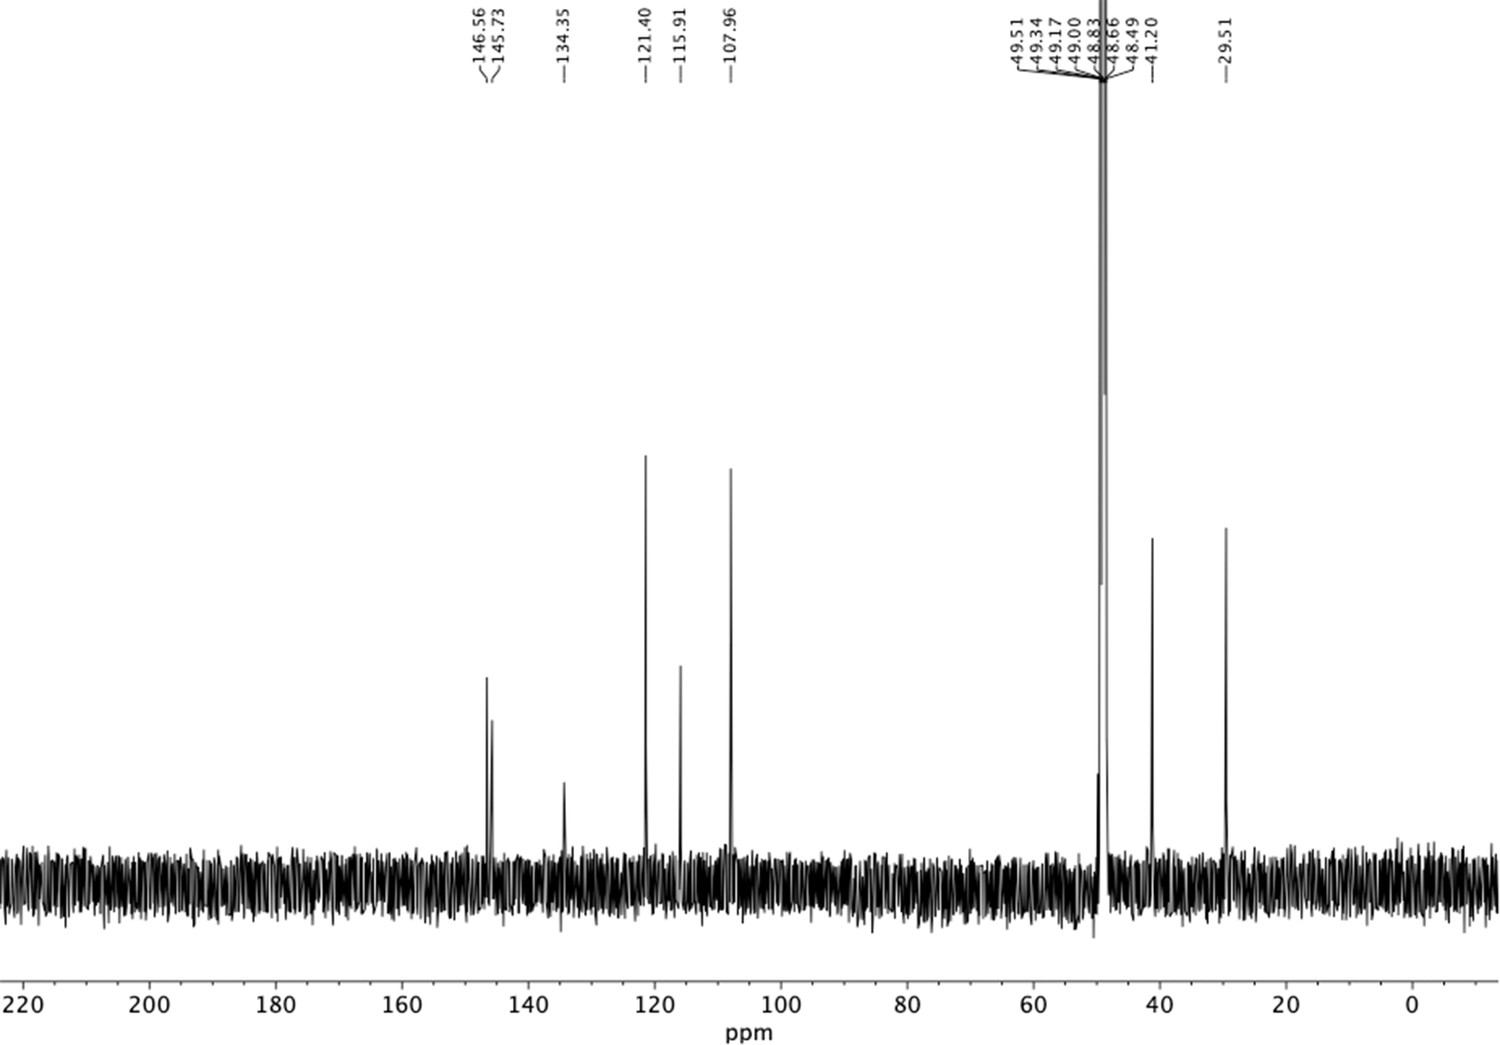
13C NMR of aminoethylbenzene triol hydrobromide (S19).
Appendix 1—figure 25
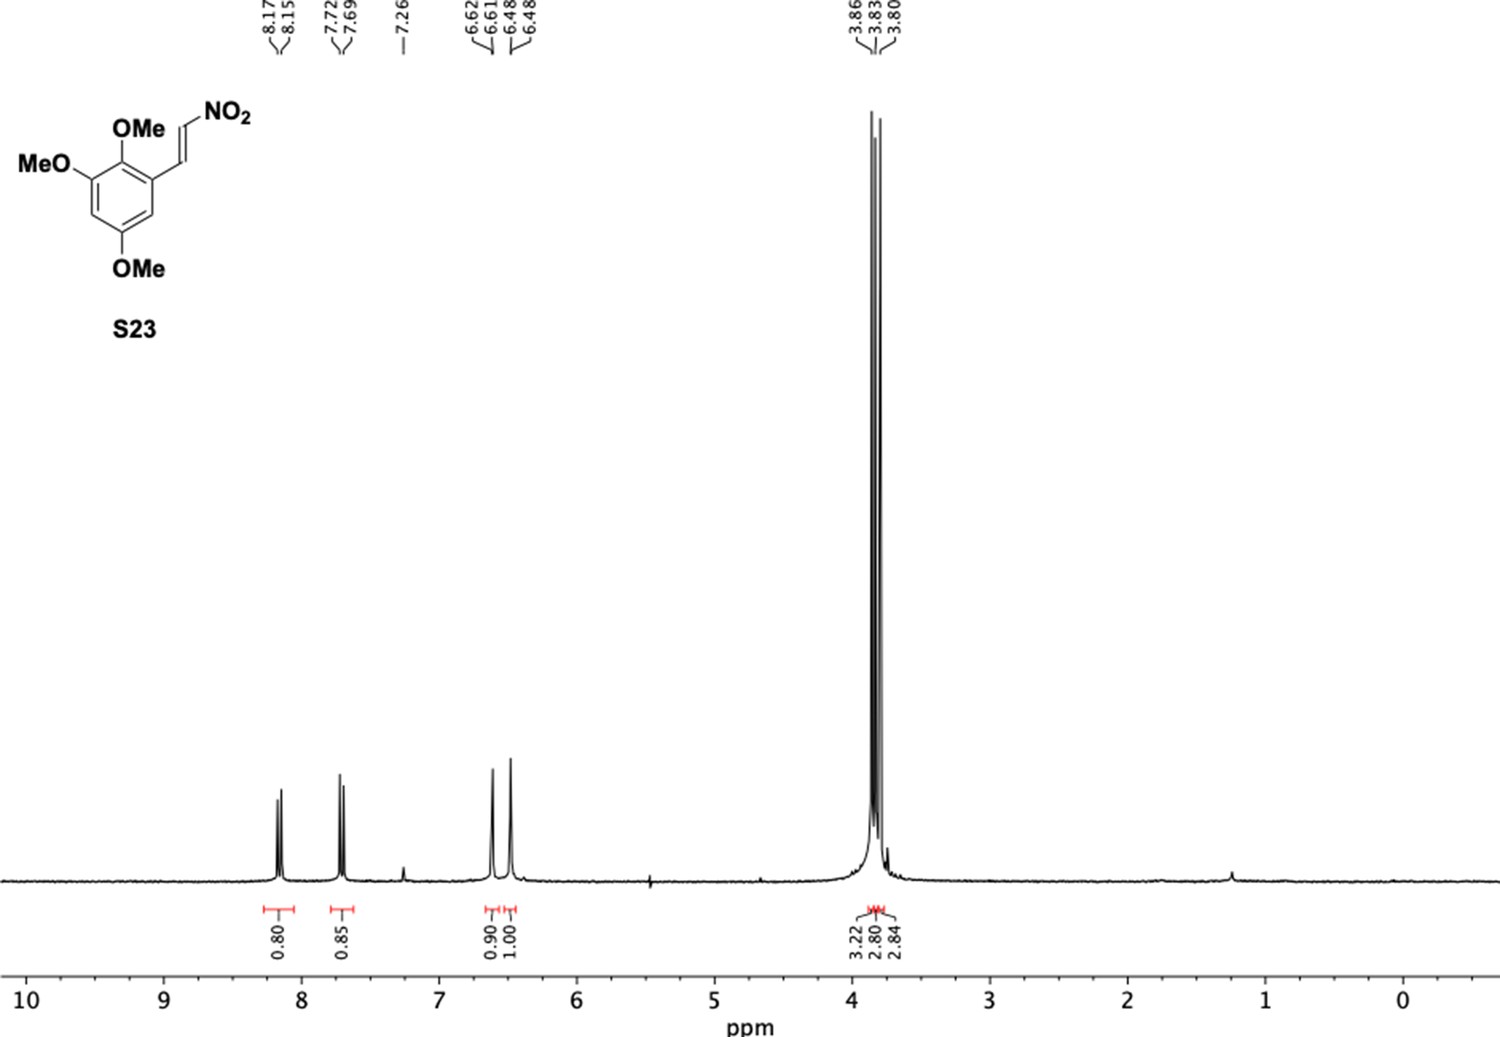
1H NMR of nitrovinyl benzene (S23).
Appendix 1—figure 26
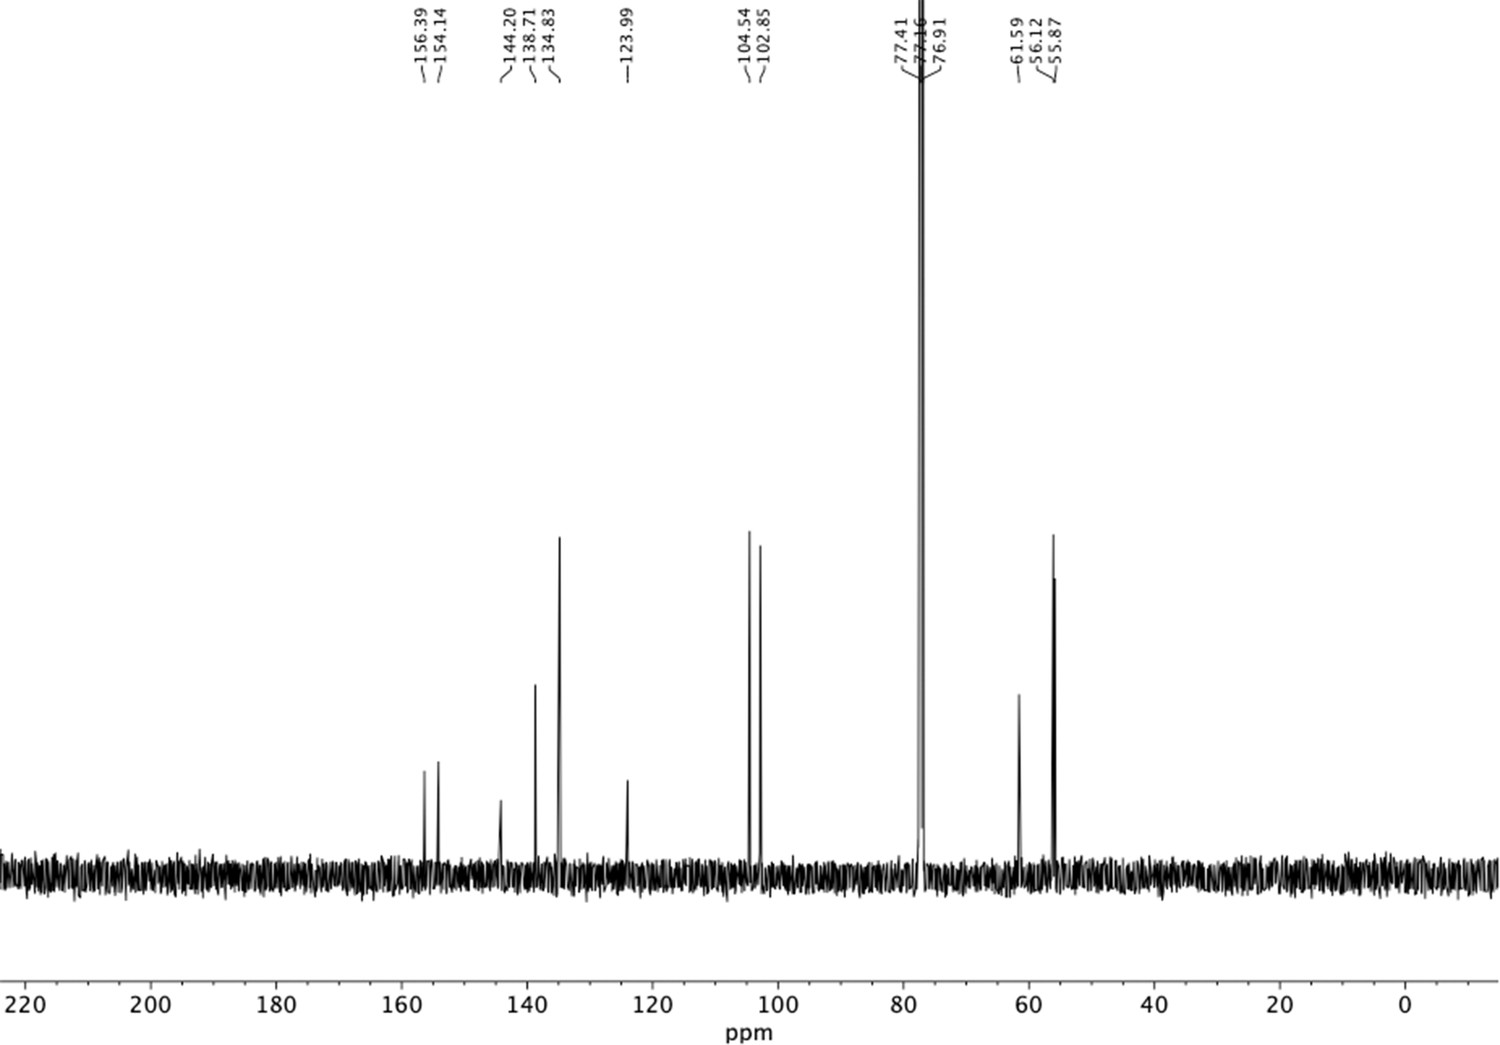
13C NMR of nitrovinyl benzene (S23).
Appendix 1—figure 27
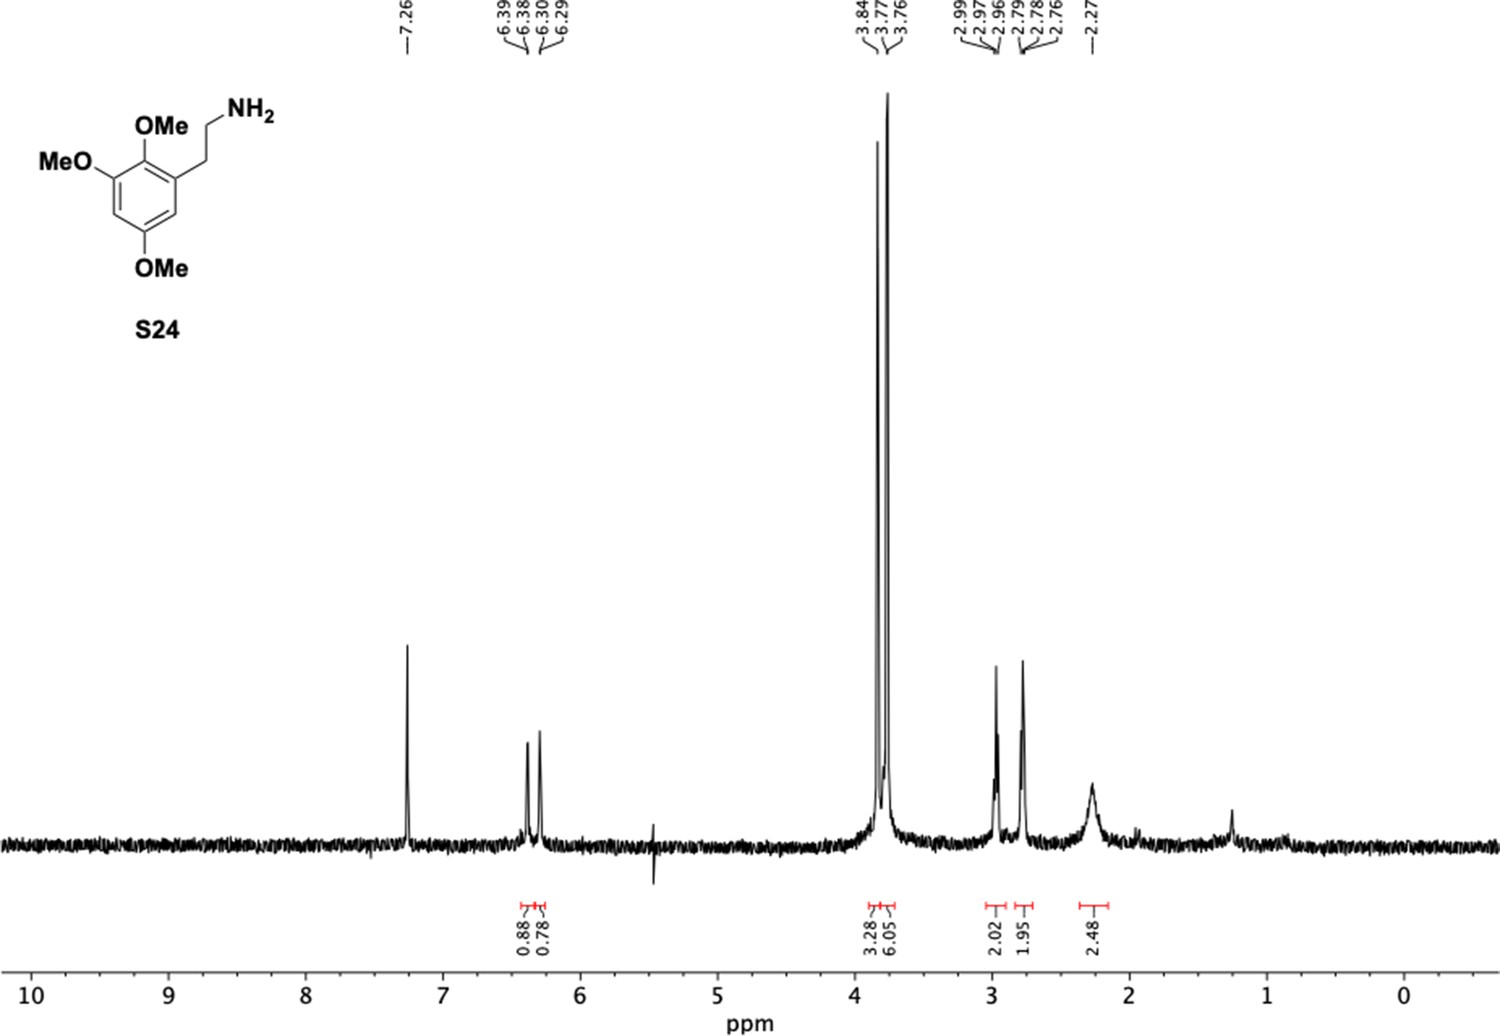
1H NMR of trimethoxyphenethyl amine (S24).
Appendix 1—figure 28

13C NMR of trimethoxyphenethyl amine (S24).
Appendix 1—figure 29
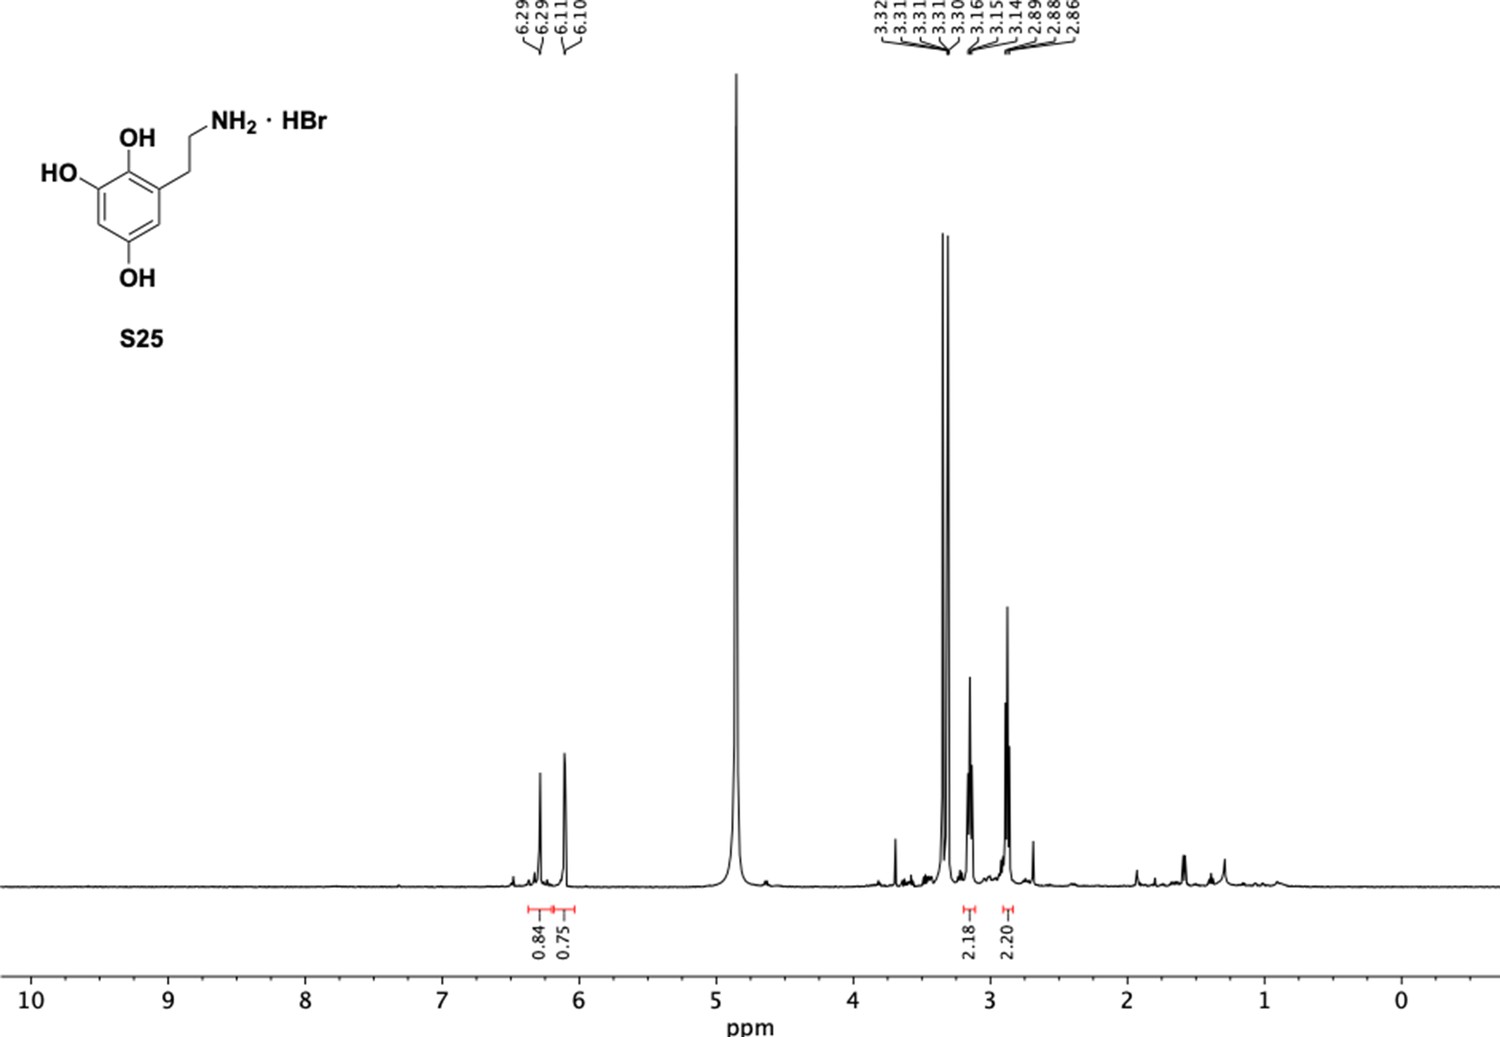
1H NMR of aminoethylbenzene triol hydrobromide (S25).
Appendix 1—figure 30
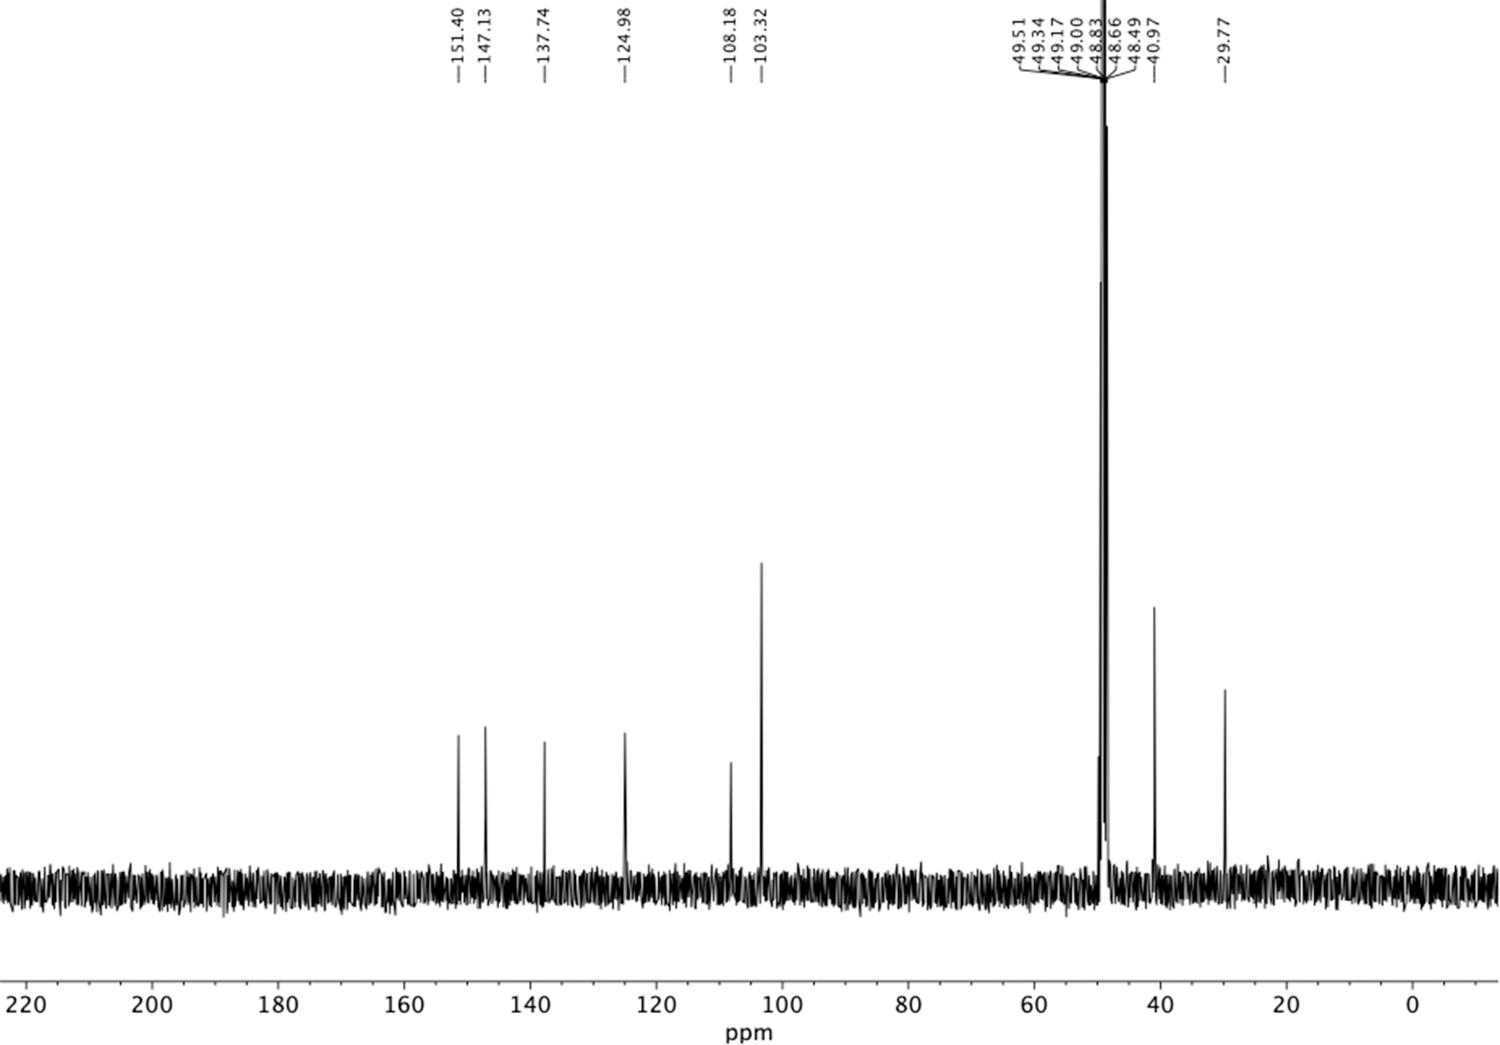
13C NMR of aminoethylbenzene triol hydrobromide (S25).
Appendix 1—figure 31
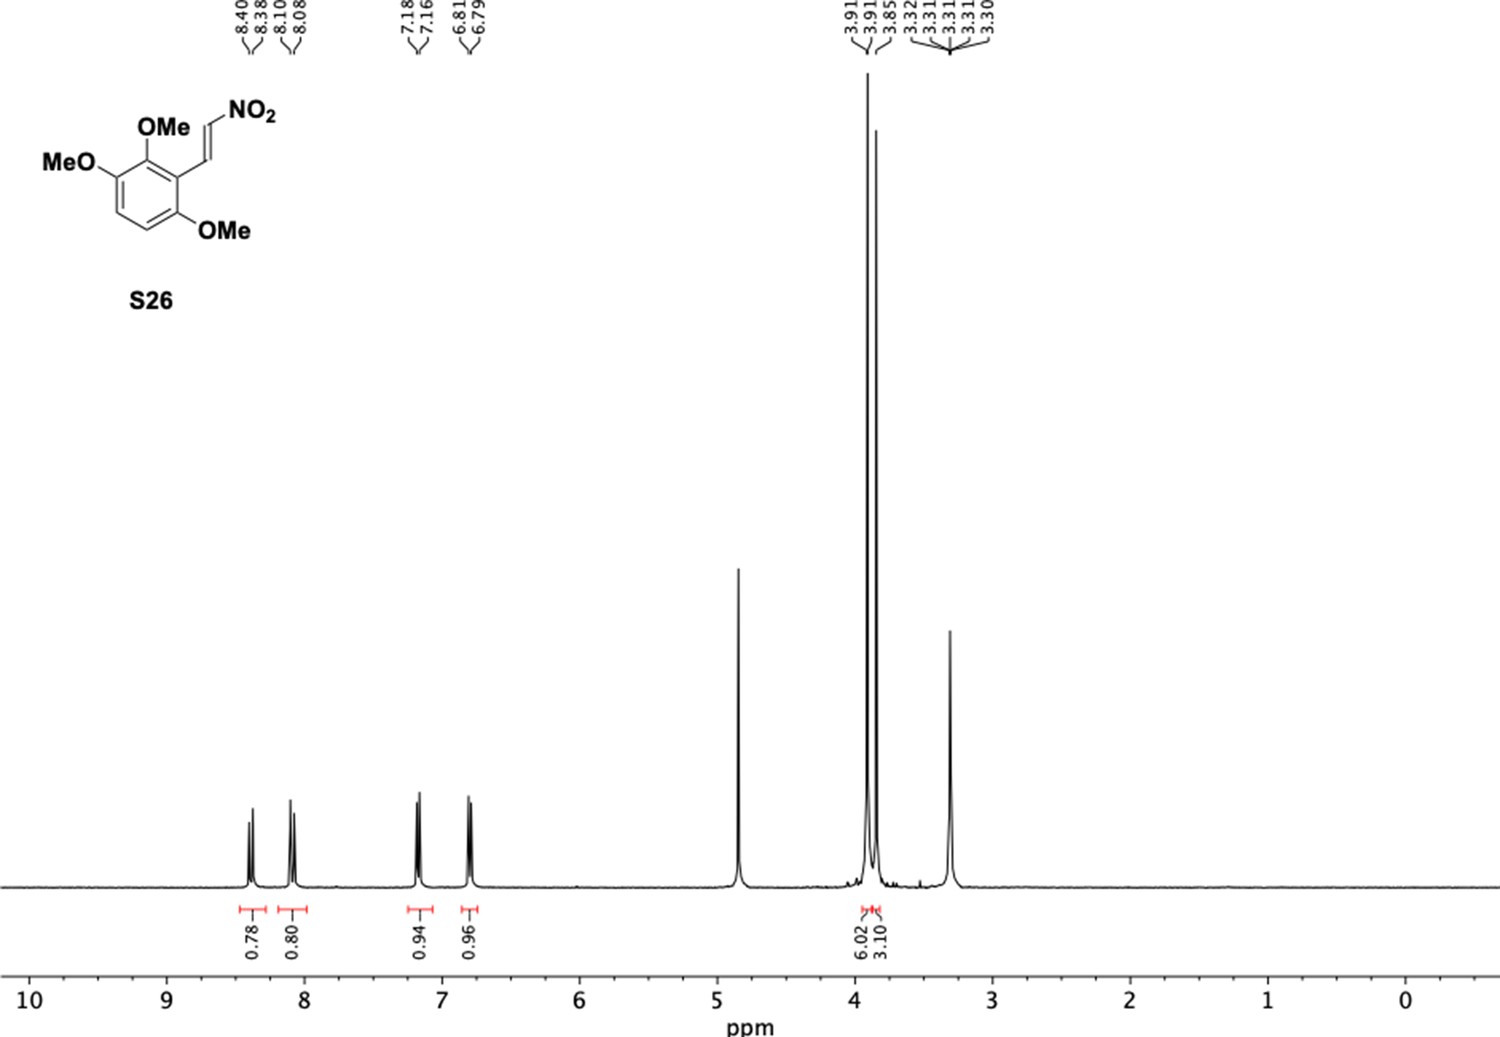
1H NMR of trimethoxy nitrovinyl benzene (S26).
Appendix 1—figure 32
13C NMR of trimethoxy nitrovinyl benzene (S26).
Appendix 1—figure 33
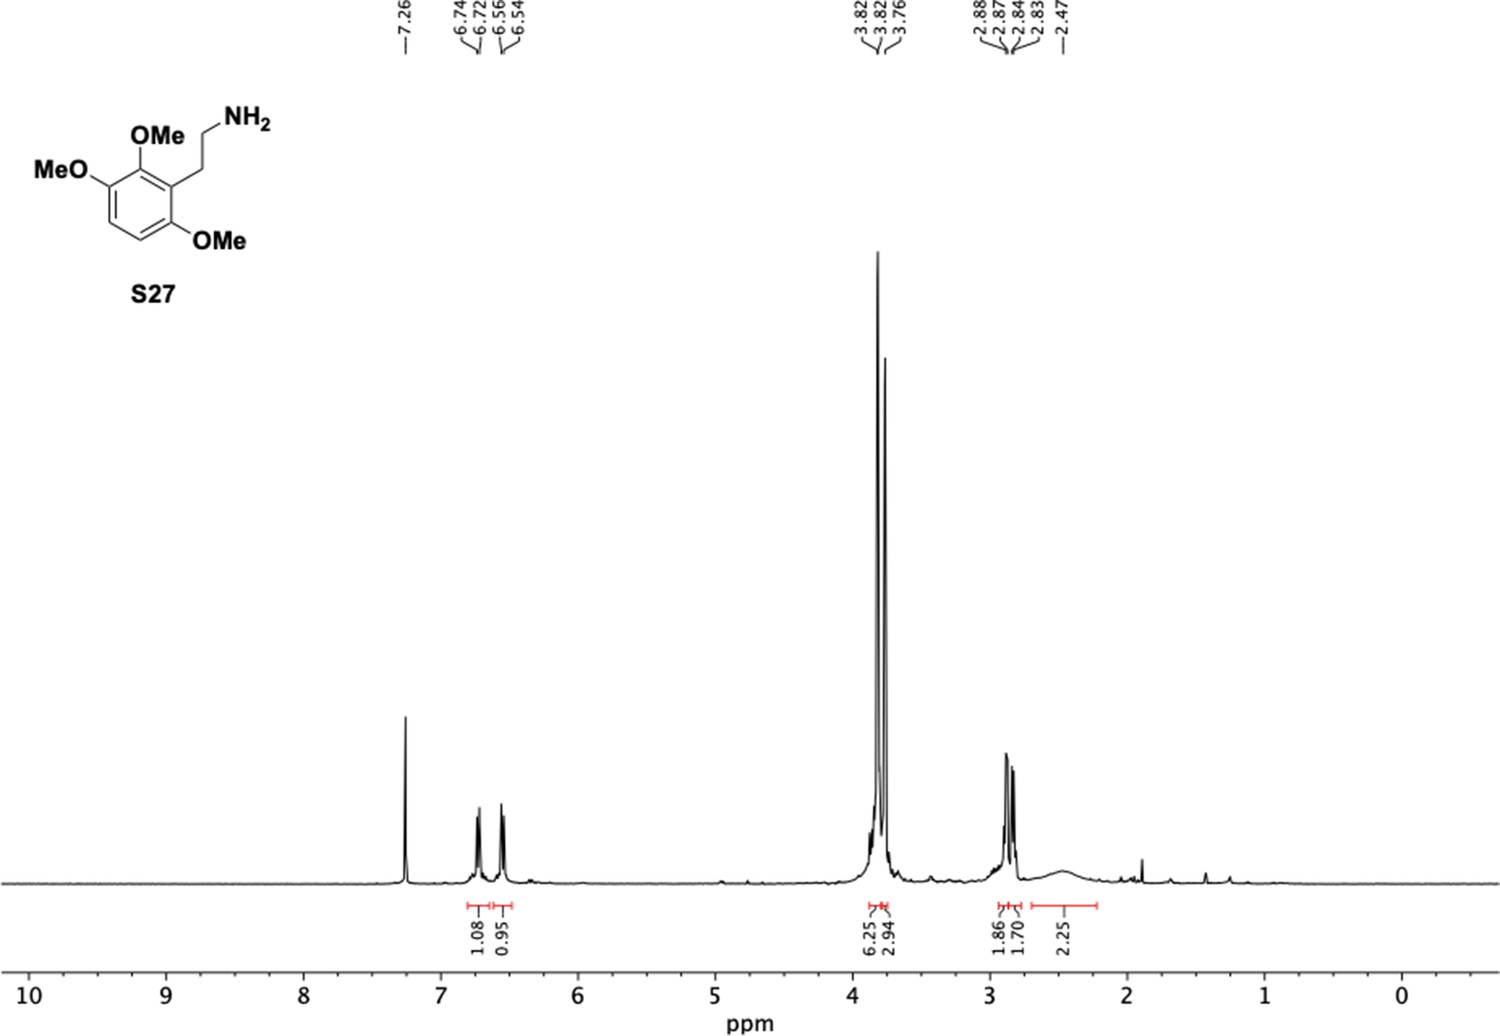
1H NMR of trimethoxyphenethyl amine (S27).
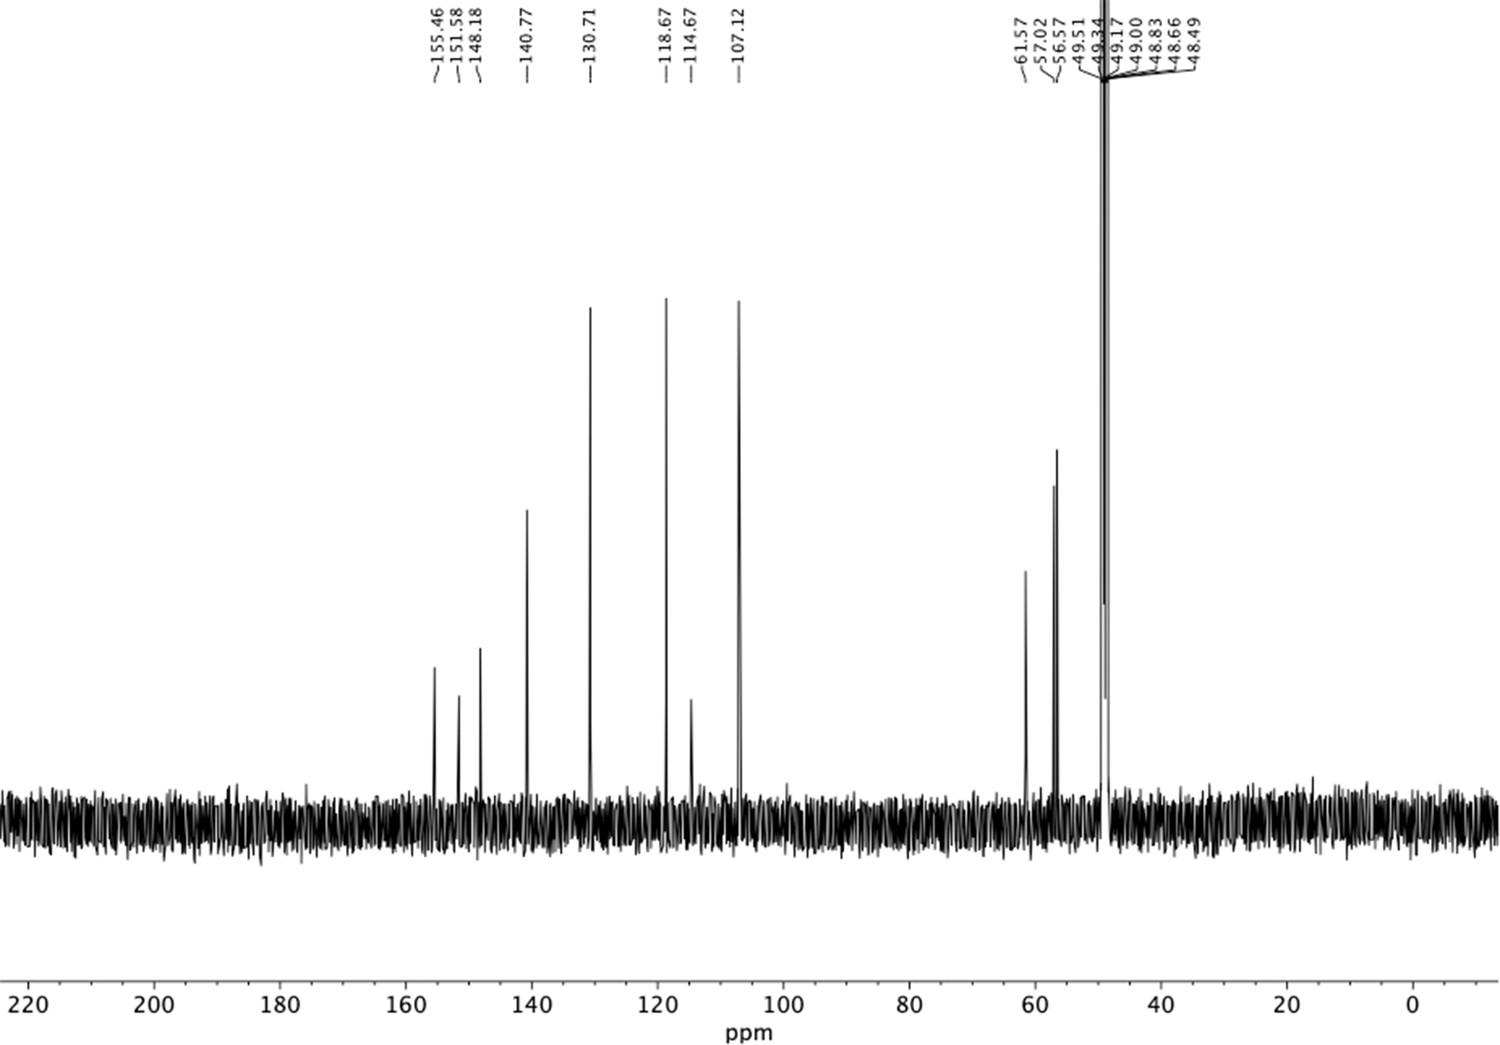
Appendix 1—figure 34
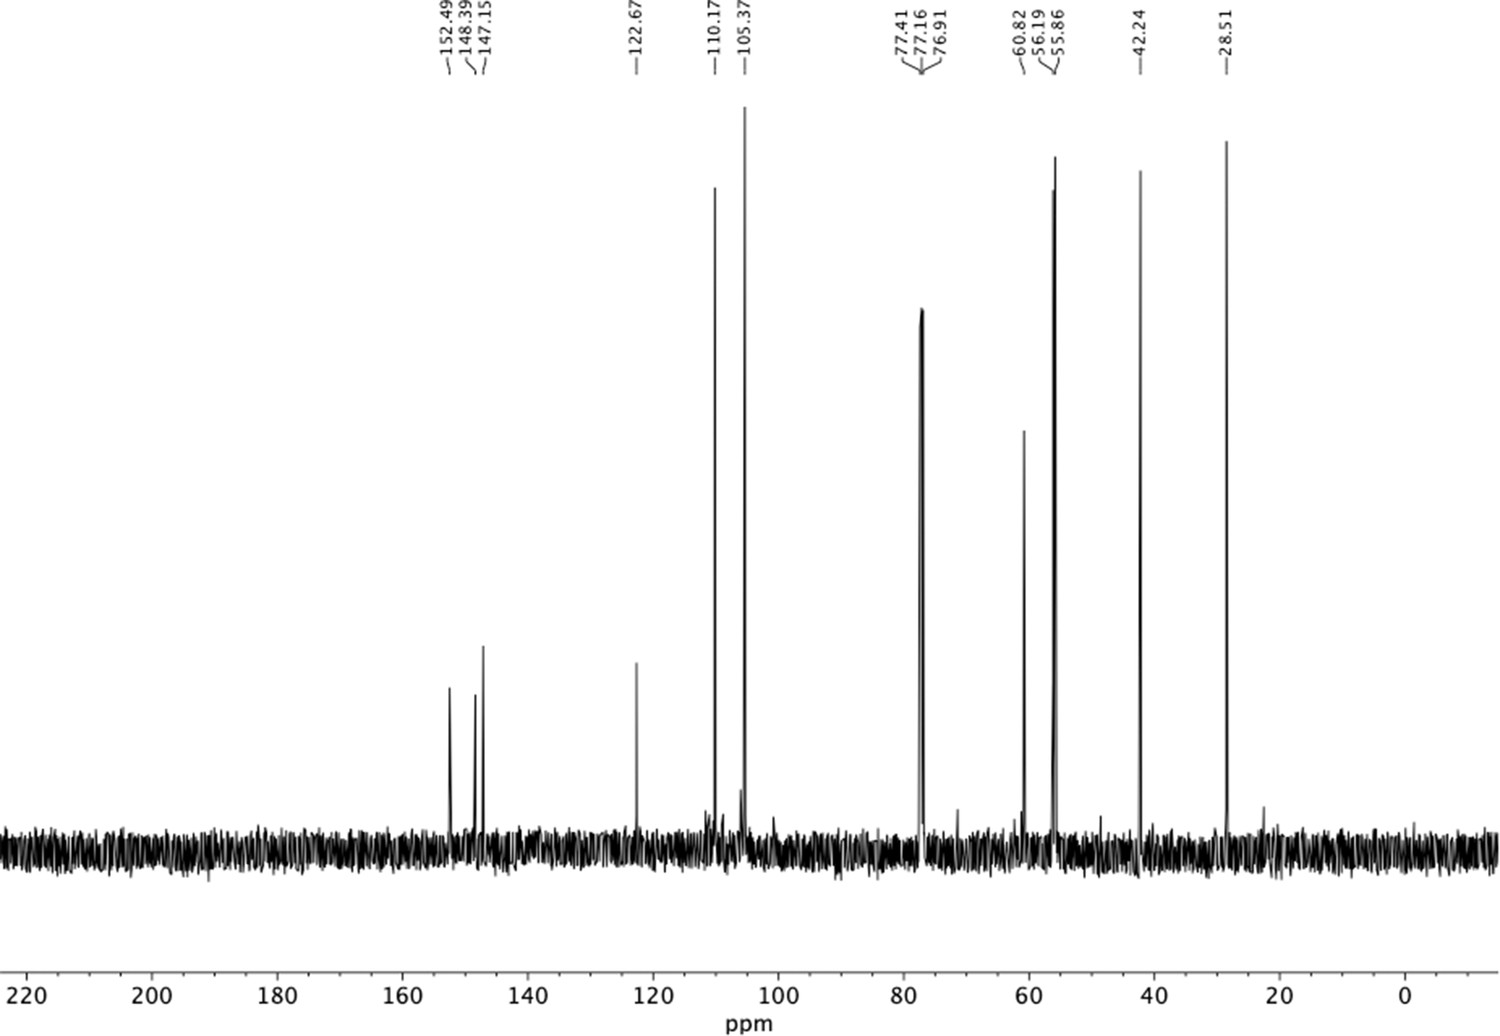
13C NMR of trimethoxyphenethyl amine (S27).
Appendix 1—figure 35

1H NMR of benzyloxy nitrophenethyl alcohol (S29).
Appendix 1—figure 36
13C NMR of benzyloxy nitrophenethyl alcohol (S29).
Appendix 1—figure 37
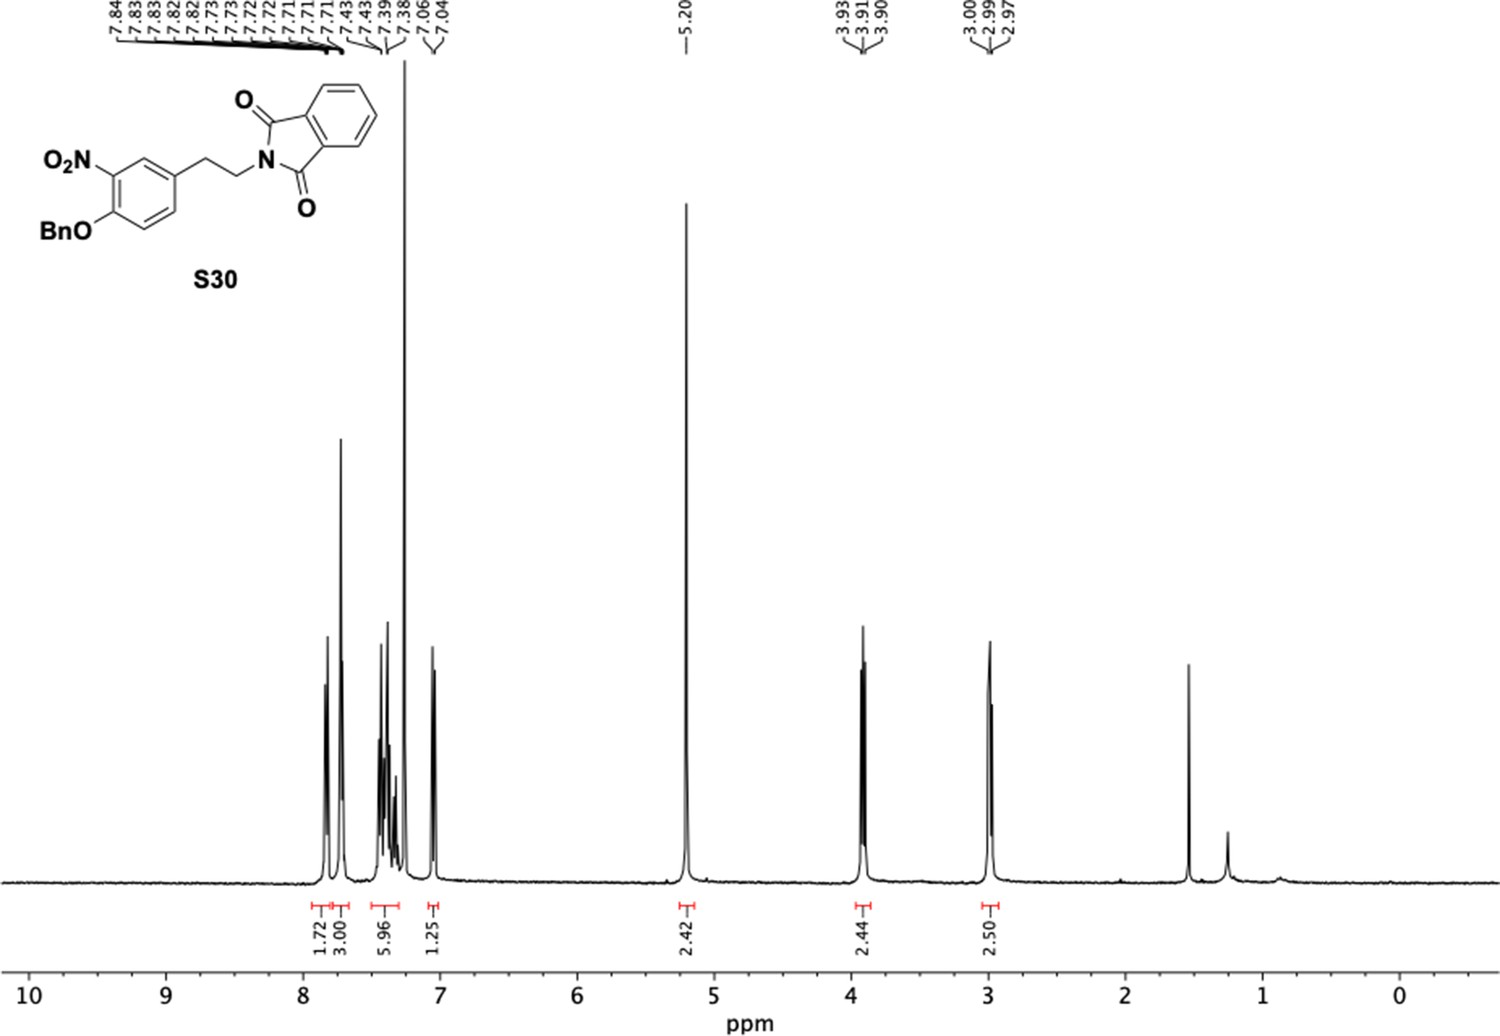
1H NMR of benzyloxy nitrophenethyl phthalimide (S30).
Appendix 1—figure 38

13C NMR of benzyloxy nitrophenethyl phthalimide (S30).
Appendix 1—figure 39
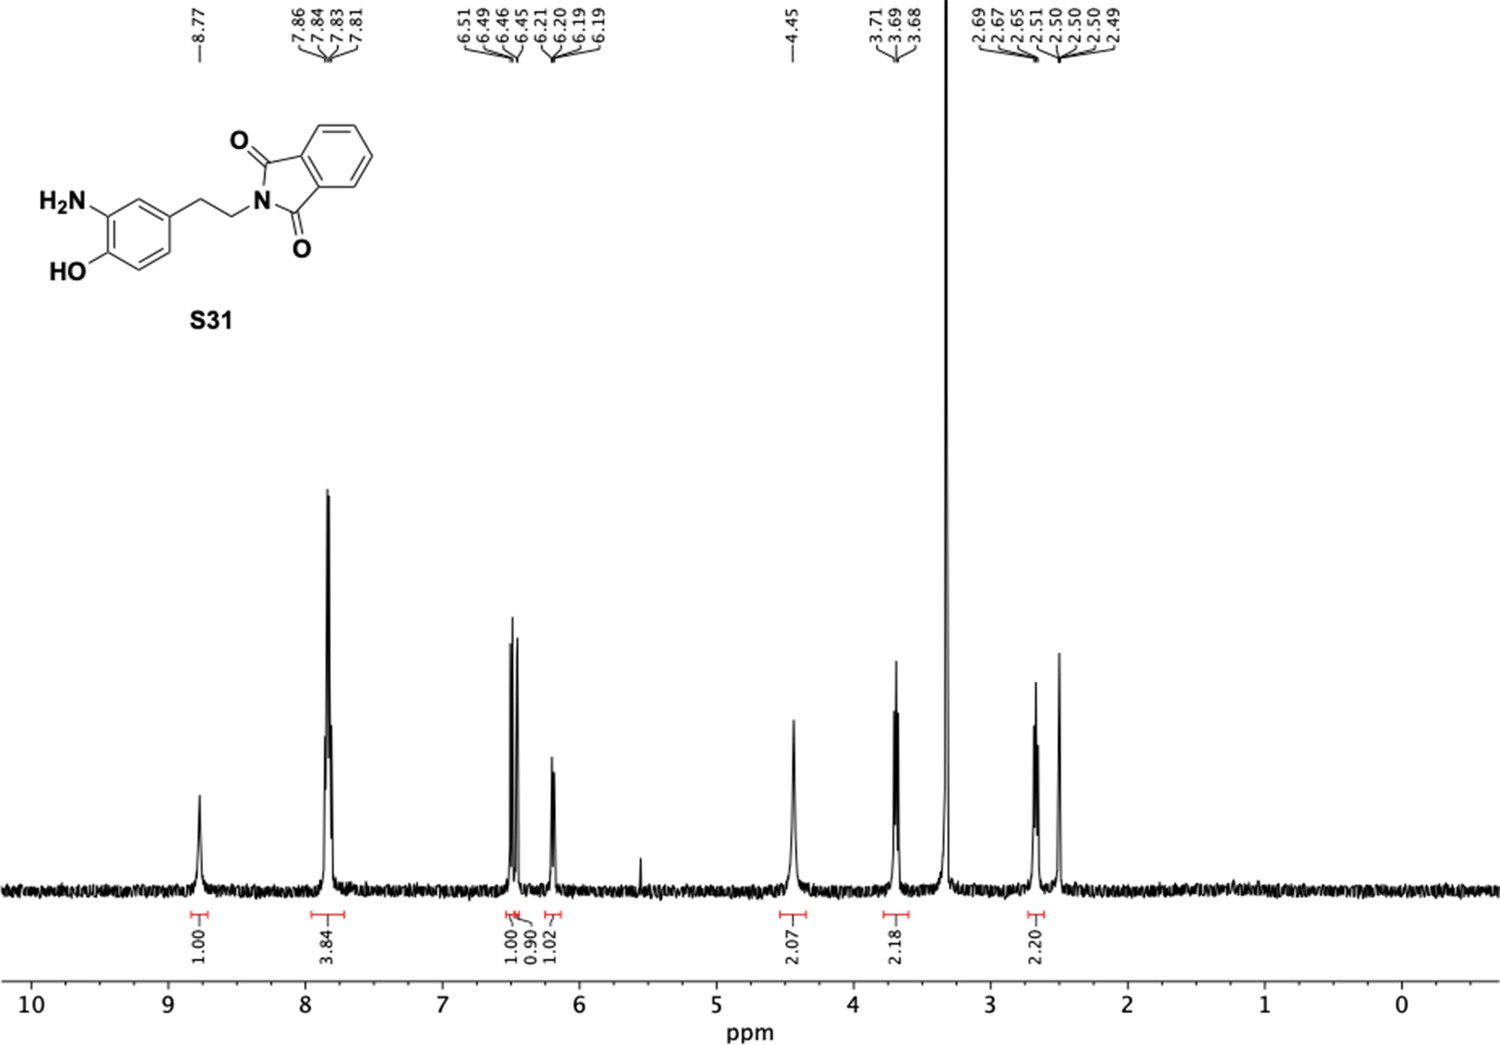
1H NMR of amino alcohol (S31).
Appendix 1—figure 40
13C NMR of amino alcohol (S31).
Appendix 1—figure 41
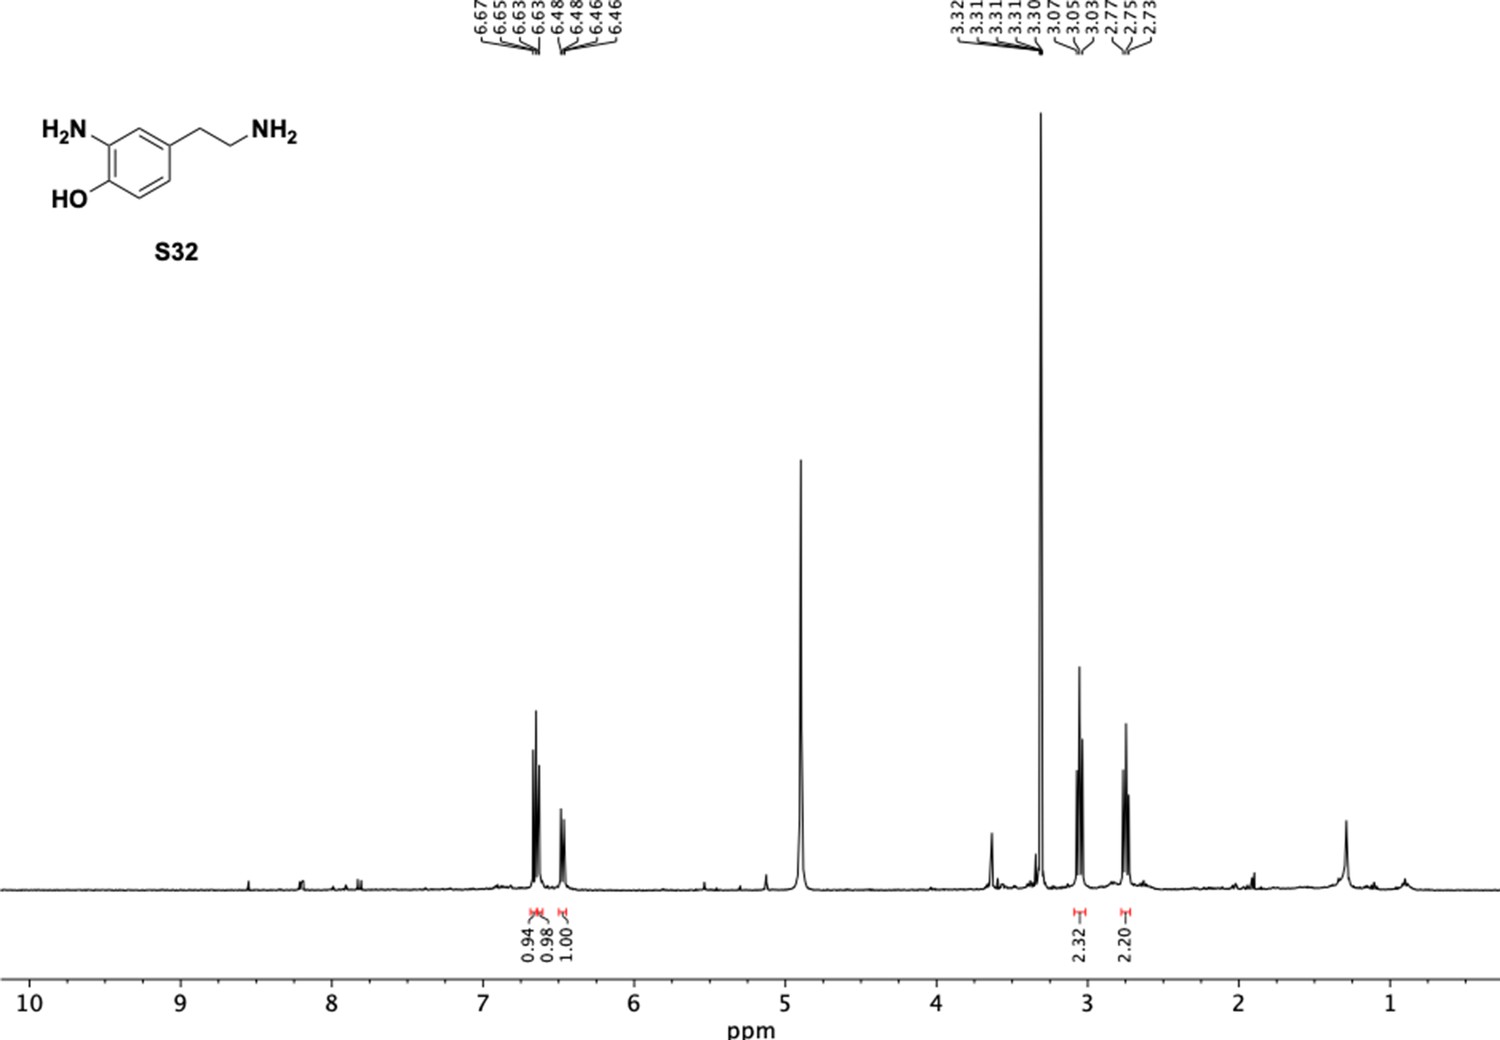
1H NMR of 2-amino-4-(2-aminoethyl)phenol (S32).
Appendix 1—figure 42
13C NMR of 2-amino-4-(2-aminoethyl)phenol (S32).
Tables
Key resources table
| Reagent type (species) or resource | Designation | Source or reference | Identifiers | Additional information |
|---|---|---|---|---|
| Strain, strain background (Eggerthella lenta) | Eggerthella lenta strains | REF 37 | El | See Supplementary file 1d |
| Strain, strain background (Eggerthella sinensis) | Eggerthella sinensis DSM16107 | REF 37 | Es | See Supplementary file 1d |
| Strain, strain background (Gordonibacter) | Gordonibactr strains | REF 37 | Gp, Gs | See Supplementary file 1d |
| Strain, strain background (Paraeggerthella) | Paraeggerthella hongkongensis | REF 37 | Ph | See Supplementary file 1d |
| Strain, strain background (Eschericia coli) | Eschericia coli MG1655 | Palmer lab, Newcastle University | See Supplementary file 1d | |
| Strain, strain background (Bacteroides fragilis ATCC 25285) | Bacteroides fragilis ATCC 25285 | ATCC | See Supplementary file 1d | |
| Strain, strain background (Clostridium sporogenes ATCC 15579) | Clostridium sporogenes ATCC 15579 | ATCC | See Supplementary file 1d | |
| Strain, strain background (Enterococcus faecalis OG1RF) | Enterococcus faecalis OG1RF | ATCC | See Supplementary file 1d | |
| Strain, strain background (Edwarsiella tarda ATCC 23685) | Edwarsiella tarda ATCC 23685 | ATCC | See Supplementary file 1d | |
| Sequence-based reagent | qPCR primers dadh | REF 9 | PCR primers | GAGATCTGGTCCACCGTCAT and AGTGGAAGTACACCGGGATG |
| Sequence-based reagent | qPCR primers E. lenta | REF 10 | PCR primers | CAGCAGGGAAGAAATTCGAC and TTGAGCCCTCGGATTAGAGA |
| Sequence-based reagent | qPCR primers dodh | This work | PCR primers | GFP version of pLKO.1-Puro |
| Sequence-based reagent | Primers for full length dadh | REF 9 | PCR primers | ATGGGTAACCTGACCATG and TTACTCCCTCCCTTCGTA |
| Sequence-based reagent | Sequencing primers SNP506 in dadh | REF 9 | PCR primers | GGGGTGTCCATGTTGCCGGT and ACCGGCTACGGCAACGGC |
| Commercial assay or kit | DNeasy UltraClean Microbial Kit | Qiagen, catalog | Cat # 12224–50 | Extraction of gDNA from bacterial cultures |
| Chemical compound, drug | Dopamine hydrochloride | Sigma-Aldrich | Cat# PHR1090-1G | |
| Chemical compound, drug | (+)-catechin hydrate | Millipore Sigma | Cat# C1251-5G | |
| Chemical compound, drug | 3,4-dihydroxyphenylacetic acid (DOPAC) | Millipore Sigma | Cat# 850217–1G | |
| Chemical compound, drug | 3,4-dihydroxyphenylpropionic acid (Hydrocaffeic acid) | Millipore Sigma | Cat# 102601–10G | |
| Other | LC-MS/MS | Agilent | Agilent:6410 Triple Quad LC/MS | |
| Other | Anaerobic chambers | Coy Laboratory products | ||
| Chemical compound, drug | BBL Brain Heart Infusion (BHI) media | Beckton Dickinson | Cat# L007440 | |
| Chemical compound, drug | L-arginine | Sigma-Aldrich | Cat# A5006-100G | |
| Chemical compound, drug | benzyl viologen | Sigma-Aldrich | Cat# 271845–250 mg | |
| Chemical compound, drug | methyl viologen | Sigma-Aldrich | Cat# 856177–1 g | |
| Chemical compound, drug | sodium dithionite | Sigma-Aldrich | Cat# 157953–5G | |
| Chemical compound, drug | diquat | Sigma-Aldrich | Cat# 45422–250 mg | |
| Chemical compound, drug | 3,4-dihydroxyphenylacetic acid (ring-d3, 2,2-d2, 98%) | Cambridge Isotope Laboratories | Cat# DLM-2499–0.01 | |
| Chemical compound, drug | dopamine HCl (1,1,2,2-d4, 97–98%) | Cambridge Isotope Laboratories | Cat# DLM-2498–0.1 |
Additional files
-
Supplementary file 1
Tables detailing the bacterial strains used in this study, the chemical structures and sources of compounds used in this study, and the RNA-sequencing results for experiments with DL-norepinephrine.
Supplementary file 1a. Physiologically relevant catechol substrates used in assays with natively purified dopamine dehydroxylase from E. lenta A2. Supplementary file 1b. Commercially available and synthesized dopamine analogs used in assays with natively purified dopamine dehydroxylase from E. lenta A2. Supplementary file 1c. Differentially expressed genes upon exposure of Eggerthella lenta A2 to 0.5 mM DL-norepinephrine relative to vehicle (>|2|-fold difference, FDR < 0.1). The dopamine dehydroxylase (dadh) in E. lenta A2 is highlighted in red. Data are from n = 3 bacterial cultures for each condition. Supplementary file 1d. Bacterial strains used in this study Supplementary file 1e. Catechol substrates used in screen of gut Actinobacteria for catechol metabolism. 3,4-DHMA stands for 3,4-dihydroxymandelic acid. 2,3-DHBA stands for 2,3-dihydroxybenzoic acid.
- https://cdn.elifesciences.org/articles/50845/elife-50845-supp1-v1.xlsx
-
Supplementary file 2
Tables containing the proteomics data supporting the identification of hydrocaffeic acid dehydroxylase, the percent homology between dehydroxylases, and the RNA-sequencing results for experiments with DOPAC, hydrocaffeic acid, and (+)-catechin.
Supplementary file 2a. Differentially expressed genes upon exposure of Eggerthella lenta A2 to 0.5 mM hydrocaffeic acid relative to vehicle (>|2|-fold difference, FDR < 0.1). E. lenta A2 was grown with 500 µM hydrocaffeic acid or a vehicle control in BHI medium containing 1% (w/v) arginine and 10 mM formate. The catalytic subunit of the putative hydrocaffeic acid dehydroxylase (hcdh), as well as its predicted 4Fe-4S and membrane anchor partners, are highlighted in red. Data are from n = 4 cultures for each condition. The experiment was performed once. Supplementary file 2b. Differentially expressed genes upon exposure of Eggerthella lenta A2 to 0.5 mM (+)-catechin relative to vehicle (>|2|-fold difference, FDR < 0.1). E. lenta A2 was grown with 500 µM (+)-catechin or a vehicle control in BHI medium containing 1% (w/v) arginine and 10 mM formate. The catalytic subunit of the putative catechin dehydroxylase (cadh), as well as its predicted 4Fe-4S and membrane anchor partners, are highlighted in red. Data are from n = 3 cultures from each condition. The experiment was performed once. Supplementary file 2c. Percent amino acid identity between the putative dehydroxylases from G. pamelaeae 3C and E. lenta A2. Ach stands for acetylene hydratase from P. acetylenicus. This protein is the closest biochemically characterized homolog to the newly identified catechol dehydroxylases. Colors represent % identity, with identity going from low (blue) to high (red). Supplementary file 2d. Differentially expressed genes upon exposure of G. pamelaeae 3C to 0.5 mM DOPAC relative to vehicle (>|2|-fold difference, FDR < 0.1) when catechol was added during exponential phase. G. pamelaeae 3C was grown with 500 µM DOPAC or a vehicle control in BHI medium containing 10 mM formate. The catalytic subunit of the putative DOPAC dehydroxylase (dodh), as well as its predicted 4Fe-4S partner, are highlighted in red. The data are from n = 3 cultures for each condition. The experiment was performed once. Supplementary file 2e. Differentially expressed genes upon exposure of G. pamelaeae 3C to 0.5 mM DOPAC relative to vehicle (>|2|-fold difference, FDR < 0.1) when catechol was added during the beginning of growth. G. pamelaeae 3C was grown with 500 µM DOPAC or a vehicle control in BHI medium containing 10 mM formate. Cells were harvested in mid-exponential phase when metabolism appeared. The catalytic subunit of the putative DOPAC dehydroxylase (dodh), as well as its predicted 4Fe-4S partner, are highlighted in red. Data are from n = 3 cultures for each condition. The experiment was performed once. Supplementary file 2f. Proteomics identification of proteins in the band of interest during the activity-based native purification of the hydrocaffeic acid dehydroxylase from E. lenta A2. The band highlighted with a red asterisk in Figure 4—figure supplement 4 was cut out and subjected to proteomics. This band was confirmed to contain the catalytic subunit of the hydrocaffeic acid dehydroxylase (highlighted in red). The predicted size of 133.9 kDa (a) is for the full peptide containing the Twin Arginine Translocation (TAT) signal sequence. The predicted size of 130.5 kDa (b) is for the processed, mature peptide where the TAT signal sequence has been removed, as is suggested from the coverage map in Figure 4—figure supplement 5.
- https://cdn.elifesciences.org/articles/50845/elife-50845-supp2-v1.xlsx
-
Supplementary file 3
Tables containing accession numbers for protein sequences used in bioinformatics analyses of catechol dehydroxylase enzymes.
Supplementary file 3a. Accession numbers (Uniprot and Genbank) of putative Eggerthella and Gordonibacter dehydroxylases identified in this study. Supplementary file 3b. Accession numbers of bis-MGD enzymes used to generate the phylogenetic tree of the bis-MGD enzyme family (Figure 6). Supplementary file 3c. Accession numbers (Uniprot) and organismal origin of representative dehydroxylases identified from phylogenetic tree in Figure 7—figure supplement 3. Accession numbers (Uniprot and Genbank) of putative Eggerthella and Gordonibacter dehydroxylases identified in this study.
- https://cdn.elifesciences.org/articles/50845/elife-50845-supp3-v1.xlsx
-
Transparent reporting form
- https://cdn.elifesciences.org/articles/50845/elife-50845-transrepform-v1.docx
Download links
A two-part list of links to download the article, or parts of the article, in various formats.
Downloads (link to download the article as PDF)
Open citations (links to open the citations from this article in various online reference manager services)
Cite this article (links to download the citations from this article in formats compatible with various reference manager tools)
A widely distributed metalloenzyme class enables gut microbial metabolism of host- and diet-derived catechols
eLife 9:e50845.
https://doi.org/10.7554/eLife.50845


