Crumbs organizes the transport machinery by regulating apical levels of PI(4,5)P2 in Drosophila
- Max-Planck Institute of Molecular Cell Biology and Genetics (MPI-CBG), Germany
- The Biotechnological Center of the TU Dresden (BIOTEC), Germany
Figures
Figure 1 with 2 supplements
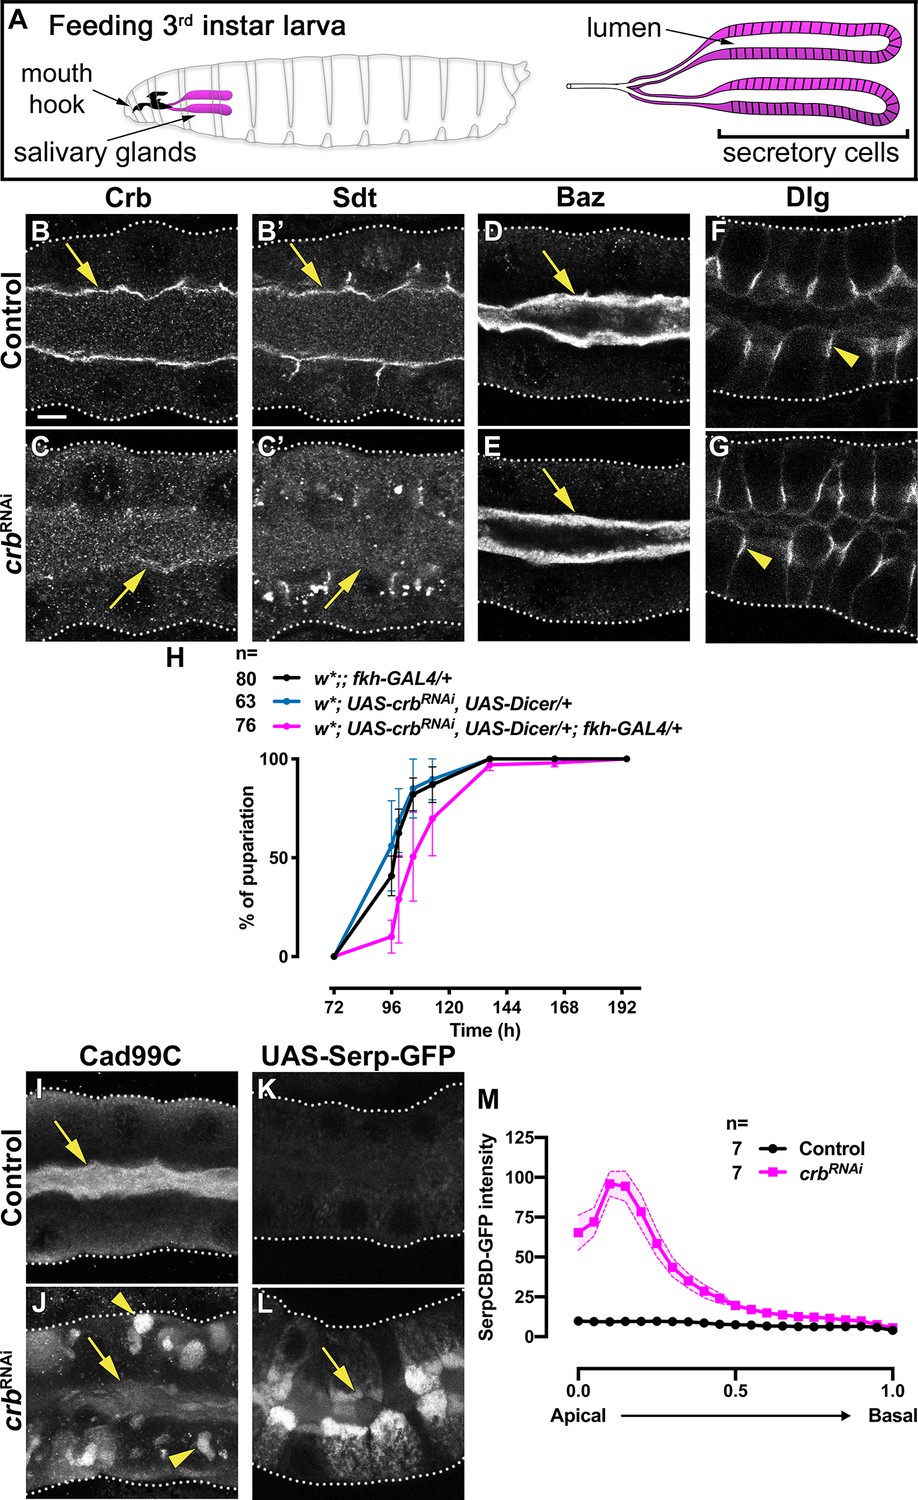
Crb is required for efficient apical secretion in SG cells.
(A) Scheme indicating the anatomic location of the SG in the larval stage. (B-G) Localization of Crb (B,C), Sdt (B’,C’), Baz (D,E) and Dlg (F,G) in control (B,B’,D,F, fkh>/+) and Crb KD (C,C’,E,G, fkh >UAS crbRNAi) animals. H. Pupariation efficiency of controls (black and blue) and larvae with reduced levels of Crb (magenta) at 29 °C. Error bars indicate the standard error of the mean, n indicates number of traced individual larvae of the corresponding genotypes in three independent experiments. (I,J) Localization of the apical transmembrane protein Cadherin99C in SGs from control (I) and Crb KD (J) animals. (K,L) Localization of the secreted apical cargo SerpCBD-GFP in live SGs of control (K, fkh >UAS SerpCBD-GFP) and Crb KD (L, fkh >UAS crbRNAi; UAS-SerpCBD-GFP) animals. Arrows indicate the apical plasma membrane. Arrowheads mark the lateral plasma domain. Dotted lines indicate the basal membrane. Scale bar in A indicates10 µm applies to all panels. (M, M) Plotted is the fluorescence intensity (arbitrary units) of SerpCBD-GFP along the apical-to-basal direction in live SGs of control (black, fkh >UAS SerpCBD-GFP) and Crb KD (magenta, fkh >UAS crbRNAi; UAS-SerpCBD-GFP). Error bars indicate the standard error of the mean, n indicates number of glands from the corresponding genotypes.
-
Figure 1—source data 1
Dataset for tracking of larval development.
- https://cdn.elifesciences.org/articles/50900/elife-50900-fig1-data1-v2.xlsx
-
Figure 1—source data 2
Dataset for SerpCBD-GFP fluorescence intensity in control glands.
- https://cdn.elifesciences.org/articles/50900/elife-50900-fig1-data2-v2.xlsx
-
Figure 1—source data 3
Dataset for SerpCBD-GFP fluorescence intensity in Crb KD glands.
- https://cdn.elifesciences.org/articles/50900/elife-50900-fig1-data3-v2.xlsx
Figure 1—figure supplement 1
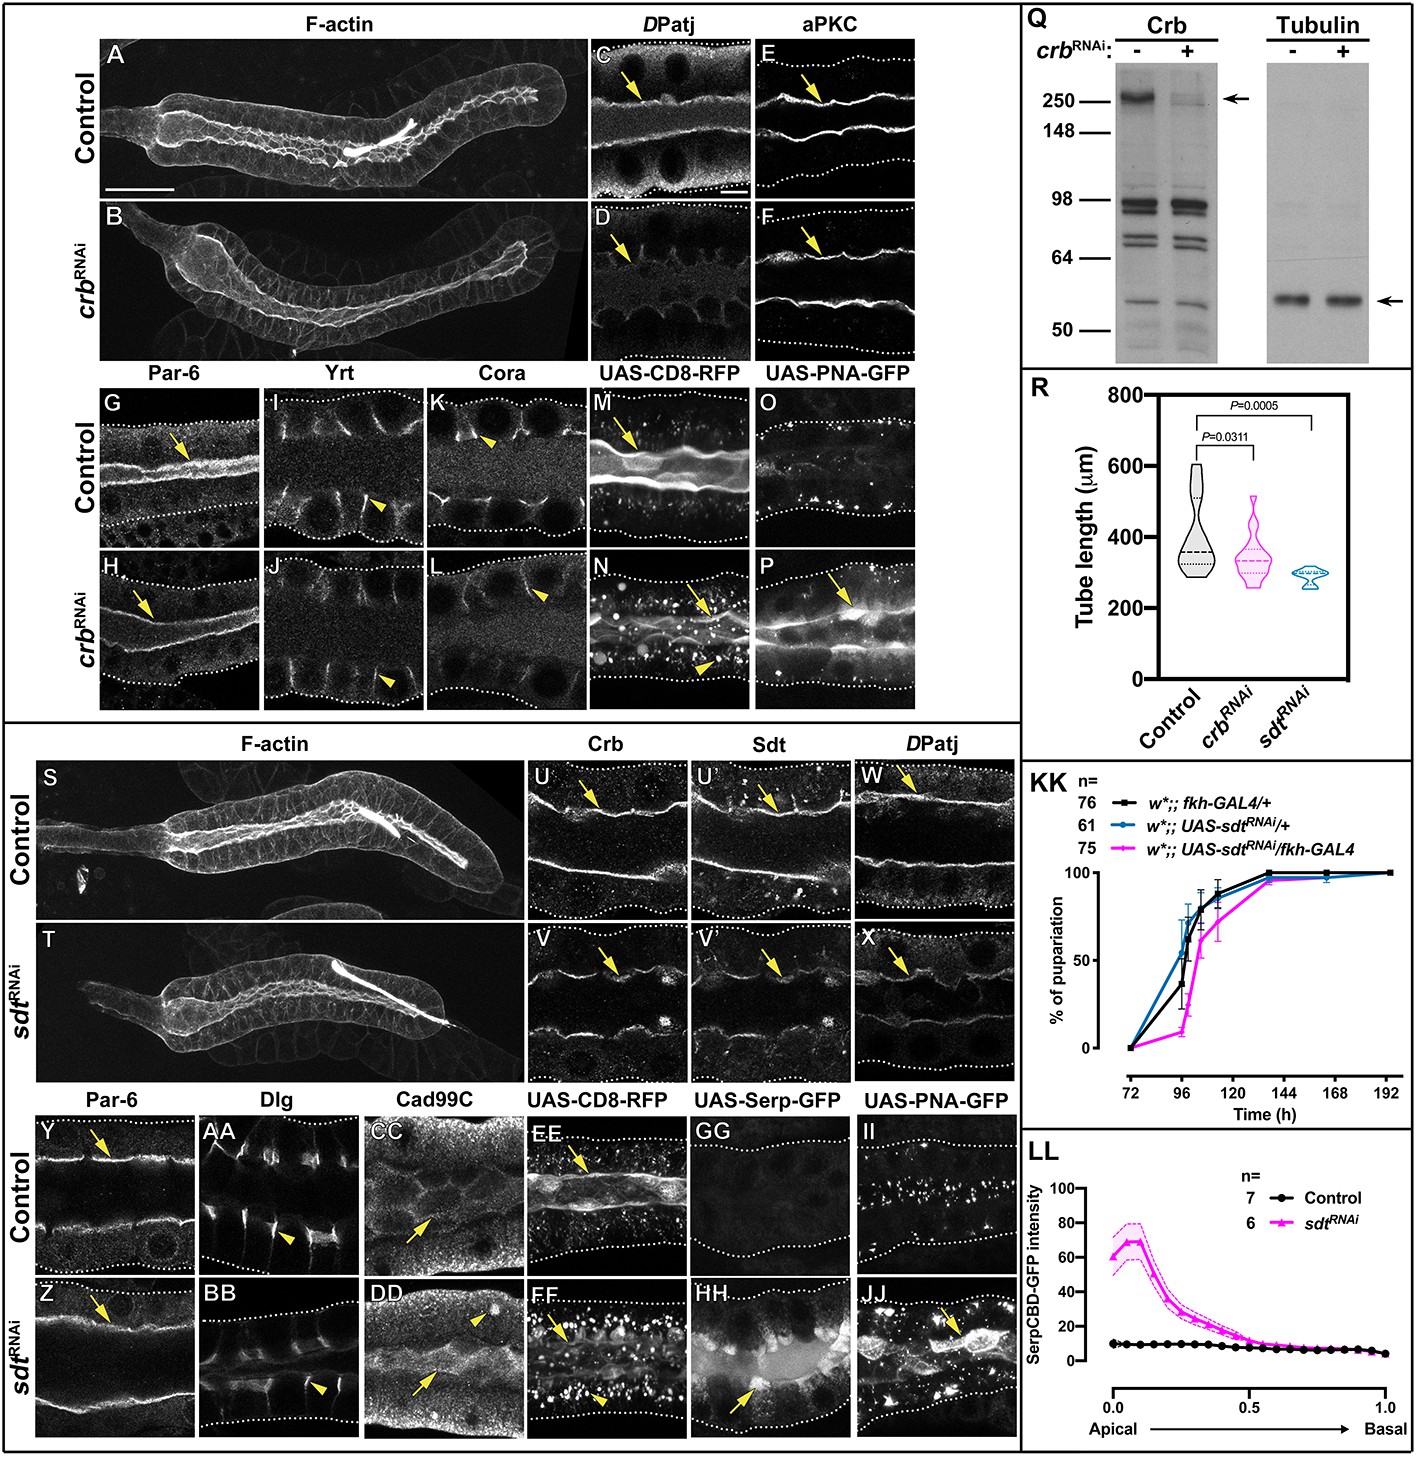
Knock-down of the Crb protein complex in larval SGs disrupts apical secretion.
(A,B) Maximal projections showing F-actin (phalloidin staining) of control (A, fkh>/+) and Crb KD (B, fkh >UAS crbRNAi) animals. (C-L) Localization of the polarity proteins DPatj (C,D), aPKC (E,F), Par-6 (G,H), Yrt (I,J) and Cora (K,L) in control (C,E,G,I,K, fkh>/+) and Crb KD (D,F,H,J,L, fkh >UAS crbRNAi) animals. (M,N) Localization of the apical membrane marker CD8-RFP in live SGs of control (M, fkh >UAS-CD8-RFP) and Crb KD (N, fkh >UAS crbRNAi; UAS-CD8-RFP) animals. (O,P) Localization of the glycoprotein reporter PNA-GFP in live SGs of control (O, fkh >UAS PNA-GFP) and Crb KD (P, fkh >UAS crbRNAi; UAS-PNA-GFP) animals. Q. Western blot probed for Crb (left) and Tubulin (right) loaded with control (fkh>/+, lanes with ‘crbRNAi -”) and Crb KD (fkh >UAS crbRNAi, lanes with ‘crbRNAi +”) SG protein lysates. Arrows point to the respective proteins. R. Plotted is the tube length of glands measured along the secretory segment in control (fkh>/+), Crb KD (fkh >UAS crbRNAi) and Sdt KD (fkh >UAS sdtRNAi) animals. Statistical significance was tested in a one-way analysis of variance (ANOVA) followed by a Dunnett’s multiple-comparison test. n = 18 glands for control, 20 for Crb KD and 11 for Sdt KD. (S,T) Maximal projections showing F-actin (phalloidin staining) of control (S fkh>/+) and Sdt KD (T, fkh >UAS sdtRNAi) animals. U-DD Localization of Crb (U,V), Sdt (U’,V’), DPatj (W,X), Par-6 (Y,Z), Dlg (AA,BB) and Cad99C (CC,DD) in control (U,U’,W,Y,AA,CC, fkh>/+) and Sdt KD (V,V’,X,Z,BB,DD, fkh >UAS sdtRNAi) animals. (EE,FF) Localization of apical membrane marker CD8-RFP in live SGs of control (EE, fkh >UAS-CD8-RFP) and Sdt KD (FF, fkh >UAS sdtRNAi; UAS-CD8-RFP) animals. (GG,HH) Localization of secreted apical cargo SerpCBD-GFP in live SGs of control (GG, fkh >UAS SerpCBD-GFP) and Sdt KD (HH, fkh >UAS sdtRNAi; UAS-SerpCBD-GFP) animals. (II,JJ) Localization of the glycoprotein reporter PNA-GFP in live SGs of control (II, fkh >UAS PNA-GFP) and Sdt KD (JJ, fkh >UAS sdtRNAi; UAS-PNA-GFP) animals. Arrows point to apical and arrowheads to the lateral domain. Dotted lines indicate the basal membrane. Scale bar in (A) indicates 50 µm (for A,B,S,T) and in (C) 10 µm (for C-P and U-JJ). KK. Plotted is the puparium formation efficiency of controls (black and blue) and larvae with reduced levels of Sdt (magenta) at 29 °C. Error bars indicate the standard error of the mean, n indicates number of traced individual larvae of the corresponding genotypes in three independent experiments. LL. Plotted is the fluorescence intensity (arbitrary units) of SerpCBD-GFP along the apical-to-basal direction in live SGs of control (black -same shown in Figure 1M, fkh >UAS SerpCBD-GFP) and Sdt KD (magenta, fkh >UAS sdtRNAi; UAS-SerpCBD-GFP) animals. Error bars indicate the standard error of the mean, n indicates number of glands of the corresponding genotypes.
-
Figure 1—figure supplement 1—source data 1
Dataset for salivary gland lengths.
- https://cdn.elifesciences.org/articles/50900/elife-50900-fig1-figsupp1-data1-v2.xlsx
-
Figure 1—figure supplement 1—source data 2
Dataset for tracking of larval development.
- https://cdn.elifesciences.org/articles/50900/elife-50900-fig1-figsupp1-data2-v2.xlsx
-
Figure 1—figure supplement 1—source data 3
Dataset for SerpCBD-GFP fluorescence intensity in control glands (note is the same dataset for Figure 1M control).
- https://cdn.elifesciences.org/articles/50900/elife-50900-fig1-figsupp1-data3-v2.xlsx
-
Figure 1—figure supplement 1—source data 4
Dataset for SerpCBD-GFP fluorescence intensity in Sdt KD glands.
- https://cdn.elifesciences.org/articles/50900/elife-50900-fig1-figsupp1-data4-v2.xlsx
Figure 1—figure supplement 2
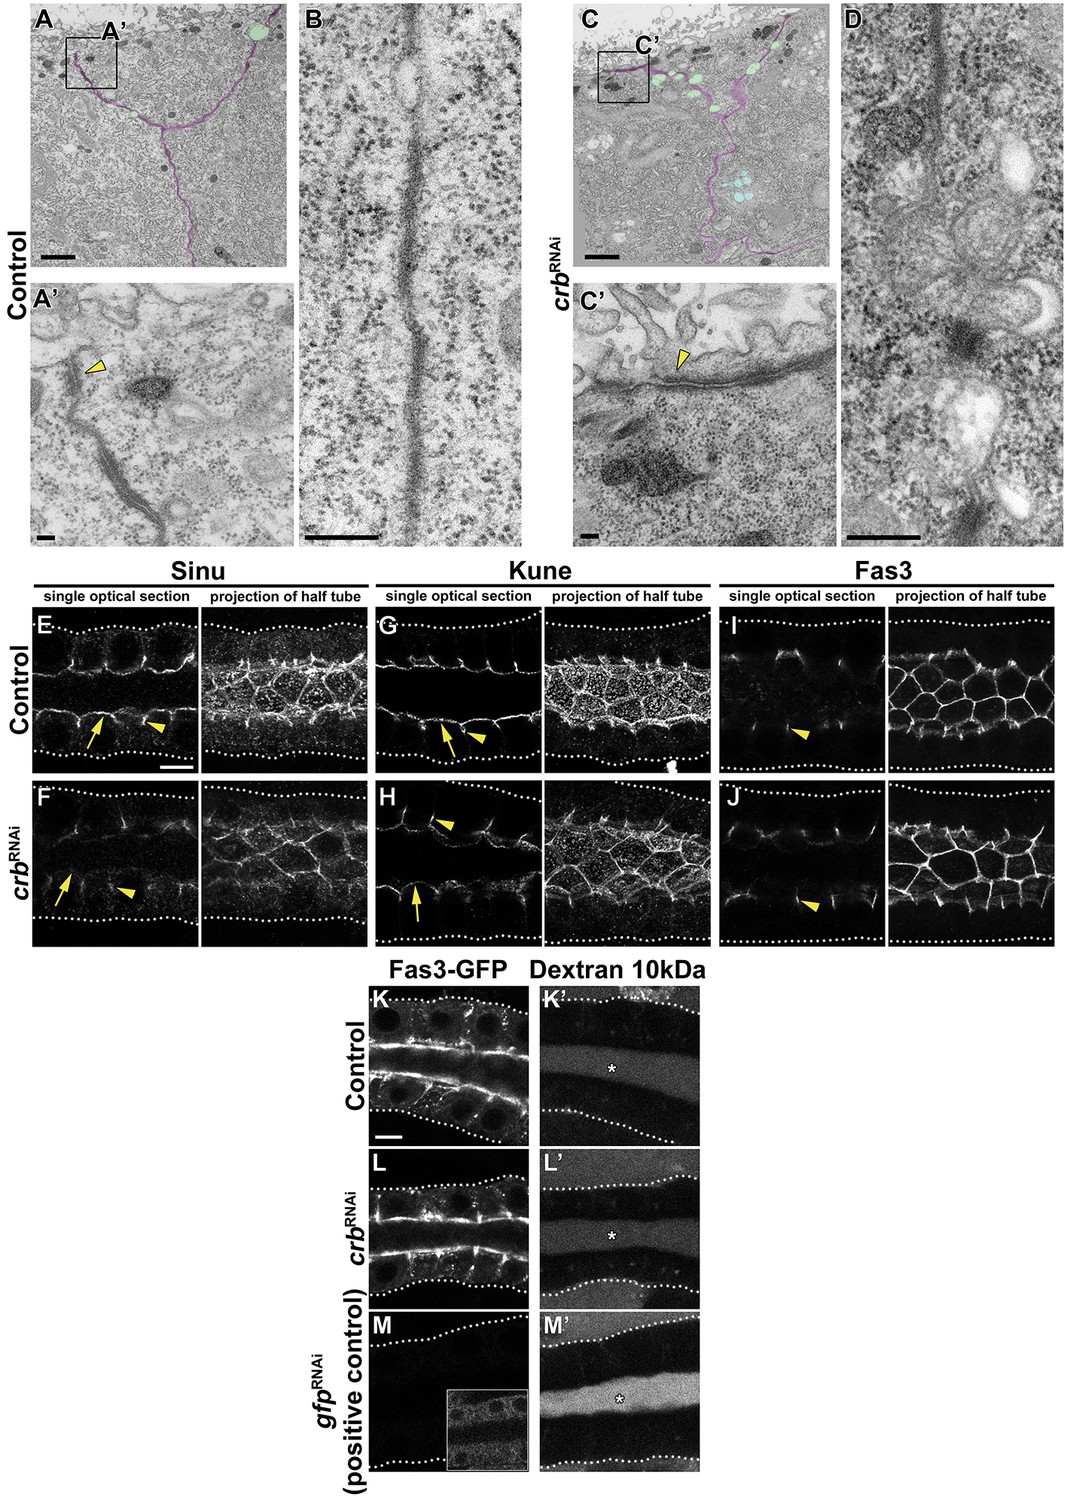
The Crb protein complex is dispensable for maintenance of cell-cell junctions in larval SGs.
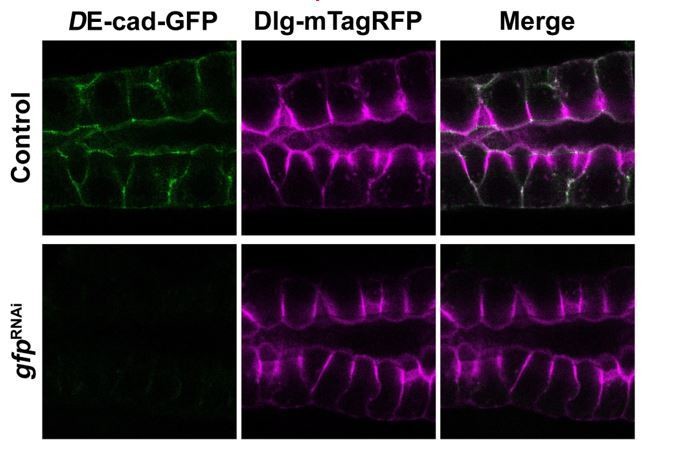
(A,C) Transmission electron microscopic (TEM) images, visualizing the overview of the cell-cell junction close to the apical domain and ZA ultrastructure of SG cells of feeding larvae. Shown are cell-cell contacts (magenta), gaps along the cell-cell junctions (green), multivesicular bodies (blue) (A,C) and the ZA (yellow arrowhead, A’,C’) of control (A,A’ fkh>/+) and Crb KD (C,C’ fkh >UAS crbRNAi) animals. Scale bars in A,C indicate 1 μm and in A’,C’ indicate 100 nm. (B,D) TEM images, visualizing the SJ ultrastructure of SG cells of feeding larvae. Representative images of the SJs of control (B, fkh>/+) and Crb KD (D fkh >UAS crbRNAi) animals are shown. Scale bars in indicate 100 nm. (E-J) Confocal images of SGs probed for the SJ proteins Sinu (E,F), Kune (G,H) and Fas3 (I,J) of control (E,G,I, fkh>/+) and Crb KD (F,H,J, fkh >UAS crbRNAi) animals. Shown are single optical slices and maximal projections of half of the z-stack (half SG-tube). Arrows point to apical, and arrowheads to lateral localizations. Dotted lines indicate the basal membrane. Scale bar in E (applies to panels E-J) indicates10 µm. (K-M’) The barrier function of the SG epithelium was tested ex vivo in a Dextran-permeability assay. Localization of endogenously expressed Fas3-GFP (K,L,M) and Dextran-rhodamine 10 kDa (K’,L’,M’) in control (K,K’, Fas3-GFP, fkh>/+), Crb KD (L,L’, Fas3-GFP, fkh >UAS crbRNAi) and the positive control for leaky SGs, Fas3 KD (M,M’, Fas3-GFP, fkh >UAS gfpRNAi) in live SGs. Insert in (M) displays the corresponding image with brightness adjusted manually using Photoshop to reveal the SG. Dotted lines indicate the basal membrane. Asterisks mark the SG lumen. Scale bar in K indicates 10 µm and applies to panels (K-M’).
Figure 2 with 4 supplements
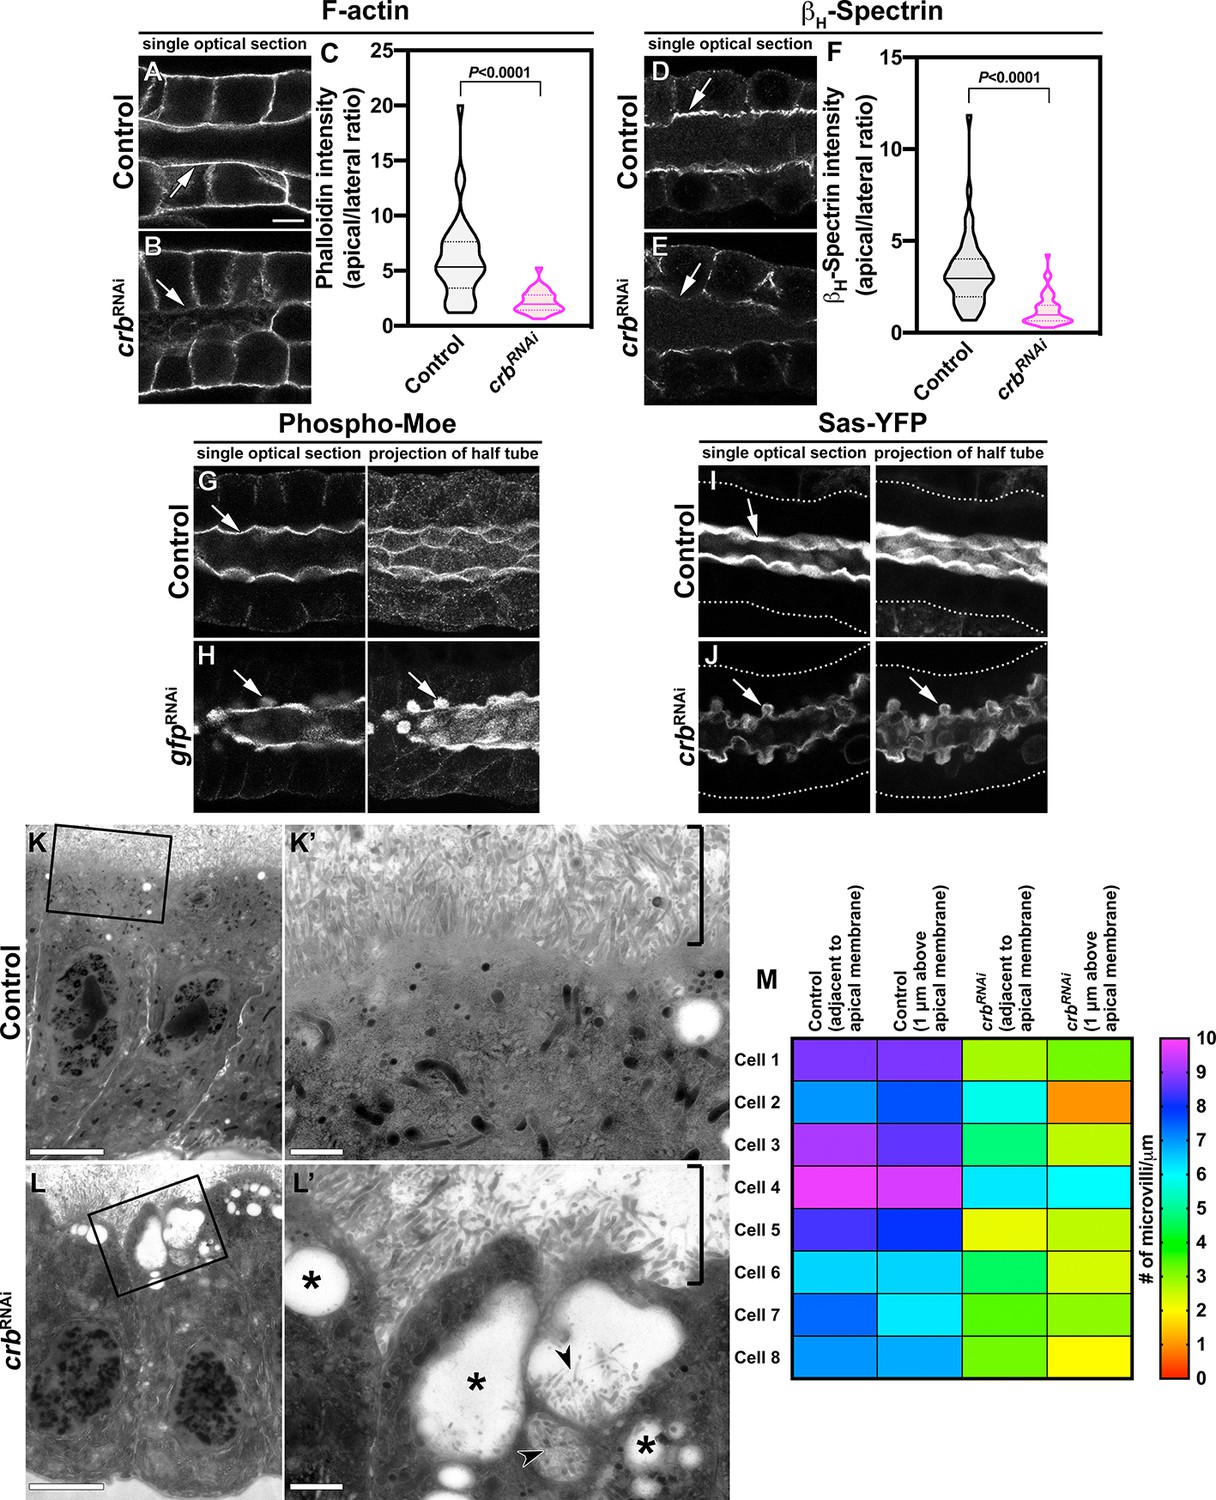
Crb is necessary to specifically maintain the apical cytoskeleton and the morphology of the apical membrane.
(A-F) Localization and quantification of F-actin (phalloidin staining, A-C) and βH-Spec (D-F) in control (A,D, fkh>/+) and Crb KD (B,E, fkh >UAS crbRNAi) SGs. Violin graphs (C,F) show the fluorescence intensity (apical vs lateral ratio) indicating the mean and quartiles for F-actin (C, n = 36 cells for control and 28 cells for Crb KD) and βH-Spec (F, n = 44 cells for control and 40 cells for Crb KD). Statistical significance was analyzed in an unpaired two-tailed t-test. (G-H) Localization of phospho-Moe in control (G, Crb-GFP, fkh>/+) and Crb KD (H, Crb-GFP, fkh >UAS gfpRNAi) SGs. (I,J) Localization of the apical protein Stranded at second (Sas-YFP) in live SGs of control (I, fkh>/+) and Crb KD (J, Crb-GFP, fkh >UAS gfpRNAi) animals. Shown are single optical slices and maximal projections of half of the z-stack (half SG-tube). Arrows point to the apical domain of the cell. Dotted lines indicate the basal membrane. Scale bar in (A) displays 10 µm and applies to panes (A-J). (K-L’) TEM images of SGs prepared using the high-pressure freezing technique, visualizing the apical aspect of SG cells of control (K,K’, fkh>/+) and Crb KD (L,L’, fkh >UAS crbRNAi) animals. The brackets in K,L’ indicate the apical microvilli. Asterisks in (L’) mark large intracellular vesicles found in Crb-deficient glands. Arrowheads in L’ indicate microvilli found inside vesicles. Scale bars in (K,L) indicate 5 µm and in (K’,L’) indicate 1 µm. (M, M) Mean number of microvilli following along the apical membrane over a distance of 1 µm, adjacent to the membrane and 1 µm above the apical membrane in SG cells of control (fkh>/+) and Crb KD (fkh >UAS crbRNAi) animals. The heatmap indicates the scale bar for the number of microvilli/µm.
-
Figure 2—source data 1
Dataset for phalloidin fluorescence intensity.
- https://cdn.elifesciences.org/articles/50900/elife-50900-fig2-data1-v2.xlsx
-
Figure 2—source data 2
Dataset for βH-Spec fluorescence intensity.
- https://cdn.elifesciences.org/articles/50900/elife-50900-fig2-data2-v2.xlsx
-
Figure 2—source data 3
Dataset for microvilli quantifications.
- https://cdn.elifesciences.org/articles/50900/elife-50900-fig2-data3-v2.xlsx
Figure 2—figure supplement 1
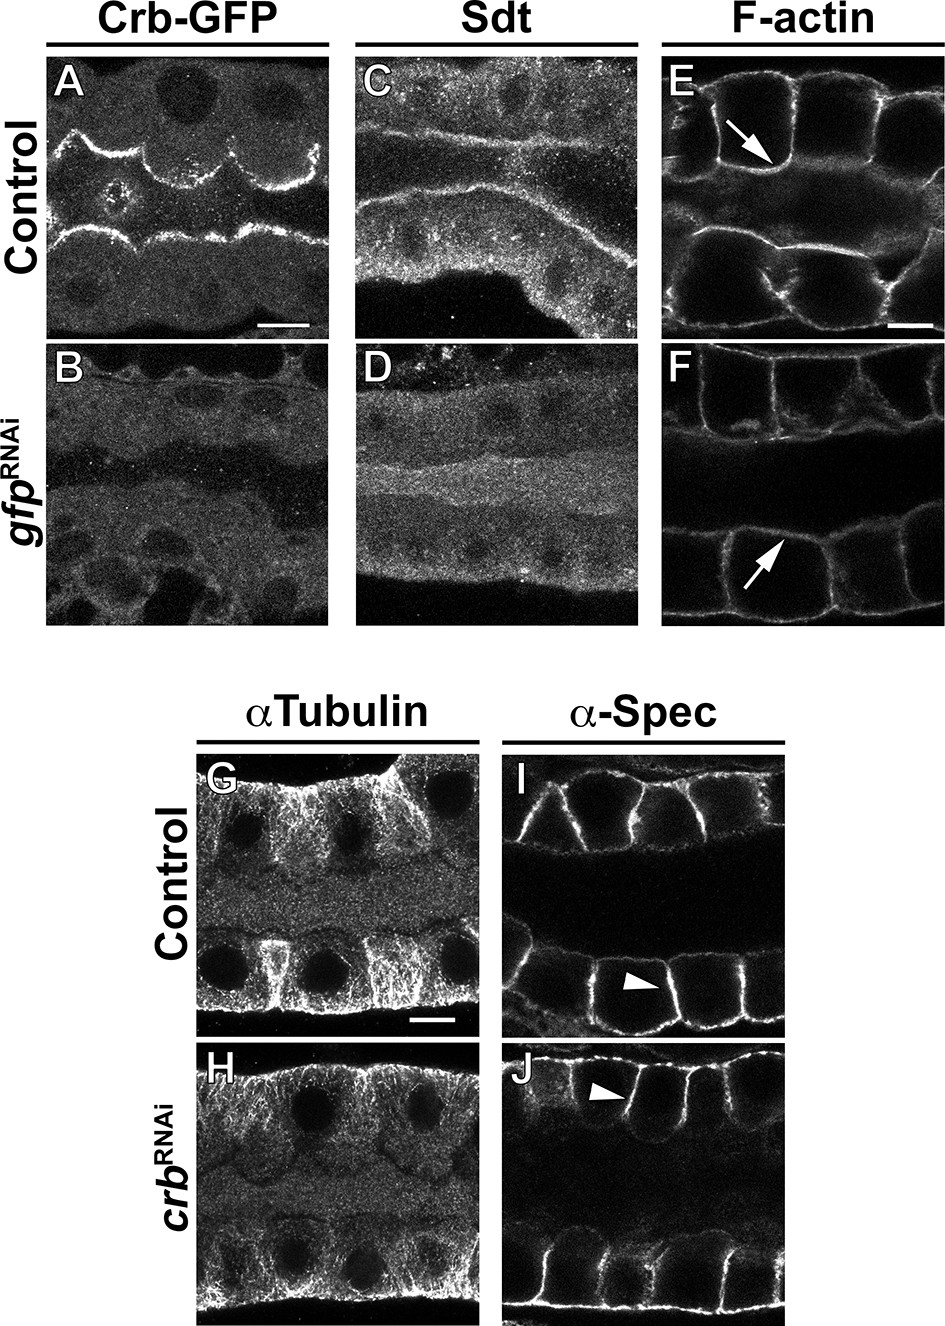
Crb is necessary to specifically maintain the apical membrane organization.
(A-F) Localization of endogenously tagged Crb-GFP (A,B), Sdt (C,D) and F-actin (phalloidin staining, E,F) in SGs of control (A,C,E, Crb-GFP, fkh>/+) and Crb KD (B,D,F, Crb-GFP, fkh >UAS gfpRNAi) animals. (G-J) Localization of αTubulin (G,H) and α-Spec (I,J) in SGs of control (G,I, fkh>/+) and Crb KD (H,J, fkh >UAS crbRNAi) animals. Shown are single optical slices. Arrows point to the apical and arrowheads to the lateral membrane domain. Scale bars (A,E,G) indicate 10 µm.
Figure 2—figure supplement 2
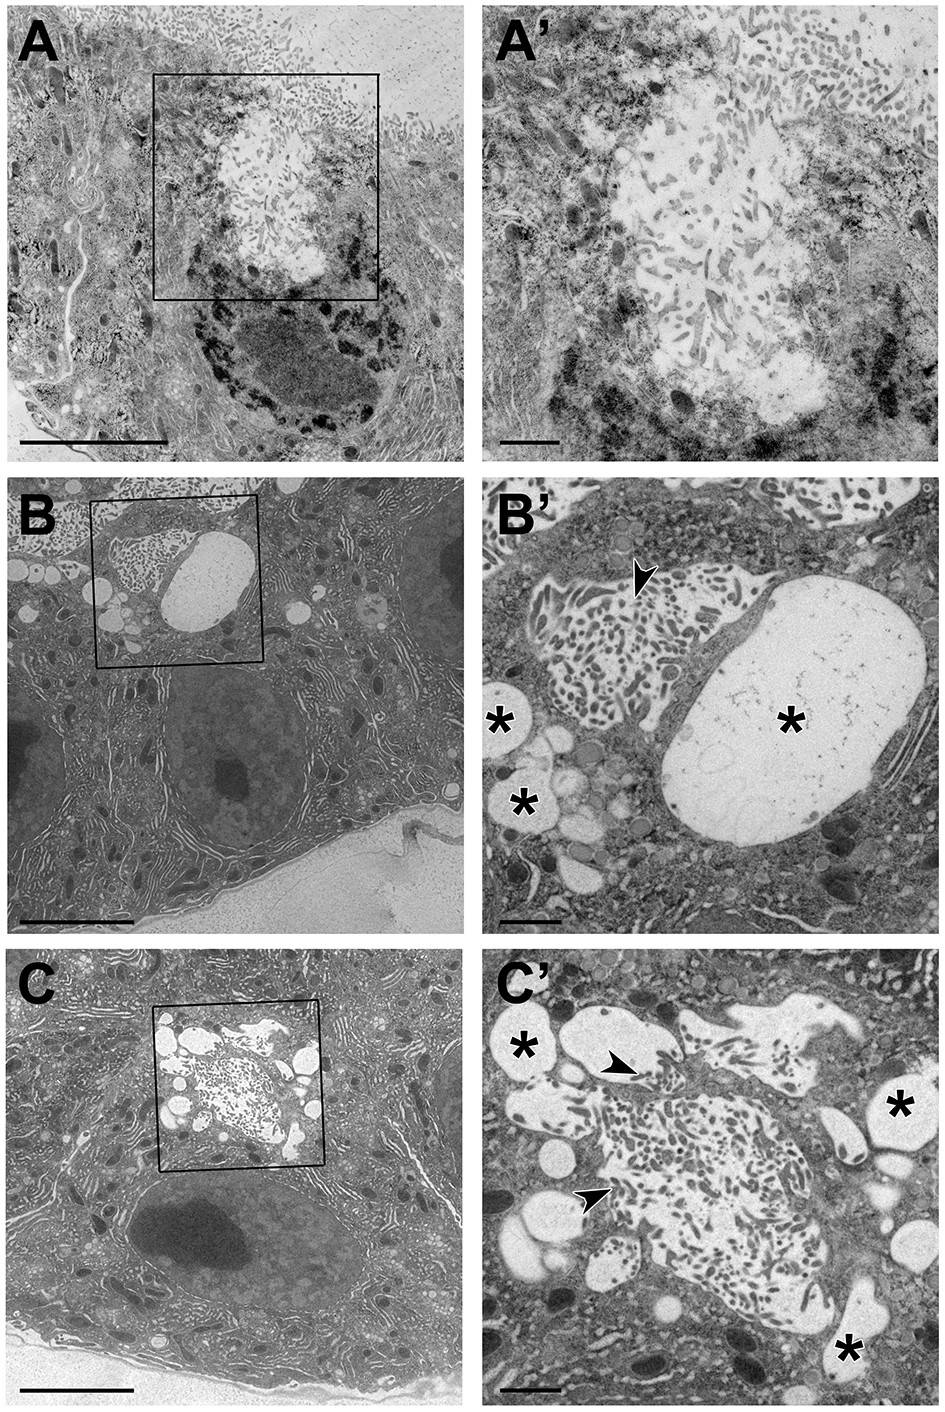
TEM images of intracellular extensions of apical membrane in Crb-deficient glands.
(A-C’) TEM images of SGs from Crb KD (fkh >UAS crbRNAi) animals prepared by high-pressure freezing technique. Asterisks mark large intracellular vesicles found in Crb-deficient glands. Arrowheads indicate microvilli found inside vesicles. Scale bars in (A-C) indicate 5 µm and in (A’-C’) indicate 1 µm.
Figure 2—figure supplement 3
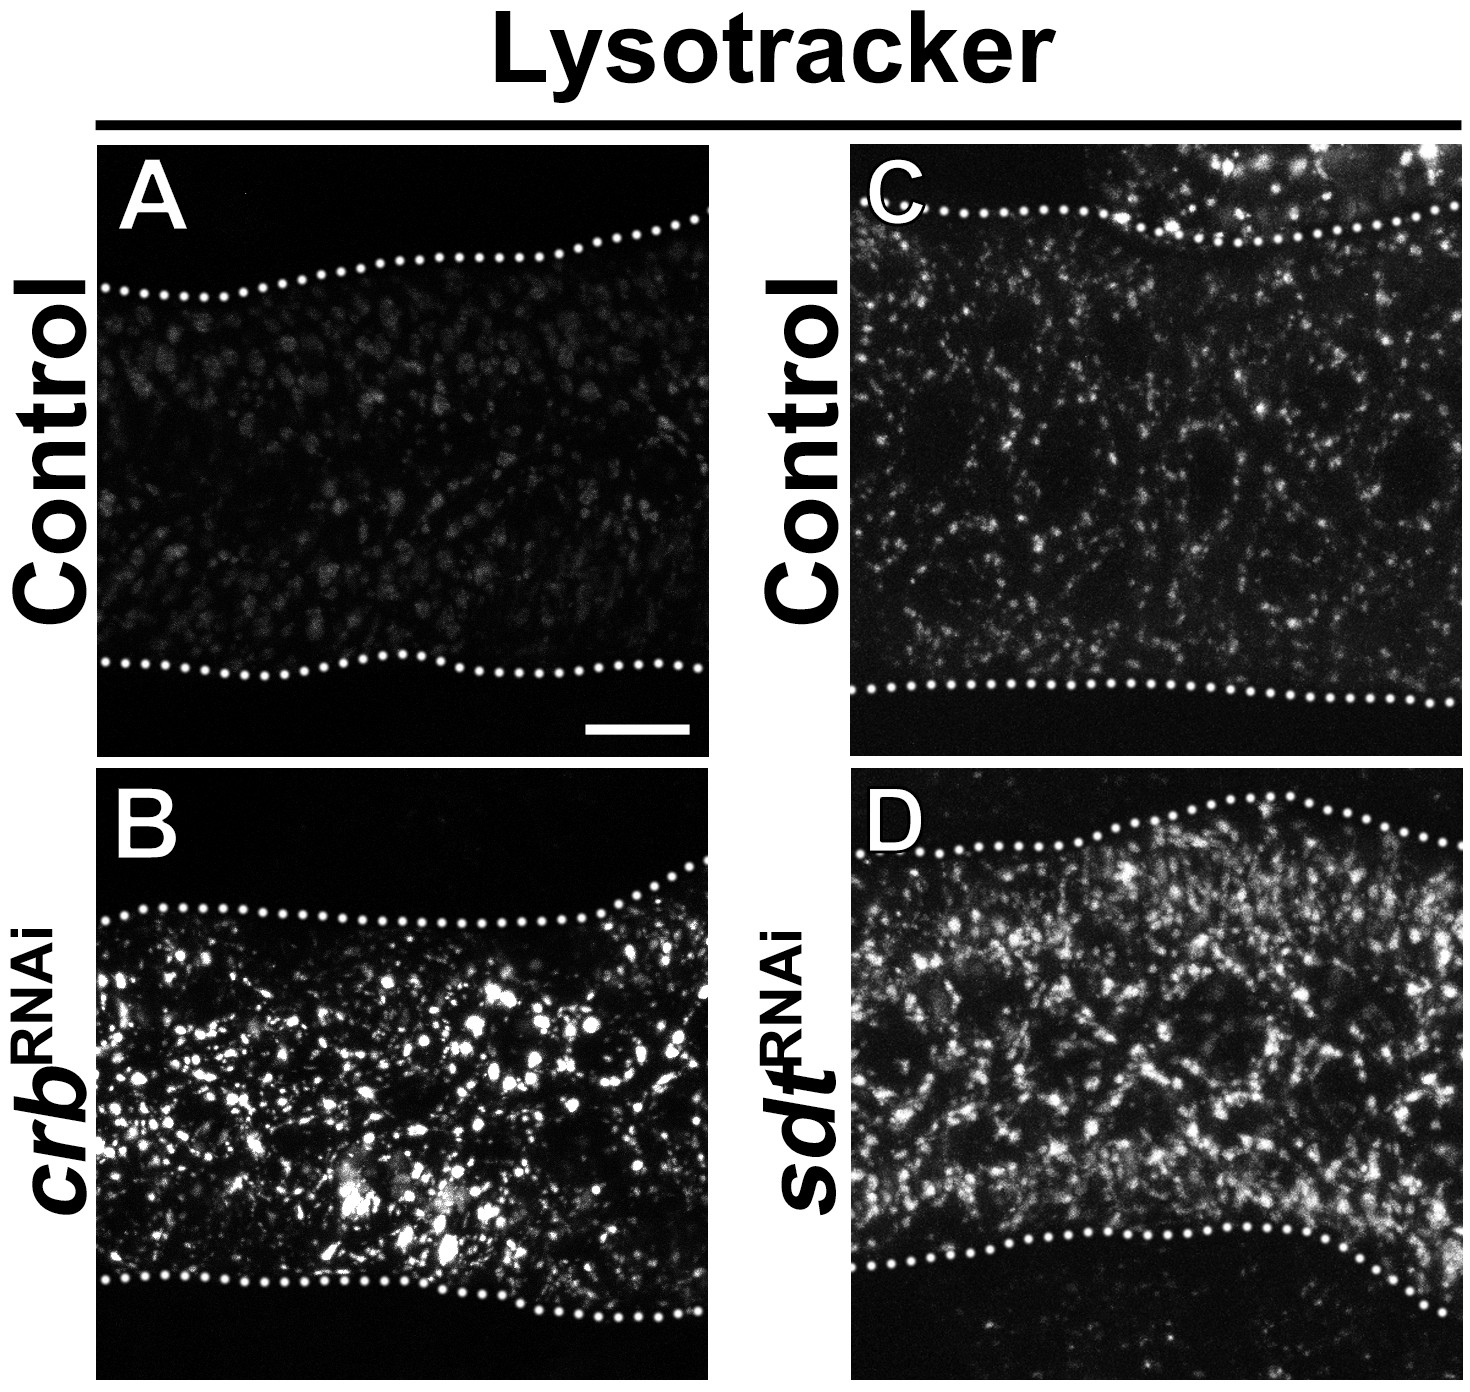
Increased lysosomal activity in Crb and Sdt deficient glands.
(A-D) Maximal projections of SGs incubated ex vivo with Lysotracker for 30 min of control (A,C, fkh>/+), Crb KD (B, fkh >UAS crbRNAi) and Sdt KD (D, fkh >UAS sdtRNAi) animals. Lysotracker fluorescence intensity increases as pH in lysosomal compartments acidifies, that is become more active. Dotted lines indicate the basal membrane. Scale bar in A displays 10 µm.
Figure 2—figure supplement 4
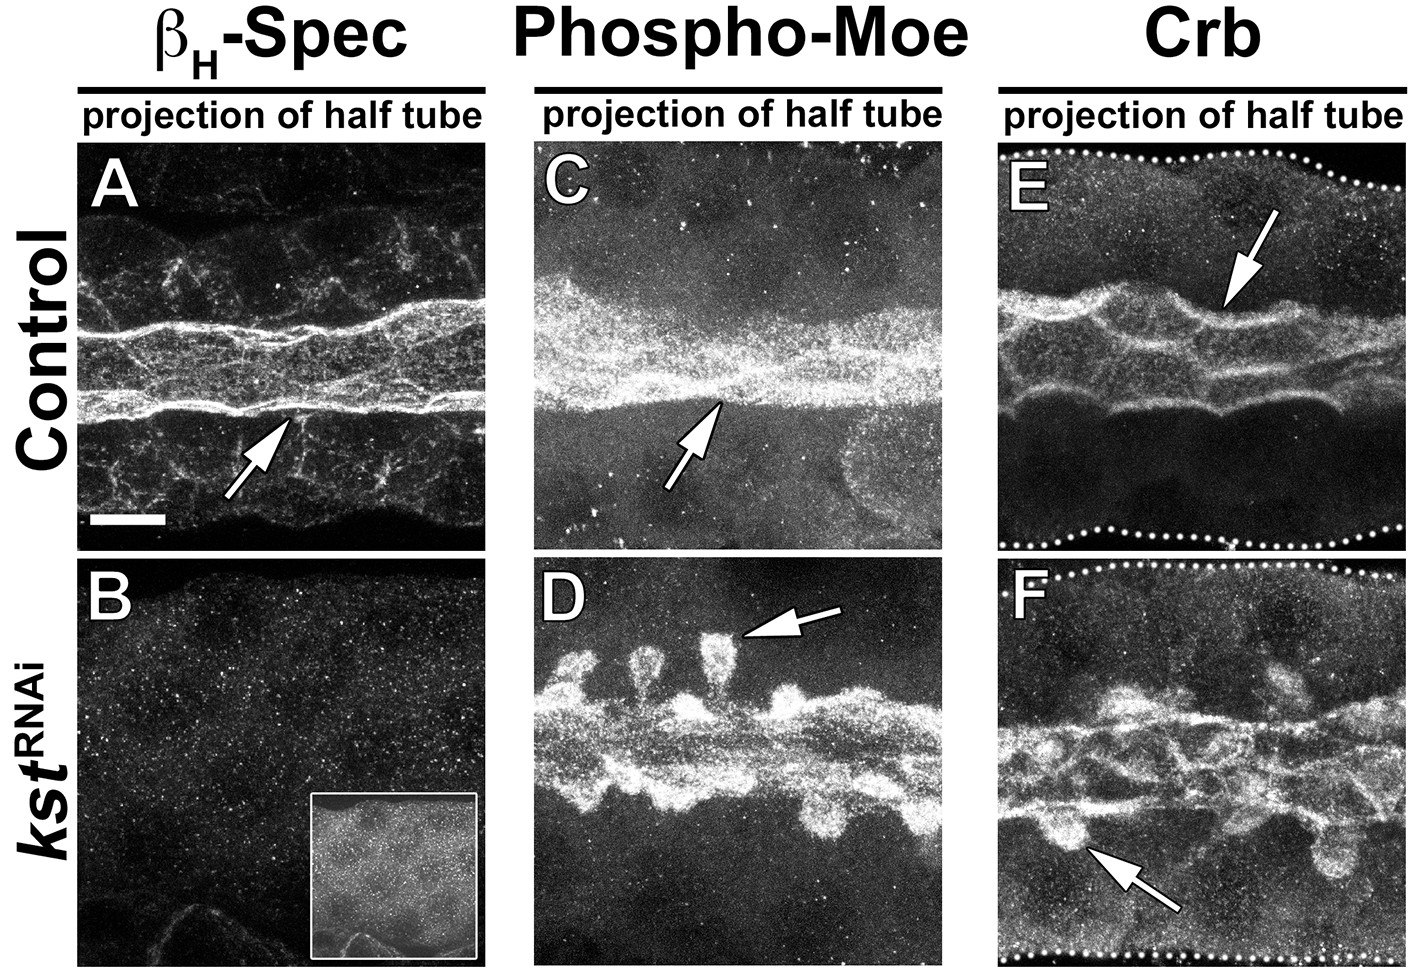
KD of βH-Spec induces the formation of PAMS.
(A,B) Localization of βH-Spec in control (A, fkh>/+) and βH-Spec KD (B, fkh >UAS kstRNAi) animals. Insert (B) displays the corresponding image with brightness adjusted manually using Photoshop to visualize the SG. (C,D) Localization of phospho-Moe in SGs of control (C, fkh>/+) and βH-Spec KD (D, fkh >UAS kstRNAi) animals. (E,F) Localization of Crb in control (E, fkh>/+) and βH-Spec KD (F, fkh >UAS kstRNAi) SGs, respectively. Arrows point to the apical membrane domain. Scale bar (A) indicates 10 µm and applies to all panels.
Figure 3 with 2 supplements
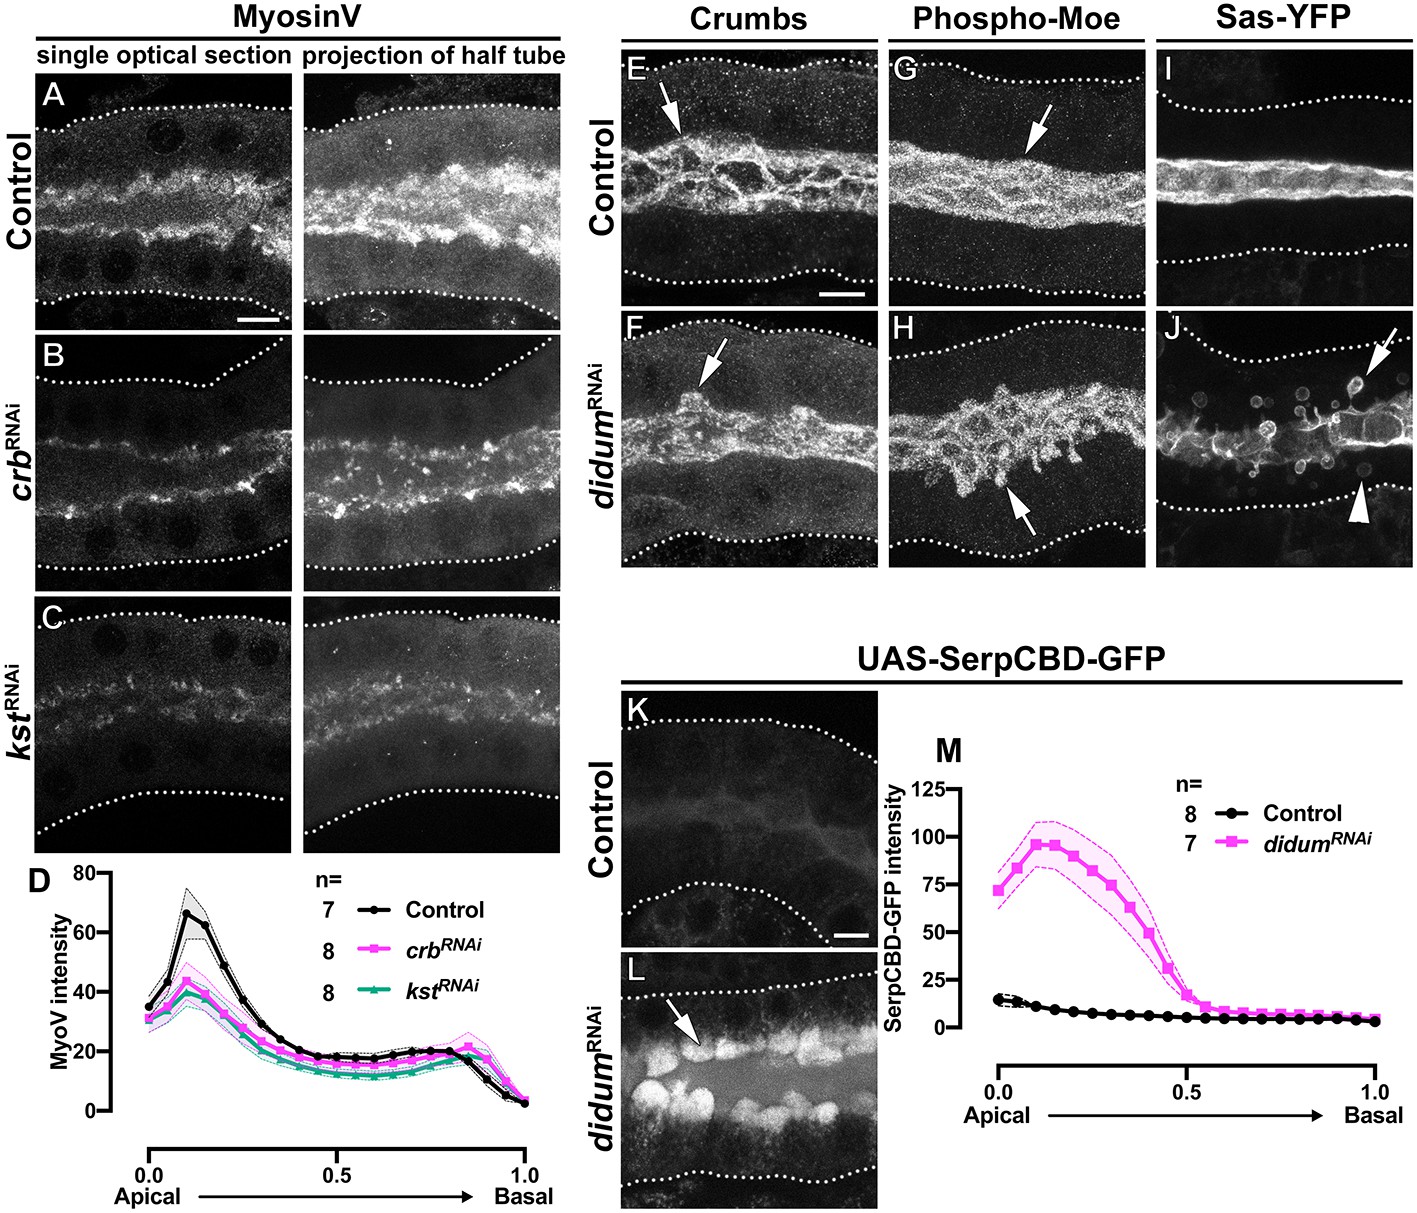
MyoV KD induces the intracellular extension of the apical membrane and disrupts apical secretion.
(A-C) Single optical slices and maximal projection of half of the z-stack (half SG-tube) showing the localization of MyoV in fixed SGs of control (A, fkh>/+), Crb KD (B, fkh >UAS crbRNAi) and βH-Spec KD (C, fkh >UAS kstRNAi) animals. (D, D) Plotted is the intensity (arbitrary units) of MyoV detected by immunofluorescence along the apical-to-basal direction in SGs of control (black, fkh>/+), Crb KD (magenta, fkh >UAS crbRNAi) and βH-Spec (green, fkh >UAS kstRNAi) animals. Error bars indicate the standard error of the mean, n indicates number of glands from the corresponding genotypes. (E-J) Maximal projection of half of the z-stack (half SG-tube) showing the localization of Crb (E,F), Phospho-Moe (G,H) and Sas-YFP in SGs of control (E,G,I, fkh>/+) and MyoV KD (F,H,J, fkh >UAS didumRNAi) animals. (K,L) Localization of SerpCBD-GFP in live SGs of control (K, fkh >UAS SerpCBD-GFP) and MyoV KD (L, fkh >UAS didumRNAi; UAS-SerpCBD-GFP) animals. Arrows point to the apical and dotted lines indicate the basal membrane. Scale bars in (A,E,K) indicate 10 µm. (M, M) Plotted is the fluorescence intensity (arbitrary units) of SerpCBD-GFP along the apical-to-basal direction in live SGs of control (black, fkh >UAS SerpCBD-GFP), and MyoV KD (magenta, fkh >UAS didumRNAi; UAS-SerpCBD-GFP) animals. Error bars indicate the standard error of the mean, n indicates number of glands from the corresponding genotypes.
-
Figure 3—source data 1
Dataset for MyosinV fluorescence intensity in control glands.
- https://cdn.elifesciences.org/articles/50900/elife-50900-fig3-data1-v2.xlsx
-
Figure 3—source data 2
Dataset for MyosinV fluorescence intensity in Crb KD glands.
- https://cdn.elifesciences.org/articles/50900/elife-50900-fig3-data2-v2.xlsx
-
Figure 3—source data 3
Dataset for MyosinV fluorescence intensity in βH-Spec KD glands.
- https://cdn.elifesciences.org/articles/50900/elife-50900-fig3-data3-v2.xlsx
-
Figure 3—source data 4
Dataset for SerpCBD-GFP fluorescence intensity in control glands.
- https://cdn.elifesciences.org/articles/50900/elife-50900-fig3-data4-v2.xlsx
-
Figure 3—source data 5
Dataset for SerpCBD-GFP fluorescence intensity in MyoV KD glands.
- https://cdn.elifesciences.org/articles/50900/elife-50900-fig3-data5-v2.xlsx
Figure 3—figure supplement 1
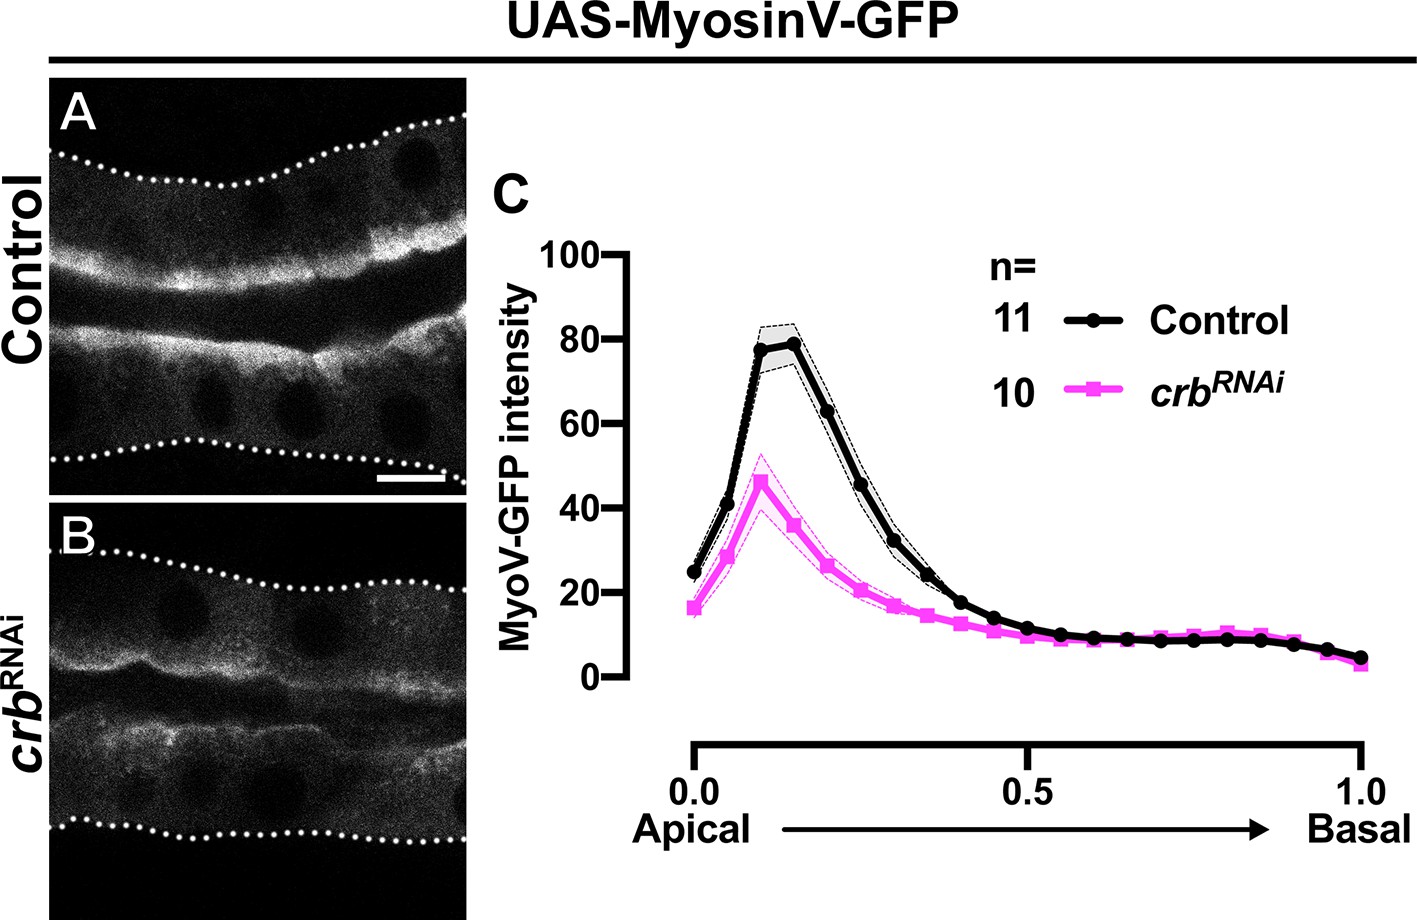
Proper apical localization of MyoV requires Crb.
(A-C) Localization and quantification of MyoV-GFP fluorescence intensity detected along the apical-to-basal axis in live SGs of control (black, fkh >UAS MyosinV-GFP) and Crb KD (magenta, fkh >UAS crbRNAi, UAS-MyosinV-GFP) animals. Error bars indicate the standard error of the mean, n indicates number of glands from the corresponding genotypes. Dotted lines indicate the basal membrane. Scale bars in (A) indicate 10 µm.
-
Figure 3—figure supplement 1—source data 1
Dataset for MyosinV-GFP fluorescence intensity in control glands.
- https://cdn.elifesciences.org/articles/50900/elife-50900-fig3-figsupp1-data1-v2.xlsx
-
Figure 3—figure supplement 1—source data 2
Dataset for MyosinV-GFP fluorescence intensity in Crb KD glands.
- https://cdn.elifesciences.org/articles/50900/elife-50900-fig3-figsupp1-data2-v2.xlsx
Figure 3—figure supplement 2
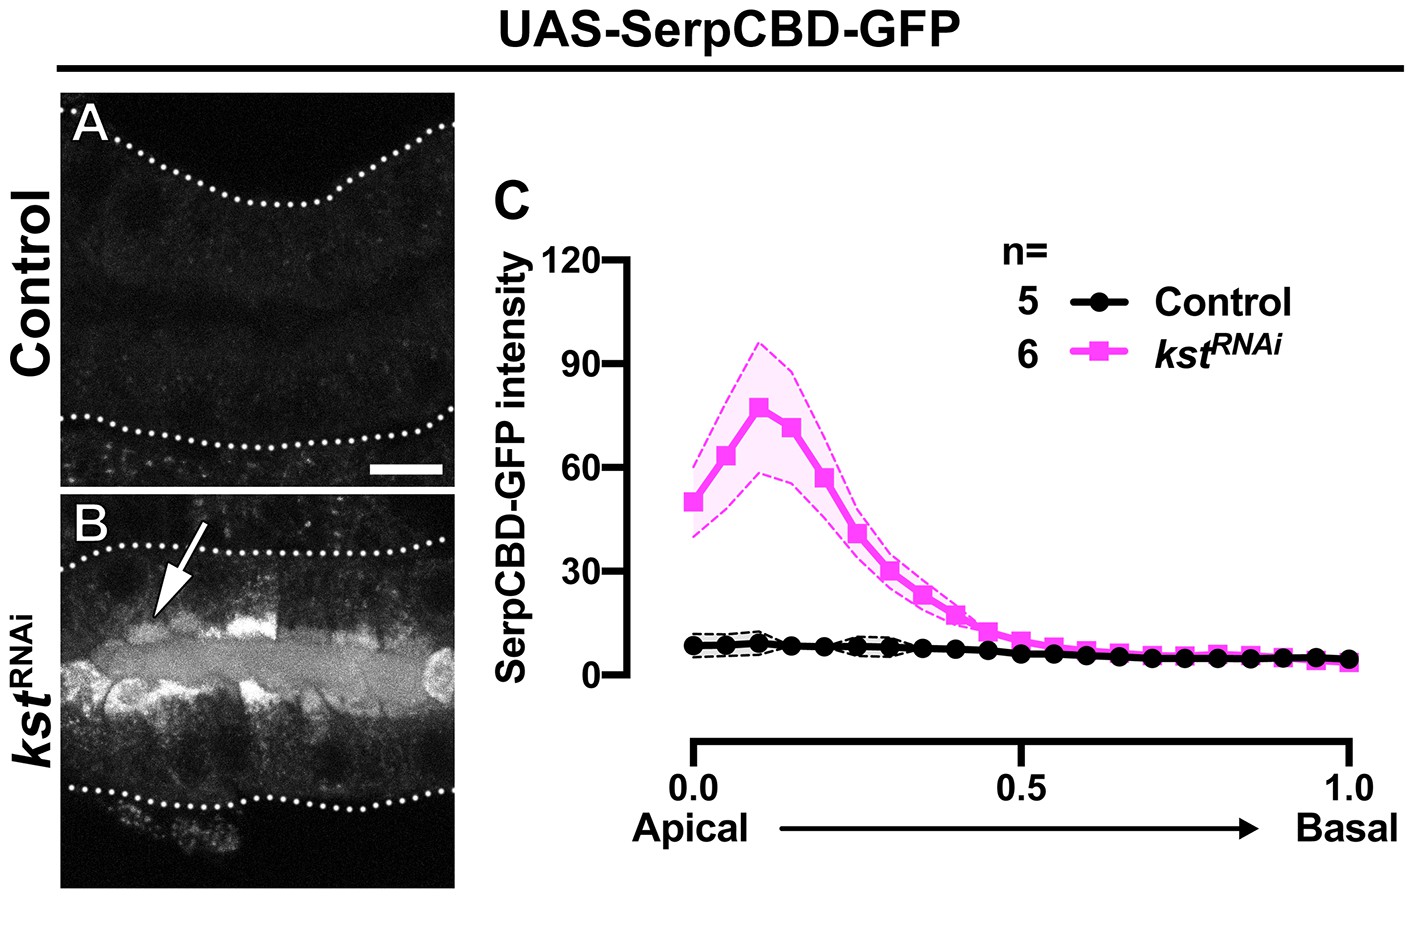
βH-Spec is required for proper apical secretion.
(A-C) Localization and quantification of SerpCBD-GFP fluorescence intensity detected along the apical-to-basal axis in live SGs of control (black, fkh >UAS SerpCBD-GFP) and βH-Spec KD (magenta, fkh >UAS kstRNAi, UAS-SerpCBD-GFP) animals. Error bars indicate the standard error of the mean, n indicates number of glands from the corresponding genotypes. Dotted lines indicate the basal membrane. Scale bars in (A) indicate 10 µm.
-
Figure 3—figure supplement 2—source data 1
Dataset for SerpCBD-GFP fluorescence intensity in control glands.
- https://cdn.elifesciences.org/articles/50900/elife-50900-fig3-figsupp2-data1-v2.xlsx
-
Figure 3—figure supplement 2—source data 2
Dataset for SerpCBD-GFP fluorescence intensity in βH-Spec KD glands.
- https://cdn.elifesciences.org/articles/50900/elife-50900-fig3-figsupp2-data2-v2.xlsx
Figure 4 with 3 supplements
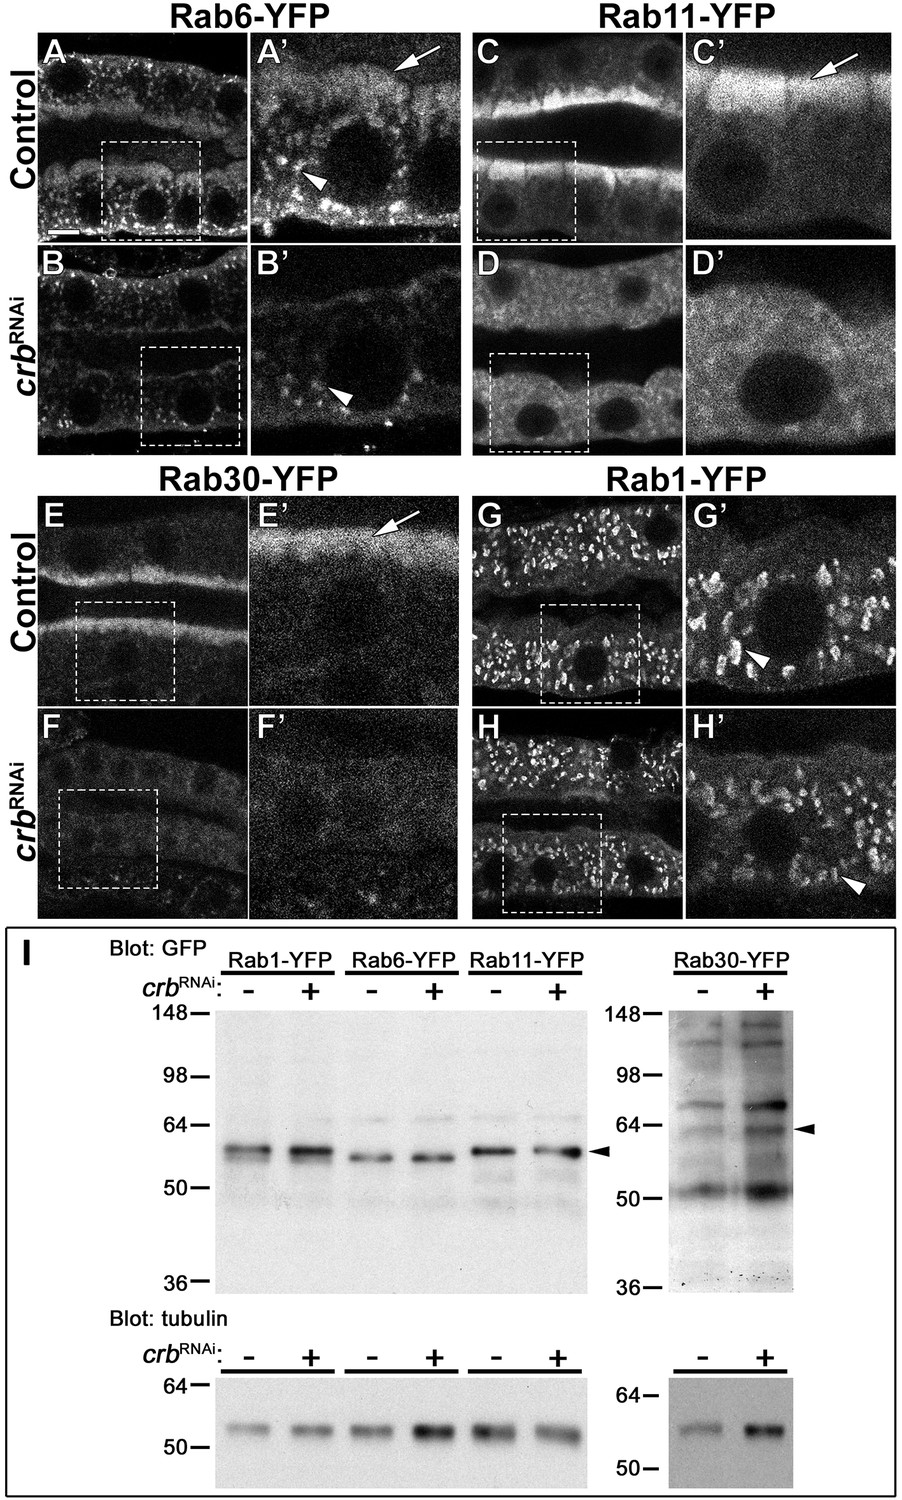
Crb organizes the apical Rab machinery in larval SG cells.
(A-H’) Confocal images of SGs to localize endogenously expressed Rab-YFP proteins. Rab6-YFP (A-B’), Rab11-YFP (C-D’), Rab30-YFP (E-F’) and Rab1-YFP (G-H’) in control (A,C,E,G, fkh>/+) and Crb KD (B,D,F,H, fkh >UAS crbRNAi) SGs. Dotted-line squares in A-H indicate the area blown-up to the right of the respective panel (A’-H’). Arrows point to the apical pool of Rab6-YFP (A’), Rab11-YFP (C’) and Rab30-YFP (E’). Arrowheads mark the intracellular vesicular localization of Rab6-YFP (A’,B’) and Rab1-YFP (G’,H’). Scale bar (A) indicates 10 µm. (I, I) Western blot of endogenously expressed Rab-YFP proteins. Rab1-YFP, Rab6-YFP, Rab11-YFP, and Rab30-YFP in control (fkh>/+) and Crb KD (fkh >UAS crbRNAi) SGs, indicated as crbRNAi – or +, respectively. Membranes were probed for tubulin (loading control) and for GFP; arrowheads point to Rab-YFP proteins.
Figure 4—figure supplement 1
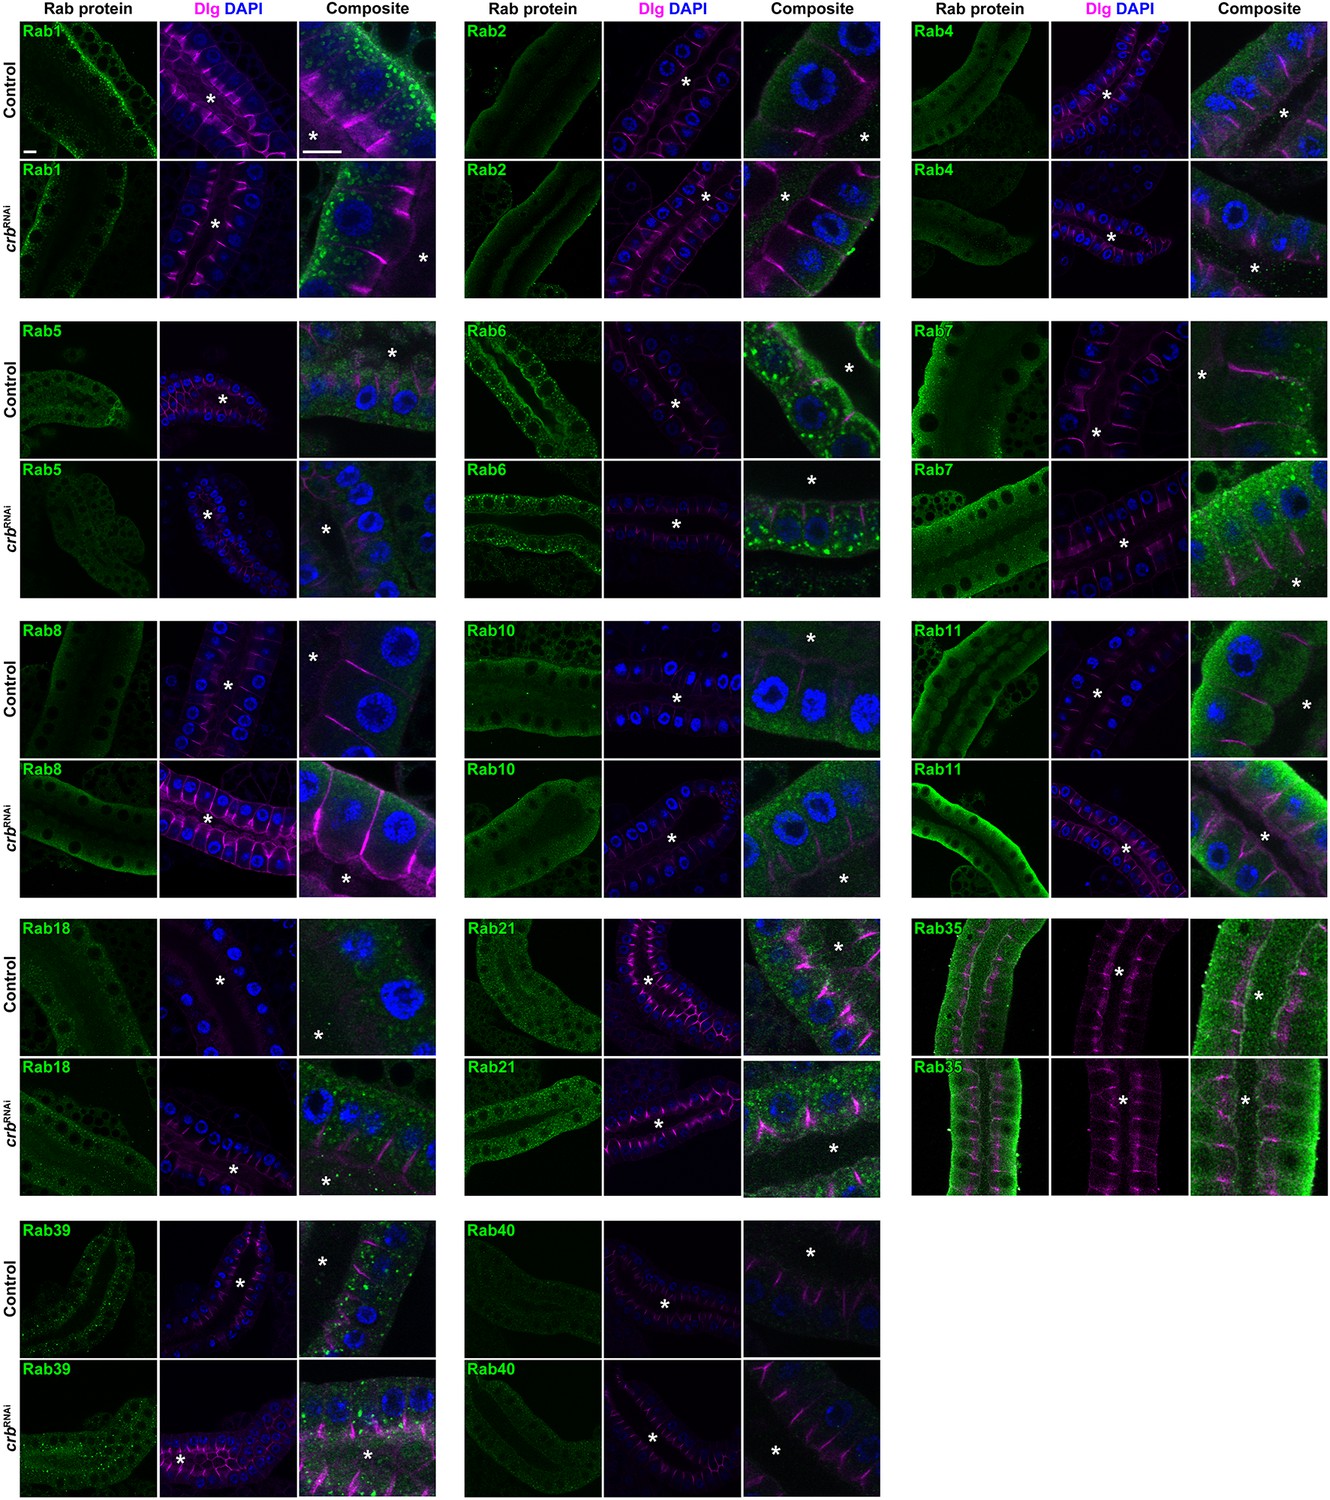
Localization of Rab-YFP proteins after KD of Crb in larval SGs.
Shown are images from SGs (optical sections at the level of the gland lumen) stained for GFP (green), DAPI (blue) and Dlg (magenta). Six panels are shown for each Rab-YFP protein indicated, of controls (upper row) and Crb KD (lower row) in the respective Rab-YFP background. Asterisks indicate the SG lumen, scale bars indicate 10 µm. Note no DAPI staining is shown in the panels for Rab35.
Figure 4—figure supplement 2
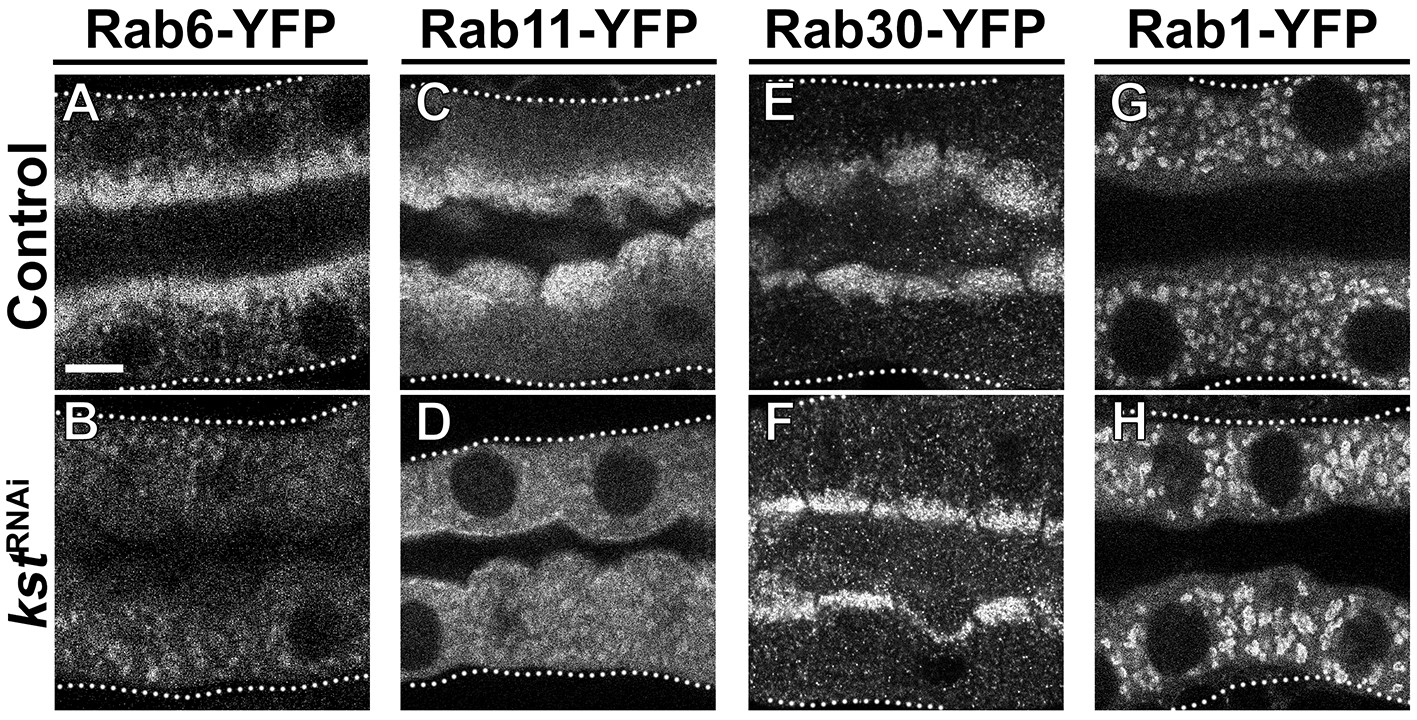
The apical cytocortex is necessary for the organization of apical Rab6 and Rab11 trafficking machinery.
(A-H) Localization of endogenously expressed Rab-YFP proteins. Rab6-YFP (A,B), Rab11-YFP (C,D), Rab30-YFP (E,F) and Rab1-YFP (G,H) in control (A,C,E,G, fkh>/+) and βH-Spec KD (B,D,F,H, fkh >UAS kstRNAi). Dotted lines indicate basal membrane. Scale bar (A) indicates 10 µm and applies to all panels.
Figure 4—figure supplement 3
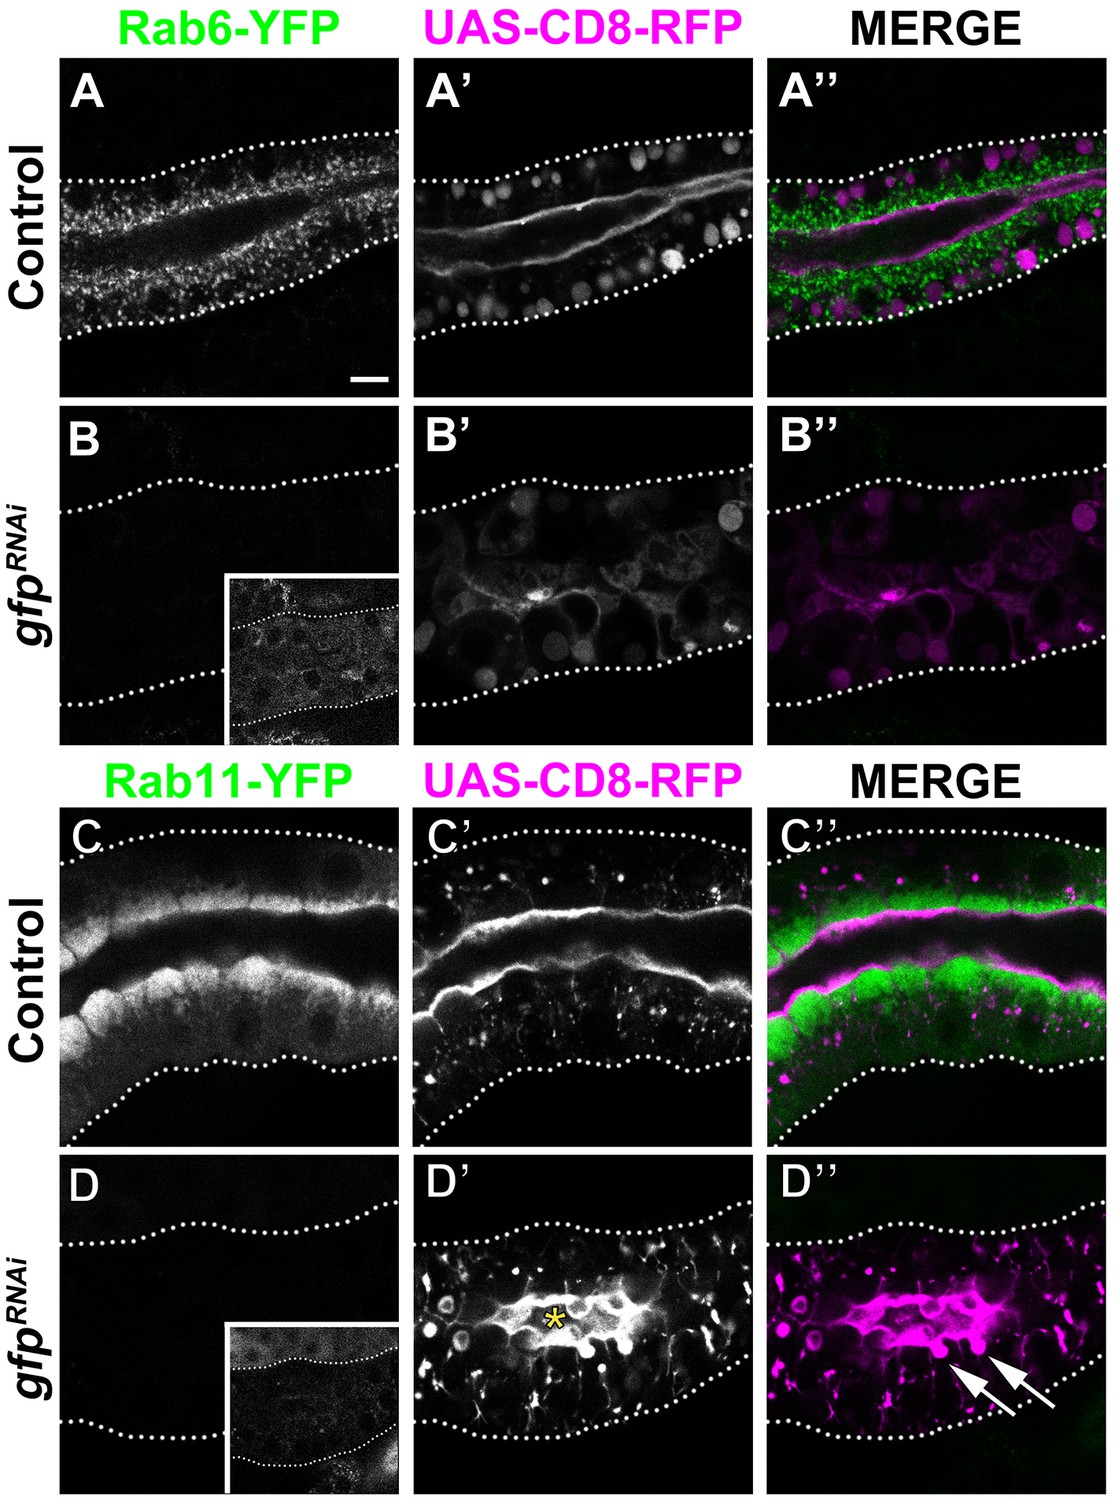
Loss of Rab11 in larval SG induces the formation of PAMS.
(A-D’’) Localization of heterologous protein CD8-RFP and endogenously expressed Rab6-YFP (A-B’’) and Rab11-YFP (C-D’’) in control (A,-A’’,C-C’’, fkh >UAS-CD8-RFP) and GFP KD (B-B’’,D-D’’, fkh >UAS gfpRNAi; UAS-CD8-RFP) animals. Arrows point to the PAMS found in Rab11-YFP KD (D’’). Asterisk (D’) marks the lumen. Dotted lines indicate basal membrane. Inserts (B,D) display the corresponding SGs with brightness intensified manually using Photoshop to visualize the SG. Scale bar (A) indicates 10 µm and applies to all panels.
Figure 5 with 2 supplements
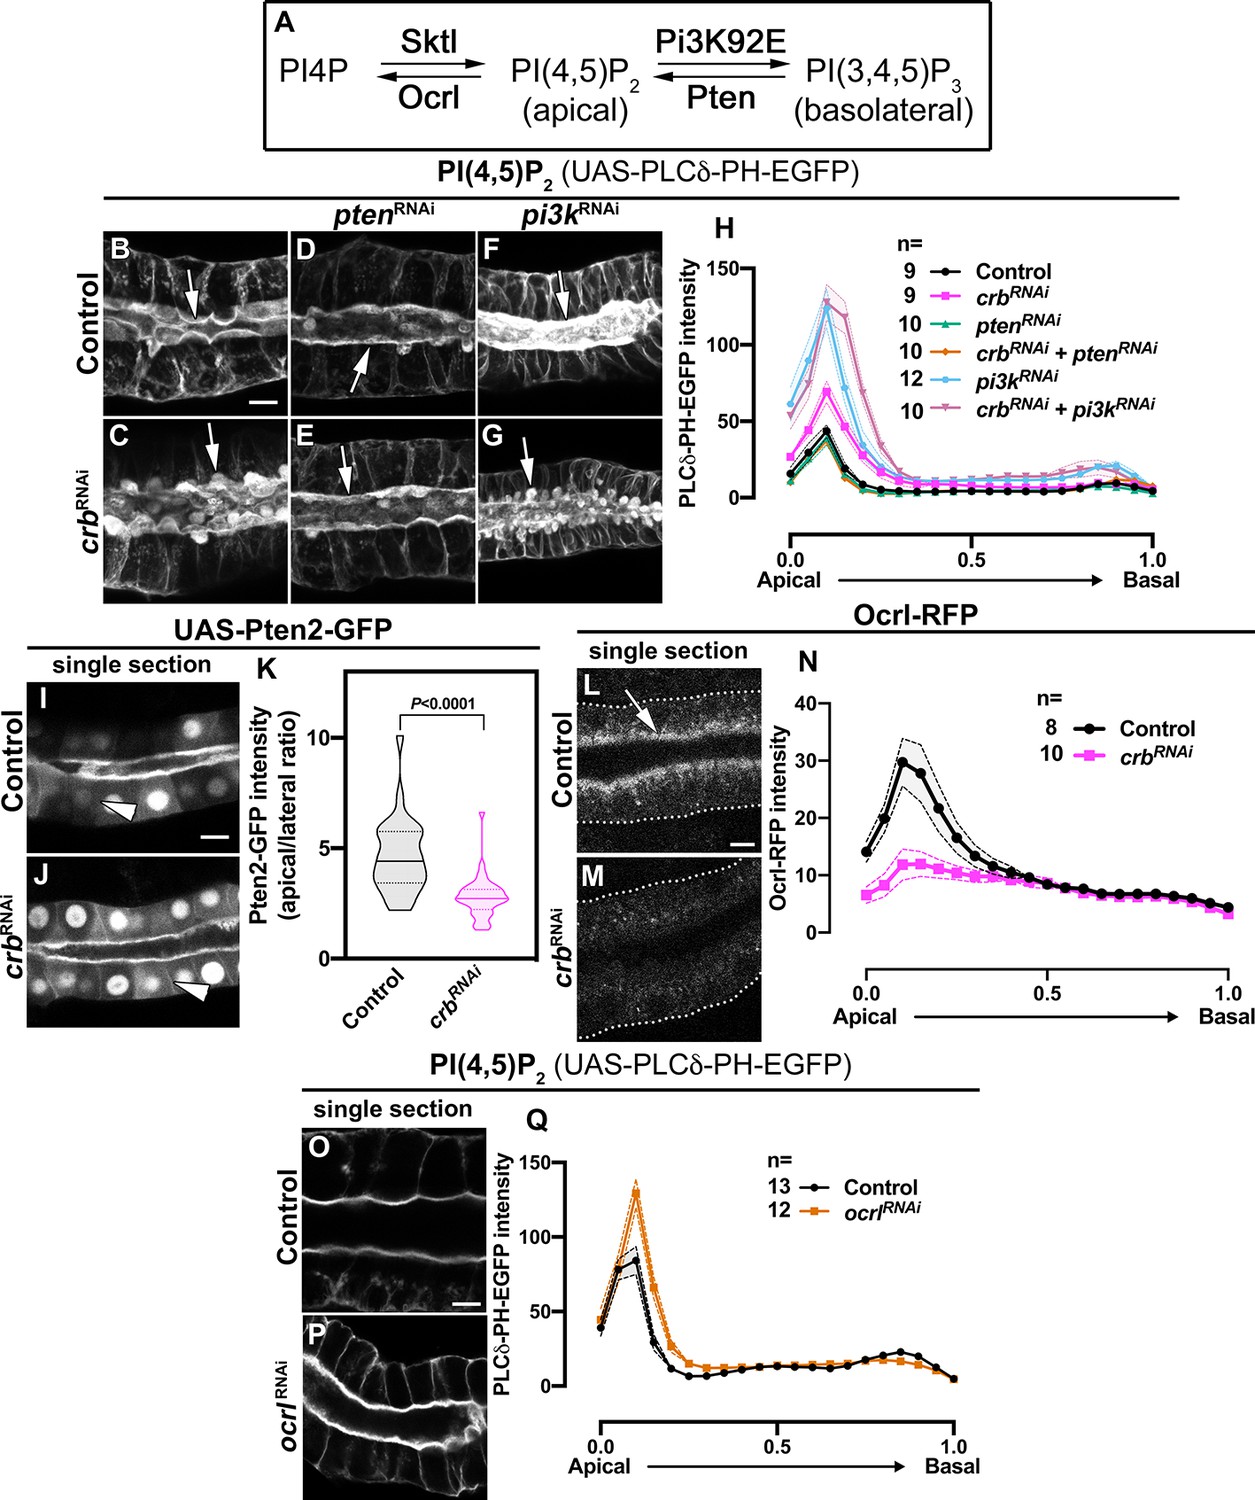
Crb organizes the apical secretory machinery by negatively regulating Pten A.
(A) Simplified scheme of PI(4,5)P2 biosynthesis. (B-G) Maximal projection of half of the z-stack (half SG-tube) showing the localization of PI(4,5)P2 (PLCδ-PH-EGFP reporter) in live SGs of control (B, fkh >UAS-PLCδ-PH-EGFP), Crb KD (C, fkh >UAS crbRNAi; UAS-PLCδ-PH-EGFP), Pten KD (D, fkh >UAS ptenRNAi; UAS-PLCδ-PH-EGFP), double KD of Crb and Pten (E, fkh >UAS crbRNAi, UAS-ptenRNAi; UAS-PLCδ-PH-EGFP), Pi3K92E KD (F, fkh >UAS-pi3k92ERNAi; UAS-PLCδ-PH-EGFP) and double KD of Crb and Pi3K92E (G, fkh >UAS crbRNAi, UAS-pi3k92ERNAi; UAS-PLCδ-PH-EGFP) animals. (H, H) Plotted is the fluorescence intensity (arbitrary units) of PLCδ-PH-EGFP along the apical-to-basal axis in live SGs of the genotypes indicated in (B-G), respectively. Error bars indicate the standard error of the mean, n indicates number of glands for the corresponding genotype. (I-K) Localization and quantification of over-expressed Pten2-GFP in SGs of control (I, fkh >UAS-Pten2-GFP) and Crb KD (J, fkh >UAS crbRNAi; UAS-Pten2-GFP) animals. Violin graph (K) indicates the fluorescence intensity (apical vs lateral ratio) indicating the mean and quartiles (n = 28 cells for control and 36 cells for Crb KD). Statistical significance was analyzed in an unpaired two-tailed t-test. (L-N) Localization and quantification of Ocrl-RFP fluorescence intensity detected along the apical-to-basal axis in live SGs of control (black, fkh>/+) and Crb KD (magenta, fkh >UAS crbRNAi) animals. Error bars indicate the standard error of the mean, n indicates number of glands of the corresponding genotypes. (O-Q) Localization and quantification of PLCδ-PH-EGFP fluorescence intensity detected along the apical-to-basal axis in live SGs of control (black, fkh>/+) and Ocrl KD (orange, fkh >UAS ocrlRNAi) animals. Error bars indicate the standard error of the mean, n indicates the number of glands of the corresponding genotypes. Arrows point to the apical membrane domain. Arrowheads point to the lateral membrane. Dotted lines indicate the basal membrane. Scale bars in (B,I,L,O) indicate 10 µm.
-
Figure 5—source data 1
Dataset for PLCδ-PH-EGFP fluorescence intensity in control glands (corresponding to panel H).
- https://cdn.elifesciences.org/articles/50900/elife-50900-fig5-data1-v2.xlsx
-
Figure 5—source data 2
Dataset for PLCδ-PH-EGFP fluorescence intensity in Crb KD glands (corresponding to panel H).
- https://cdn.elifesciences.org/articles/50900/elife-50900-fig5-data2-v2.xlsx
-
Figure 5—source data 3
Dataset for PLCδ-PH-EGFP fluorescence intensity in Pten KD glands (corresponding to panel H).
- https://cdn.elifesciences.org/articles/50900/elife-50900-fig5-data3-v2.xlsx
-
Figure 5—source data 4
Dataset for PLCδ-PH-EGFP fluorescence intensity in glands with double KD of Crb and Pten (corresponding to panel H).
- https://cdn.elifesciences.org/articles/50900/elife-50900-fig5-data4-v2.xlsx
-
Figure 5—source data 5
Dataset for PLCδ-PH-EGFP fluorescence intensity in Pi3K92E KD glands (corresponding to panel H).
- https://cdn.elifesciences.org/articles/50900/elife-50900-fig5-data5-v2.xlsx
-
Figure 5—source data 6
Dataset for PLCδ-PH-EGFP fluorescence intensity in glands with double KD of Crb and Pi3K92E (corresponding to panel H).
- https://cdn.elifesciences.org/articles/50900/elife-50900-fig5-data6-v2.xlsx
-
Figure 5—source data 7
Dataset for Pten2-GFP fluorescence intensity (corresponding to panel K).
- https://cdn.elifesciences.org/articles/50900/elife-50900-fig5-data7-v2.xlsx
-
Figure 5—source data 8
Dataset for Ocrl-RFP fluorescence intensity in control glands (corresponding to panel N).
- https://cdn.elifesciences.org/articles/50900/elife-50900-fig5-data8-v2.xlsx
-
Figure 5—source data 9
Dataset for Ocrl-RFP fluorescence intensity in Crb KD glands (corresponding to panel N).
- https://cdn.elifesciences.org/articles/50900/elife-50900-fig5-data9-v2.xlsx
-
Figure 5—source data 10
Dataset for PLCδ-PH-EGFP fluorescence intensity in control glands (corresponding to panel Q).
- https://cdn.elifesciences.org/articles/50900/elife-50900-fig5-data10-v2.xlsx
-
Figure 5—source data 11
Dataset for PLCδ-PH-EGFP fluorescence intensity in Ocrl KD glands (corresponding to panel Q).
- https://cdn.elifesciences.org/articles/50900/elife-50900-fig5-data11-v2.xlsx
-
Figure 5—source data 12
Dataset for number of PAMS and diameter of PAMS.
- https://cdn.elifesciences.org/articles/50900/elife-50900-fig5-data12-v2.xlsx
Figure 5—figure supplement 1
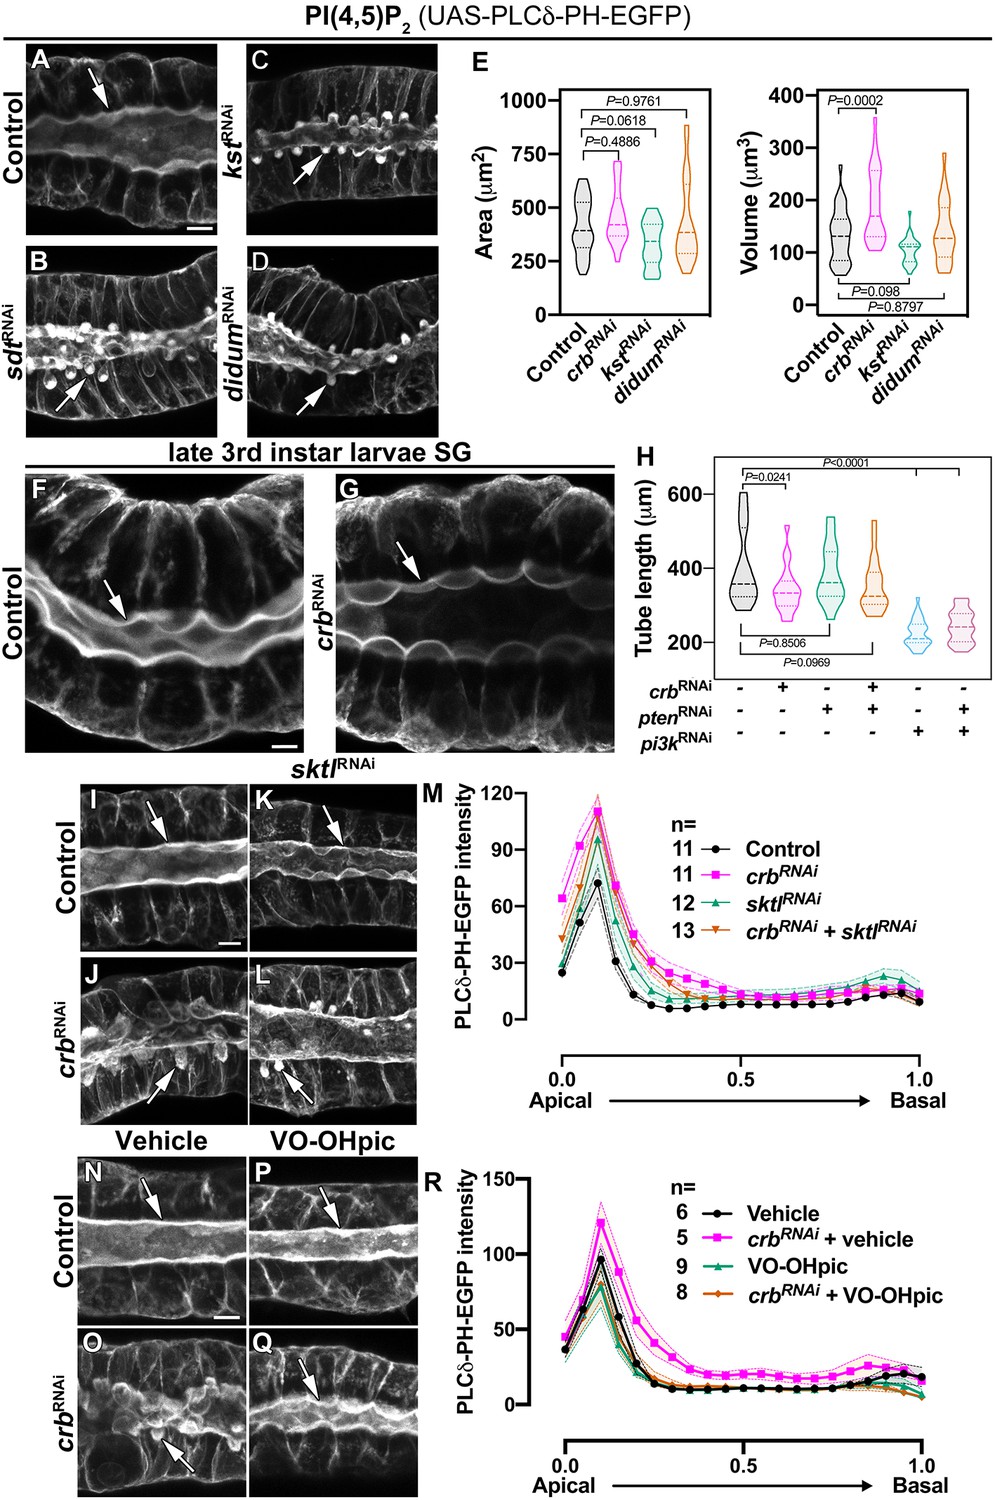
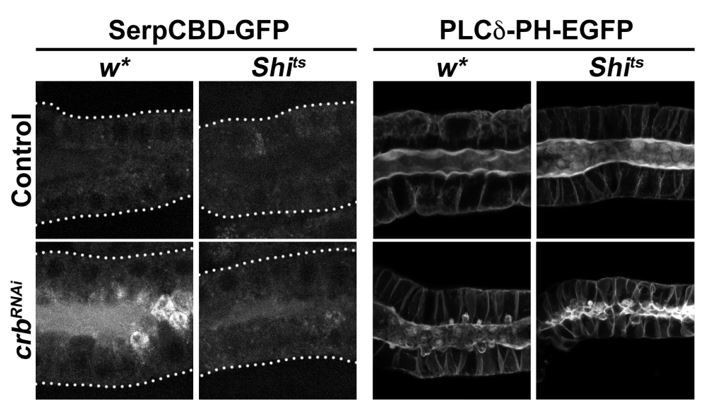
The Crb protein complex regulates apical levels of PI(4,5)P2 and the secretory activity of SGs.
(A-D) Maximal projection of half of the z-stack (half SG-tube) showing the localization of PI(4,5)P2 (PLCδ-PH-EGFP reporter) in live SGs of control (A, fkh >UAS-PLCδ-PH-EGFP), Sdt KD (B, fkh >UAS sdtRNAi; UAS-PLCδ-PH-EGFP), βH-Spec KD (C, fkh >UAS kstRNAi; UAS-PLCδ-PH-EGFP) and MyoV KD (L, fkh >UAS didumRNAi; UAS-PLCδ-PH-EGFP) animals. (E) Violin graphs indicating the mean and quartiles for the apical surface quantification (area and volume) in live salivary glands of control (A, fkh >UAS-PLCδ-PH-EGFP, n = 33 cells), Crb KD (B, fkh >UAS crbRNAi; UAS-PLCδ-PH-EGFP, n = 25 cells), βH-Spec KD (C, fkh >UAS kstRNAi; UAS-PLCδ-PH-EGFP, n = 29 cells) and MyoV KD (L, fkh >UAS didumRNAi; UAS-PLCδ-PH-EGFP, n = 24 cells) animals. Statistical significance was analyzed in a one-way analysis of variance (ANOVA) followed by a Dunnett’s multiple-comparison test. (F,G) Localization of PLCδ-PH-EGFP is shown in live SGs of late 3rd instar wandering larvae of control (F, fkh >UAS-PLCδ-PH-EGFP) and Crb KD (G, fkh >UAS crbRNAi; UAS-PLCδ-PH-EGFP) animals. (H) Violin graphs of the tube length from live SGs of control (first column, n = 18), Crb KD (second column, n = 20), Pten KD (third column, n = 16), double KD of Crb and Pten (fourth column, n = 19), Pi3K92E KD (fifth column, n = 29), and double KD of Crb and Pi3K92E (sixth column, n = 22). Values for control and Crb KD are the same as shown in Figure 1—figure supplement 1R. (I-M) Localization of PI(4,5)P2 is shown in live SGs from control (I, fkh >UAS-PLCδ-PH-EGFP), Crb KD (J, fkh >UAS crbRNAi; UAS-PLCδ-PH-EGFP), Sktl KD (K, fkh >UAS sktlRNAi; UAS-PLCδ-PH-EGFP) and double KD of Crb and Sktl (L, fkh >UAS sktlRNAi, UAS-crbRNAi; UAS-PLCδ-PH-EGFP) animals. (M) Plotted is the fluorescence intensity (arbitrary units) of PLCδ-PH-EGFP along the apical-to-basal direction in live SGs of the indicated genotypes. Error bars indicate the standard error of the mean, n indicates number of glands from the corresponding genotype. (N-R) Localization of PI(4,5)P2 is shown in live SGs from control (N,P, fkh >UAS-PLCδ-PH-EGFP) and Crb KD (O,Q, fkh >UAS crbRNAi; UAS-PLCδ-PH-EGFP), animals. The SGs were incubated for 30 min in Grace’s medium complemented with DMSO (N,O, Vehicle) or an inhibitor of the lipid phosphatase Pten (P,Q, VO-OHpic 10 µM). (R) Plotted is the fluorescence intensity (arbitrary units) of PLCδ-PH-EGFP along the apical-to-basal axis in live SGs of the indicated genotypes. Error bars indicate the standard error of the mean, n indicates number of glands from the corresponding genotype. Arrows point to the apical membrane domain. Scale bars in (A,F,I,N) indicate 10 µm.
-
Figure 5—figure supplement 1—source data 1
Dataset for apical surface quantifications.
- https://cdn.elifesciences.org/articles/50900/elife-50900-fig5-figsupp1-data1-v2.xlsx
-
Figure 5—figure supplement 1—source data 2
Dataset for salivary gland lengths.
- https://cdn.elifesciences.org/articles/50900/elife-50900-fig5-figsupp1-data2-v2.xlsx
-
Figure 5—figure supplement 1—source data 3
Dataset for PLCδ-PH-EGFP fluorescence intensity in control glands.
- https://cdn.elifesciences.org/articles/50900/elife-50900-fig5-figsupp1-data3-v2.xlsx
-
Figure 5—figure supplement 1—source data 4
Dataset for PLCδ-PH-EGFP fluorescence intensity in Crb KD glands.
- https://cdn.elifesciences.org/articles/50900/elife-50900-fig5-figsupp1-data4-v2.xlsx
-
Figure 5—figure supplement 1—source data 5
Dataset for PLCδ-PH-EGFP fluorescence intensity in Sktl KD glands.
- https://cdn.elifesciences.org/articles/50900/elife-50900-fig5-figsupp1-data5-v2.xlsx
-
Figure 5—figure supplement 1—source data 6
Dataset for PLCδ-PH-EGFP fluorescence intensity in glands with double KD of Crb and Sktl.
- https://cdn.elifesciences.org/articles/50900/elife-50900-fig5-figsupp1-data6-v2.xlsx
-
Figure 5—figure supplement 1—source data 7
Dataset for PLCδ-PH-EGFP fluorescence intensity in control glands incubated with vehicle.
- https://cdn.elifesciences.org/articles/50900/elife-50900-fig5-figsupp1-data7-v2.xlsx
-
Figure 5—figure supplement 1—source data 8
Dataset for PLCδ-PH-EGFP fluorescence intensity in Crb KD glands incubated with vehicle.
- https://cdn.elifesciences.org/articles/50900/elife-50900-fig5-figsupp1-data8-v2.xlsx
-
Figure 5—figure supplement 1—source data 9
Dataset for PLCδ-PH-EGFP fluorescence intensity in control glands incubated with VO-OHpic.
- https://cdn.elifesciences.org/articles/50900/elife-50900-fig5-figsupp1-data9-v2.xlsx
-
Figure 5—figure supplement 1—source data 10
Dataset for PLCδ-PH-EGFP fluorescence intensity in Crb KD glands incubated with VO-OHpic.
- https://cdn.elifesciences.org/articles/50900/elife-50900-fig5-figsupp1-data10-v2.xlsx
Figure 5—figure supplement 2
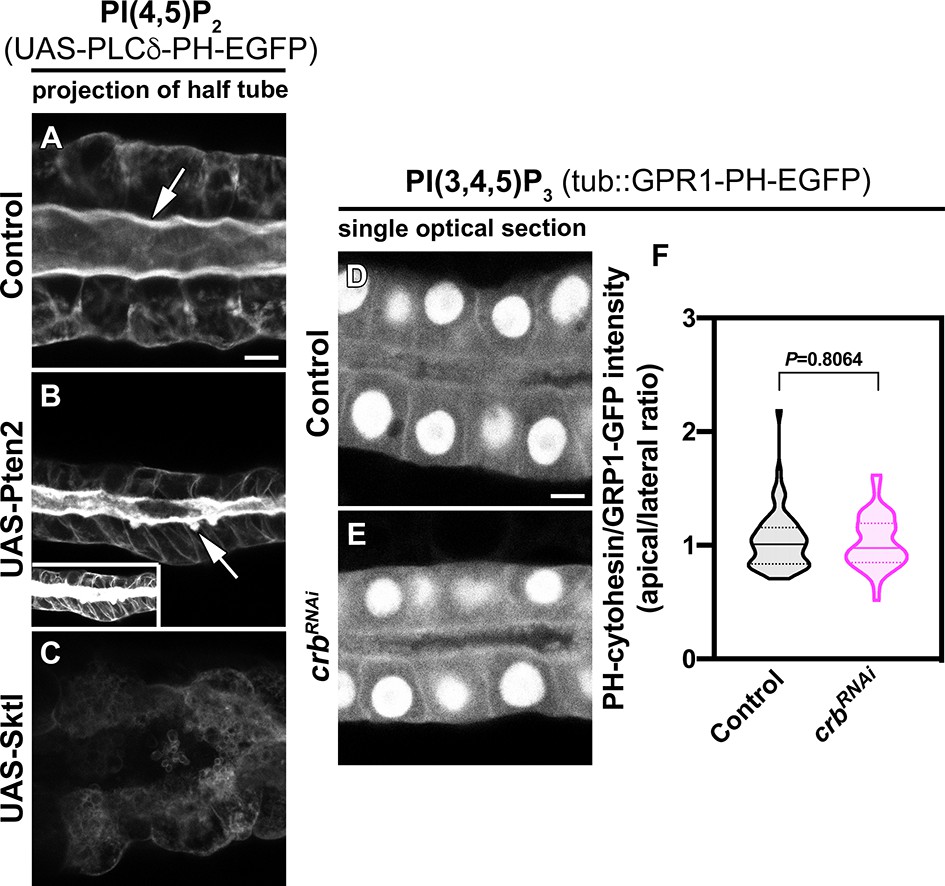
Pten2 over-expression induces formation of PAMS.
(A–C) Localization of PI(4,5)P2 is shown for live SGs of control (A, fkh >UAS-PLCδ-PH-EGFP), Pten2 over-expression (B, fkh >UAS-Pten2; UAS-PLCδ-PH-EGFP), and Sktl over-expression (C, fkh >UAS Sktl; UAS-PLCδ-PH-EGFP). To avoid saturation, the images of SGs over-expressing Pten2 (B) were acquired at a lower laser power with respect to the control (0.2% vs 0.5%). The insert shows the image taken with the same laser power as the control. (D–F) Single optical section showing the localization of PI(3,4,5)P3 (GPR1-PH-EGFP reporter) in live SGs of control (B, tub::GPR1-PH-EGFP, fkh>/+) and Crb KD (C, tub::GPR1-PH-EGFP, fkh >UAS crbRNAi) animals. Violin graph (F) indicates the fluorescence intensity (apical vs lateral ratio) indicating the mean and quartiles (n = 57 cells control and 53 cells Crb KD). Statistical significance was analyzed in an unpaired two-tailed t-test. Arrows point to the apical membrane domain. Scale bars in (A,D) indicate 10 µm.
-
Figure 5—figure supplement 2—source data 1
Dataset for GPR1-PH-EGFP fluorescence intensity.
- https://cdn.elifesciences.org/articles/50900/elife-50900-fig5-figsupp2-data1-v2.xlsx
Figure 6 with 1 supplement

Control of apical secretion and localization of Rab11 and Rab30 by Crb requires Pten.
(A-F) Maximal projection of 6.7µm through the SG lumen showing the localization of SerpCBD-GFP in live SGs of control (A, fkh >UAS SerpCBD-GFP), Crb KD (B, fkh >UAS crbRNAi; UAS-SerpCBD-GFP), Pten KD (C, fkh >UAS ptenRNAi; UAS-SerpCBD-GFP), double KD of Crb and Pten KD (D, fkh >UAS crbRNAi, UAS-ptenRNAi; UAS-SerpCBD-GFP), Pi3K92E KD (E, fkh >UAS-pi3k92ERNAi; UAS-SerpCBD-GFP), and double KD of Crb and Pi3K92E (F, fkh >UAS crbRNAi, UAS-pi3k92ERNAi; UAS-SerpCBD-GFP), respectively. (H-M) Localization of endogenously expressed Rab11-YFP in live SGs. Shown are control (H, Rab11-YFP, fkh>/+), Crb KD (I, Rab11-YFP, fkh >UAS crbRNAi), Pten KD (J, Rab11-YFP, fkh >UAS ptenRNAi), double KD of Crb and Pten (K, Rab11-YFP, fkh >UAS crbRNAi, UAS-ptenRNAi), Pi3K92E KD (L, Rab11-YFP, fkh >UAS-pi3k92ERNAi), and double KD of Crb and Pi3K92E (M, Rab11-YFP, fkh >UAS crbRNAi, UAS-pi3k92ERNAi) animals, respectively. (O-T) Localization of endogenously expressed Rab30-YFP in live SGs. Shown are control (O, Rab30-YFP, fkh>/+), Crb KD (P, Rab30-YFP, fkh >UAS crbRNAi), Pten KD (Q, Rab30-YFP, fkh >UAS ptenRNAi), double KD of Crb and Pten (R, Rab30-YFP, fkh >UAS crbRNAi, UAS-ptenRNAi), Pi3K92E KD (S, Rab30-YFP, fkh >UAS-pi3k92ERNAi), and double KD of Crb and Pi3K92E (T, Rab30-YFP, fkh >UAS crbRNAi, UAS-pi3k92ERNAi) animals, respectively. Arrows point to the apical, and dotted lines to the basal membrane domain. Scale bar in (A) indicates 10 µm and applies to all panels. (G,N,U) Plotted is the fluorescence intensity (arbitrary units) of SerpCBD-GFP (G), Rab11-YFP (N) and Rab30-YFP (U), respectively, along the apical-to-basal axis in live SGs of the indicated genotypes. Error bars indicate the standard error of the mean, n indicates number of glands of the corresponding genotypes. (V) Violin graph of estimated food intake in control (first column), Crb KD (second column), Pten KD (third column), double KD of Crb and Pten (fourth column), Pi3K92E KD (fifth column), and double KD of Crb and Pi3K92E (sixth column) larvae. The dotted line indicates the mean value of the control. 60 larvae of the corresponding genotype were pooled in each biological replica. 10 biological replicas were analyzed distributed in three independent experiments. Statistical significance was tested in a one-way analysis of variance (ANOVA) followed by a Dunnett’s multiple-comparison test. (W) Pupariation efficiency of control (black, fkh>/+), Crb KD (magenta, fkh >UAS crbRNAi), Pten KD (green, fkh >UAS ptenRNAi), double KD of Crb and Pten KD (yellow, fkh >UAS crbRNAi, UAS-ptenRNAi), Pi3K92E KD (blue, fkh >UAS-pi3k92ERNAi), and double KD of Crb and Pi3K92E (, fkh >UAS crbRNAi, UAS-pi3k92ERNAi) animals. Error bars indicate the standard error of the mean, n indicates number of traced individual larvae of the corresponding genotypes in at least 15 independent experiments.
-
Figure 6—source data 1
Dataset for SerpCBD-GFP fluorescence intensity in control glands.
- https://cdn.elifesciences.org/articles/50900/elife-50900-fig6-data1-v2.xlsx
-
Figure 6—source data 2
Dataset for SerpCBD-GFP fluorescence intensity in Crb KD glands.
- https://cdn.elifesciences.org/articles/50900/elife-50900-fig6-data2-v2.xlsx
-
Figure 6—source data 3
Dataset for SerpCBD-GFP fluorescence intensity in Pten KD glands.
- https://cdn.elifesciences.org/articles/50900/elife-50900-fig6-data3-v2.xlsx
-
Figure 6—source data 4
Dataset for SerpCBD-GFP fluorescence intensity in glands with double KD of Crb and Pten.
- https://cdn.elifesciences.org/articles/50900/elife-50900-fig6-data4-v2.xlsx
-
Figure 6—source data 5
Dataset for SerpCBD-GFP fluorescence intensity in Pi3K92E KD glands.
- https://cdn.elifesciences.org/articles/50900/elife-50900-fig6-data5-v2.xlsx
-
Figure 6—source data 6
Dataset for SerpCBD-GFP fluorescence intensity in glands with double KD of Crb and Pi3K92E.
- https://cdn.elifesciences.org/articles/50900/elife-50900-fig6-data6-v2.xlsx
-
Figure 6—source data 7
Dataset for Rab11-YFP fluorescence intensity in control glands.
- https://cdn.elifesciences.org/articles/50900/elife-50900-fig6-data7-v2.xlsx
-
Figure 6—source data 8
Dataset for Rab11-YFP fluorescence intensity in Crb KD glands.
- https://cdn.elifesciences.org/articles/50900/elife-50900-fig6-data8-v2.xlsx
-
Figure 6—source data 9
Dataset for Rab11-YFP fluorescence intensity in Pten KD glands.
- https://cdn.elifesciences.org/articles/50900/elife-50900-fig6-data9-v2.xlsx
-
Figure 6—source data 10
Dataset for Rab11-YFP fluorescence intensity in glands with double KD of Crb and Pten.
- https://cdn.elifesciences.org/articles/50900/elife-50900-fig6-data10-v2.xlsx
-
Figure 6—source data 11
Dataset for Rab11-YFP fluorescence intensity in Pi3K92E KD glands.
- https://cdn.elifesciences.org/articles/50900/elife-50900-fig6-data11-v2.xlsx
-
Figure 6—source data 12
Dataset for Rab11-YFP fluorescence intensity in glands with double KD of Crb and Pi3K92E.
- https://cdn.elifesciences.org/articles/50900/elife-50900-fig6-data12-v2.xlsx
-
Figure 6—source data 13
Dataset for Rab30-YFP fluorescence intensity in control glands.
- https://cdn.elifesciences.org/articles/50900/elife-50900-fig6-data13-v2.xlsx
-
Figure 6—source data 14
Dataset for Rab30-YFP fluorescence intensity in Crb KD glands.
- https://cdn.elifesciences.org/articles/50900/elife-50900-fig6-data14-v2.xlsx
-
Figure 6—source data 15
Dataset for Rab30-YFP fluorescence intensity in Pten KD glands.
- https://cdn.elifesciences.org/articles/50900/elife-50900-fig6-data15-v2.xlsx
-
Figure 6—source data 16
Dataset for Rab30-YFP fluorescence intensity in glands with double KD of Crb and Pten.
- https://cdn.elifesciences.org/articles/50900/elife-50900-fig6-data16-v2.xlsx
-
Figure 6—source data 17
Dataset for Rab30-YFP fluorescence intensity in Pi3K92E KD glands.
- https://cdn.elifesciences.org/articles/50900/elife-50900-fig6-data17-v2.xlsx
-
Figure 6—source data 18
Dataset for Rab30-YFP fluorescence intensity in glands with double KD of Crb and Pi3K92E.
- https://cdn.elifesciences.org/articles/50900/elife-50900-fig6-data18-v2.xlsx
-
Figure 6—source data 19
Dataset for food intake estimations.
- https://cdn.elifesciences.org/articles/50900/elife-50900-fig6-data19-v2.xlsx
-
Figure 6—source data 20
Dataset for tracking of larval development.
- https://cdn.elifesciences.org/articles/50900/elife-50900-fig6-data20-v2.xlsx
Figure 6—figure supplement 1
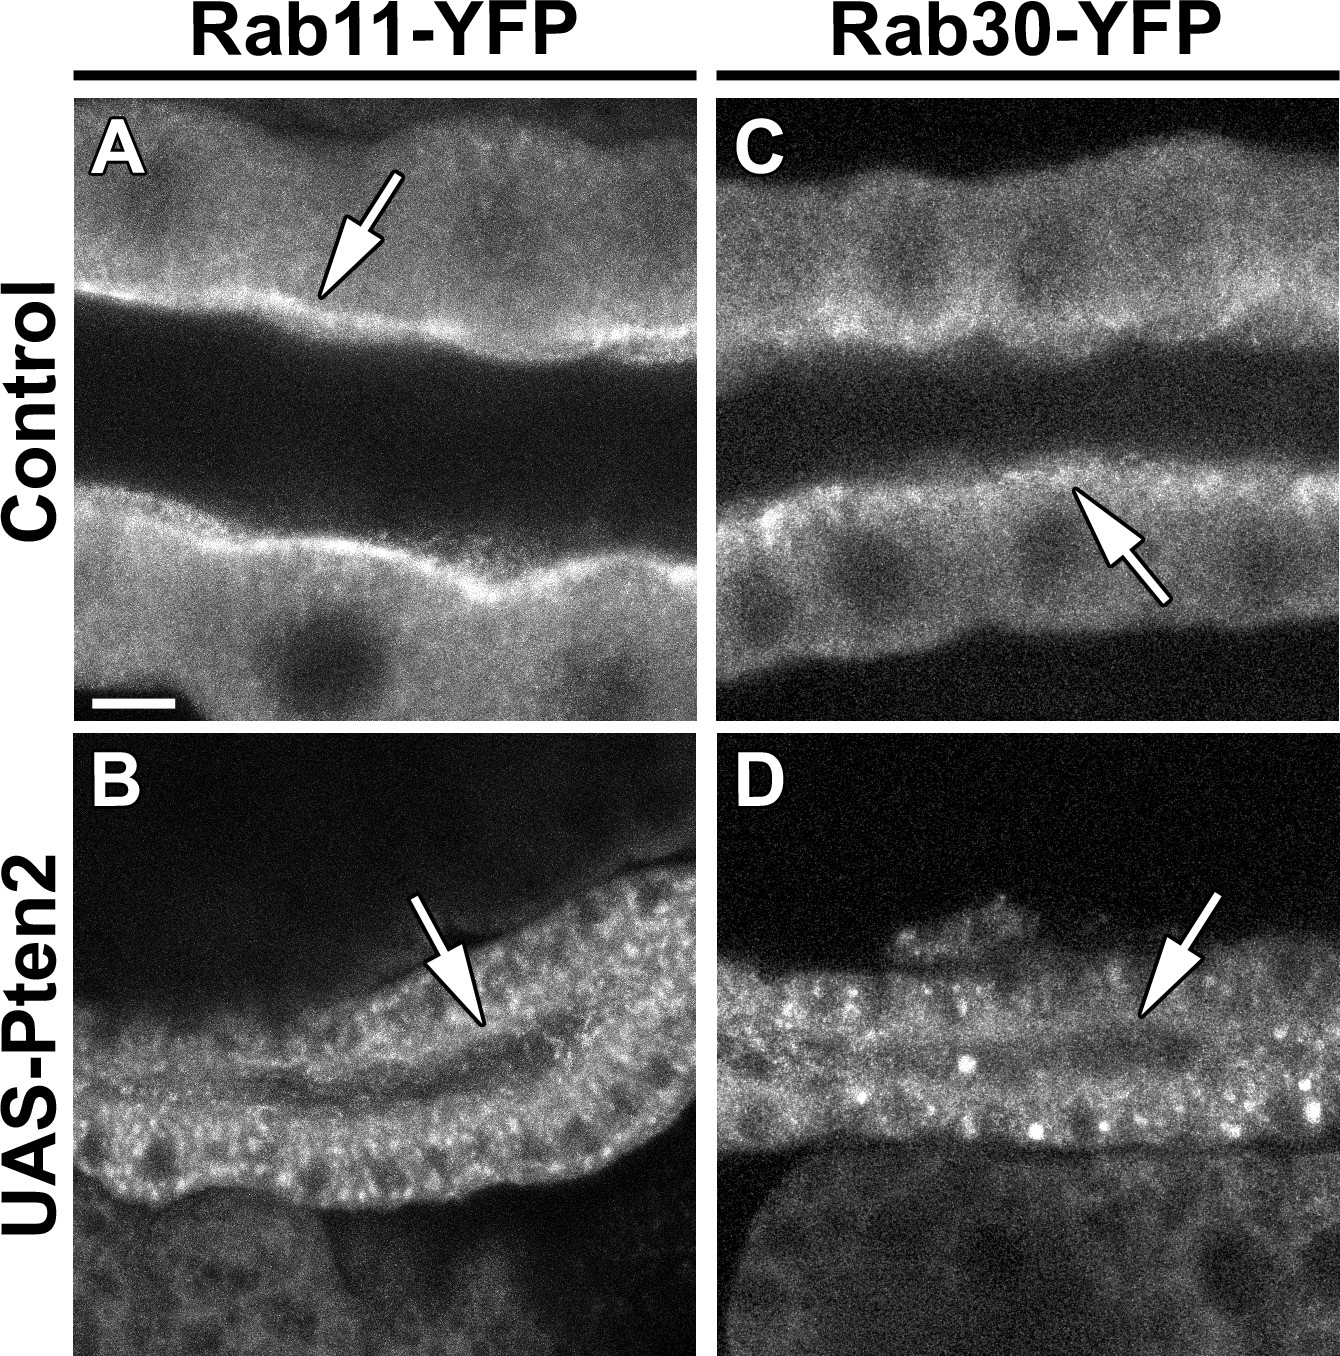
Overexpression of Pten leads to loss of Rab11 and Rab30 from the apical domain.
(A,B) Localization of endogenously expressed Rab11-YFP in live SGs of control (A, Rab11-YFP, fkh>/+) and Pten OE (B, Rab11-YFP, fkh >UAS-Pten2) animals. (C,D) Localization of endogenously expressed Rab30-YFP in live SGs of control (C, Rab30-YFP, fkh>/+) and Pten OE (D, Rab30-YFP, fkh >UAS-Pten2) animals. Arrows point to the apical membrane domain. Scale bar (A) indicates 10 µm and applies to all panels.
Figure 7
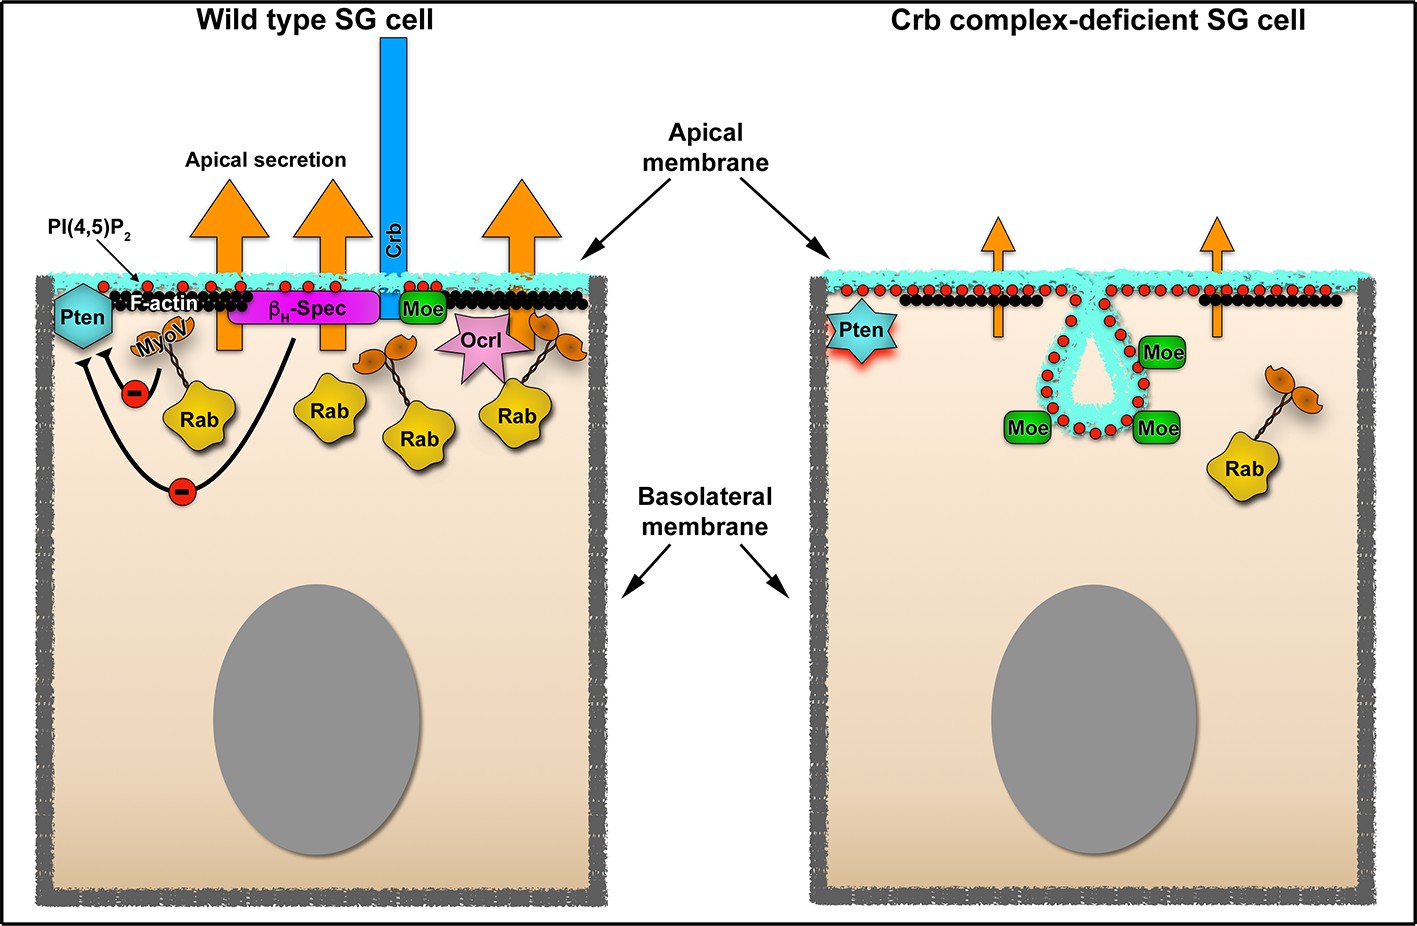
Crb-dependent regulation of apical secretion in SG cells Schematic representation of Crb-dependent regulation of apical secretion in SG cells.
Under physiological conditions (left image), Crb mediates the apical localization of Moesin and βH-Spec, which link the Crb protein (blue) to the apical F-actin cytoskeleton (black ribbon). This Crb-cytocortex complex is necessary for organization of the apical Rab-dependent traffic machinery (depicted as Rab vesicles in yellow). Under these conditions Crb negatively regulates the activity of Pten via βH-Spec and MyoV. The precise molecular interactions involved in the negative regulation of Pten are not defined (see Discussion for details). The absence of Crb in the SG cells disrupts the efficient apical secretion (right image). The defects in apical secretion are a consequence of the disruption of the apical cytocortex (actin, βH-Spec), the loss of MyoV and the excessive production of PI(4,5)P2 (red dots) which require the activity of Pten. The loss of Ocrl form the apical membrane could also contribute to the increase in PI(4,5)P2 apical levels. Another consequence is the formation of a novel apical membrane sac enriched in PI(4,5)P2 (PAMS), Moe (green rectangles) and apical transmembrane proteins (not depicted).
Figure 8
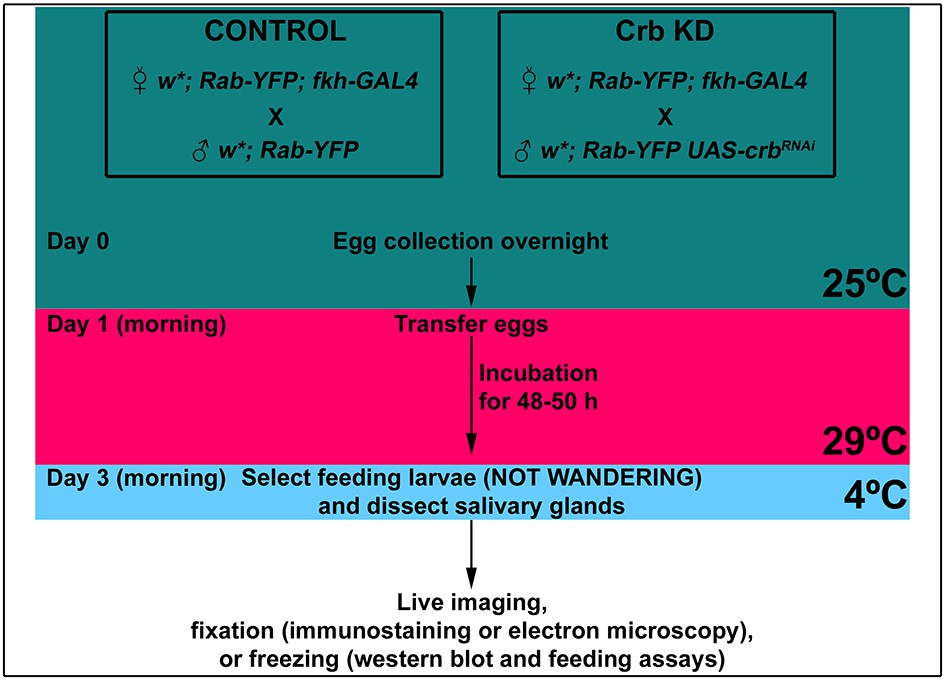
Schematic representation of the experimental setup.
Indicated in the workflow are the times and incubation temperatures, as well as the time for dissections.
Author response image 1
Author response image 2
Author response image 3

Author response image 4
Author response image 5

Author response image 6
Author response image 7
Videos
Video 1
Fusion of a glue vesicle followed by expulsion of the cargo Sgs3-GFP into the lumen SG lumen of control (fkh>+, top) and Crb KD (fkh >UAS crbRNAi, bottom) animals.
Video 2
Overview showing the fusion of glue vesicles followed by expulsion of Sgs3-GFP into the SG lumen of control (fkh>+, top) and Crb KD (fkh >UAS crbRNAi, bottom) animals.
Note that the increase of fluorescence in the vesicle occurs when they open to the lumen.
Video 3
3D rendering of a SG from a Crb KD animal (fkh >UAS crbRNAi) probed for phospho-Moesin.
The extraction focuses on one cell to appreciate the accumulation of phospho-Moesin at the apical membrane. Apical is up.
Video 4
Live imaging of endogenously expressed Rab6-YFP in SGs of control (left, Rab6-YFP, fkh>/+) and Crb KD (right, Rab6-YFP, fkh >UAS crbRNAi).
5 min recording, time lapse 5 s.
Video 5
Live imaging of endogenously expressed Rab11-YFP in SGs of control (left, Rab11-YFP, fkh>/+) and Crb KD (right, Rab11-YFP, fkh >UAS crbRNAi).
5 min recording, time lapse 5 s.
Video 6
Live imaging of endogenously expressed Rab30-YFP in SGs of control (left, Rab30-YFP, fkh>/+) and Crb KD (right, Rab30-YFP, fkh >UAS crbRNAi).
5 min recording, time lapse 5 s.
Video 7
Live imaging of endogenously expressed Rab1-YFP in SGs of control (left, Rab1-YFP, fkh>/+) and Crb KD (right, Rab1-YFP, fkh >UAS crbRNAi).
5 min recording, time lapse 5 s.
Video 8
3D rendering of a fixed SG of a Crb KD animal expressing the PI(4,5)P2 reporter PLCδ-PH-EGFP (green) and stained for phospho-Moesin (magenta).
It is possible to appreciate the phospho-Moe and PI(4,5)P2-enriched apical membrane sac (PAMS) below the apical membrane. Scale bar indicates 5 µm.
Video 9
Live imaging of a SG of a Crb KD animal expressing the PI(4,5)P2 reporter PLCδ-PH-EGFP (fkh >UAS crbRNAi; UAS-PLCδ-PH-EGFP).
A single optical section is shown on the left. On the right, the maximal projection of the stack showing the whole PI(4,5)P2-enriched apical membrane sac (PAMS). The arrowhead appearing at 660 s on the right panel points to an apparent opening of the sac to the lumen. It is worth noting that the PAMS are very stationary, as the movie shows 20 min recording, time lapse 20 s. Apical is up.
Tables
Table 1
List of fly stocks used in this study.
| Designation | Genotype (as reported in FlyBase when available) | Description |
|---|---|---|
| Balancer | w[1118]; In(2LR)Gla, wg[Gla-1]/CyO, P{w[+mC]=GAL4 twi.G}2.2, P{w[+mC]=UAS-2xEGFP}AH2.2 | Balancer for 2nd chromosome; BSC 6662 |
| Balancer | w[1118]; Dr[Mio]/TM3, P{w[+mC]=GAL4 twi.G}2.3, P{UAS-2xEGFP}AH2.3, Sb[1] Ser[1] | Balancer for 3rd chromosome; BSC 6663 |
| Balancer | w[*]; ry[506] Dr[1]/TM6B, P{w[+mC]=Dfd-EYFP}3, Sb[1] Tb[1] ca[1] | Balancer for 3rd chromosome; BSC 8704 |
| crbRNAi | w[1118]; P{GD14463}v39177 | Expresses the RNAi against crb under the control of UAS sequences; VDRC 39177 |
| sdtRNAi | w[1118]; P{GD9163}v23822 | Expresses the RNAi against sdt under the control of UAS sequences; VDRC 23822 |
| sdtRNAi | y[1] sc[*] v[1]; P{y[+t7.7] v[+t1.8]=TRiP.HMS01652}attP40 | Expresses dsRNA for RNAi of sdt (FBgn0261873) under UAS control. BSC 37510 |
| gfpRNAi | y[1] sc[*] v[1]; P{y[+t7.7] v[+t1.8]=VALIUM20 EGFP.shRNA.3}attP40 | Expresses small hairpin RNA under the control of UAS for RNAi of EGFP and EYFP as well as fusion proteins containing these fluors, BSC 41559 |
| gfpRNAi | y[1] sc[*] v[1]; P{y[+t7.7] v[+t1.8]=VALIUM20 EGFP.shRNA.3}attP2 | Expresses small hairpin RNA under the control of UAS for RNAi of EGFP and EYFP as well as fusion proteins containing these fluors, BSC 41560 |
| moeRNAi | w[1118]; P{GD5211}v37917 | Expresses the RNAi against moe under the control of UAS sequences; VDRC 37917 |
| kstRNAi | y[1] v[1]; P{y[+t7.7] v[+t1.8]=TRiP.GLC01654}attP40 | Expresses dsRNA for RNAi of kst (FBgn0004167) under UAS control, BSC 50536 |
| ocrlRNAi | y[1] sc[*] v[1] sev[21]; P{y[+t7.7] v[+t1.8]=TRiP.HMS01201}attP2/TM3, Sb[1] | Expresses dsRNA for RNAi of Ocrl (FBgn0023508) under UAS control in the VALIUM20 vector. BSC 34722 |
| GAL80ts | w[*]; P{w[+mC]=tubP-GAL80[ts]}7 | Expresses temperature-sensitive GAL80 under the control of the alphaTub84B promoter; outcrossed from BSC 7018 |
| Dicer | w[1118]; P{w[+mC]=UAS-Dcr-2.D}2 | Expresses Dicer-2 under UAS control, BSC 24650 |
| myoVRNAi | y[1] sc[*] v[1]; P{y[+t7.7] v[+t1.8]=TRiP.HMC03900}attP40 | Expresses dsRNA for RNAi of didum (FBgn0261397) under UAS control; BSC 55740 |
| ptenRNAi | y[1] w[1118]; P{w[+mC]=UAS Pten.dsRNA.Exel}2 | Expresses a snapback transcript for RNAi of Pten under the control of UAS. BSC 8549 |
| ptenRNAi | w[1118]; P{w[+mC]=UAS Pten.dsRNA.Exel}3 | Expresses a snapback transcript for RNAi of Pten under the control of UAS. BSC 8550 |
| pi3k92ERNAi | y[1] sc[*] v[1]; P{y[+t7.7] v[+t1.8]=TRiP.HMC05152}attP40 | Expresses dsRNA for RNAi of Pi3K92E (FBgn0015279) under UAS control. BSC 61182 |
| pi3k92ERNAi | y[1] sc[*] v[1]; P{y[+t7.7] v[+t1.8]=TRiP .GL00311}attP2 | Expresses dsRNA for RNAi of Pi3K92E (FBgn0015279) under UAS control. BSC 35798 |
| sktlRNAi | y[1] sc[*] v[1]; P{y[+t7.7] v[+t1.8]=TRiP .GL00072}attP2 | Expresses dsRNA for RNAi of sktl (FBgn0016984) under UAS control. BSC 35198 |
| SerpCBD-GFP | w[*];; UAS-SerpCBD-GFP | Expresses the N-terminus of Serp including the signal peptide and chitin binding domain (CBD) fused to GFP (Luschnig et al., 2006), kindly provided by S. Luschning |
| MyosinV-GFP | w[*];; UAS-didum-GFP | Expresses full length didum (amino acids 1–1792) tagged at the C-terminal end with EGFP (Krauss et al., 2009), kindly provided by A. Ephrussi |
| Sas-Venus | w[*];; tub::Sas-Venus | Stranded at Second fused with Venus under tubulin promoter on 3rd chromosome (Firmino et al., 2013) |
| PNA-GFP | w[*]; M{w[+mC]=UAS PNA.GFP}ZH-86Fb | Expresses GFP-tagged peanut agglutinin under UAS control. BSC 55247 |
| CD8-RFP | w[*]; P{y[+t7.7] w[+mC]=10XUAS-IVS-mCD8::RFP}attP2 | Expresses mCD8-tagged RFP under the control of 10 UAS sequences. BSC 32218 |
| PI(4,5)P2 sensor | y[1] w[*]; P{w[+mC]=UAS-PLCdelta-PH-EGFP}3 | Expresses GFP-tagged pleckstrin homology domain from human PLCδ. BSC 39693 |
| PI(3,4,5)P3 sensor | w[*];; tub::GPR1-PH-EGFP | Expresses GFP-tagged pleckstrin homology domain from cytohesin/GRP1 (Pinal et al., 2006), kindly provided by F. Pichaud |
| Pten2-GFP | w[*]; UAS-Pten2-GFP | Expresses Pten2 isoform GFP-tagged under the control of UAS sequences (Pinal et al., 2006), kindly provided by F. Pichaud |
| Pten2 | w[*]; UAS-Pten2 | Expresses the Pten2 isoform under the control of UAS sequences (von Stein et al., 2005), kindly provided by A. Wodarz |
| fkhGAL4 | w[*]; fkh-GAL4 | On 3rd chromosome, expresses GAL4 under the control of the fkh promoter (Henderson and Andrew, 2000), kindly provided by K. Röpper |
| Fas3-GFP | w[*]; P{w[+mC]=PTT-GA}Fas3[G00258] | Fas3 fused with GFP protein trap. BSC 50841 |
| DE-cad-GFP | w*;DE-cad::GFP | DE-cadherin fused with GFP knock-in allele; homozygous viable (Huang et al., 2009), kindly provided by Y. Hong |
| DE-cad-mTomato | w*;DE-cad::mTomato | DE-cadherin fused with mTomato knock-in allele; homozygous viable (Huang et al., 2009), kindly provided by Y. Hong |
| Crb-GFP | w*;;crb::GFP-A | Crumbs fused with GFP knock-in allele; homozygous viable (Huang et al., 2009), kindly provided by Y. Hong |
| Lac-GFP | w*; lac::GFP | Protein trap line: lachesin fused with GFP under endogenous promoter on 2nd chromosome; homozygous viable (kindly provided by the Klämbt Protein trap consortium) |
| Nrv2-GFP | w*; nrv2::GFP | Protein trap line: nervana2 fused with GFP under endogenous promoter on 2nd chromosome; homozygous viable (kindly provided by the Klämbt Protein trap consortium) |
| Ocrl-RFP | TI{T-STEP.TagRFP-T}Ocrl[KI] w[*] | A T-STEP cassette was knocked into Ocrl to tag the endogenous protein with TagRFP-T. BSC 66529 |
| Dlg-mTagRFP | Dlg-mTagRFP | On X chromosome, expresses Dlg-mTagRFP under the control of a ubiquitous promoter (Pinheiro et al., 2017), kindly provided by Y. Bellaïche |
| Rab-YFP | Rab-YFP | endogenously YFP::tagged Rab protein library generated in Dunst et al. (2015) |
| BSC - Bloomington Drosophila stock Center | ||
-
VDRC - Vienna Drosophila Resource Center.
Table 2
List of detailed genotypes analyzed in each figure.
| Figure 1 | |
|---|---|
| B,B' | w*; UAS-crb[RNAi]/+ |
| C,C' | w*; UAS-crb[RNAi]/+; fkh-GAL4/+ |
| D | w*; Rab30-YFP, UAS-crb[RNAi]/+ |
| E | w*; Rab30-YFP, UAS-crb[RNAi]/+; fkh-GAL4/+ |
| F | w*; UAS-crb[RNAi]/+; Rab11-YFP/+ |
| G | w*; UAS-crb[RNAi]/+; Rab11-YFP/fkh-GAL4 |
| I | w*;; fkhGAL4, ubiGAL80[ts] |
| J | w*; UAS-crb[RNAi]; fkhGAL4, ubiGAL80[ts] |
| K | w*;; fkhGAL4, UAS-SerpCBD-GFP-GFP/+ |
| L | w*; UAS-crb[RNAi]/+; fkhGAL4, UAS-SerpCBD-GFP-GFP/+ |
| Figure 1—figure supplement 1 | |
| A,C,E,G,I,K | w*; UAS-crb[RNAi]/+ |
| B,D,F,H,J,L | w*; UAS-crb[RNAi]/+; fkh-GAL4/+ |
| M | w*;; UAS-CD8-RFP/fkhGAL4 |
| N | w*; UAS-crb[RNAi]/+; UAS-CD8-RFP/fkhGAL4 |
| O | w*;; UAS-PNA-GFP/fkhGAL4 ubiGAL80[ts] |
| P | w*;; UAS-crb[RNAi]/+; UAS-PNA-GFP/fkhGAL4 ubiGAL80[ts] |
| Q: Control | w*; UAS-crb[RNAi]/+; Rab11-YFP/+ |
| Q: Crb KD | w*; UAS-crb[RNAi]/+; Rab11-YFP/fkh-GAL4 |
| S,U,U’,W,Y | w*;; UAS-std[RNAi]/+ |
| T,V,V’,X,Z | w*; UAS-sdt[RNAi]/fkh-GAL4 |
| AA | w*;; Rab11-YFP, UAS-sdt[RNAi]/Rab11-YFP |
| BB | w*;; Rab11-YFP, UAS-sdtRNAi/Rab11-YFP, fkhGAL4 |
| CC | w*;; fkhGAL4, ubiGAL80[ts]/+ |
| DD | w*; UAS-sdt[RNAi]; fkhGAL4, ubiGAL80[ts]/+ |
| EE | w*;; fkhGAL4, UAS-CD8-RFP/+ |
| FF | w*;; fkhGAL4, UAS-CD8-RFP/UAS-sdt[RNAi] |
| GG | w*;; fkhGAL4, UAS-SerpCBD-GFP/+ |
| HH | w*;; fkhGAL4, UAS-SerpCBD-GFP/UAS-sdt[RNAi] |
| II | w*;; fkhGAL4, UAS-PNA-GFP/+ |
| JJ | w*;; fkhGAL4, UAS-PNA-GFP/UAS-sdt[RNAi] |
| Figure 1—figure supplement 2 | |
| A,A',B | w*; UAS-crb[RNAi]/+; Rab11-YFP/+ |
| C,C’,D' | w*; UAS-crb[RNAi]/+; Rab11-YFP/fkh-GAL4 |
| E,G,I | w*; UAS-crb[RNAi]/+ |
| F,H,J | w*; UAS-crb[RNAi]/+; fkh-GAL4/+ |
| K,K' | w*; Fas3-GFP/Fas3-GFP; fkhGAL4/+ |
| L,L' | w*; Fas3-GFP/Fas3-GFP, UAS-crb[RNAi]; fkhGAL4/+ |
| M,M' | w*; Fas3-GFP/Fas3-GFP; fkhGAL4/UAS-gfp[RNAi] |
| Figure 2 | |
| A,D | w*; UAS-crb[RNAi]/+ |
| B,E | w*; UAS-crb[RNAi]/+; fkh-GAL4/+ |
| G | w*; UAS-gfp[RNAi]/+; crb-GFP-A/crb-GFP-A |
| H | w*; UAS-gfp[RNAi]/+; crb-GFP-A/crb-GFP-A, fkh-GAL4 |
| I | w*;; fkhGAL4, ubiGAL80[ts]/tub::Sas-Venus |
| J | w*; UAS-crb[RNAi]; fkhGAL4, ubiGAL80[ts]/tub::Sas-Venus |
| K,K' | w*;; fkhGAL4, UAS-PLCdelta-PH-EGFP/+ |
| L,L' | w*; UAS-crb[RNAi]/+; fkhGAL4, UAS-PLCdelta-PH-EGFP/+ |
| Figure 2—figure supplement 1 | |
| A,C,E | w*; UAS-gfp[RNAi]/+; crb-GFP-A/crb-GFP-A |
| B,D,F | w*; UAS-gfp[RNAi]/+; crb-GFP-A/crb-GFP-A, fkh-GAL4 |
| G,I | w*; UAS-crb[RNAi]/+ |
| H,J | w*; UAS-crb[RNAi]/+; fkh-GAL4/+ |
| Figure 2—figure supplement 2 | |
| A-C' | w*; UAS-crb[RNAi]/+; fkhGAL4, UAS-PLCdelta-PH-EGFP/+ |
| Figure 2—figure supplement 3 | |
| A | w*; UAS-crb[RNAi]/+ |
| B | w*; UAS-crb[RNAi]/+; fkh-GAL4/+ |
| C | w*; UAS-sdt[RNAi]/+ |
| D | w*; UAS-sdt[RNAi]/+; fkh-GAL4/+ |
| Figure 2—figure supplement 4 | |
| A,C,E | w*;; fkhGAL4, ubiGAL80[ts] |
| B,D,F | w*; UAS-kst[RNAi]; fkhGAL4, ubiGAL80[ts] |
| Figure 3 | |
| A | w*;; fkhGAL4, ubiGAL80[ts] |
| B | w*; UAS-crb[RNAi]; fkhGAL4, ubiGAL80[ts] |
| C | w*; UAS-kst[RNAi]; fkhGAL4, ubiGAL80[ts] |
| E,G | w*;; fkhGAL4, ubiGAL80[ts]/+ |
| F,H | w*; UAS-didum[RNAi]/+; fkhGAL4, ubiGAL80[ts]/+ |
| I | w*;; fkhGAL4, ubiGAL80[ts]/tub::Sas-Venus |
| J | w*; UAS-didum[RNAi]/+; fkhGAL4, ubiGAL80[ts]/tub::Sas-Venus |
| K | w*;; fkhGAL4, UAS-SerpCBD-GFP/+ |
| L | w*; UAS-didum[RNAi]/+; fkhGAL4, UAS-SerpCBD-GFP/+ |
| Figure 3—figure supplement 1 | |
| A | w*;; fkhGAL4, ubiGAL80[ts]/UAS-MyoV-GFP |
| B | w*; UAS-crb[RNAi]/+; fkhGAL4, ubiGAL80[ts]/UAS-MyoV-GFP |
| Figure 3—figure supplement 2 | |
| A | w*;; fkhGAL4, ubiGAL80[ts]/UAS-SerpCBD-GFP |
| B | w*; UAS-kst[RNAi]; fkhGAL4, ubiGAL80[ts]/UAS-SerpCBD-GFP |
| Figure 4 | |
| A | w*; Rab6-YFP, UAS-crb[RNAi]/+ |
| B | w*; Rab6-YFP, UAS-crb[RNAi]/+; fkh-GAL4/+ |
| C | w*;; Rab11-YFP, fkhGAL4, ubiGAL80[ts]/Rab11-YFP |
| D | w*; UAS-crb[RNAi]/+; Rab11-YFP, fkhGAL4, ubiGAL80[ts]/Rab11-YFP |
| E | w*; Rab30-YFP/Rab30-YFP; fkhGAL4, ubiGAL80[ts]/+ |
| F | w*; UAS-crb[RNAi], Rab30-YFP/Rab30-YFP; fkhGAL4, ubiGAL80[ts]/+ |
| G | w*; UAS-crb[RNAi]/+; Rab1-YFP/+ |
| H | w*; UAS-crb[RNAi]/+; Rab1-YFP/fkh-GAL4 |
| I: Rab1 Control | w*; UAS-crb[RNAi]/+; Rab1-YFP/+ |
| I: Rab1 Crb KD | w*; UAS-crb[RNAi]/+; Rab1-YFP/fkh-GAL4 |
| I: Rab6 Control | w*; Rab6-YFP, UAS-crb[RNAi]/+ |
| I: Rab6 Crb KD | w*; Rab6-YFP, UAS-crb[RNAi]/+; fkh-GAL4/+ |
| I: Rab11 Control | w*; UAS-crb[RNAi]/+; Rab11-YFP/+ |
| I: Rab11 Crb KD | w*; UAS-crb[RNAi]/+; Rab11-YFP/fkh-GAL4 |
| I: Rab30 Control | w*; UAS-crb[RNAi], Rab30-YFP/+; |
| I: Rab30 Crb KD | w*; UAS-crb[RNAi], Rab30-YFP/+; fkhGAL4/+ |
| Figure 4—figure supplement 1 | |
| Rab1 Control | w*;; Rab1-YFP/fkhGAL4 |
| Rab1 Crb KD | w*;UAS-crb[RNAi]/+; Rab1-YFP/fkhGAL4 |
| Rab2 Control | w*; Rab2-YFP/+; fkhGAL4/+ |
| Rab2 Crb KD | w*; Rab2-YFP, UAS-crb[RNAi]/+; fkhGAL4/+ |
| Rab4 Control | w*; Rab4-YFP/+; fkhGAL4/+ |
| Rab4 Crb KD | w*; Rab4-YFP, UAS-crb[RNAi]/+; fkhGAL4/+ |
| Rab5 Control | w*; Rab5-YFP/+; fkhGAL4/+ |
| Rab5 Crb KD | w*; Rab5-YFP, UAS-crb[RNAi]/+; fkhGAL4/+ |
| Rab6 Control | w*; Rab6-YFP/+; fkhGAL4/+ |
| Rab6 Crb KD | w*; Rab6-YFP, UAS-crb[RNAi]/+; fkhGAL4/+ |
| Rab7 Control | w*;; Rab7-YFP/fkhGAL4 |
| Rab7 Crb KD | w*;UAS-crb[RNAi]/+; Rab7-YFP/fkhGAL4 |
| Rab8 Control | w*;; Rab8-YFP/fkhGAL4 |
| Rab8 Crb KD | w*;UAS-crb[RNAi]/+; Rab8-YFP/fkhGAL4 |
| Rab10 Control | w* Rab10-YFP/+;; fkhGAL4/+ |
| Rab10 Crb KD | w* Rab10-YFP/+; UAS-crb[RNAi]/+; fkhGAL4/+ |
| Rab11 Control | w*;; Rab11-YFP/fkhGAL4 |
| Rab11 Crb KD | w*;UAS-crb[RNAi]/+; Rab11-YFP/fkhGAL4 |
| Rab18 Control | w* Rab18-YFP/+;; fkhGAL4/+ |
| Rab18 Crb KD | w* Rab18-YFP/+; UAS-crb[RNAi]/+; fkhGAL4/+ |
| Rab21 Control | w* Rab21-YFP/+;; fkhGAL4/+ |
| Rab21 Crb KD | w* Rab21-YFP/+; UAS-crb[RNAi]/+; fkhGAL4/+ |
| Rab35 Control | w* Rab35-YFP/+;; fkhGAL4/+ |
| Rab35 Crb KD | w* Rab35-YFP/+; UAS-crb[RNAi]/+; fkhGAL4/+ |
| Rab39 Control | w* Rab39-YFP/+;; fkhGAL4/+ |
| Rab39 Crb KD | w* Rab39-YFP/+; UAS-crb[RNAi]/+; fkhGAL4/+ |
| Rab40 Control | w* Rab40-YFP/+;; fkhGAL4/+ |
| Rab40 Crb KD | w* Rab40-YFP/+; UAS-crb[RNAi]/+; fkhGAL4/+ |
| Figure 4—figure supplement 2 | |
| A | w*; Rab6-YFP/Rab6-YFP; fhkGAL4/+ |
| B | w*; Rab6-YFP, UAS-kst[RNAi]/Rab6-YFP; fhkGAL4/+ |
| C | w*;; Rab11-YFP, fkhGAL4, ubiGAL80[ts]/Rab11-YFP |
| D | w*; UAS-kst[RNAi]/+; Rab11-YFP, fkhGAL4, ubiGAL80[ts]/Rab11-YFP |
| E | w*; Rab30-YFP/Rab30-YFP; fhkGAL4/+ |
| F | w*; Rab30-YFP, UAS-kst[RNAi]/Rab30-YFP; fhkGAL4/+ |
| G | w*;; Rab1-YFP/fkhGAL4, ubiGAL80[ts] |
| H | w*; UAS-kst[RNAi]/+; Rab1-YFP/fkhGAL4, ubiGAL80[ts] |
| Figure 4—figure supplement 3 | |
| A-A’’ | w*; Rab6-YFP/Rab6-YFP; fhkGAL4, UAS-CD8-RFP/+ |
| B-B’’ | w*; Rab6-YFP/Rab6-YFP, UAS-gfp[RNAi]; fhkGAL4, UAS-CD8-RFP/+ |
| C-C’’ | w*;; Rab11-YFP, fkhGAL4, UAS-CD8-RFP/Rab11-YFP |
| D-D’’ | w*; UAS-gfp[RNAi]/+; Rab11-YFP, fkhGAL4, UAS-CD8-RFP/Rab11-YFP |
| Figure 5 | |
| B | w*;; fkhGAL4, UAS-PLCdelta-PH-EGFP/+ |
| C | w*; UAS-crb[RNAi]/+; fkhGAL4, UAS-PLCdelta-PH-EGFP/+ |
| D | w*;; fkhGAL4, UAS-PLCdelta-PH-EGFP/UAS-pten[RNAi] |
| E | w*; UAS-crb[RNAi]/+; fkhGAL4, UAS-PLCdelta-PH-EGFP/UAS-pten[RNAi] |
| F | w*;; fkhGAL4, UAS-PLCdelta-PH-EGFP/UAS-pi3k92E[RNAi] |
| G | w*; UAS-crb[RNAi]/+; fkhGAL4, UAS-PLCdelta-PH-EGFP/UAS-pi3k92E[RNAi] |
| I | w*;; UAS-pten2-GFP/fkh-GAL4, ubiGAL80[ts] |
| J | w*; UAS-crb[RNAi]/+; UAS-pten2-GFP/fkh-GAL4, ubiGAL80[ts] |
| L | Ocrl-RFP, w*/+;; fkh-GAL4, ubiGAL80[ts]/+ |
| M | Ocrl-RFP, w*; UAS-crb[RNAi]/+; fkh-GAL4, ubiGAL80[ts]/+ |
| O | w*;; fkhGAL4, UAS-PLCdelta-PH-EGFP/+ |
| P | w*;; fkhGAL4, UAS-PLCdelta-PH-EGFP/UAS-ocrl[RNAi] |
| Figure 5—figure supplement 1 | |
| A | w*; DE-cad-mTomato/+; UAS-PLCdelta-PH-EGFP/fkhGAL4, ubiGAL80[ts] |
| B | w*;; fkhGAL4, UAS-PLCdelta-PH-EGFP/UAS-sdt[RNAi] |
| C | w*; UAS-kst[RNAi]/DE-cad-mTomato; fkhGAL4, ubiGAL80[ts]/UAS-PLCdelta-PH-EGFP |
| D | w*; UAS-didum[RNAi]/+; fkhGAL4 UAS-PLCdelta-PH-EGFP/+ |
| F | w*;; UAS-PLCdelta-PH-EGFP/fkh-GAL4, ubiGAL80[ts] |
| G | w*; UAS-crb[RNAi]/+; UAS-PLCdelta-PH-EGFP/fkh-GAL4, ubiGAL80[ts] |
| I | w*;; fkhGAL4, UAS-PLCdelta-PH-EGFP/+ |
| J | w*; UAS-crb[RNAi]/+; fkhGAL4, UAS-PLCdelta-PH-EGFP/+ |
| K | w*;; fkhGAL4, UAS-PLCdelta-PH-EGFP/UAS-sktl[RNAi] |
| L | w*; UAS-crb[RNAi]/+; fkhGAL4, UAS-PLCdelta-PH-EGFP/UAS-sktl[RNAi] |
| N,P | w*;; fkhGAL4, ubiGAL80[ts]/UAS-PLCdelta-PH-EGFP |
| O,Q | w*; UAS-crb[RNAi]/+; fkhGAL4, ubiGAL80[ts]/UAS-PLCdelta-PH-EGFP |
| Figure 5—figure supplement 2 | |
| A | w*;; fkhGAL4, UAS-PLCdelta-PH-EGFP/+ |
| B | w*;; fkhGAL4, UAS-PLCdelta-PH-EGFP/UAS-pten2 |
| C | UAS-Sktl w*/+;; fkhGAL4, UAS-PLCdelta-PH-EGFP/+ |
| D | w*;; fkhGAL4, ubiGAL80[ts]/tub::GPR1-PH-EGFP |
| E | w*; UAS-crb[RNAi]/+; fkhGAL4, ubiGAL80[ts]/tub::GPR1-PH-EGFP |
| Figure 6 | |
| A | w*;; fkhGAL4, UAS-SerpCBD-GFP/+ |
| B | w*; UAS-crb[RNAi]/+; fkhGAL4, UAS-SerpCBD-GFP/+ |
| C | w*;; fkhGAL4, UAS-SerpCBD-GFP/UAS-pten[RNAi] |
| D | w*; UAS-crb[RNAi]/+; fkhGAL4, UAS-SerpCBD-GFP/UAS-pten[RNAi] |
| E | w*;; fkhGAL4, UAS-SerpCBD-GFP/UAS-pi3k92E[RNAi] |
| F | w*; UAS-crb[RNAi]/+; fkhGAL4, UAS-SerpCBD-GFP/UAS-pi3k92E[RNAi] |
| H | w*;; Rab11-YFP, fkhGAL4, ubiGAL80[ts]/Rab11-YFP |
| I | w*; UAS-crb[RNAi]/+; Rab11-YFP, fkhGAL4, ubiGAL80[ts]/Rab11-YFP |
| J | w*; UAS-pten[RNAi]/+; Rab11-YFP, fkhGAL4, ubiGAL80[ts]/Rab11-YFP |
| K | w*; UAS-crb[RNAi]/UAS-pten[RNAi]; Rab11-YFP, fkhGAL4, ubiGAL80[ts]/Rab11-YFP |
| L | w*; UAS-pi3k92E[RNAi]/+; Rab11-YFP, fkhGAL4, ubiGAL80[ts]/Rab11-YFP |
| M | w*; UAS-crb[RNAi]/UAS-pi3k92E[RNAi]; Rab11-YFP, fkhGAL4, ubiGAL80[ts]/Rab11-YFP |
| O | w*; Rab30-YFP/Rab30-YFP; fkhGAL4, ubiGAL80[ts]/+ |
| P | w*; UAS-crb[RNAi], Rab30-YFP/Rab30-YFP; fkhGAL4, ubiGAL80[ts]/+ |
| Q | w*; Rab30-YFP/Rab30-YFP; fkhGAL4, ubiGAL80[ts]/UAS-pten[RNAi] |
| R | w*; UAS-crb[RNAi], Rab30-YFP/Rab30-YFP; fkhGAL4, ubiGAL80[ts]/UAS-pten[RNAi] |
| S | w*; Rab30-YFP/Rab30-YFP; fkhGAL4, ubiGAL80[ts]/UAS-pi3k92E[RNAi] |
| T | w*; UAS-crb[RNAi], Rab30-YFP/Rab30-YFP; fkhGAL4, ubiGAL80[ts]/UAS-pi3k92E[RNAi] |
| Figure 6—figure supplement 1 | |
| A | w*;; Rab11-YFP, fkhGAL4, ubiGAL80[ts]/Rab11-YFP |
| B | w*;; Rab11-YFP, fkhGAL4, ubiGAL80[ts]/Rab11-YFP, UAS-pten2 |
| C | w*; Rab30-YFP/Rab30-YFP; fkhGAL4, ubiGAL80[ts]/+ |
| D | w*; Rab30-YFP/Rab30-YFP; fkhGAL4, ubiGAL80[ts]/UAS-pten2 |
Table 3
List of antibodies and probes employed.
| Dilution | Fixation | Source | |
|---|---|---|---|
| DAPI | 1:200000 | FA | Invitrogen Cat. D1306 |
| Phalloidin Alexa Flour 488, 555 | 1:2000 | FA | Invitrogen Cat. A12379, A34055 |
| Alexa Flour 488-, 568- and 647 -conjugated | 1:1000 - 1:2000 | Invitrogen | |
| Mouse antibodies | |||
| Anti-α-Spectrin | 1:100 | MeOH | DSHB 3A9 |
| Anti-Coracle | 1:200 | MeOH | DSHB C566.9 |
| Anti-Disc large | 1:500 | MeOH | DSHB 4F3 |
| Anti-FasIII | 1:4 | MeOH | DSHB 7G10 |
| Anti-αTubulin | 1:2000 | MeOH/Acetone | MPI-CBG Antibody facility, P. Keller |
| Rabbit antibodies | |||
| Anti-aPKC (C-20) | 1:500 | MeOH | Santa Cruz Biotechnology Cat. sc-216-G |
| Anti-Bazooka | 1:200 | MeOH | kindly provided by A. Wodarz (Wodarz et al., 1999) |
| Anti-Stardust | 1:2000 | MeOH | (Berger et al., 2007) |
| Anti-Cadherin99C | 1:250 | FA | kindly provided by D. Godt (Glowinski et al., 2014) |
| Anti-GFP | 1:1000 | FA | Invitrogen A-11122 |
| Anti-Sinuous | 1:8000 | MeOH | kindly provided by G.J. Beitel (Wu et al., 2004) |
| Anti-βHSpectrin | 1:5000 | MeOH | kindly provided by G. Thomas (Thomas and Williams, 1999) |
| Anti-KuneKune | 1:5000 | MeOH | kindly provided by M. Furuse (Nelson et al., 2010) |
| Anti-Phospho-Ezrin (Moesin) | 1:500 | FA | Cell Signaling Technology Cat. 3141 |
| Anti-Moesin (Q480) | 1:400 | FA | Cell Signaling Technology Cat. 3150 |
| Anti-MyosinV | 1:2000 | MeOH | (Pocha et al., 2011a) |
| Anti-DPatj | 1:1000 | FA | (Richard et al., 2006a) |
| Rat antibodies | |||
| Anti-Yurt | 1:500 | MeOH | kindly provided by U. Tepass (Laprise et al., 2006) |
| Anti-Stardust | 1:2000 | FA | (Berger et al., 2007) |
| Chicken antibodies | |||
| Anti-GFP | 1:100 | FA | Abcam Cat. Ab13970 |
| Guinea pig antibodies | |||
| Anti-Crumbs 2.8 | 1:500 | MeOH | (Richard et al., 2006a) |
| Anti-Par6 | 1:500 | FA | kindly provided by A. Wodarz (Shahab et al., 2015) |
| DSHB - Developmental Studies Hybridoma Bank (Iowa city, Iowa, USA) | |||
| Invitrogen, Molecular Probes (Eugene, Oregon, USA) | |||
| Santa Cruz Biotechnology, Inc (Dallas, Texas, USA) | |||
| Cell Signaling Technology (Danvers, Massachusetts, USA) | |||
| Abcam plc (Cambridge, United Kingdom) | |||
Additional files
Download links
A two-part list of links to download the article, or parts of the article, in various formats.
Downloads (link to download the article as PDF)
Open citations (links to open the citations from this article in various online reference manager services)
Cite this article (links to download the citations from this article in formats compatible with various reference manager tools)
Crumbs organizes the transport machinery by regulating apical levels of PI(4,5)P2 in Drosophila
eLife 8:e50900.
https://doi.org/10.7554/eLife.50900


