Profilin and formin constitute a pacemaker system for robust actin filament growth
- Max Planck Institute of Molecular Physiology, Germany
- Institut Curie UMR144 CNRS, France
- TU Dortmund University, Germany
Figures
Figure 1 with 2 supplements
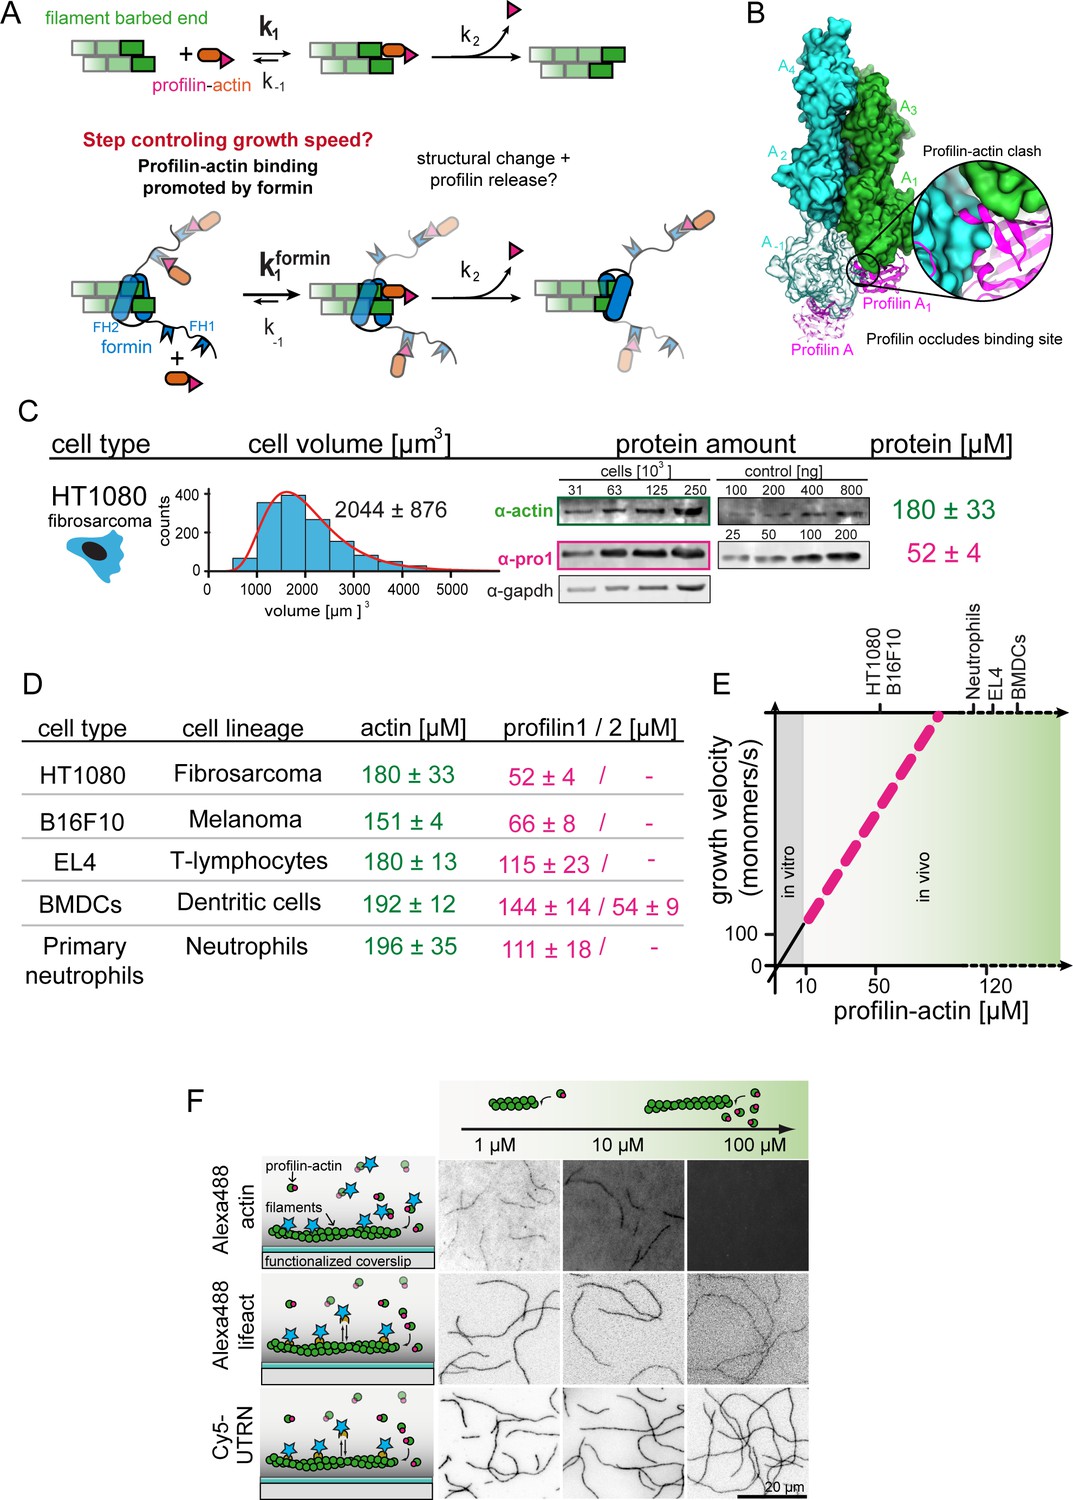
Filament assembly at physiological profilin-actin concentrations.
(A) Scheme of barbed end elongation from profilin-actin alone (top) or with formins (bottom). (B) Structural model of profilin at filament barbed ends (Materials and methods). The incoming profilin-actin complex is transparent. Actin is shown as green surface while profilin as magenta ribbons. Inset highlights the clash between the incoming actin monomer and profilin. (C) Profilin-actin measurements in HT1080 cells. Left to right: single cell volume histogram, western blots of actin, profilin1 (left: cell titration, right: standard curve of recombinant proteins), values are mean (N = 3) and SD, Materials and methods. (D) Table of total concentrations of actin and profilin-1/2 in various mammalian cell types (Figure 1—figure supplement 1). (E) Scheme of a linearly substrate-dependent actin elongation rate. Top axis: Profilin-actin amounts for various cell types as indicated. (F) Scheme (left) and TIRFM images (right) of elongating filaments at indicated profilin-actin concentrations visualized with top- Alexa488-labeled monomers (20% labeled), middle - 10 nM Alexa488-lifeact, bottom – 10 nM Cy5-UTRN261.
-
Figure 1—source data 1
Data Figure 1.
- https://doi.org/10.7554/eLife.50963.005
Figure 1—figure supplement 1
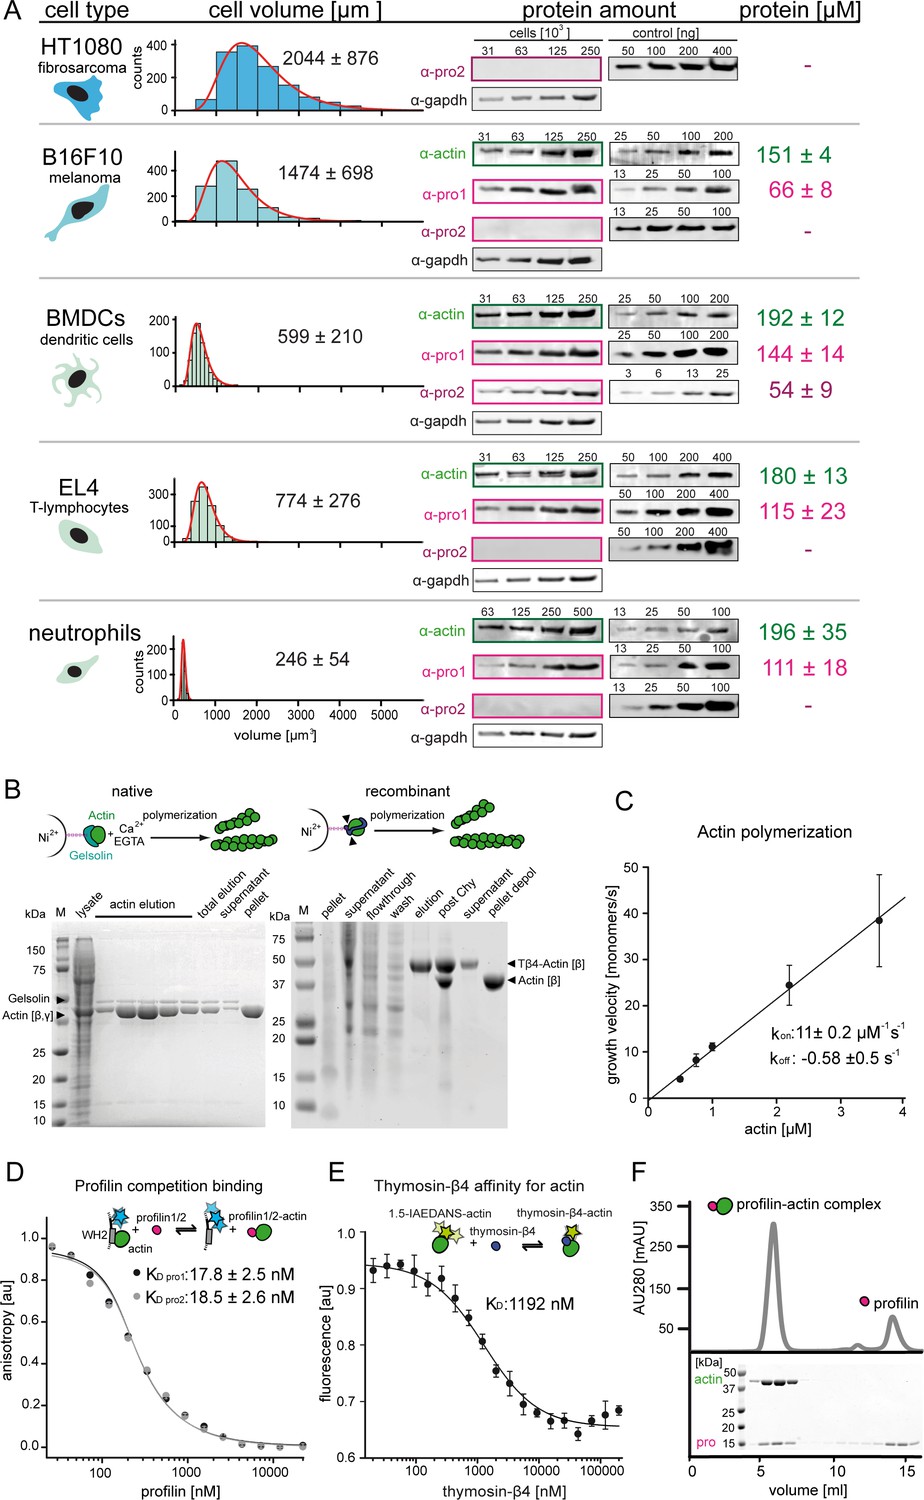
Quantification of profilin-actin levels and purification of mammalian profilin-actin.
(A) Profilin-actin concentration determination in mammalian cells. Left to right: name of cell type and origin, histograms of the single cell volume from fluorescence eXclusion measurements, quantitative western blot analysis of cellular actin, profilin1 and profilin-2 amount (left: titration of cell number, right: standard curve of recombinant proteins), calculated mean protein concentration [μM] per cell with experimental error (SD, N = 3 independent experiments, see Materials and methods). (B) Purification of mammalian cytoplasmic actin from two sources. Top: Schematic workflow of cytoplasmic actin purification. Left: native purification of β,γ–actin by gelsolin affinity chromatography. Right: Isolation of β–actin from recombinant expression of β–actin–linker-thymosin β4−10xhis and purification via IMAC followed by chymotrypsin cleavage (▲). For both strategies, finally released monomers were polymerized and separated from contaminants. Both purification protocols result in very pure and high yields of protein (see last pellet fraction). (C) Barbed end polymerization rate of cytoplasmic native mammalian (β,γ)–actin as a function of the actin monomer concentration. The mean values ± SD were fitted with a linear function. (D) Binding of profilin1 and 2 to ATP-bound cytoplasmic actin monomers measured by fluorescence anisotropy competition assays. Fluorescence anisotropy of Atto488-WAVE1WCA [4 nM] as a function of increasing profilin1 and 2 concentration in the presence of a constant amount of ATP-bound actin monomers [150 nM]. Lines fit to an exact analytical competition model (Wang, 1995). Each data point represents the mean value from three independent experiments. Error indicators are SD. (E) Binding of thymosin-β4 to ATP-bound cytoplasmic actin measured by fluorescence change assays. Fluorescence measurement of 1.5-IAEDANS labeled actin monomers [150 nM] as a function of increasing thymosin-β4 concentration in the presence of a constant amount of actin monomers [150 nM]. Lines fit to an quadratic binding model (see Materials and methods). Each data point represents the mean value from three independent experiments. Error indicators are SD. (F) Isolation of stoichiometric profilin-actin complexes from free profilin by size exclusion chromatography.
Figure 1—figure supplement 2
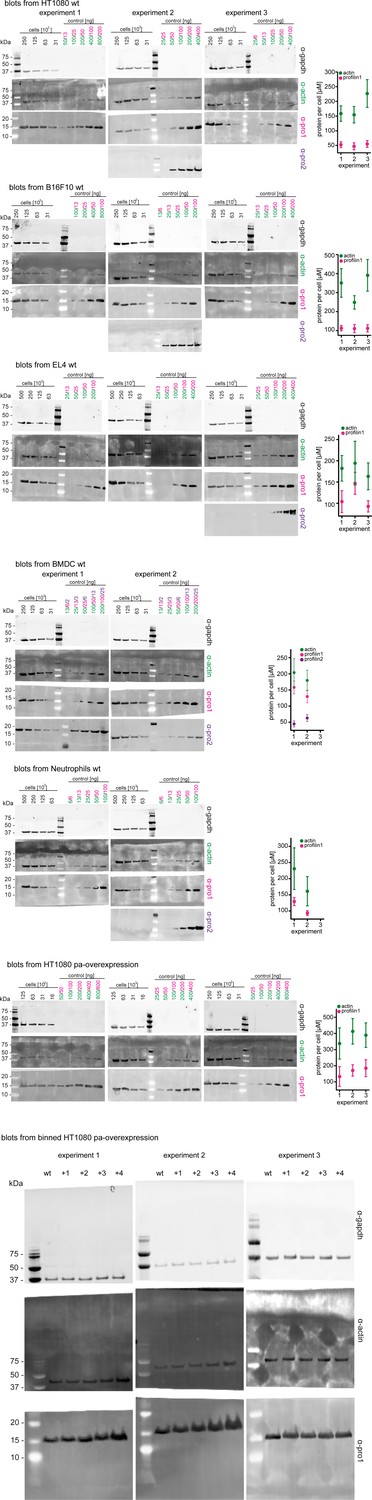
Western blots and graphical summary of profilin-actin levels per cell.
Determination of protein-levels in different cell types by quantitative western blot analysis. For each cell type (HT1080, B16F10, BMDC, neutrophils, HT1080/B16F10 overexpressing profilin1 and β-actin) the amount of total profilin1/2 and actin was detected by monoclonal antibodies and calculated with in vitro protein controls in multiple experiments (see Materials and methods). The amount of profilin2 control is equal to the amount of profilin1 unless otherwise indicated. Right: Calculated profilin1/2 and actin concentrations per cell for individual experiments, errors indicate the SD. Last: Western blots from wt HT1080 cells and HT1080 overexpressing profilin1 and β-actin from a polyclonal integrated construct (+one to +4) after sorting them by their mScarletI fluorescence intensity (see also Figure 6—figure supplement 2B). For each sample, 250.000 cells were applied.
Figure 2 with 1 supplement
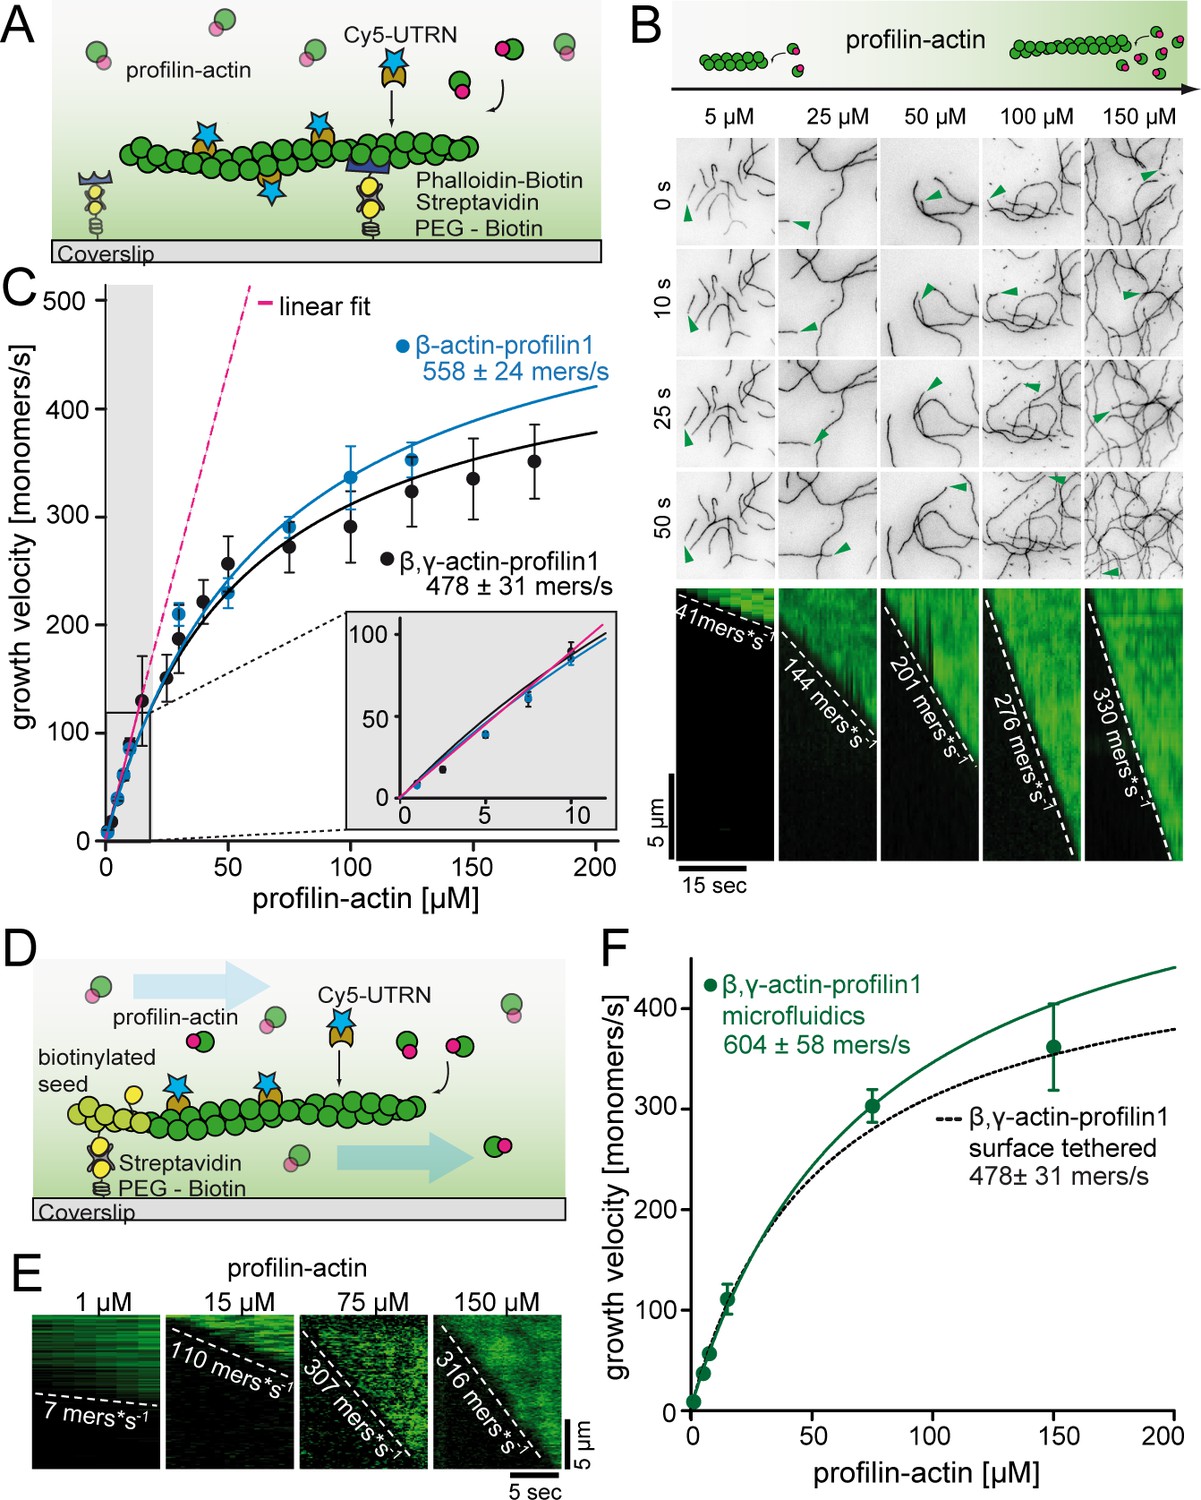
A kinetic limit to actin filament elongation from profilin-actin.
(A) Scheme of TIRFM elongation assays of surface-attached filaments from profilin-actin on functionalized coverslips. (B) TIRFM time-lapse images (top) and kymographs (bottom) of filament elongation (green arrow follows a single barbed end) at indicated profilin-actin concentrations. (C) Barbed end growth velocities from TIRFM assays using different profilin1:actin complexes as indicated. Points are mean values [N ≥ 40 for each condition, error = SD]. Lines are hyperbolic fits. Inset: Regime of low concentrations fitted by a linear model (magenta, Figure 2—figure supplement 1C–D). (D) Scheme of microfluidic experiments of seed-attached filaments under flow. (E) Kymographs of filaments at indicated profilin-actin concentrations in microfluidic experiments. (F) Barbed end growth velocities of filaments grown in microfluidic channels in TIRFM assays (green) compared to surface tethered filaments as quantified in ((C), black dashed line). Points are mean values [N ≥ 40 for each condition, error = SD].
-
Figure 2—source data 1
Data Figure 2.
- https://doi.org/10.7554/eLife.50963.008
Figure 2—figure supplement 1
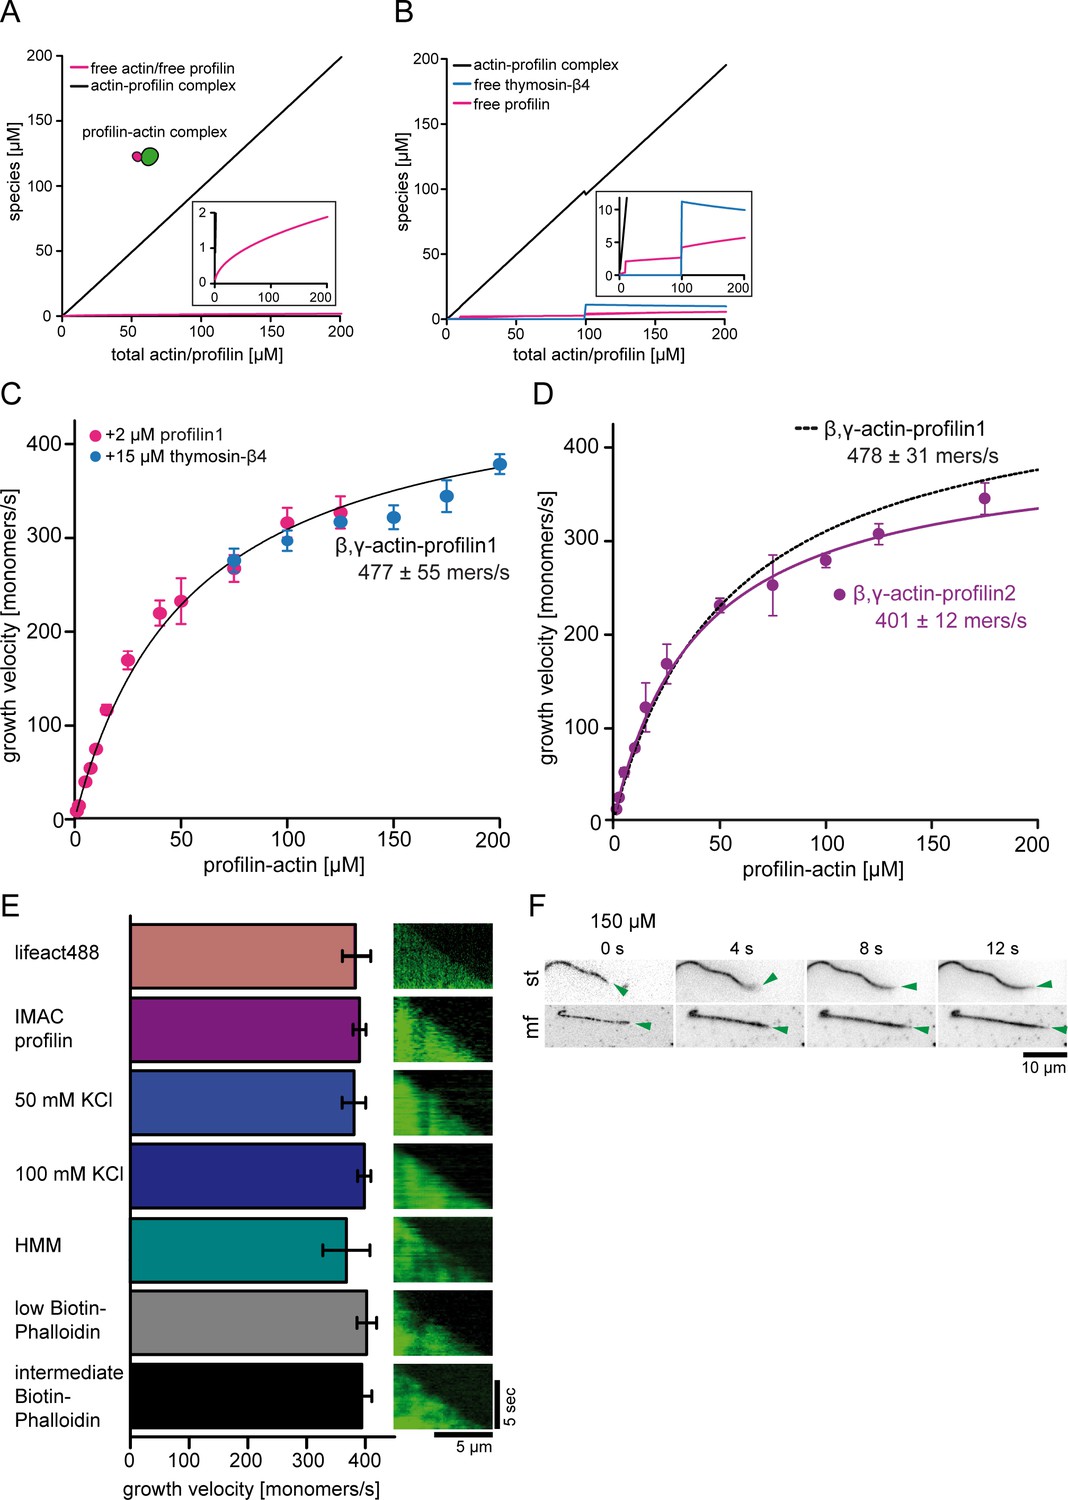
Control experiments for barbed end polymerization in TIRF-M single filament assays.
(A) Calculations of profilin-actin complex and free profilin and actin concentrations [μM] (see inset) as a function of the total profilin-actin concentration (see Materials and methods). (B) Calculations of profilin-actin complex and free profilin or thymosin-β4 concentrations [μM] by the addition of additional trace amounts of 2 μM profilin (between 10 and 100 μM total profilin-actin) or 15 μM thymosin-β4 (>100 μM total profilin-actin) (see Materials and methods) to suppress residual spontaneous nucleation. Note that no more than 5 μM free profilin or 11 μM free thymosin-β4 accumulate in the assay. These low amounts do not significantly affect barbed end growth rates. (C) Barbed end growth velocities measured from TIRF-M single filament assays using profilin1: β, γ–actin as a substrate. In addition 2 μM free profilin1 (magenta) or 15 μM thymosin-β4 (blue) at individual and overlapping profilin-actin concentrations indicated in the graph were added to the reaction. Each point represents the calculated mean of the actin filament elongation rate at a distinct substrate concentration [N ≥ 30 for each condition, error bars = SD]. Continuous line represents a hyperbolic fit yielding the indicated maximum filament growth rate at saturation. (D) Barbed end growth velocities measured from TIRF-M single filament assays using profilin2: β, γ–actin as a substrate (violet). Data from profilin1: β, γ–actin are shown as a dashed black line. Each point represents the calculated mean of the actin filament elongation rate at a distinct substrate concentration [N ≥ 40 for each condition, error bars = SD]. Continuous lines are hyperbolic fits yielding the indicated maximum filament growth rates at saturation. (E) Controls experiments showing that the maximal filament growth velocity does not depend on the filament binding probe, the profilin purification method, ionic strength or surface attachment. Left: Bar diagram of the growth velocities for fluorescent filament probes (upper 1st - lifeact488, others - Cy5UTRN261), affinity purified profilin (upper 2nd – IMAC purified, others – native purification), different salt concentrations (50 and 100 mM KCl), different surface tethering (HMM, biotin-phalloidin low- 20 nM and intermediate- 200 nM) at 100 μM profilin-actin. Right: Kymographs of the growth of representative individual filaments at 100 μM profilin-actin. (F) TIRF-M time-lapse images of filaments either surface tethered along their length (st) or only via a stabilized seed at their pointed end in microfluidic devices (mf). The green arrow follows a single growing barbed end. Experiments were done at 150 μM profilin-actin.
Figure 3 with 1 supplement
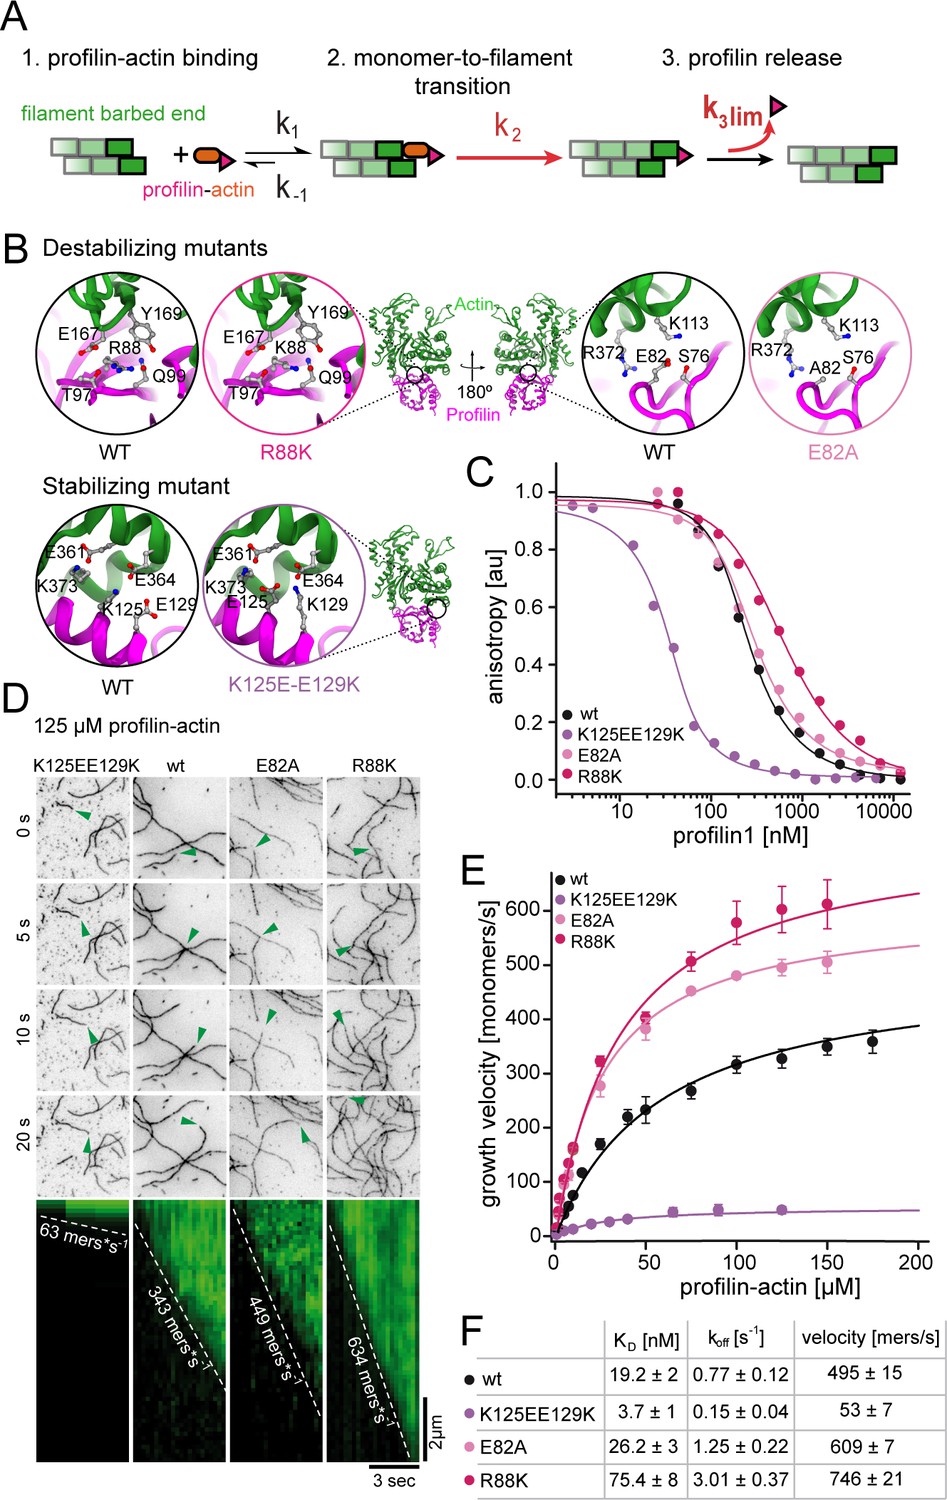
Profilin release kinetically limits filament elongation.
(A) Scheme of barbed end elongation from profilin-actin alone indicating the potential limiting kinetic steps. (B) Structural models (Materials and methods) of the actin interface of stabilizing and destabilizing profilin mutants. Ribbon diagrams highlight the mutation positions. Insets show changes in amino acid environments upon mutation. (C) Binding of profilin to ATP-bound actin monomers measured by fluorescence anisotropy competition assays. Fluorescence anisotropy of Atto488-WAVE1WCA (4 nM) at increasing profilin1 (wt or mutants as indicated) concentrations in the presence of actin monomers (150 nM for wt and weakly binding profilin and 40 nM for tightly binding profilin). Lines fit to an analytical competition model (Materials and methods). Points represents means (N ≥ 3) ± SD. (D) TIRFM time-lapse images (top) and kymographs (bottom) of filament elongation (green arrow follows a single barbed end) from mutant profilin1:actin complexes (125 μM total) as indicated. (E) Barbed end growth velocities measured from TIRFM assays using mutant profilin1:actin complexes as indicated. Points are mean values [N ≥ 40 for each concentration, error = SD]. Lines are hyperbolic fits. (F) Summary table of equilibrium dissociation constants (KD) and dissociation rate constants (koff, Figure 3—figure supplement 1) of the interaction of profilin1 (wt or mutants as indicated) and actin monomers and the resulting maximal filament elongation velocities as measured by TIRFM.
-
Figure 3—source data 1
Data Figure 3.
- https://doi.org/10.7554/eLife.50963.012
Figure 3—figure supplement 1
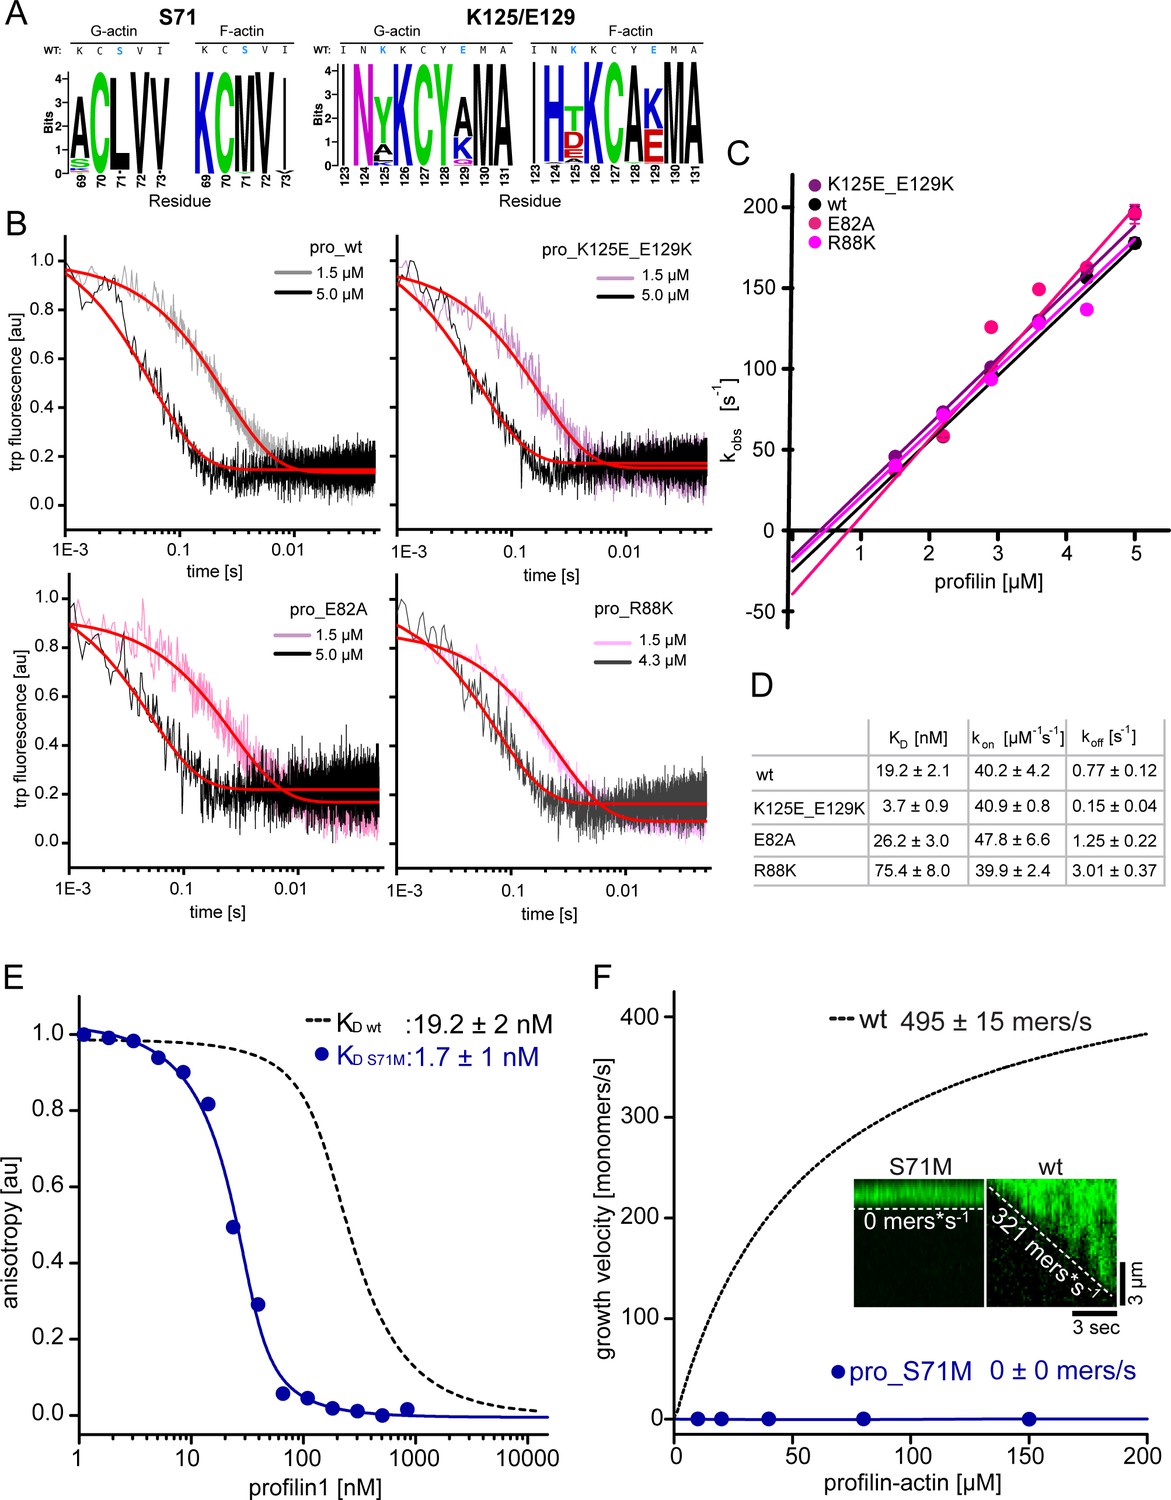
Measurements of profilin1-actin monomer association kinetics and characterization of a ultra-tight binding profilin1 mutant that blocks filament polymerization.
(A) Amino acid logos around K125/E129 or S71, for the top 50 profilin designs obtained from the G- or F-actin complexes. The plot represents the frequency with which each amino acid was found in the designs, with the size of the characters being proportional to their abundance. A frequency of 100% results in ~4.32 bits. For both cases, the wild-type profilin sequence is shown at the top, with the mutated amino acids are highlighted in blue. The sequence logos were built with WebLogo (Crooks et al., 2004). (B) Time traces of tryptophan fluorescence quenching upon formation of the profilin1-actin complex for either wt or mutant profilin-1 as indicated. Experiments were done at 0.5 µM actin monomers and various excess profilin-1 concentrations as indicated. The observed reaction rates (kobs) (plotted in Figure 3—figure supplement 1C) were derived from fits to a mono-exponential decay function (fit, red line) (see Materials and methods). (C) Linear fit of the observed reaction rates kobs as a function of the total profilin-1 concentration (see Figure 3—figure supplement 1B). The association rate constant (kon) is calculated from the slope of a linear fit to the data. (D) Summary table of equilibrium dissociation constants (KD), association rate constants (kon) and dissociation rate constants (koff) of the interaction of profilin1 (wt or mutants as indicated) and actin monomers. Dissociation rate constants were calculated from the equilibrium dissociation constants and the measured association rate constants (see Figure 3—figure supplement 1B–C, see Materials and methods). (E) Binding of profilin1 (wt and S71M) to cytoplasmic actin measured by fluorescence anisotropy competition assays. Fluorescence anisotropy of Atto488-WAVE1WCA [4 nM] as a function of increasing profilin1 (wt, S71M as indicated) concentration in the presence of a constant amount of actin monomers [150 nM]. Lines are fits to an exact analytical competition model (see Materials and methods). Each data point represents the mean value from three independent experiments. Error indicators are SD. (F) Barbed end growth velocities measured from TIRF-M single filament assays using profilin1 (S71M):actin complexes. Points represent the calculated mean of the actin filament elongation rate at a given profilin-actin concentration [N ≥ 40 for each condition, error bars = SD]. Continuous lines are hyperbolic fits yielding the indicated maximum filament growth rates at saturation (see Materials and methods). Inset: Kymographs of representative individual filaments at 150 μM profilin-actin.
Figure 4 with 1 supplement
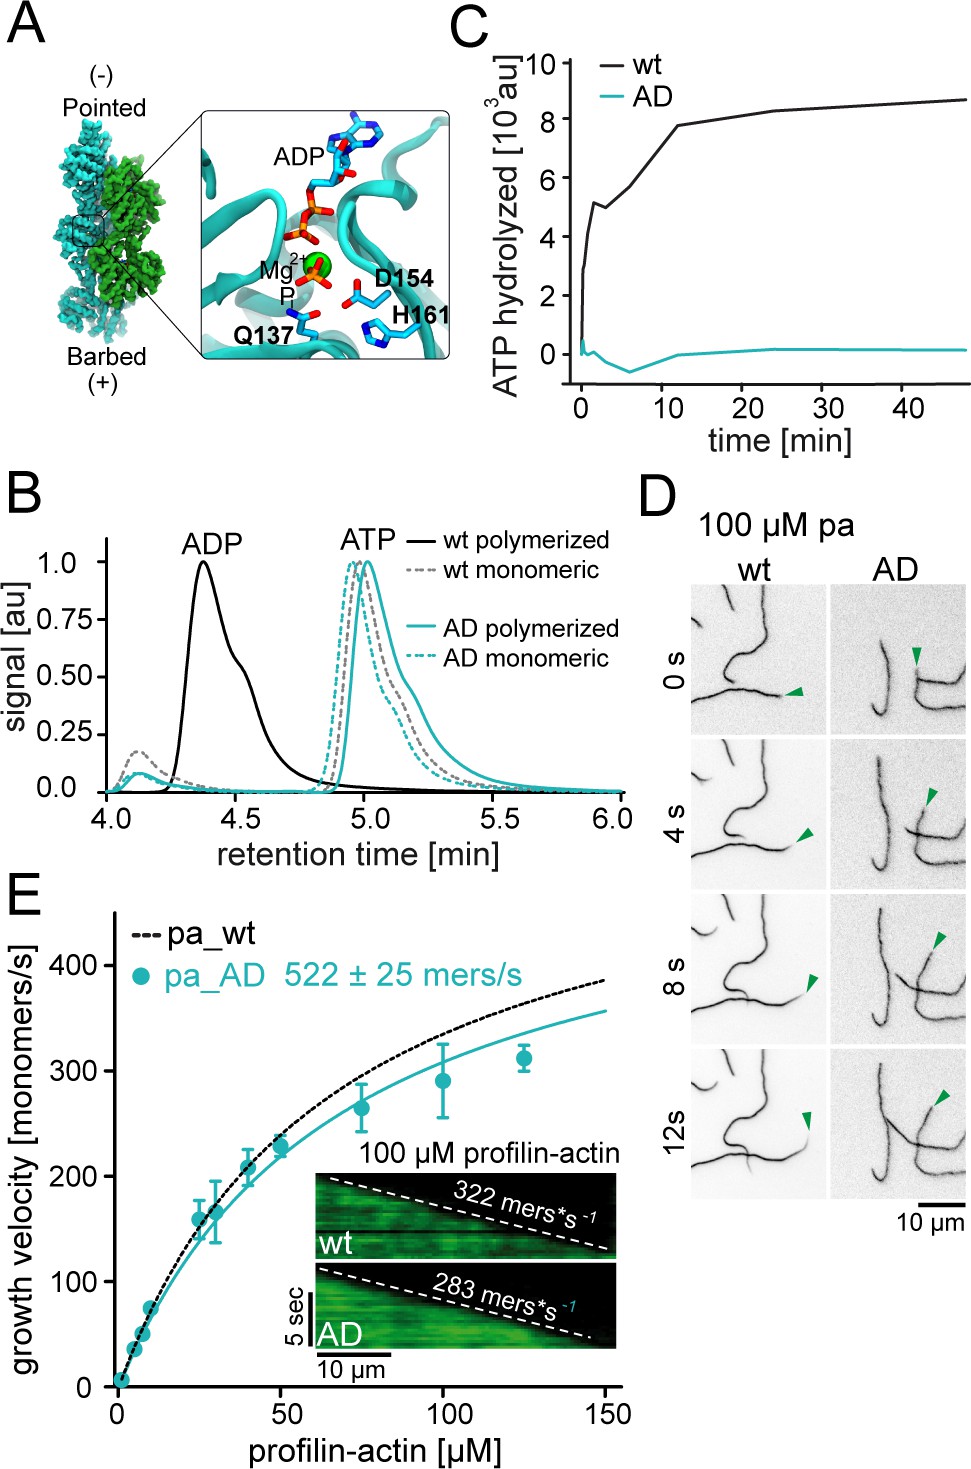
ATP hydrolysis is not required for profilin release from the barbed end.
(A) Nucleotide-binding site of filamentous actin. Left: the overall structure of filamentous actin. Right: Inset of the active site (PDBID 6FHL), including the three amino acids involved in nucleotide hydrolysis which were mutated to alanine for the generation of ATPase deficient actin, and the products of the reaction ADP and Pi. (B) End-point assays examining nucleotide content via HPLC after 1.5 hr of seeded polymerization from profilin-actin (either wt or ATPase deficient). As a non-polymerized control, profilin-actin was stabilized via LatrunculinB before the experiment. (C) ATPase activity of wt and ATPase deficient actin in seeded polymerization assays. The cleavage of γ-32P is monitored over time after mixing profilin1: actin complexes containing radioactive ATP with filaments in a 1:1 ratio (12 μM total)). (D) TIRF-M time-lapse images of filament barbed end elongation (green arrow follows a single barbed end) from either wt- or ATPase deficient actin-containing profilin1-actin complexes (100 μM total). (E) Barbed end growth velocities of profilin1–actin (100 μM total, wt (black) or ATPase deficient (cyan)) from TIRFM assays. Points are mean values [N ≥ 40 for each concentration, error = SD]. Lines are hyperbolic fits. Inset: Kymographs of filament growth.
-
Figure 4—source data 1
Data Figure 4.
- https://doi.org/10.7554/eLife.50963.016
Figure 4—figure supplement 1
Affinity measurements of profilin1 to wt β-actin and ATPase-deficient actin.
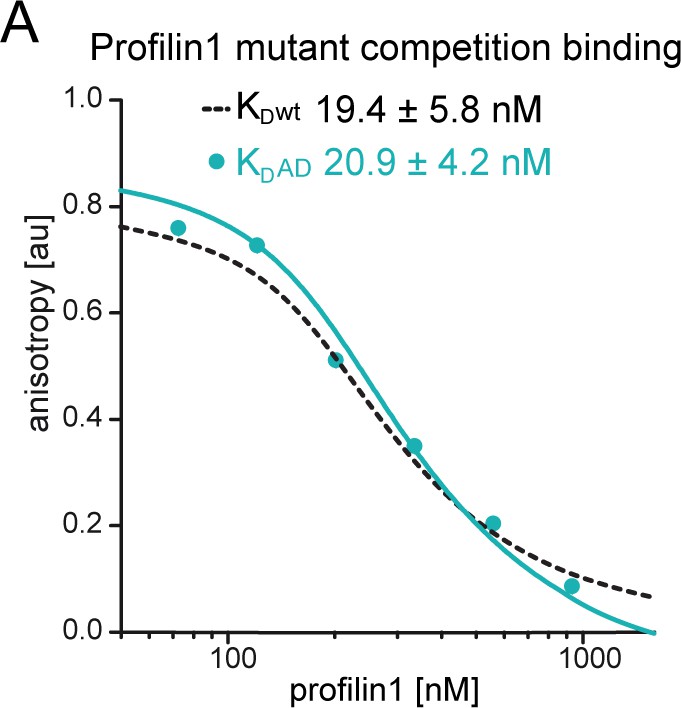
(A) Binding of profilin1 to cytoplasmic actin, either wt (black dashed) or AD (cyan) measured by fluorescence anisotropy competition assays. Fluorescence anisotropy of Atto488-WAVE1WCA [4 nM] as a function of increasing profilin1 concentration in the presence of a constant amount of actin monomers [150 nM]. Lines fit to an exact analytical competition model (see Materials and methods). Each data point represents the mean value from three independent experiments. Error indicators are SD.
Figure 5 with 1 supplement

Formins accelerate filament elongation at saturating profilin-actin concentrations.
(A) Scheme of TIRFM assays with formin catalyzing the elongation of a filament from profilin-actin on functionalized coverslips. (B) Top: TIRFM time-lapse images of formin-mediated actin elongation (green arrows follow a single barbed end) at 75 μM profilin-actin in the absence or in the presence of 15 nM formin constructs as indicated. Bottom: Kymographs of individual growing filaments as in the top panel. (C) Velocities of formin-catalyzed barbed end growth from TIRFM assays as in (B). Points are mean values [N ≥ 40 for each concentration, error = SD]. Lines are hyperbolic fits. (D) Scheme of the generation of mDia chimeras. (Materials and methods). (E) Barbed end growth velocities of mDia chimeras (continuous lines) compared to wt mDia formins ((B), dashed lines) from TIRFM assays. Points are mean values [N ≥ 40 for each condition, error = SD]. Lines are hyperbolic fits. Right: Kymographs of growing filaments (±formins as indicated) at 50 μM profilin-actin. (F) Comparison of mDia1(15 nM)-mediated filament growth from 100 μM profilin-actin (either both wt proteins, tight binding profilin-1 (K125E-E129K) or ATPase-deficient actin (AD) as indicated). Left: Growth velocities. Points are mean values [N ≥ 35 for each condition, error = SD]. Right: TIRFM time-lapse images (green arrows follow a single barbed end).
-
Figure 5—source data 1
Data Figure 5.
- https://doi.org/10.7554/eLife.50963.019
Figure 5—figure supplement 1
Profilin release but not ATP hydrolysis is limiting for formin-mediated actin polymerization.
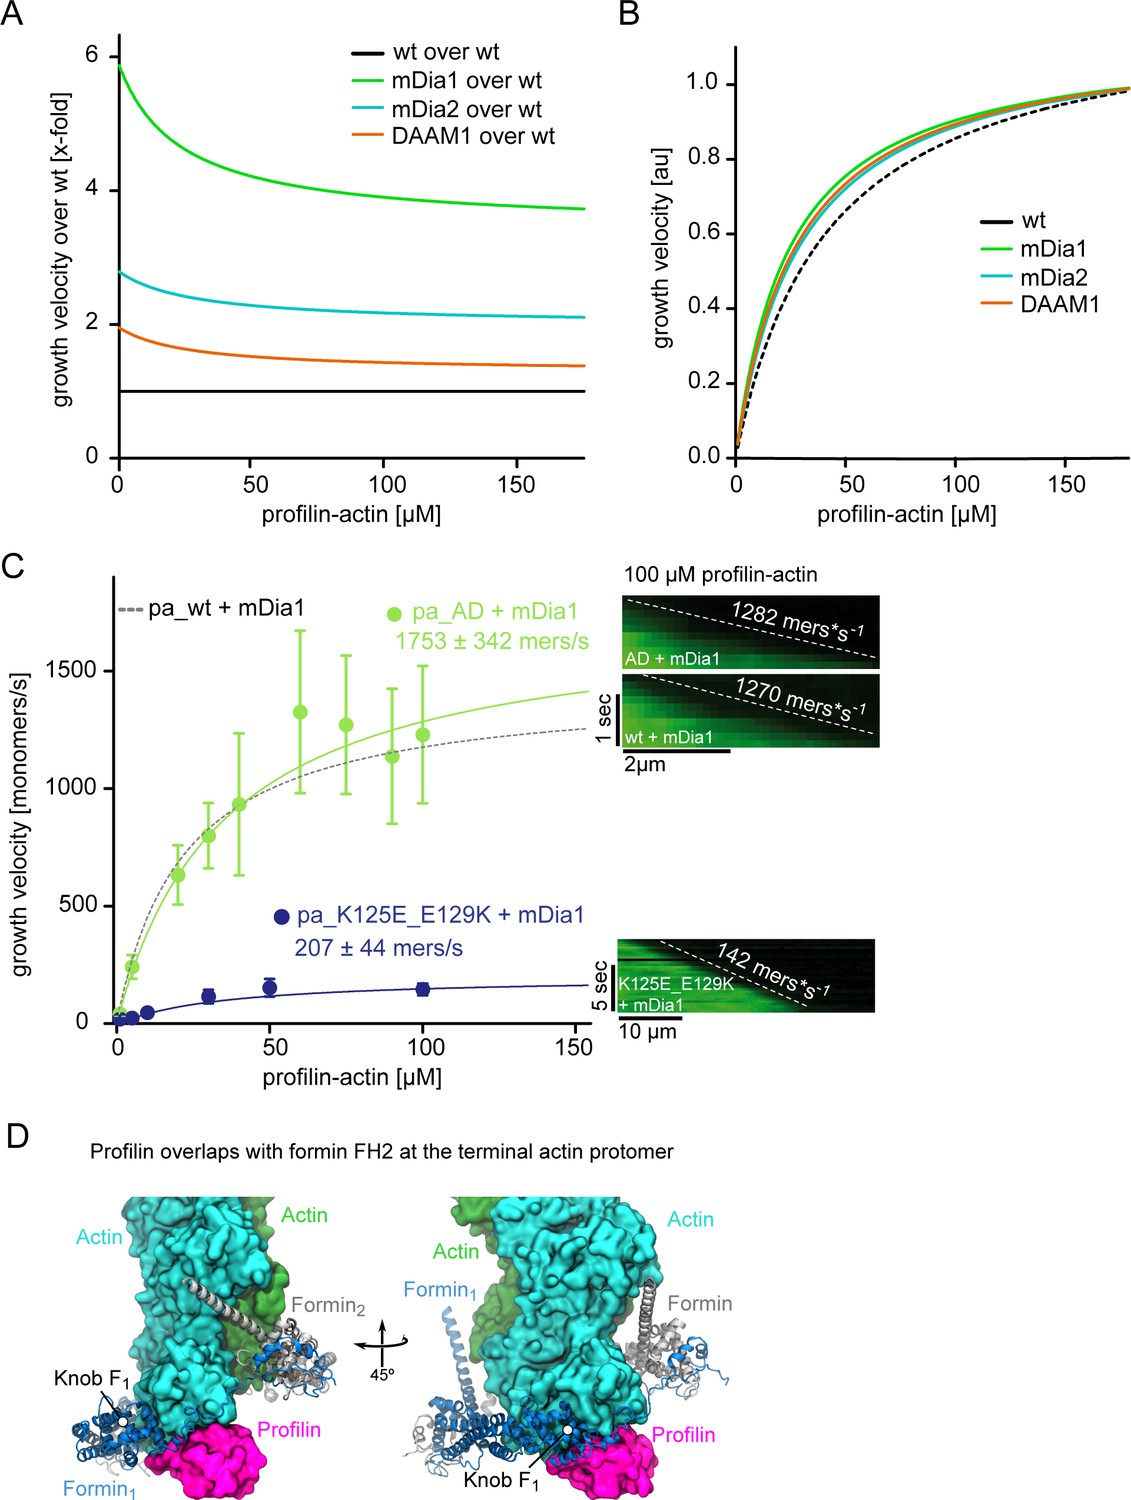
(A) Fits showing the relative (x-fold) enhancement of the filament growth velocity obtained derived from hyperbolic fits to the raw data (Figure 5C) by either mDia1, mDia2 or DAAM1 as indicated. Growth velocities were normalized by the speed of actin growth in the absence of formins. (B) Growth velocities obtained from hyperbolic fits to the raw data (Figure 5C) in the presence of mDia1, mDia2 or DAAM1 as indicated, normalized by their characteristic maximal growth rate. This re-normalization shows that all formins lower the concentration of profilin-actin required for half-maximal elongation speeds and thus slightly broaden the region of concentration invariance. (C) mDia1-catalyzed barbed end growth velocities of profilin1–actin (either both proteins wt (dashed), or AD actin (light green) or tight binding profilin-1(K125E+E129K) (cyan)) from TIRF-M assays. Note that the tight binding profilin-mutant reduces the maximal elongation rate whereas ATPase-deficient actin does not. Points represent the calculated mean of the actin filament elongation rate at a given profilin-actin concentration [N ≥ 35 for each condition, error bars = SD]. Lines are hyperbolic fits. Right: Kymographs of the growth of representative individual filaments at 100 μM profilin-actin. (D) Model of the FH2 domain of mDia1 (blue) bound to the barbed end of an actin filament bound to profilin (see Materials and methods). The actin subunits (green) and profilin (magenta) are shown as surfaces. The knob region of the FH2 domain contacts the profilin molecule bound at the terminal protomer of the filament.
Figure 6 with 2 supplements
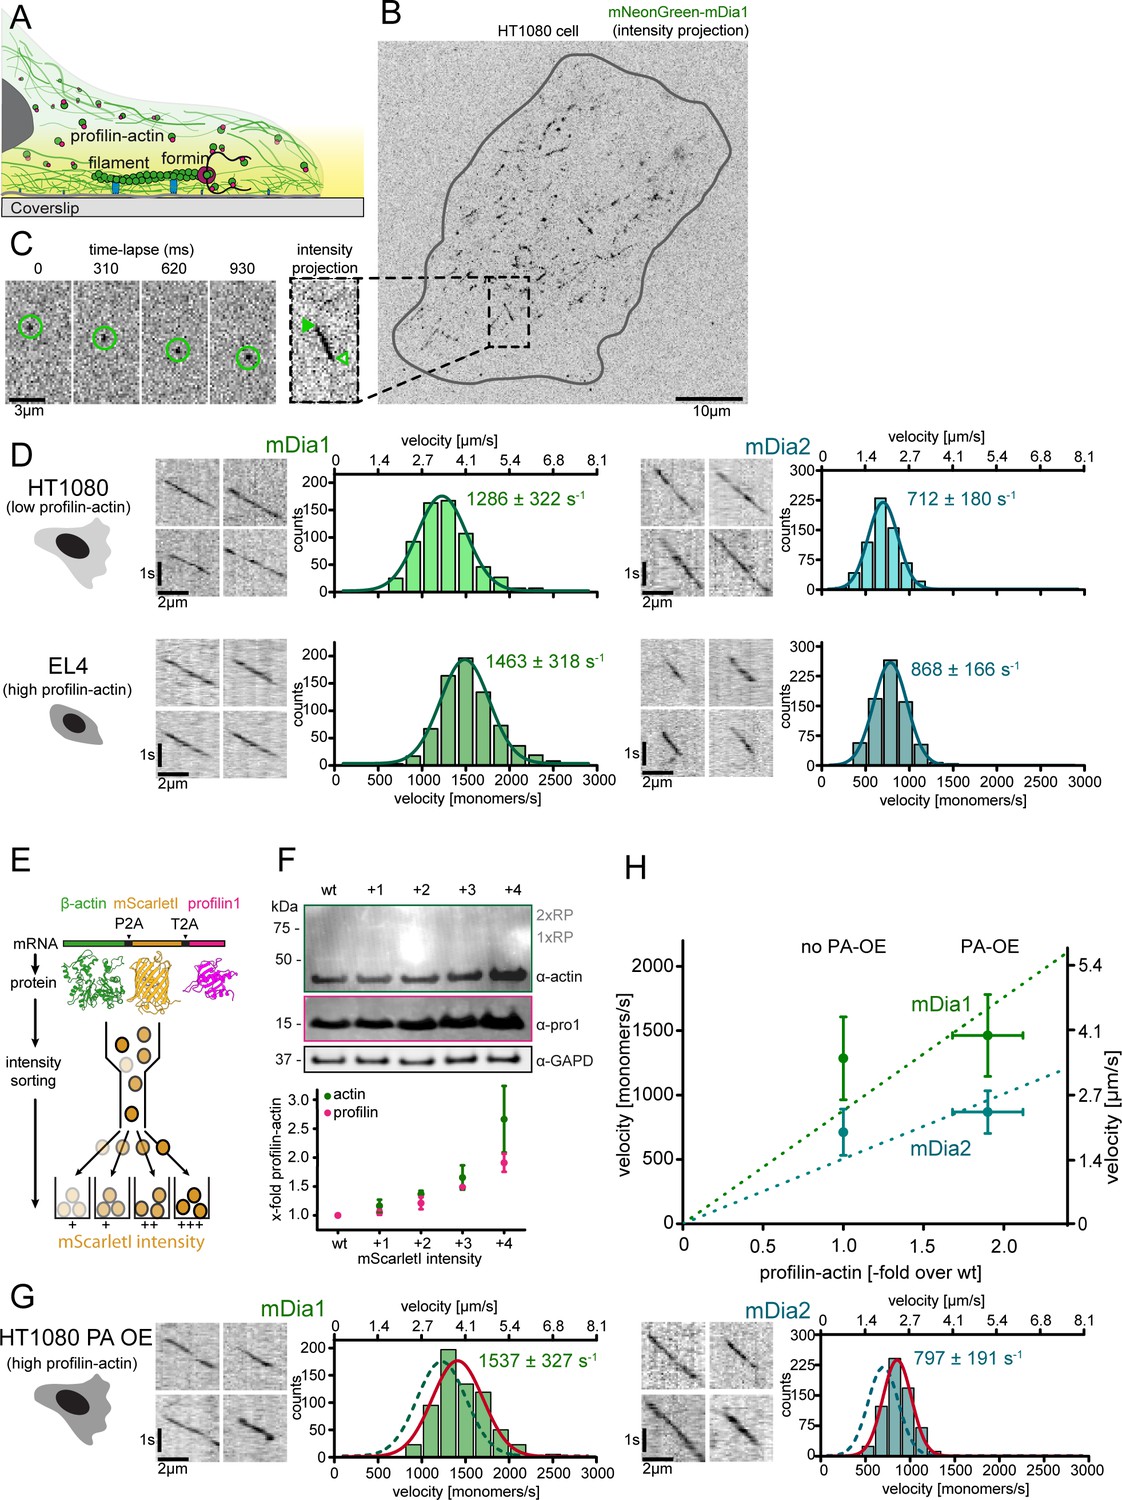
Formin single molecule imaging reveals buffered elongation rates in mammalian cells.
(A) Scheme of TIRFM imaging of single formins in the actin cortex of cells. (B) Maximum intensity projection of a TIRFM time-lapse shows growth trajectories of single mNeonGreen-mDia1 molecules in the cortex of a HT1080 cell. Inset: Close-up of a single trajectory as in (C). (C) TIRFM time-lapse images (left) and intensity projection (right) of an individual mNeonGreen-mDia1 molecule. (D) Measurements of mDia1/2 elongation velocities in vivo. Left to right: Scheme of HT1080 (top) and EL4 (lower) cells, kymographs of single mNeonGreen- mDia1 (left) or mDia2 (right) molecules followed by velocity distributions. Lines are Gaussian fits. Means and SD are indicated. [Ncells ≥ 10, nmolecules/cell ≥30, ntotal ≥650 per condition]. (E) Workflow to generate profilin1 and β-actin overexpressing HT1080 cells. Polycistronic constructs for β-actin, mScarletI and profilin1 were integrated into the genome. Cells were sorted into four sub-populations dependent on mScarletI fluorescence intensity (Figure 6—figure supplement 2B, Materials and methods). (F) Top: Western blot of HT1080 cells (wt or overexpressing sub-populations). No translational read-through is visible (1xRP: actin-mScarletI, 2xRP: actin-mScarletI-profilin1 at expected Mw). Bottom: Relative profilin1 and actin levels (fold over wt) for indicated sub-populations. (G) mDia1/2 velocities in profilin-actin overexpressing HT1080 cells. Left to right: Scheme, kymographs of single mNeonGreen-mDia1 (left) or mDia2 (right) molecules, velocity distributions. Lines are Gaussian fits (Red continuous (PA-OE) and dashed (wt) cells as in (D)). Means and SD are indicated. [Ncells ≥ 10, nmolecules/cell ≥30, ntotal ≥650 per condition]. (H) Mean mDia velocities in HT1080 cells plotted against the relative profilin-actin concentration. Error = SD. Dashed lines are linear fits through the origin.
-
Figure 6—source data 1
Data Figure 6.
- https://doi.org/10.7554/eLife.50963.025
Figure 6—figure supplement 1
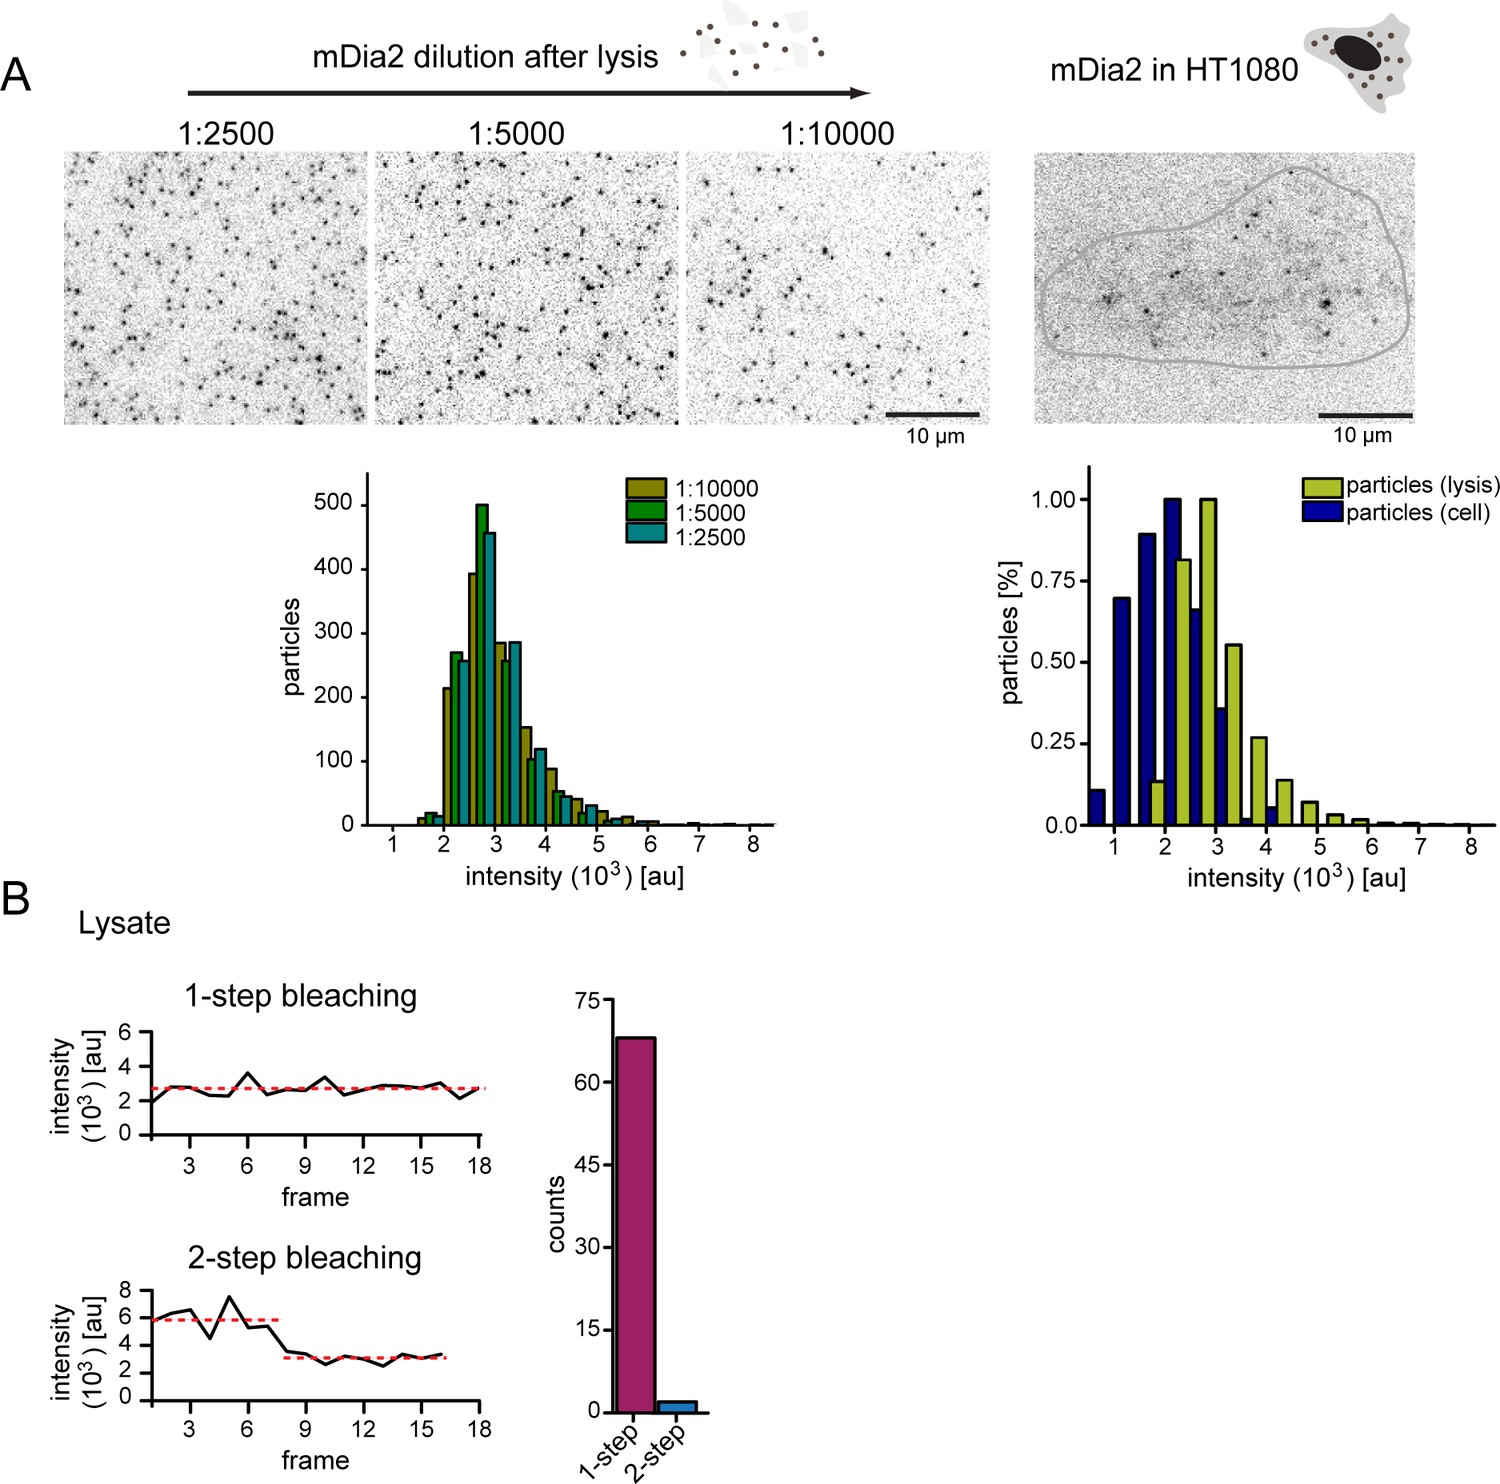
Control experiments for single formin imaging in vivo.
(A) Left: Still images from TIRF imaging of surface-immobilized mNeongreen-mDia2 FH1-2 molecules from serial dilutions of HT1080 cell lysate at indicated dilution factors. Intensity distributions below show that the single particle intensity is independent of the dilution factor. Right: Still image from TIRF imaging of mNeongreen-mDia2 FH1-2 molecules in living cells. [For each dilution ≥1000 particles were analyzed, for particles from living cells ≥ 200 particles were analyzed]. (B) Bleaching analysis of surface immobilized mNeongreen-mDia2 FH1-2 as in (A). Spots bleach in 1–2 steps. [N = 70 particles].
Figure 6—figure supplement 2
Profilin1-actin overexpression and in vivo formin speeds at different profilin1-actin levels.
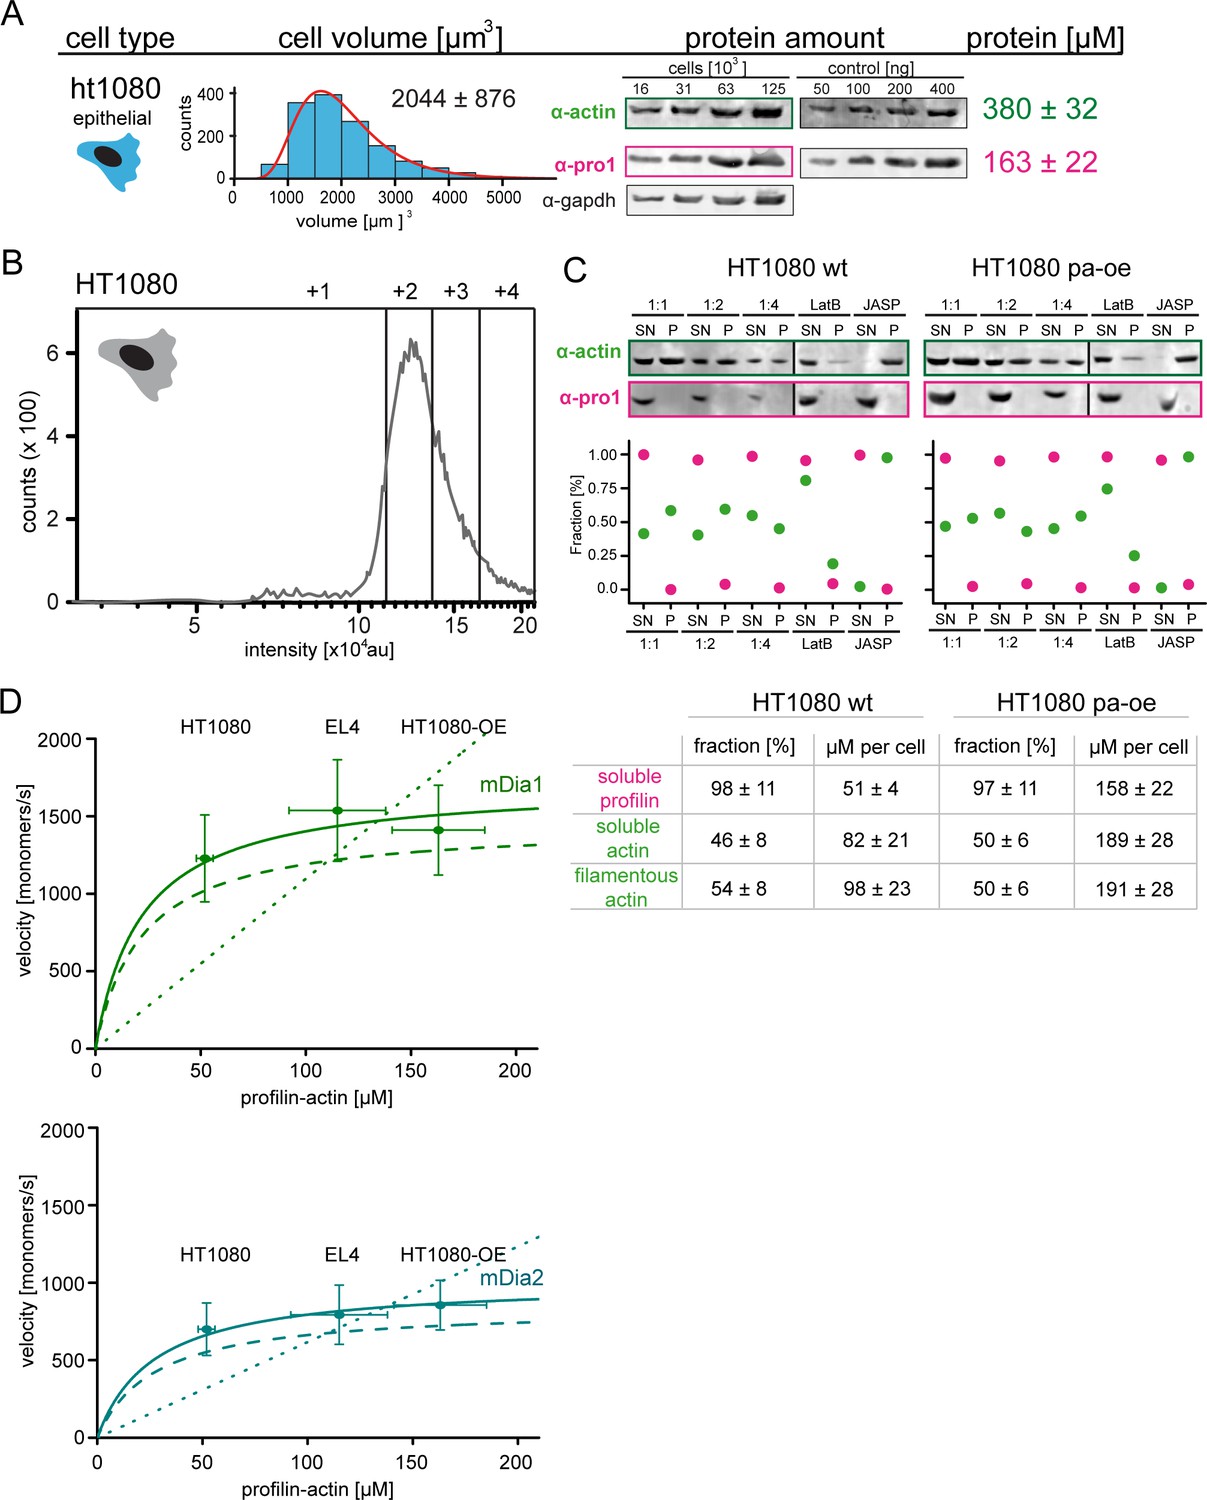
(A) Profilin-actin concentration determination in mammalian HT1080 cells overexpressing profilin1 and β-actin. Left to right: name of cell type and origin, histograms of the single cell volume from fluorescence eXclusion measurements, quantitative western blot analysis of cellular actin, profilin1 amount (left: titration of cell number, right: standard curve of recombinant proteins), calculated mean protein concentration [μM] per cell with experimental error (SD, N = 3 independent experiments, see Materials and methods). (B) Histogram from FACS analysis showing the ScarletI intensity distribution from a polyclonal population of HT1080 cells overexpressing profilin1, mScarletI and β-actin. This population was sorted into subpopulations as indicated (+one to +4). (C) Mean velocities of either mDia1 (top) and mDia2 (bottom) in different mammalian cell types (wt HT080, EL4 and HT1080 overexpressing profilin-actin) plotted as a function of the quantified profilin-actin concentration. Error indicators are SD. Dashed lines are the formin speeds determined in vitro (see Figure 5C), dotted lines are linear fits through the origin to the in vivo data. Continuous lines fit to the in vivo data by a hyperbolic model with only one free parameter (vmax, the maximal growth velocity). K0.5 (the profilin-actin concentration at half-maximal elongation speed) was fixed to the value determined in vitro (see Materials and methods). (D) Determination of soluble and filamentous actin and profilin fractions in HT1080 wt and profilin and actin overexpressing cells. Cellular profilin1 and actin amounts after actin arrest and fractionation were detected from different dilutions by quantitative western blot analysis (see Materials and methods). Calculated fractions [%] and protein amounts per cell are summarized in the table.
Figure 7
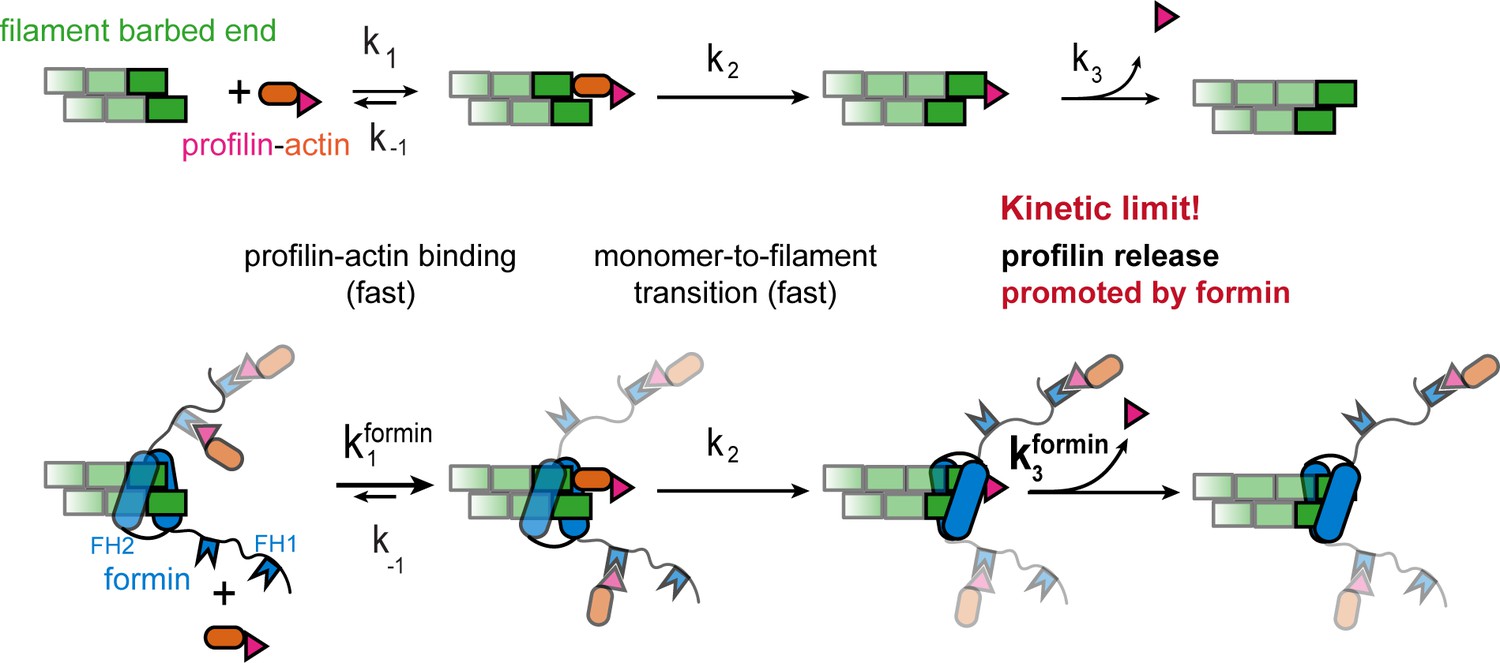
Profilin release controls the speed of actin filament growth.
Kinetic scheme of the filament elongation cycle from profilin-actin either in the absence (top) or the presence (bottom) of formins. Reaction 1 and 2 are very fast at physiological profilin-actin concentrations, which is why reaction 3 (profilin release from the terminal protomer) kinetically limits the elongation cycle. Formins accelerate both the first and third reaction of the cycle.
Appendix 1—figure 1
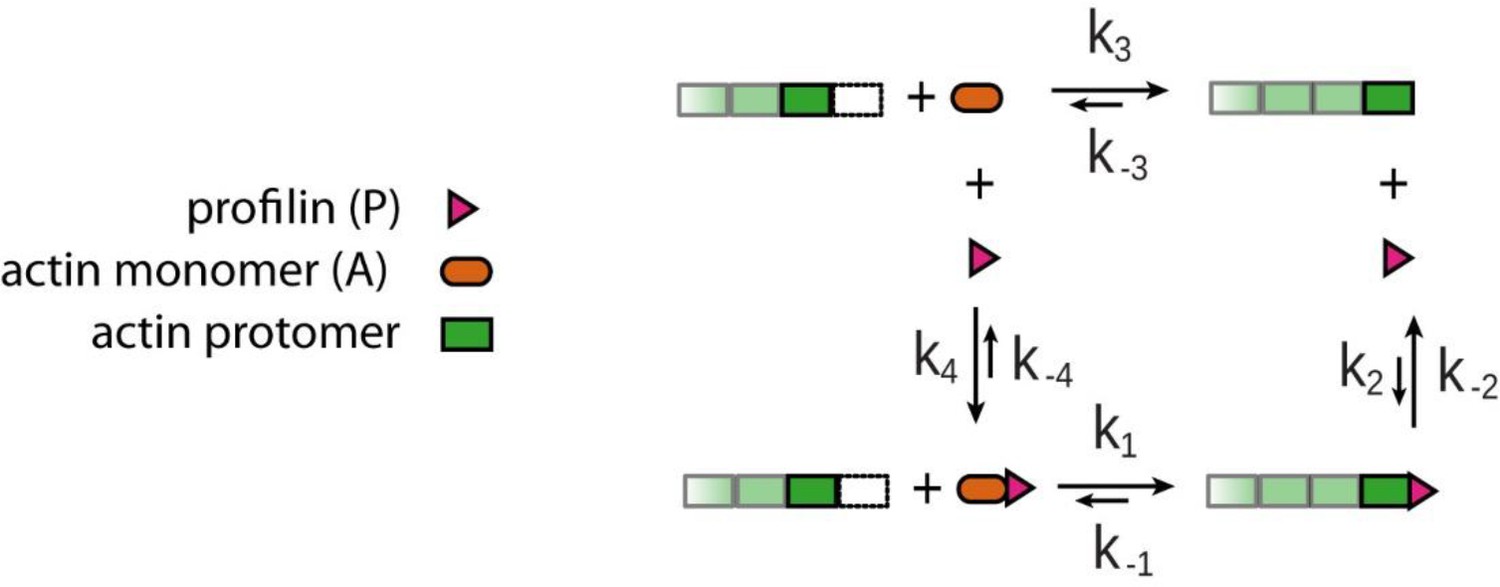
Four reaction model for actin filament growth from actin monomers in the presence of profilin.
1)binding of profilin-actin complex to the terminal protomer, 2) profilin release from the terminal protomer, 3) binding of monomeric actin to the terminal protomer, 4) binding of profilin and monomeric actin to profilin-actin complex in solution. This four-reaction model completes the scheme from Figure 1A in the main text.
Appendix 1—figure 2
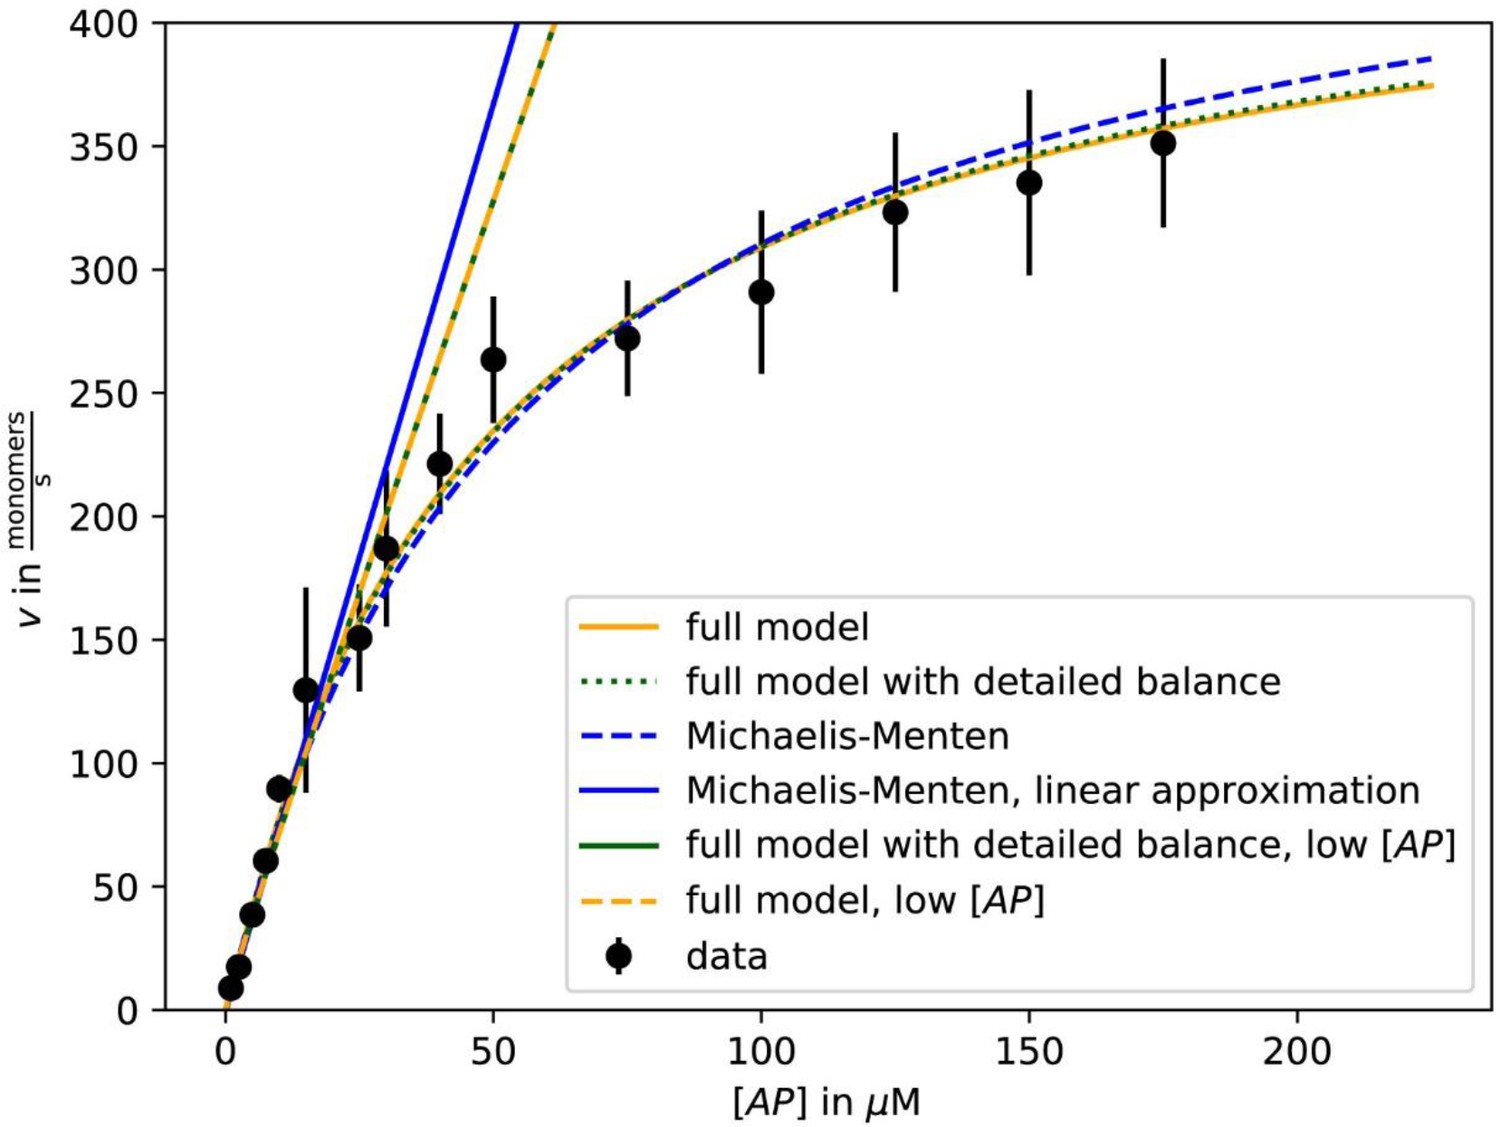
Fit of growth velocity data as a function of [AP] for β-actin-profilin one from Figure 2C using either the Michaelis-Menten approximation (5) with vmax and KM as fit parameters (dashed blue) and its linear low-[AP] approximation (solid blue), the full result (3) with k1, k-1, k2, and k-2 as fit parameters (solid yellow) and with the additional constraint of detailed balance on the fit parameters (dotted green) and the low-[AP] approximations to these results (dashed yellow, solid green).
https://doi.org/10.7554/eLife.50963.034Videos
Video 1
Polymerization of actin filaments from different profilin1-actin concentrations.
Filaments were visualized with 10 nM Cy5-UTRN261 in TIRF-M. Polymerization from increasing profilin1-actin concentrations from left to right: 2.5 μM, 40 μM, 125 μM, 175 μM.
Video 2
Polymerization of actin filaments from different profilin1 mutant-actin complexes at 125 μM.
Filaments were visualized with 10 nM Cy5-UTRN261 in TIRF-M. Polymerization was performed from the following profilin1 mutant-actin complexes, left to right: profilin1-K125E + E129K, -wt, -E82A, -R88K.
Video 3
Polymerization of actin filaments from profilin1-actin at different concentrations in presence of mDia1 FH1-FH2.
Filaments were acquired in TIRF-M (filaments with 10 nM Cy5-UTRN261 - green; 0.7 nM TMR-mDia1 FH-FH2 – magenta). mDia1-mediated actin filament barbed end polymerization was performed at different profilin1-actin concentrations, left to right: 1 μM, 10 μM, 20 μM. For guidance, an example of a visible labeled mDia1 molecule processively moving with a filament barbed end is highlighted with an error.
Video 4
Polymerization of actin filaments from 75 μM profilin1-actin in presence/absence of formins.
Filaments were visualized with 10 nM Cy5-UTRN261 in TIRF-M. All filament barbed ends were saturated with 15 nM formin FH1-FH2. Polymerization was performed in presence of different formins, left to right: wt (no formin), + DAAM1, +mDia2, +mDia1.
Video 5
mDia1 and mDia2 formin single molecule movement in HT1080 cells under conditions with either wt or overexpression of profilin1–actin.
mNeonGreen–mDia1/2 FH1-FH2 single molecules were visualized in TIRF-M. To indicate the cell shape, HT1080 cells were masked. Top: mDia1 (left) and mDia2 (right) molecules in wt HT1080 cells. Bottom: mDia1 and mDia2 molecules in HT1080 cells overexpressing profilin and actin.
Video 6
In vivo mDia2 single molecule movement in absence/presence of latrunculinB, JASP and y27632.
To indicate the cell shape, HT1080 cells were masked. mNeonGreen-mDia2 FH1-FH2 single molecules were visualized in TIRF-M. mDia2 molecules were monitored without and after 10 min of drug treatment. The following drugs were applied to the cells, left to right: no drug treatment, 500 nM latrunculinB (latB), 8 μM JASP, 10 μM y27632.
Tables
Key resources table
| Reagent type (species) or resource | Designation | Source or reference | Identifiers | Additional information |
|---|---|---|---|---|
| Strain, strain background (Escherichia coli) | BL21 Star pRARE | EMBL Protein Expression Facility | Chemically competent cells | |
| Strain, strain background (Escherichia coli) | BL21 Rosetta | Novagen | Cat# 70954 | Chemically competent cells |
| Cell line (S. frugiperda) | SF9 | A. Musacchio, MPI Dortmund | RRID:CVCL_0549 | Cell line for virus generation |
| Cell line (T. ni) | TnaO38 | A. Musacchio, MPI Dortmund | RRID:CVCL_Z252 | Cell line for protein expression from baculovirus system |
| Cell line (Homo-sapiens) | HT1080 | ATCC | Cat# CCL-121, RRID:CVCL_0317 | Profilin and actin quantifications by WB, formin single molecule transfection |
| Cell line (Homo-sapiens) | B16F10 | ATCC | Cat# CRL-6475, RRID:CVCL_0159 | Profilin and actin quantifications by WB, formin single molecule transfection |
| Cell line (Homo-sapiens) | BMDC | Lab of M. Piel, Institut Curie, Paris | Profilin and actin quantifications by WB | |
| Cell line (M. musculus) | neutrophils | Lab of M. Piel, Institut Curie, Paris | Profilin and actin quantifications by WB | |
| Cell line (M. musculus) | EL4, T-lymphocytes | Lab of M. Taylor, MPI Berlin | Profilin and actin quantifications by WB | |
| Transfected construct | pΔCMV-mNeongreen-mDia1FH1-2 | This paper | Uniprot: O08808 | transfected construct, can be obtained in the lab of P. Bieling, MPI Dortmund |
| Transfected construct | pΔCMV-mNeongreen-mDia2FH1-2 | This paper | Uniprot: Q9Z207 | transfected construct, can be obtained in the lab of P. Bieling, MPI Dortmund |
| Transfected construct | pPBCAG-β-actin-P2A-mScarletI-T2A-profilin1 | This paper | transfected construct, can be obtained in the lab of P. Bieling, MPI Dortmund | |
| Antibody | anti-actin (mouse monoclonal) | ThermoFisher | Cat# MA5-11869, RRID:AB_11004139 | WB (1:1000) |
| Antibody | anti-profilin1 (mouse monoclonal) | Sigma Aldrich | Cat# 061M4892 | WB (1:20000) |
| Antibody | anti-profilin2 (mouse monoclonal) | Santa Cruz | Cat# sc-100955, RRID:AB_2163221 | WB (1:20000) |
| Antibody | anti-GAPDH (14C10) (rabbit monoclonal) | Cell Signaling | Cat# 2118, RRID:AB_561053 | WB (1:5000) |
| Antibody | anti-mouse (donkey polyclonal) | Licor | Cat# 925–32212, RRID:AB_2716622 | WB (1:10000) |
| Antibody | anti-rabbit (donkey polyclonal) | Licor | Cat# 926–68073, RRID:AB_10954442 | WB (1:10000) |
| Recombinant DNA reagent | pFL-h.s. β-actin_wt-linker-T4b (plasmid) | This paper | Uniprot: P60709 | β-actin insect cell expression, can be obtained in the lab of P. Bieling, MPI Dortmund |
| Recombinant DNA reagent | pFL-h.s. β-actin_Q137A_D154A_H161A-linker-T4b (plasmid) | This paper | β-actin insect cell expression, can be obtained in the lab of P. Bieling, MPI Dortmund | |
| Peptide, recombinant protein | Streptavidin | Sigma Aldrich | Cat. #: 189730 | For filament attachment |
| Chemical compound, drug | Latrunculin B | Sigma Aldrich | Cat. #: L5288 | For actin arrest |
| Chemical compound, drug | Y-27632 dihydrochloride | Sigma Aldrich | Cat. #: Y0503 | For actin arrest |
| Chemical compound, drug | jasplakinolide | Sigma Aldrich | Cat. #: J4580 | For actin arrest |
| Chemical compound, drug | phalloidin | Sigma Aldrich | Cat. #: P2141 | For actin arrest |
| Chemical compound, drug | 1,5-IAEDANS | Thermo Fisher | Cat. #: I14 | For actin labeling |
| Chemical compound, drug | EZ-Link Maleimide-PEG2-Biotin | Thermo Fisher | Cat. #: A39261 | For actin labeling |
| Chemical compound, drug | γ–32P–ATP (3000 Ci/mmol) | PerkinElmer | Cat. #: NEG002A | For ATPase assay |
| Chemical compound, drug | HO-PEG-NH2 and Biotin-CONH-PEG-O-C3-H6-CONHS | Rapp Polymere | # 103000–20 and # 133000-25-35 | For glass surface functionalization |
Appendix 1—table 1
Model parameters.
https://doi.org/10.7554/eLife.50963.031| kinetic parameter | value | reference |
|---|---|---|
| k3 | 11 μM-1s-1 | Pollard, 1986 and this work |
| k-3 | 1 s-1 | Pollard, 1986 |
| 0.58 s-1 | this work | |
| k4 | 40 μM-1s-1 | this work |
| k-4 | 0.75 s-1 | this work |
| k1 | 11 μM-1s-1 | Courtemanche and Pollard, 2013 |
| k-1 | 50 s-1 | Courtemanche and Pollard, 2013 |
| 5 s-1 | Pernier et al., 2016 |
Appendix 1—table 2
Results for rates k-2, k1 and KM from Michaelis-Menten fits of the growth velocity data in Figure 2C, Figure 3E (mutant profilin), and Figure 5C (with formins) in the main text.
https://doi.org/10.7554/eLife.50963.033| k-2 [s-1] | KM [μM] | k1 [μM-1s-1] | |
|---|---|---|---|
| β-actin-profilin | 558 ± 24 | 66 ± 3 | 8.4 ± 0.1 |
| β,γ-actin-profilin1 | 478 ± 31 | 54 ± 5 | 8.9 ± 0.3 |
| wt | 495 ± 15 | 57 ± 2 | 8.7 ± 0.1 |
| K125EE129K | 53 ± 7 | 26 ± 7 | 2.0 ± 0.3 |
| E82A | 609 ± 7 | 26.8 ± 0.7 | 22.7 ± 0.4 |
| R88K | 746 ± 21 | 35.7 ± 1.3 | 20.9 ± 0.3 |
| mdia1 | 1450 ± 167 | 22 ± 4 | 66 ± 5 |
| mdia2 | 820 ± 87 | 26 ± 4 | 31 ± 2 |
| daam1 | 573 ± 30 | 36 ± 3 | 16.1 ± 1.0 |
Additional files
-
Transparent reporting form
- https://doi.org/10.7554/eLife.50963.029
Download links
A two-part list of links to download the article, or parts of the article, in various formats.
Downloads (link to download the article as PDF)
Open citations (links to open the citations from this article in various online reference manager services)
Cite this article (links to download the citations from this article in formats compatible with various reference manager tools)
Profilin and formin constitute a pacemaker system for robust actin filament growth
eLife 8:e50963.
https://doi.org/10.7554/eLife.50963


