Multiple kinesins induce tension for smooth cargo transport
- University of Illinois at Urbana-Champaign, United States
- University of Vermont, United States
Figures
Figure 1
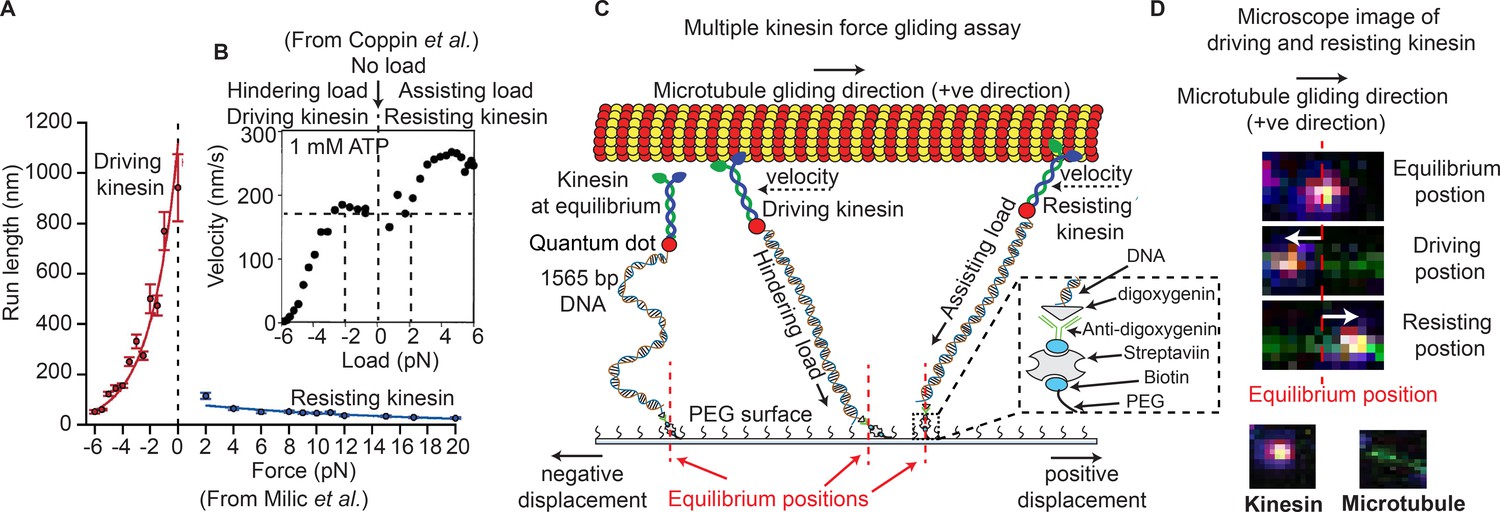
Force gliding assay to study multiple kinesins transporting a cargo.
(A) Kinesin run-length is asymmetric in response to load as measured in an optical trap (graphs reproduced from Milic et al., 2014). (B) Coppin et al. (2002) observed an asymmetric velocity response to oppositely applied load. Driving kinesin velocity is slower (0 nm/s to ~170 nm/s between -6 pN to -2 pN and then constant at 0 pN load) than resisting kinesin (180 nm/s to 280 nm/s between 0 pN to 6 pN load) when pulled by loads in opposite directions. The graph is obtained from 100 kinesin runs. (C) Schematic of force gliding assay to study behavior of multiple kinesin motors transporting a single microtubule as a cargo. Kinesin-QD is attached to the surface with a 1565-bp long dsDNA linker that allows the detection of kinesin-QD motion as it drives or resists the cargo (cargo moves towards the right); the equilibrium position of kinesin is also shown. The displacement of resisting kinesin is in the same direction as the microtubule velocity (positive displacement by convention) and the position of driving kinesin is in the opposite direction to the microtubule velocity (negative displacement). Using the extensible worm-like chain model (eWLC), forces on each kinesin could be estimated. (D) Microscope images of driving and resisting kinesins are shown. Kinesin is at first in its equilibrium position (top image). When kinesin assumes a driving position, it is displaced to the left of its equilibrium position (middle image). When kinesin becomes resisting, it moves to the right, in the microtubule velocity direction (bottom image). The equilibrium position is depicted by the red dotted line.
© 1997, National Academy of Sciences, USA. All rights reserved. Figure 1B is reproduced from Coppin et al. (2002) with permission. It is not covered by the CC-BY 4.0 licence and further reproduction of this panel would need permission from the copyright holder.
Figure 2 with 1 supplement
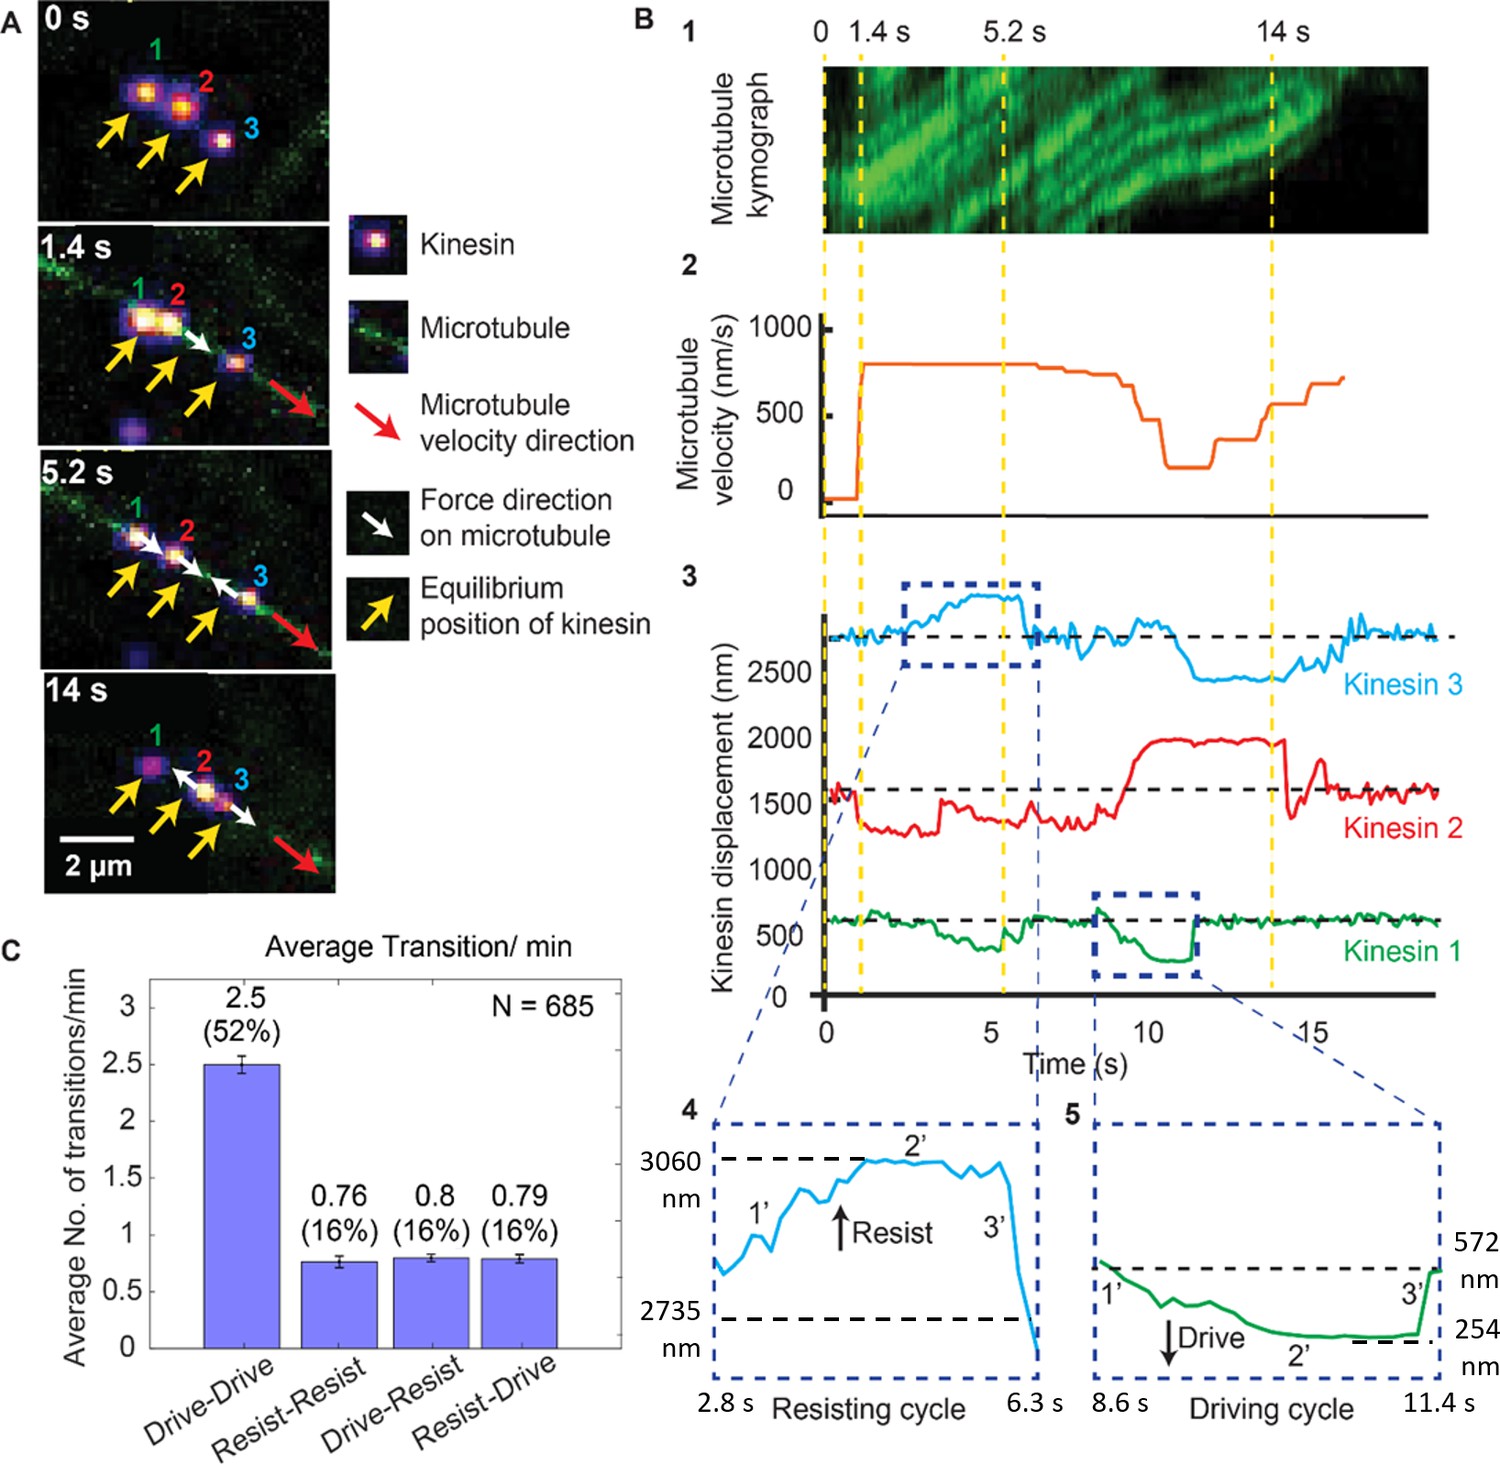
Dynamics of driving and resisting kinesins and their effect on microtubule velocity.
(A) One case of a force gliding assay is presented where three kinesins labeled with 705-nm QDs,marked 1, 2 and 3, move a labeled microtubule (green). Raw images at 0, 1.4, 5.2 and 14 sec taken every 0.1 sec (see Video 1) are shown. Yellow arrows show equilibrium kinesin positions. White arrows point along the direction of the force generated by kinesins on microtubule as they are displaced from their equilibrium positions. Red arrow shows the direction of microtubule movement. (B) Plots showing the microtubule kymograph and velocity, and kinesin positions over time. Time points 0, 1.4, 5.2, and 14 sec (corresponding to A) are marked with yellow vertical lines. Microtubule velocity (middle panel) starts from 0 nm/s at t = 0 sec, and increases to ~850 nm/s at frame 1.4 sec, when kinesin #2 starts driving (negative kinesin displacement). At 5.2 sec, kinesin #1 joins kinesin #2 to drive the microtubule, while kinesin #3 starts resisting. At 14 sec, kinesin #2 is resisting, kinesin #3 is driving and kinesin #1 is in equilibrium position. The fluctuation in kinesin displacement results from both Brownian motion and tracking error. Driving and resisting cycles are zoomed in for detail. Points 1’, 2’ and 3’ are transition regions. At positive/ negative slope of 1’ region, kinesin slow down (for resisting cycle) or speed up (for driving cycle) with respect to microtubule. At the zero slope of the 2’ region (plateau region), kinesin’s speed is the same as that of microtubule as DNA is fully stretched. At the 3’ region, kinesin returns to equilibrium. (C) The average number of transitions per minute. The major transition is from driving to driving.
Figure 2—figure supplement 1
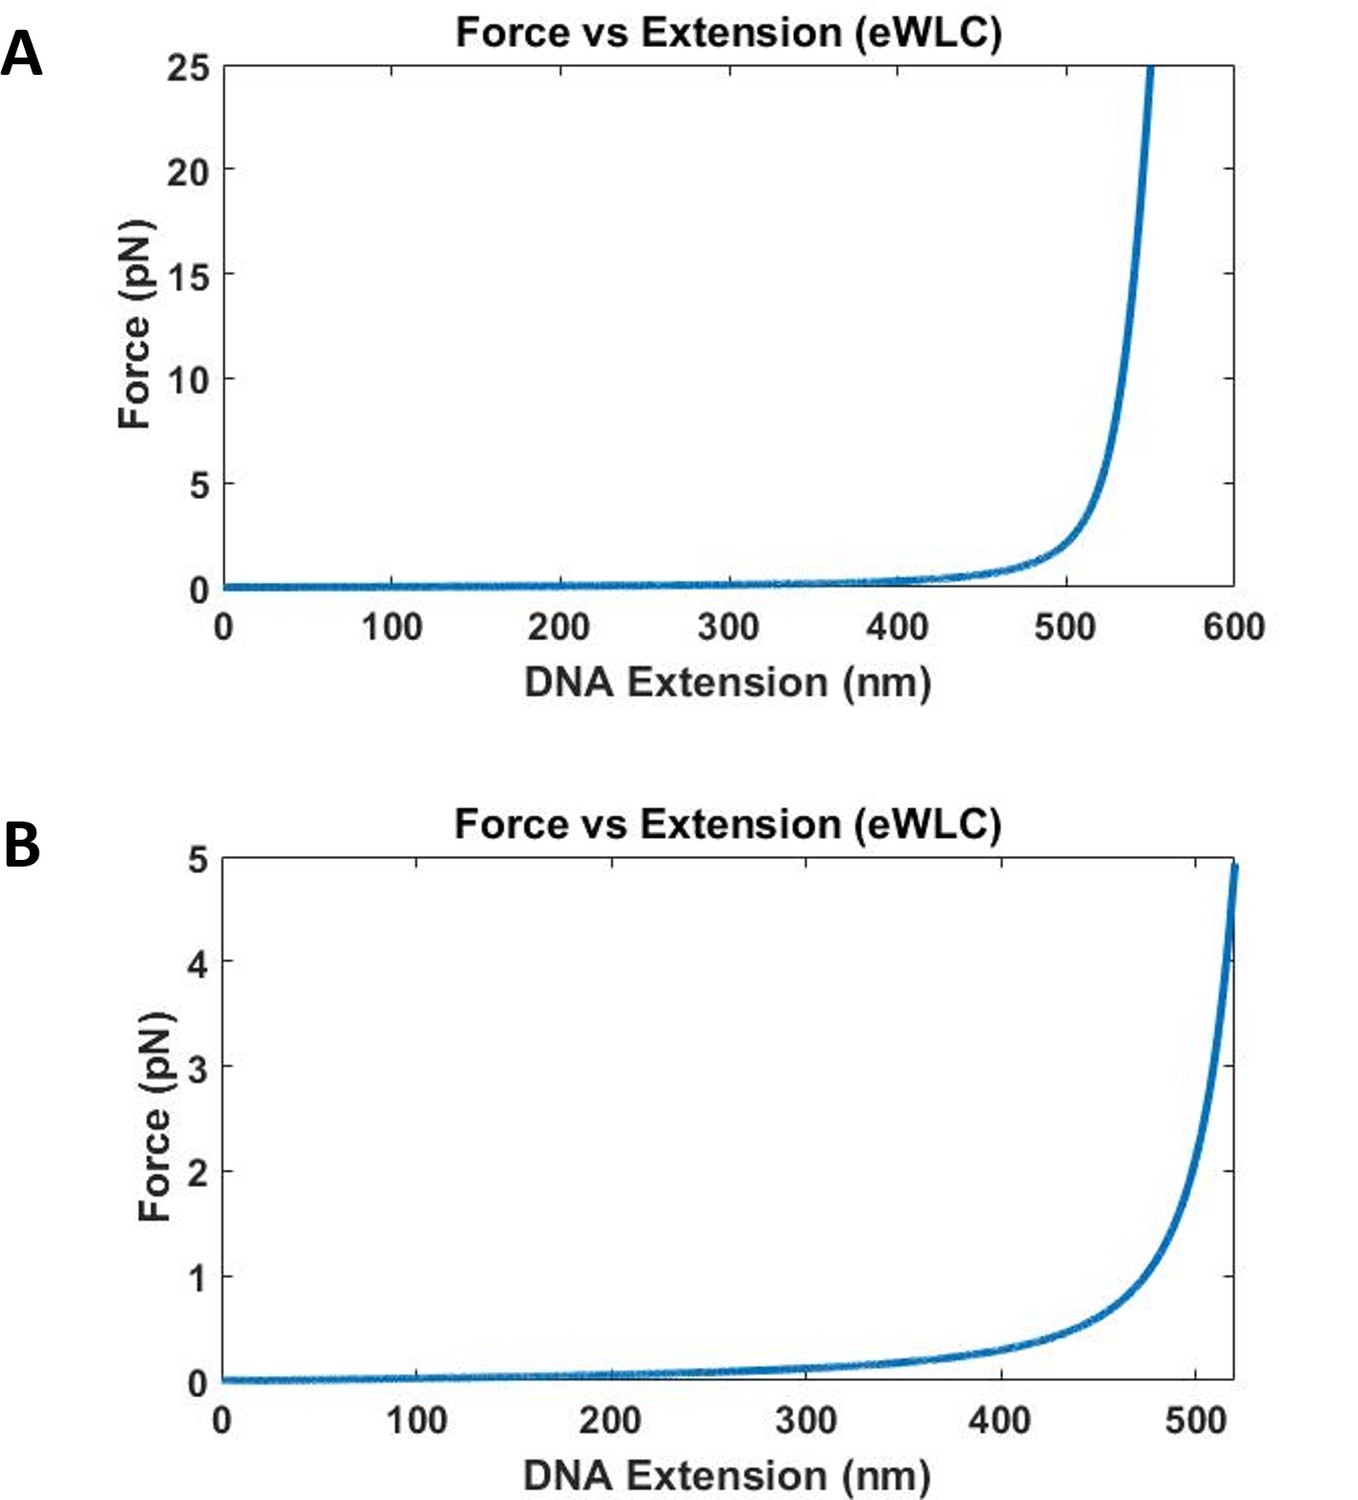
Force vs DNA extension of 1565 base DNA calculated using eWLC.
Contour length used is 532 nm, and a distance offset of 20 nm is used to account for size of quantum dot, proteins and other attachment agents. (A) Forces up to 25 pN for DNA extension up to 550 nm is plotted. The force increases very quickly as the DNA extension approaches the contour length of 532 nm. (B) Force up to 5 pN for DNA extension up to 520 nm is plotted.
Figure 3 with 1 supplement
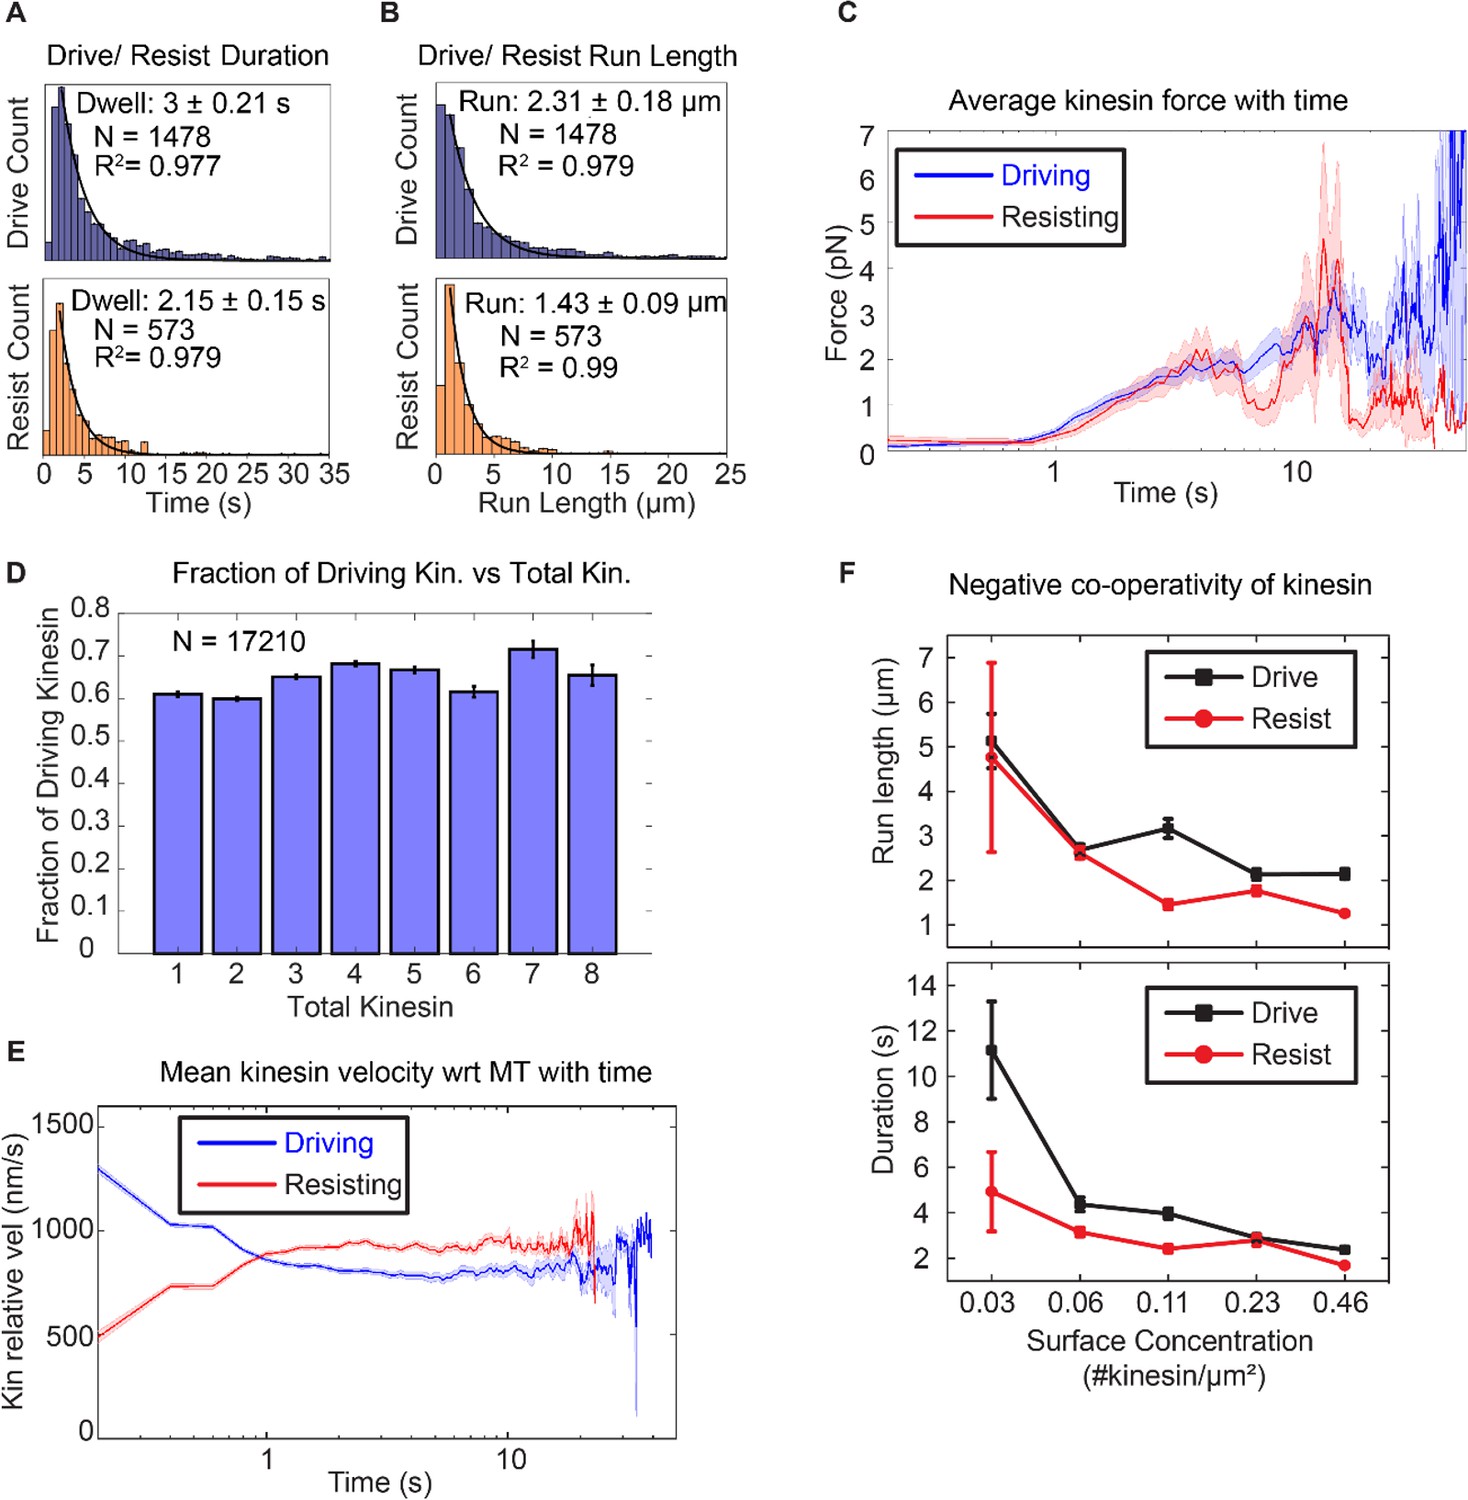
Asymmetric response of kinesin.
(A) and (B) Combining all the lifetimes (durations) and run lengths from 1478 driving and 573 resisting kinesins, driving kinesin stays attached approximately 40% longer and walks approximately 62% further than the resisting kinesin, showing that the resisting kinesin tends to detach more readily than the driving kinesin. (C) The average force exerted by driving/resisting kinesin over time increases from less than ~1 pN when it first binds (t < ~0.8 s) to ~3-4 pN at ~5 sec. Light blue and light red shadings are the standard error of the mean. A total of 1478 driving kinesins and 573 resisting kinesins were used to generate this graph. (D) The fraction of driving kinesins remains approximately constant at around ~65% as the number of kinesins attached to a microtubule increases. (E) The average velocity of kinesin relative to the microtubule is plotted for 1478 driving kinesins and 573 resisting kinesins (detailed derivation in Figure 4—figure supplement 4). Driving kinesins start at a higher relative velocity (~1300 nm/s) than resisting kinesins (~500 nm/s). This is due to natural variation in kinesin velocity, as at the start of motion kinesin feels negligible force from other kinesins (DNA is not stretched). Since driving and resisting kinesins transport the same microtubule, they eventually acquire the same speed. (F) The run length and duration of driving and resisting kinesins decrease as the kinesin surface concentration is increased from 0.03 to 0.46 kinesin/μm2 ; this shows that as more kinesins are involved in moving the microtubule, each kinesin stays attached to and walks on the microtubule for a shorter duration and run length. A total of 36, 215, 169, 440 and 618 driving kinesins and 13, 83, 86, 149 and 242 resisting kinesins are used to generate the points at 0.03 to 0.46 kinesin/ μm2 surface concentrations.
Figure 3—figure supplement 1
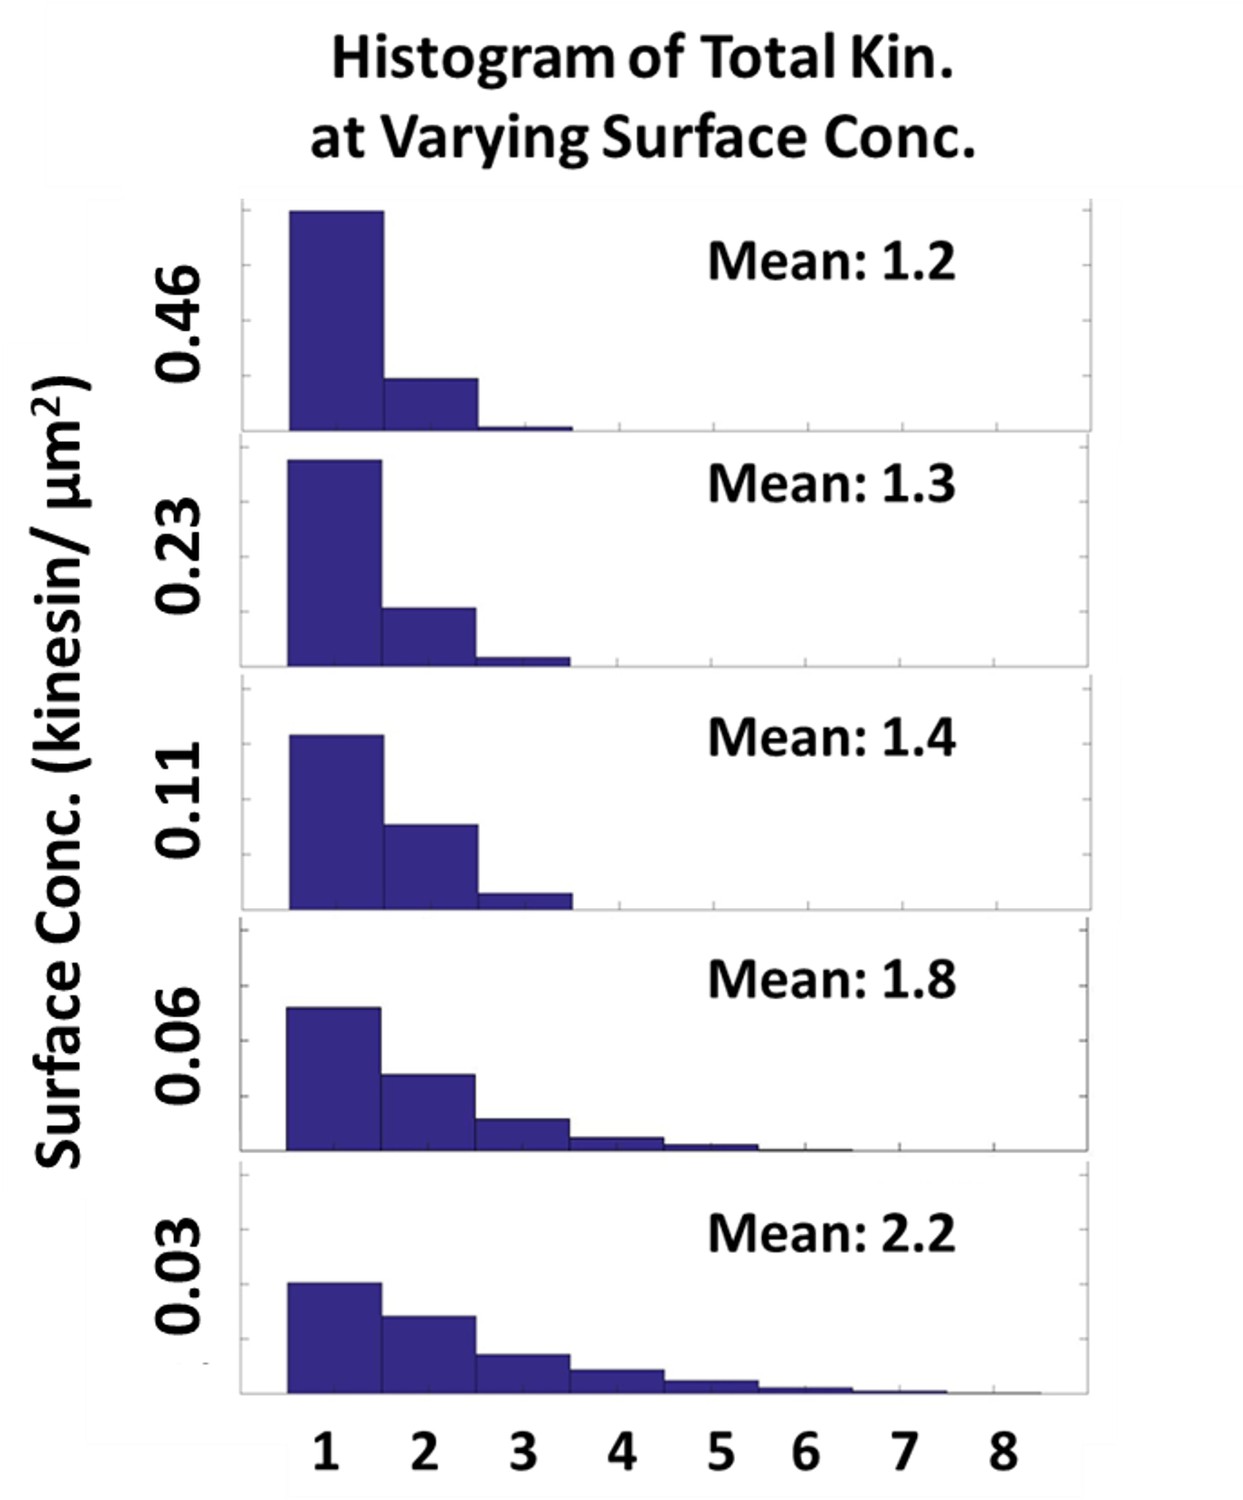
Effect of increasing kinesin surface concentration to the total number driving and resisting kinesin.
Histogram of the total number of kinesins driving and resisting the microtubule as the kinesin surface concentration increases from 0.03 to 0.46 kinesin/µm2 is plotted. As the surface concentration increases 16-fold from 0.03 to 0.46 kinesin/µm2, the number of kinesin driving and resisting increases by only 2-fold from 1.2 to 2.2.
Figure 4 with 4 supplements
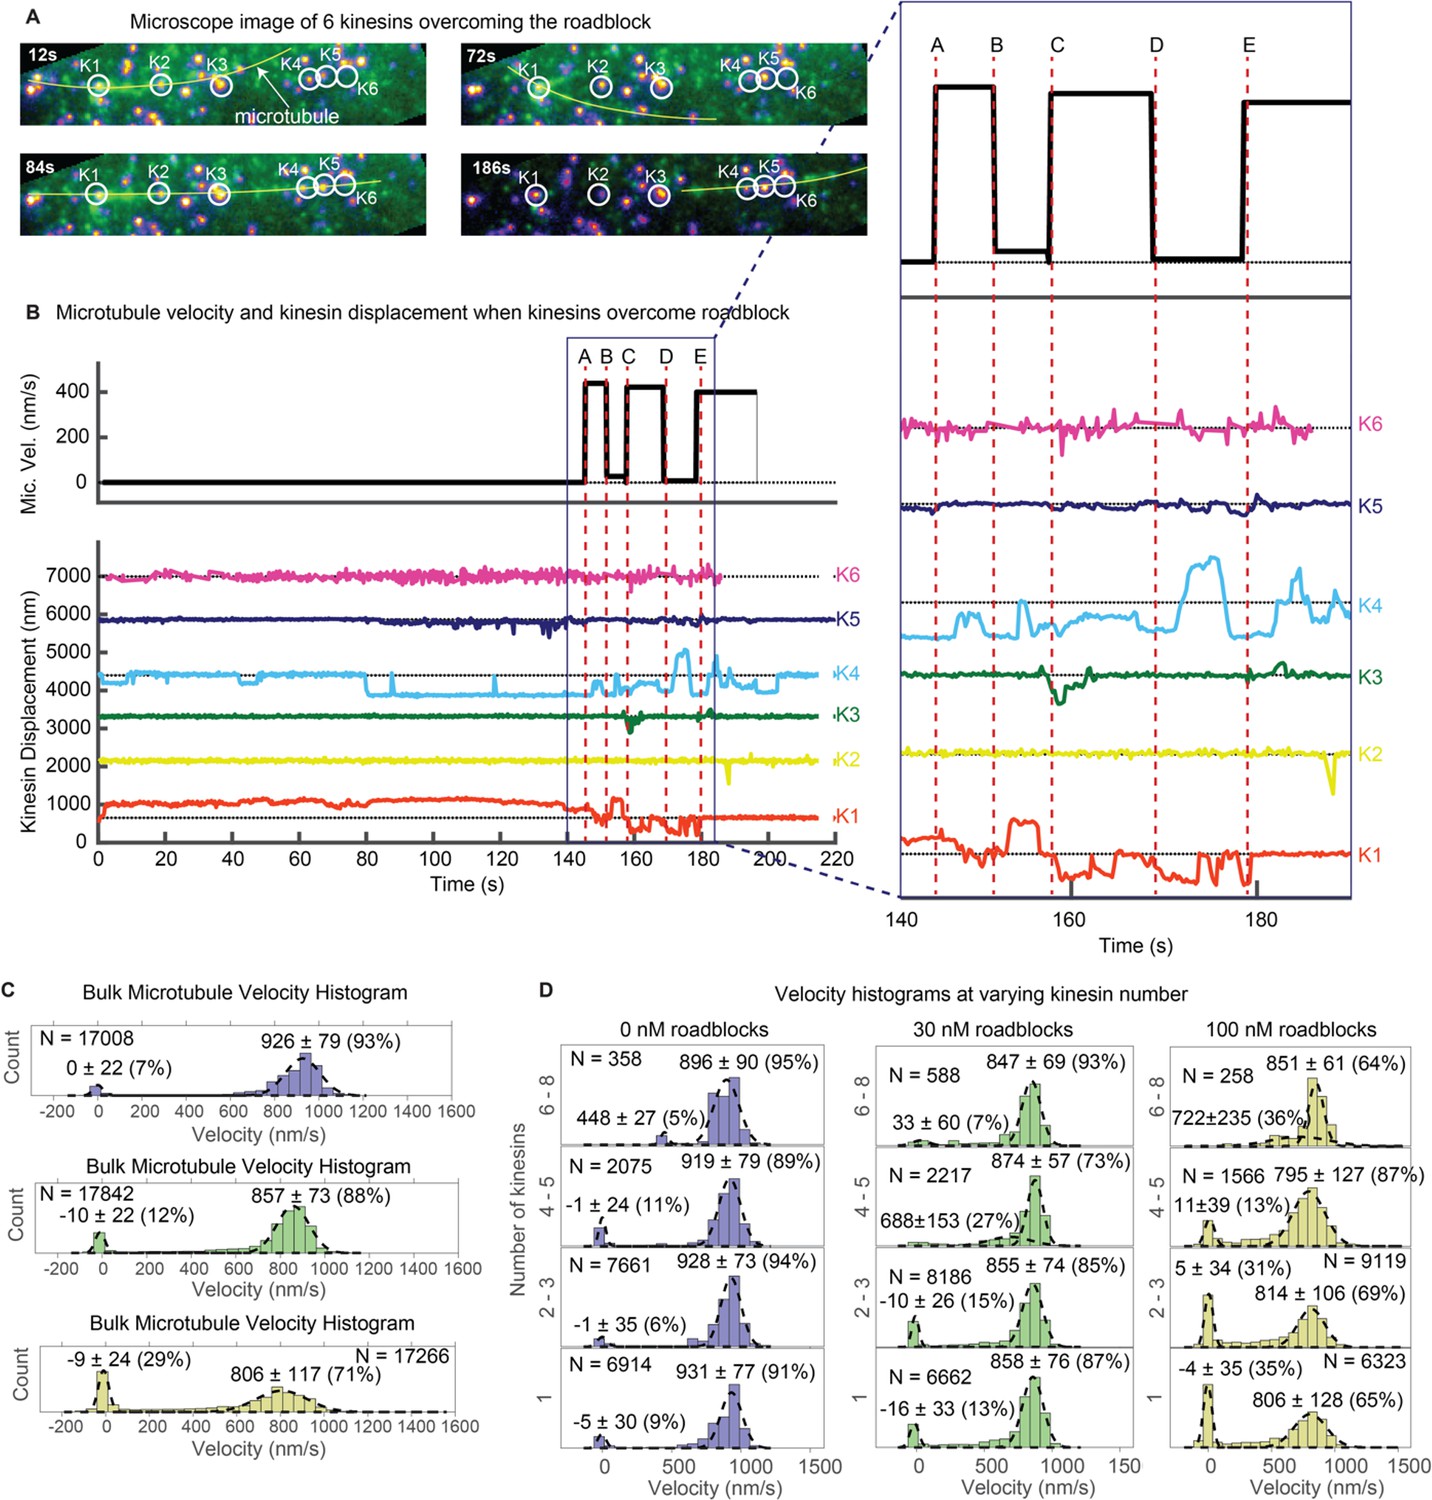
Multiple kinesins rescue stuck microtubule.
(A) Images where six kinesins dynamically interact to rescue the motion of a stuck microtubule are shown (see Video 5). Kinesin-QD705s are shown as yellowish-orange spots, and microtubules are shown in green and overlaid with yellow lines for clear visualization. Four images at different time points are shown. Kinesin 1 (K1) is initially stuck at a roadblock (a QD605 attached to the microtubule) and microtubule is fluctuating around K1 (t = 12 s to t = 72 s). At t = 84 s, K4 catches the microtubule and makes failed attempts to drive the stuck microtubule. In the process, K4 stretches and straightens the microtubule, which becomes aligned with four other kinesins. More kinesins then start to interact with the microtubule and rescue its motion (image at t = 186 s). (B) Microtubule velocity and the displacements of six kinesin-QDs are plotted. Six time points (A, B, C, D and E) are marked by dotted red vertical lines, and zoomed in on the right. At first, the microtubule is stuck when K1 runs into a QD placed on the microtubule. The microtubule then diffuses around before catching onto K4 at ~ 80 s. K4 alone is not successful in detaching K1 from the roadblock, and only after K5 joins K4 in driving the microtubule at ~ 130 s does K1 start escaping from the roadblock. K1, K3, and K4 then alternately drive the microtubule. (C) Bulk microtubule velocity histogram, showing two distinct velocity populations: stuck (at 0 nm/s) and fast (at > 400 nm/s). As roadblock concentration increases from 0 nM (blue) to 30 nM (green) to 100 nM (yellow), the proportion of stuck microtubule increases from 7% to 29%, while the velocity of fast microtubules decreases from 926 nm/s to 806 nm/s. (D) With the force-gliding assay, we can further classify how many kinesins move the microtubule. At higher number of kinesins, the proportion of stuck microtubule decreases, while the velocity of fast microtubules remains approximately constant. Fits to double Gaussians are shown in dotted black lines.
Figure 4—figure supplement 1
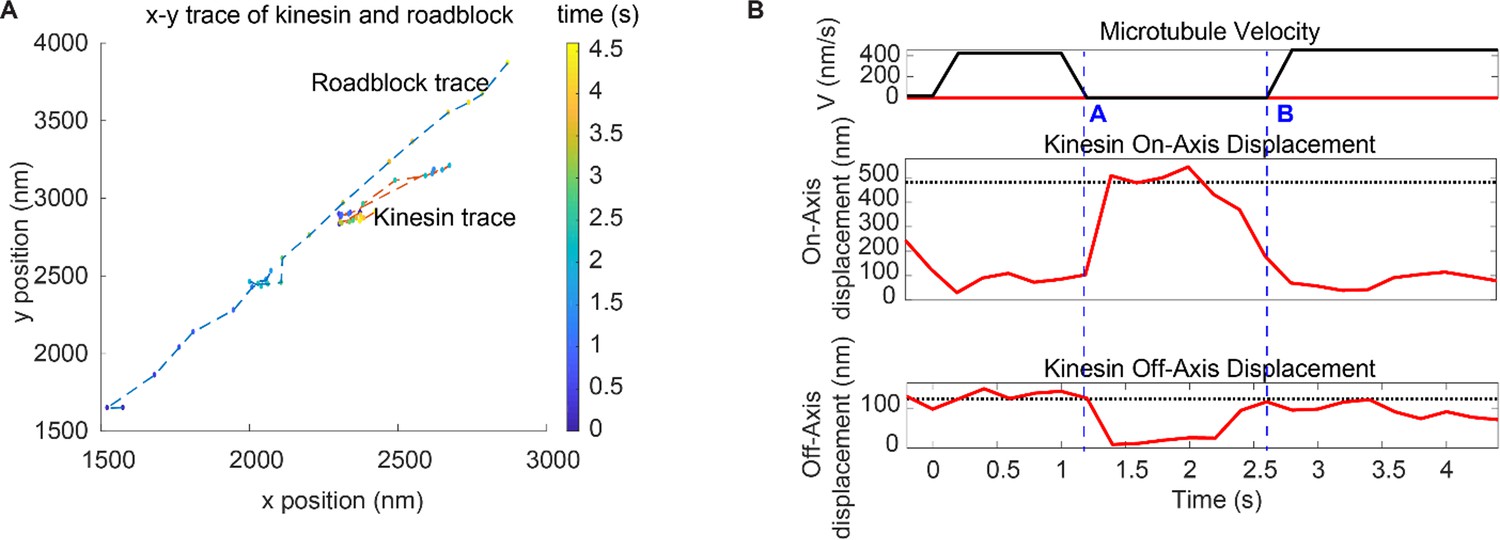
Detachment of kinesin upon encounter with a roadblock.
(A) Trajectory of a kinesin overcoming a roadblock in force-gliding assay. Roadblock (a QD attached on the microtubule) travels diagonally and collides with the kinesin. Kinesin fluctuates around its equilibrium position and, eventually, roadblock gets released and starts moving again. (See Video 2). (B) Microtubule velocity along with kinesin on-axis and off-axis displacement for the same case (Figure 4—figure supplement 1A case). We have marked two time points (A and B) with dashed blue lines. At 17 s, the kinesin is driving microtubule at 400 nm/s until it releases at point A as it encounters the roadblock. At point B, the kinesin rebinds and the microtubule speeds up. Kinesin’s displacement is mostly parallel to microtubule (on-axis, up to 400 nm), with slight off-axis displacement (~100 nm).
Figure 4—figure supplement 2
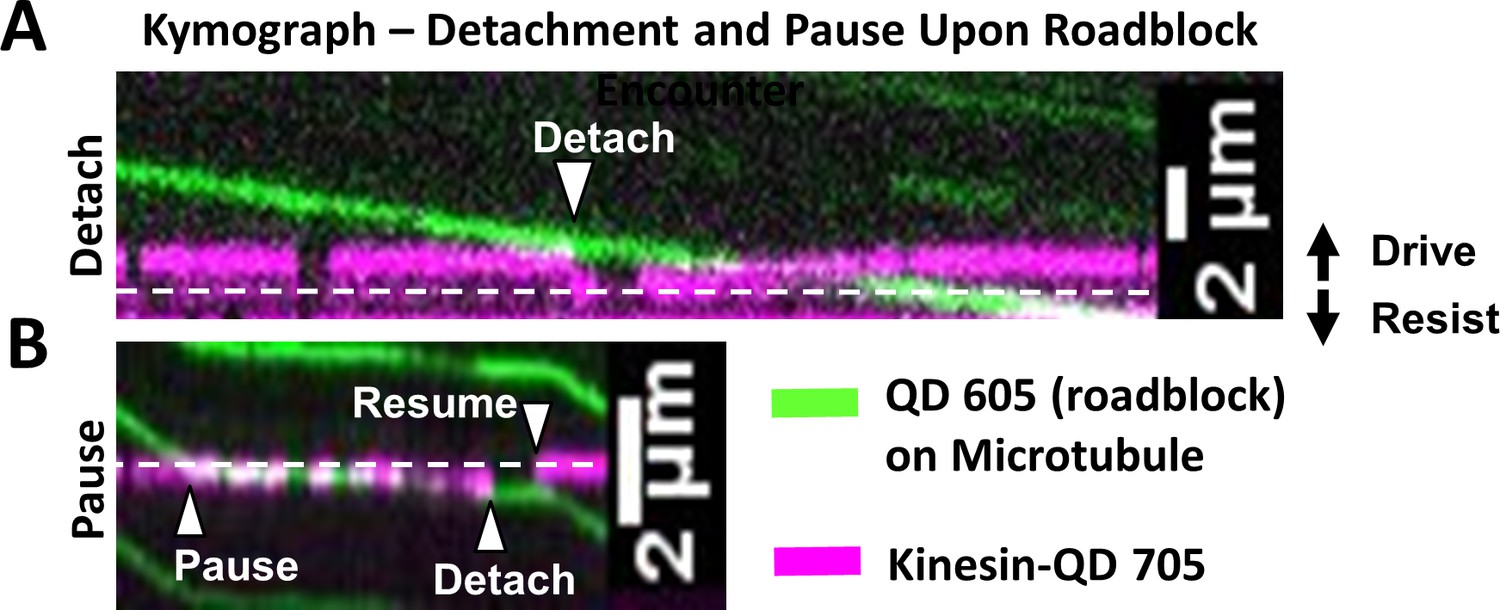
Kinesin detachment and pausing events upon roadblock encounter.
The equilibrium line at which no force is exerted by kinesin is shown as white dashed line. In this figure, the driving direction is upwards and resisting direction is downwards. Microtubule movement is downwards. (A) Kymograph (time at x-axis) showing detachment event (see Video 3) when kinesin-QD 705 (magenta) encounters roadblock (a QD 605, green) on microtubule. At the start of the kymograph, the microtubule moves downwards and kinesin-QD 705 drives the microtubule (shown by the magenta trace being above the equilibrium line). When the kinesin-QD705 hits the roadblock at ‘Detach’ arrow (when green and magenta kymograph intersect), kinesin detaches and springs down to its equilibrium position, before reattaching to microtubule and start driving again at later time. We find that we are more likely to observe detachment events when we lower ATP concentration to 40 µM. At 1 mM, we mostly observe pausing events, likely because the microtubule is moving fast enough that kinesin is pushed to a resisting position and stalls microtubule progress before it detaches, or the event takes place so fast that detachment appears as a pause. (B) Kymograph of pausing event (see Video 4). Kinesin-QD is initially at a slight resisting position (shown by the magenta trace being slightly below the equilibrium line) and the microtubule is moving downwards, driven by other kinesin(s). When kinesin-QD hits roadblock at the ‘Pause’ arrow, the microtubule stops moving until the kinesin-QD detaches at ‘Detach’ arrow, then resumes binding microtubule at ‘Resume’ arrow near its equilibrium position. Note: Side-stepping, which is cited as another possibility (Schneider et al., 2015), involves detachment then reattachment, and thus appears as a detachment event in our assay.
Figure 4—figure supplement 3
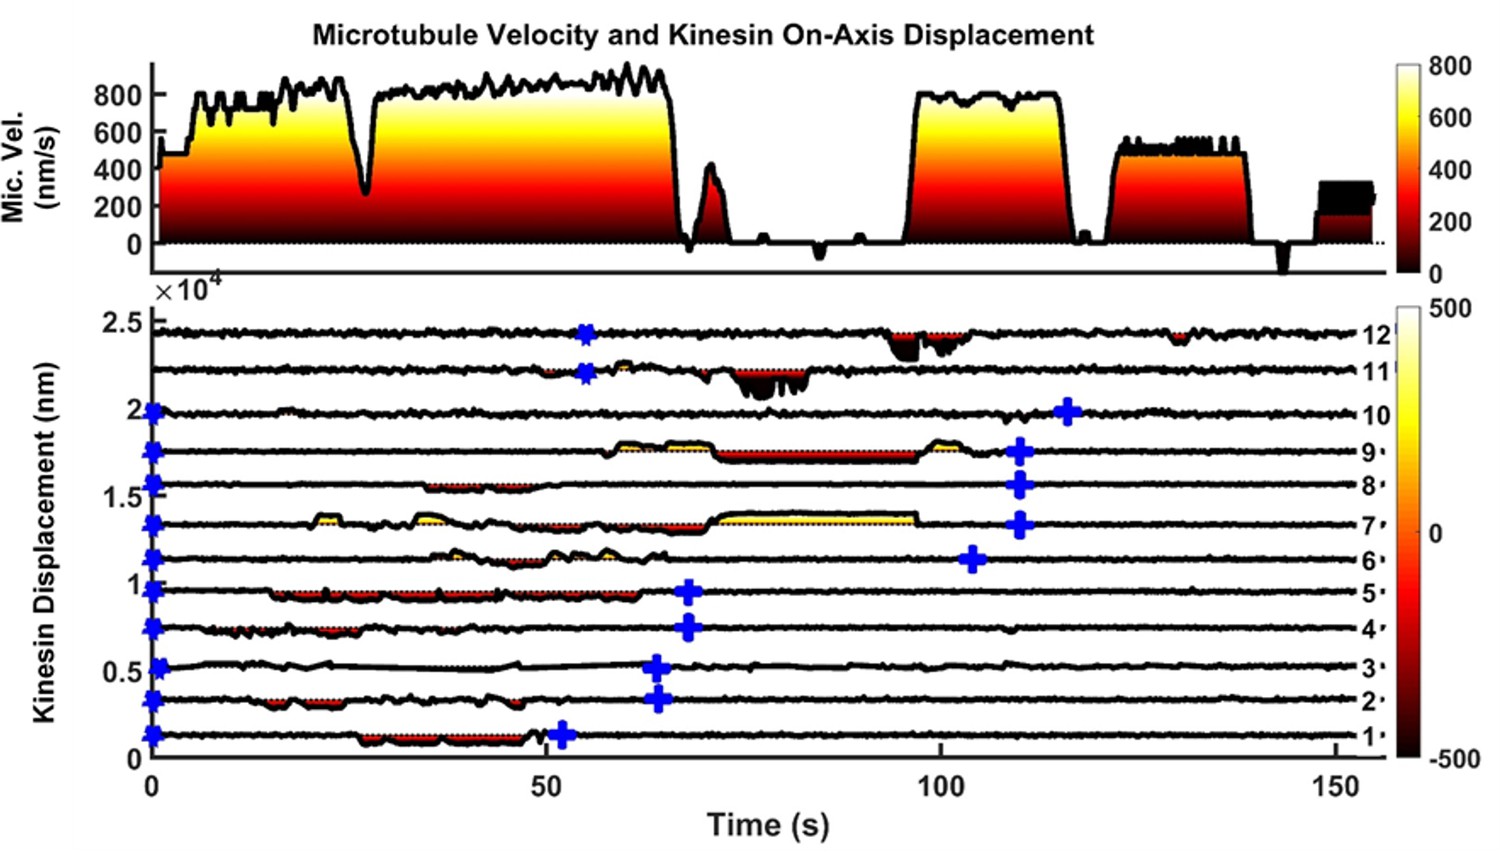
Another example of microtubule rescue by the actions of multiple kinesins.
Microtubule is driven by kinesins 1 to 9 initially until kinesin seven encounters roadblock on microtubule at t = 71 s. As soon as kinesin seven hits roadblock, kinesin 9, which was initially in resisting position (yellow shading on kinesin displacement graph), quickly took over the driving role (dark red shading on kinesin displacement graph). Kinesin 11 followed suit and started driving ~ 2 s after kinesin 9, but detached at t = 84 s. Kinesin 12 then joined kinesin nine to drive microtubule at t = 93 s, and this time the two of them manage to detach kinesin seven from microtubule, allowing microtubule to resume movement at t = 97 s.
Figure 4—figure supplement 4
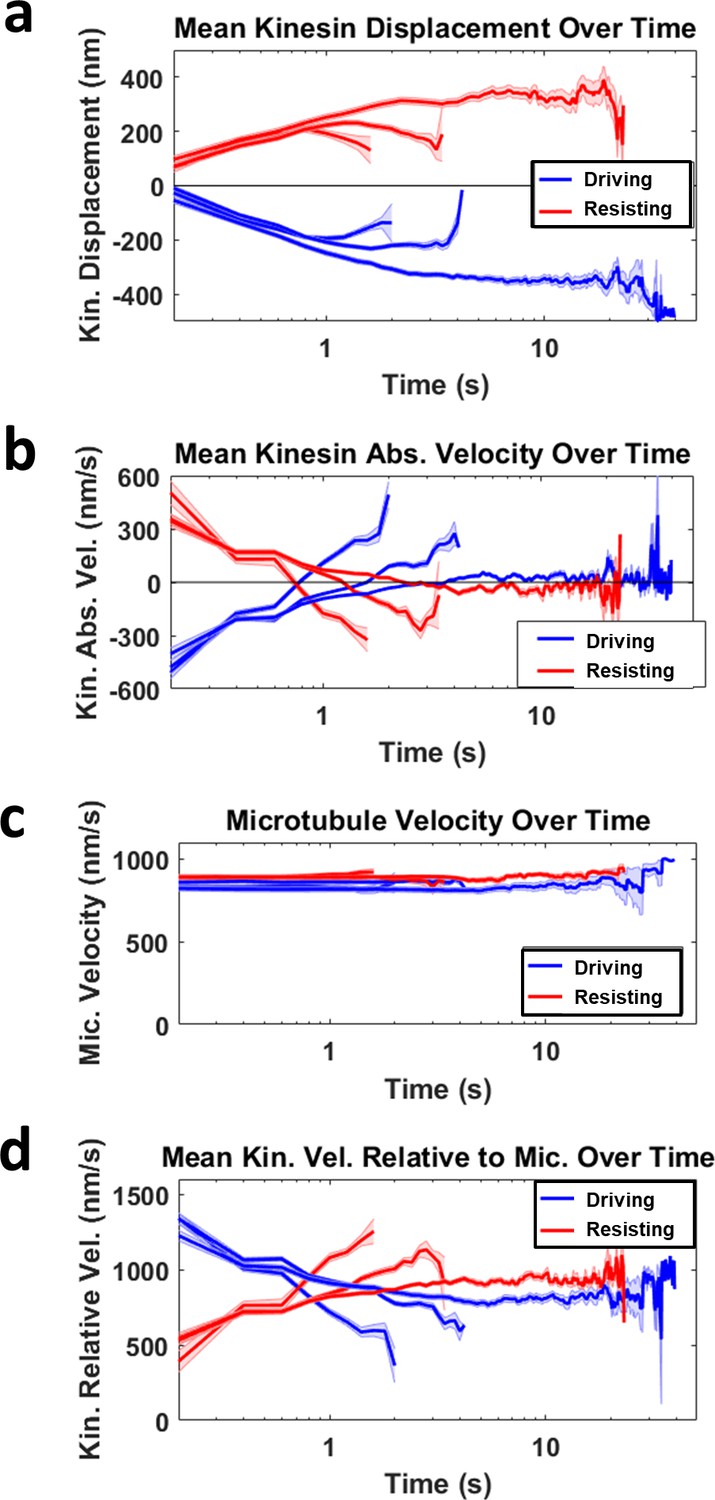
Deriving mean kinesin velocity relative to microtubule.
(a) The mean kinesin displacement over time is shown for three groups of kinesin sorted based on the duration of it driving (blue) or resisting (red). The shortest group has a duration up to ~ 2 s, followed by the second longest group with duration up to ~ 4 s, and the longest group stays attached to microtubule up to ~ 40 s. Light blue and red shading for all graphs refer to the standard error of the mean. (b) The mean kinesin absolute velocity over time is the first derivative of the mean kinesin displacement over time shown in a. Notice that all the graphs in b cross the zero velocity line at the turning point of the graphs in a, when kinesins start to detach or return to equilibrium. This is the reason why the mean driving and resisting kinesin velocity relative to microtubule intersect in d. (c) Mean microtubule velocity over time for all the three driving and resisting groups. The microtubule velocities range between 800–900 nm/s and the mean of the groups are approximately constant over time. (d) The mean kinesin velocity relative to microtubule over time is calculated by subtracting the microtubule velocity over time (c) with the mean kinesin velocity over time (b). Combining and averaging each of the three driving and resisting graphs will give the overall mean kinesin velocity relative to microtubule over time, as shown in Figure 3E.
Figure 5 with 4 supplements
Force augmentation by kinesins.
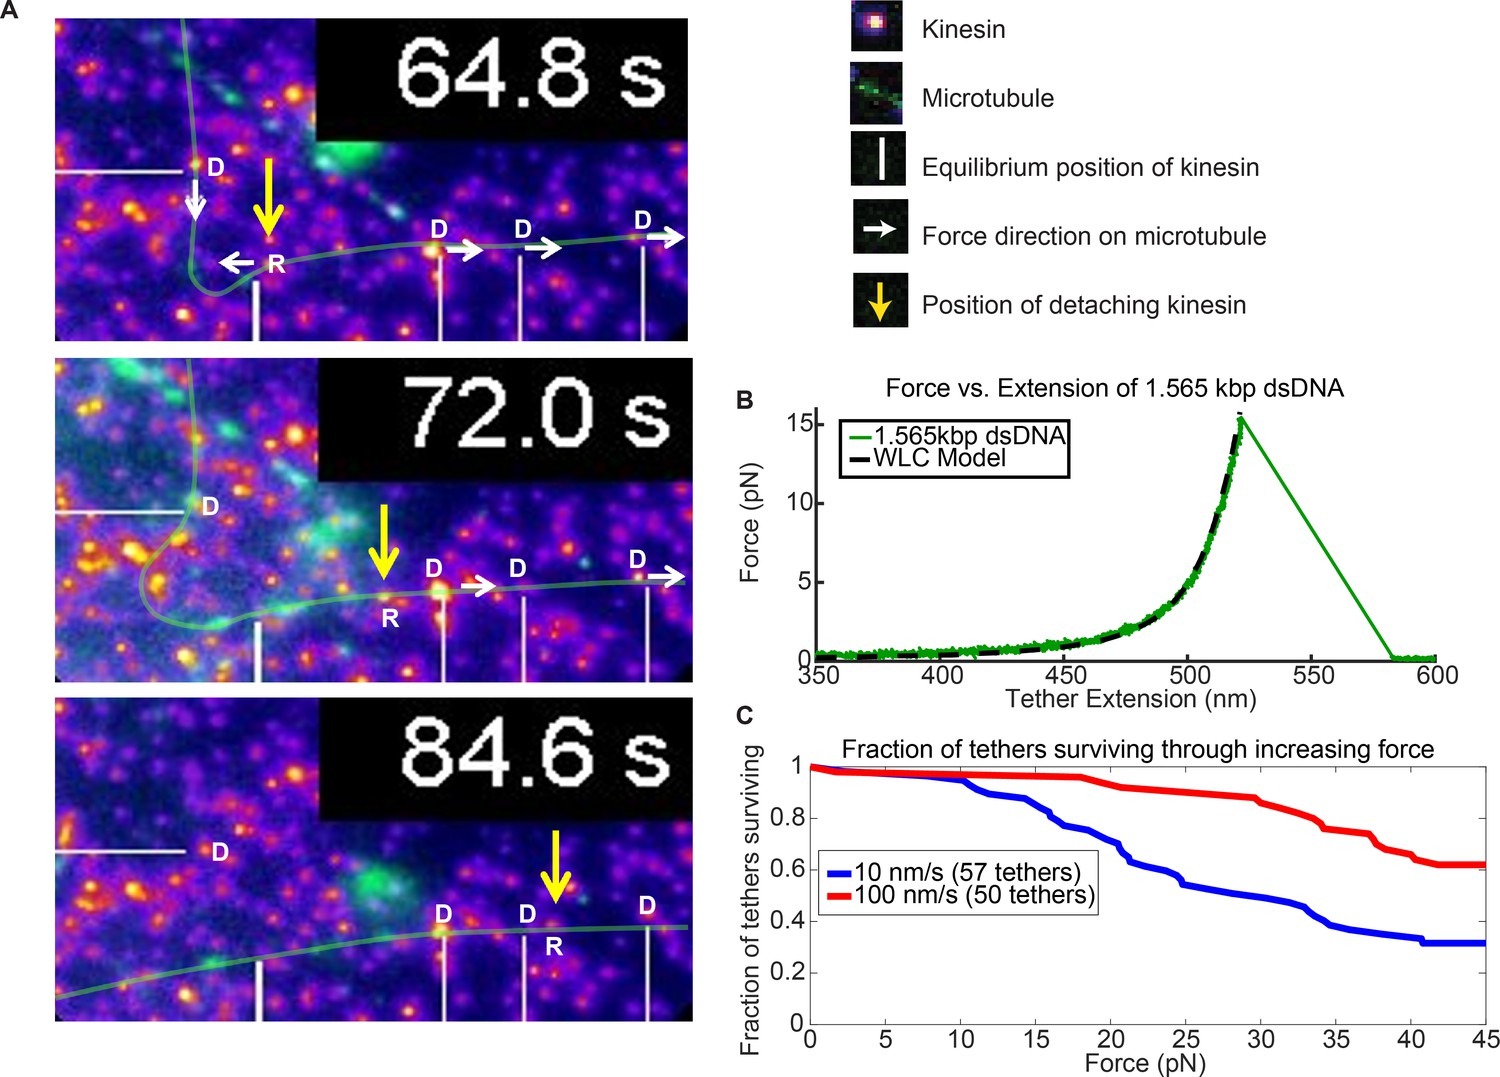
(A) Movie snapshots from Video 6 showing 4 driving kinesins (depicted by letter D) and 1 resisting kinesin (depicted by letter R) moving a microtubule. At 64.8 s, the microtubule approached resisting kinesin but at 72.0 s and 84.6 s the resisting kinesin has broken free of its attachment to the coverslip by the combined forces of the 4 driving kinesins and is carried along with the microtubule. Yellow arrow shows the position the resisting kinesin that was detached from the coverslip. (B) Typical force extension curve of a single 1,565 kbp dsDNA obtained through a dual optical trap experiment. The digoxigenin:anti-digoxigenin bond is the weakest link holding the kinesin-DNA to the coverslip. The rupture force in this example is ~15 pN, when the DNA extension is ~520 nm. (C) Survival probability plot for rupture force for the DNA assembly. The force indirectly represents the force production by multiple motors.
Figure 5—figure supplement 1

Dual optical trap assay to measure the rupture force for digoxigenin:anti-digoxigenin interaction.
Two polystyrene beads are bound to the opposite ends of 1,565 bp DNA through biotin-streptavidin linkage and digoxigenin:anti-digoxigenin linkage, which is the weaker of the two. The beads are captured in optical traps and are pulled away from one another until the digoxigenin:anti-digoxigenin linkage ruptures.
Figure 5—figure supplement 2
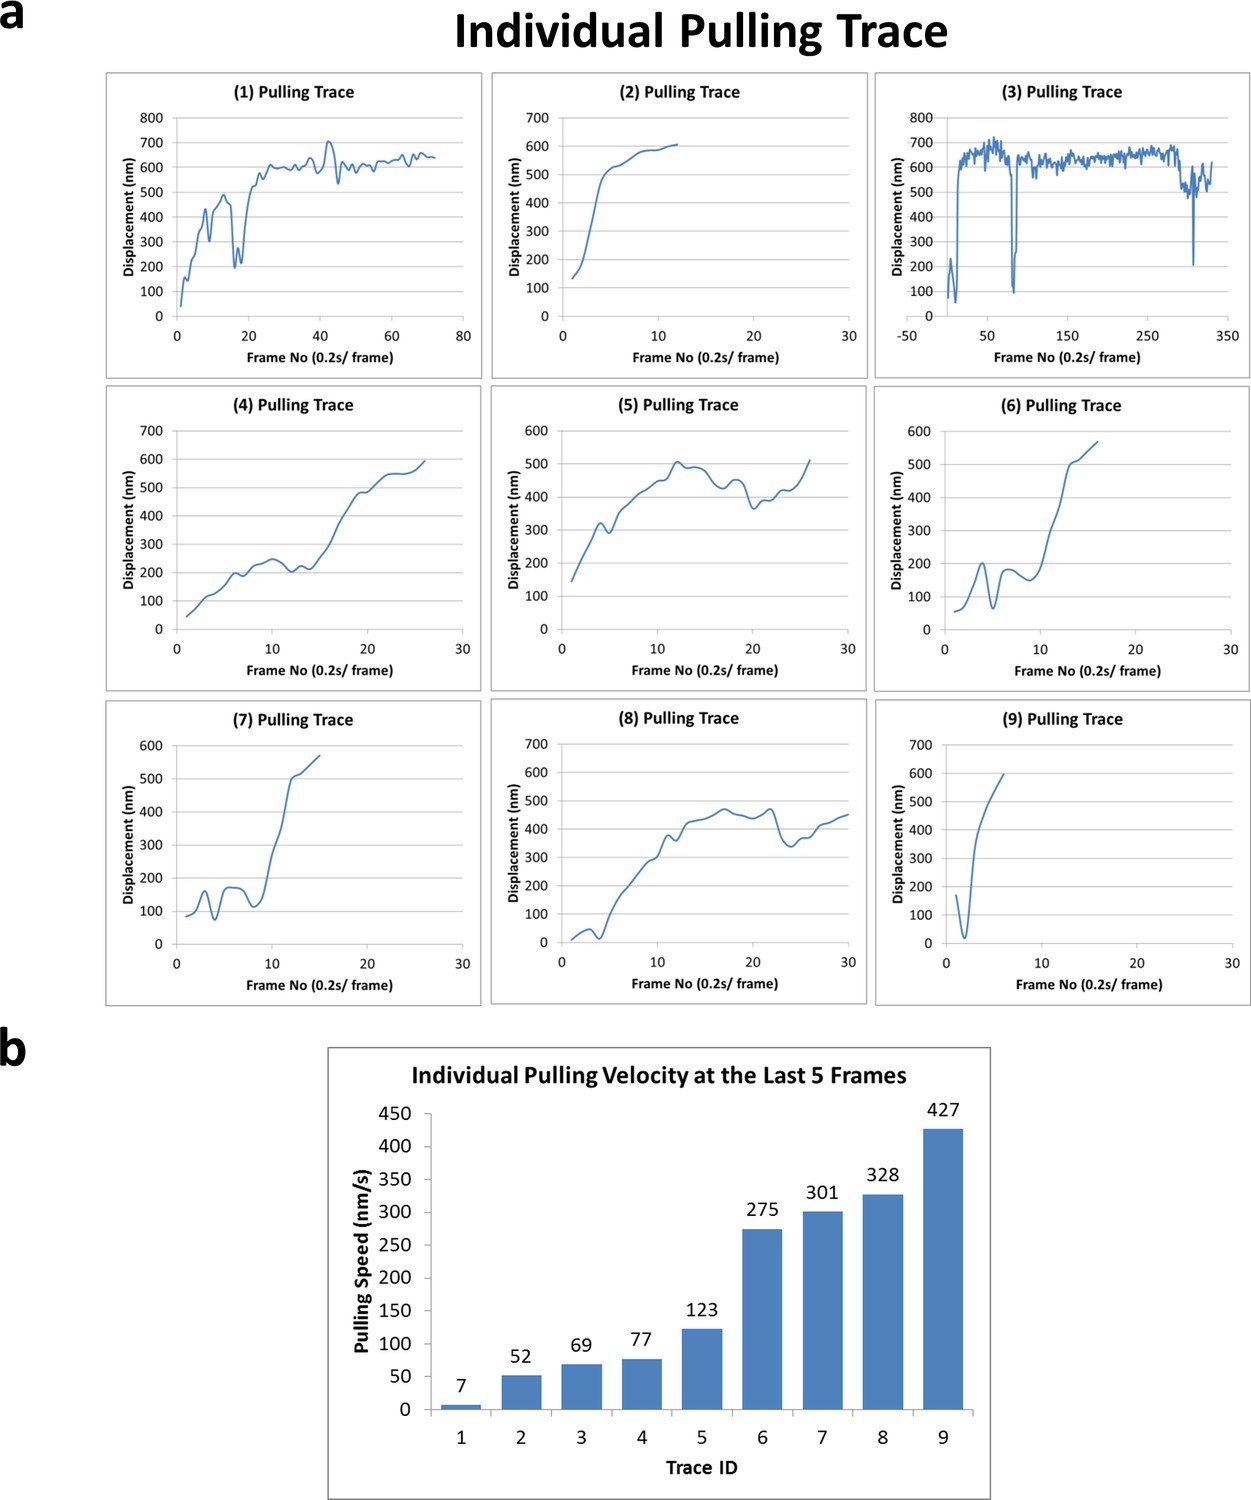
Forced detachment traces and velocities.
(a) Nine pulling traces right before forced detachment of kinesin-QD, rupturing supposedly the weakest link in the coverslip-DNA-QD-kinesin interaction, which is the digoxigenin:anti-digoxigenin interaction. (b) The velocities of the last five frames before the forced detachment for all nine traces. The velocities (of kinesin relative to the glass coverslip) vary from 7 nm/s to 427 nm/s.
Figure 5—figure supplement 3

Tension range between multiple motors.
(A) We find that the tension between multiple motors range between 0 to 4 pN. The average is around 1.58 pN for driving kinesins and 1.17 pN for resisting kinesins. 90% of the forces are between 0 to 2.5 pN for driving kinesins and 0 to 2 pN for resisting kinesins. 95% of the forces are between 0 to 9 pN for driving kinesins and 0 to 5.5 pN for resisting kinesins. In our assay, the kinesins are linked to the coverslip through very flexible DNA. This flexible DNA, which acts as a nonlinear spring following eWLC model (Figure 2—figure supplement 1), may have allowed kinesins to spend longer time at low force regime. (B) Simulation result on tension between kinesins from Arpağ et al. (2014). What is directly comparable to Figure 5—figure supplement 3A is the instantaneous force (red). Negative force refers to the force felt by driving kinesin, while positive force refers to that felt by resisting kinesin. The kinesin tether is modeled with a cable-like spring, specifically an elastic tether with zero stiffness up to 40 nm extension and a 0.2 pN/nm elasticity beyond that. As such, the tether used in the simulation by Arpağ et al. is stiffer than the DNA we used. They find that the force range is wider, from ~−10 pN to 15 pN.
Figure 5—figure supplement 4
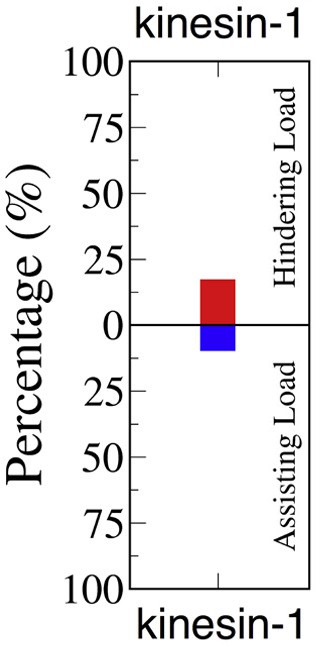
Fraction of kinesin resisting from Arpağ et al. (2014).
Using simulation, Arpağ et al. found that approximately 14% of all kinesins are under hindering load (which means they are in driving position), and 7% are under assisting load (which means they are in resisting position). Thus, considering only the productive kinesins (either in driving or resisting state), the resisting kinesins make up one-third of the total productive kinesins.
Figure 6
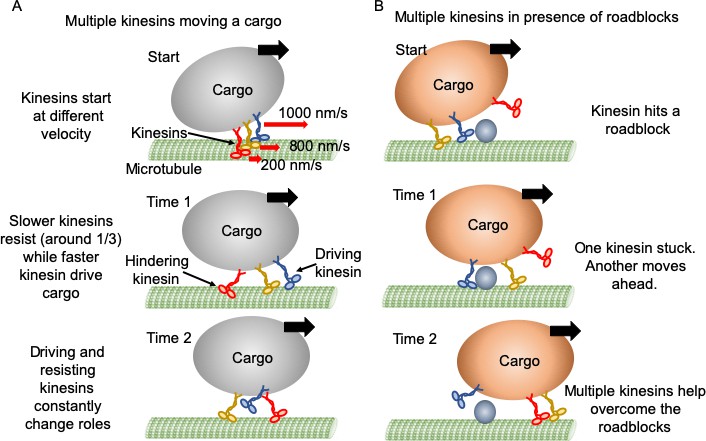
Mechanism of multiple kinesin based transport.
(A) When working in a group, different kinesins may have different velocities while starting. Red arrows represent the initial velocity values of different kinesins. Thick black arrows represent the cargo velocity direction. At 'Time 1', faster kinesins will drive, while slower kinesins will resist the cargo motion. On average, one third of kinesins are resisting. Even though a resisting kinesin starts slower, eventually it reaches the same velocity as driving kinesins as it feels forward tension. At 'Time 2', kinesins candetach and switch dynamically between driving and resisting. Blue kinesin has detached from its driving position and red kinesin has shifted from resisting to driving position. Resisting kinesins spend a shorter duration on the microtubule before detaching compared to driving kinesins. Overall, a resisting kinesin presents little resistance to the forward motion when there is no roadblock, as it detaches 33% faster than driving kinesins. (B) In the presence of roadblocks, kinesins can get stuck at the roadblock (blue kinesin at 'Start' and 'Time 1'). One kinesin (purple at 'Time 1') may not generate enough tension to cause detachment of a resisting kinesin. However, additional kinesin(s) (red at 'Time 2') driving the cargo can generate enough force to rescue their stuck partner to resume cargo transport.
Videos
Video 1
Three kinesins moving a microtubule.
Video 2
Kinesin detaches upon roadblock encounter.
Video 3
Kinesin detaches upon roadblock encounter - example 2.
Video 4
Kinesin pauses upon roadblock encounter.
Video 5
Multiple kinesins help one resisting kinesin get unstuck from roadblock on microtubule.
Video 6
Forced detachment of a resisting kinesin by multiple other kinesins.
Video 7
Image registration tutorial.
Video 8
Force-gliding analysis tutorial.
Tables
Key resources table
| Reagent type (species) or resource | Designation | Source or reference | Identifiers | Additional information |
|---|---|---|---|---|
| Peptide, recombinant protein | Truncated kinesin with 888 amino acids (K888) | Kathy Trybus lab (Tjioe et al., 2018) | ||
| Chemical compound, drug | Qdot 655 Streptavidin Conjugate | ThermoFisher Scientific | Cat. # Q10123MP | |
| Chemical compound, drug | Qdot 705 Streptavidin Conjugate | Thermo Fisher Scientific | Cat. # Q10163MP | |
| Chemical compound, drug | THP | EMD Millipore | Cat. # 71194 | |
| Chemical compound, drug | Paclitaxel | Cytoskeleton, Inc | Cat. # TXD01 | |
| Chemical compound, drug | Adenosine 5′-triphosphate magnesium salt | Sigma Aldrich | Cat. # A9187 | |
| Chemical compound, drug | GMPCPP (Guanosine-5’-[(α,β)-methyleno]triphosphate, Sodium salt) | Jena Bioscience | Cat. # NU-405S | |
| Chemical compound, drug | AMP-PNP (Adenylyl- imidodiphosphate) | Sigma Aldrich | Cat. # 10102547001 | |
| Chemical compound, drug | Aminosilane (N-(2-Aminoethyl)−3-Aminopropyltrimethoxysilane) | United Chemical Technologies | Cat. # A0700 | |
| Chemical compound, drug | Biotin-PEG- Succinimidyl Valerate, MW 5,000 | Laysan Bio, Inc | Item# BIO-PEG-SVA-5K-100MG | |
| Chemical compound, drug | mPEG-Succinimidyl Valerate, MW 2,000 | Laysan Bio, Inc | Item# MPEG-SVA-2000–1 g | |
| Software, algorithm | Matlab code used for analysis | This paper | Provided as Source code 1. | |
| Software, algorithm | TrackMate in Fiji | ImageJ (https://imagej.net/Fiji/Downloads) | ||
| Software, algorithm | ImageJ (Fiji) | ImageJ (http://imagej.nih.gov/ij/) | ||
| Software, algorithm | Matlab | Matlab (https://www.mathworks.com/products/matlab.html) |
Additional files
-
Source code 1
Matlab code for force-gliding analysis.
- https://cdn.elifesciences.org/articles/50974/elife-50974-code1-v3.zip
-
Transparent reporting form
- https://cdn.elifesciences.org/articles/50974/elife-50974-transrepform-v3.docx
Download links
A two-part list of links to download the article, or parts of the article, in various formats.
Downloads (link to download the article as PDF)
Open citations (links to open the citations from this article in various online reference manager services)
Cite this article (links to download the citations from this article in formats compatible with various reference manager tools)
Multiple kinesins induce tension for smooth cargo transport
eLife 8:e50974.
https://doi.org/10.7554/eLife.50974


