Rank orders and signed interactions in evolutionary biology
- American University, United States
Figures
Figure 1
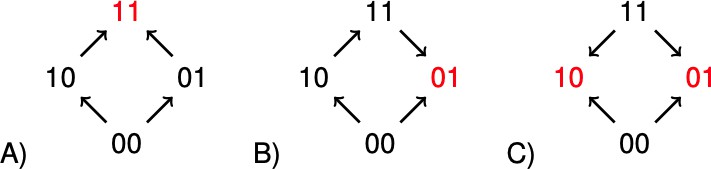
The graphs illustrate (A) no sign epistasis, (B) sign epistasis, and (C) reciprocal sign epistasis.
The peaks are marked red. Under the assumption that 00 has minimal fitness, and that the genotypes are positioned as in the figure, the three types can be characterized as graphs with no arrows down, one arrow down, or two arrows down.
Figure 2
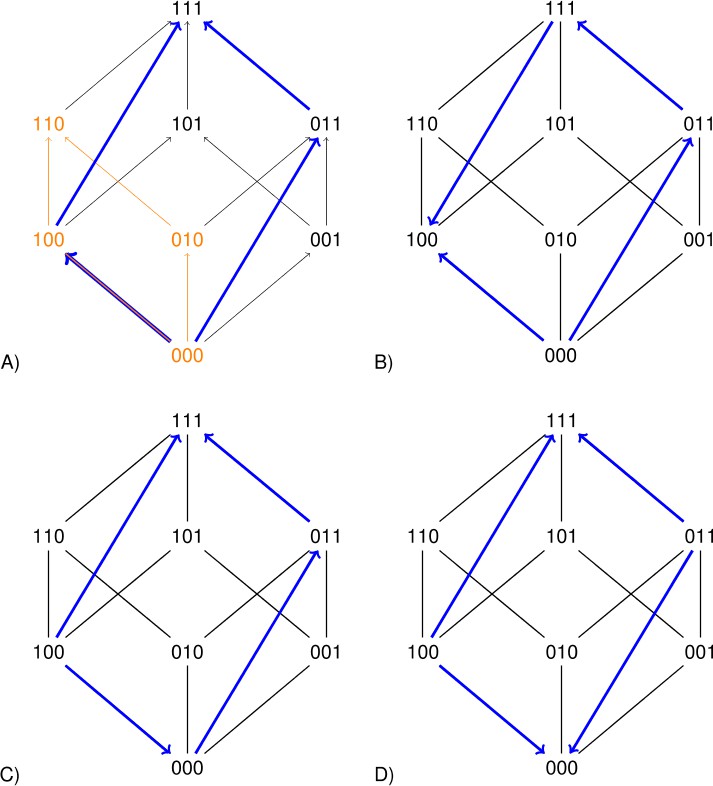
Each arrow points toward the genotype of higher fitness.
The undirected edges connect mutational neighbors and carry no information about fitness differences. The graph 2A is compatible with additive fitness. The other graphs are not compatible with additive fitness because at least one pair of parallel arrows point in different directions. The lower graphs indicate sign epistasis, as is clear from the short arrows. The right graphs indicate size two perturbations, as is clear from the long arrows.
Figure 3

The fitness landscapes are additive and each mutation decreases fitness.
The graphs compare replacements and . Because of measurement errors, some replacements appear to increase fitness. The graphs show the proportion of such cases.
Tables
Table 1
Rectangular perturbations for drug-exposed and drug-free malaria fitness landscapes.
The third line shows the total number of expressions checked. The prevalence of sign epistasis is similar for the landscapes, whereas the remaining perturbations differ by a factor of two.
| Perturbation size | 1 | 2 | 3 | Size (1-3) |
|---|---|---|---|---|
| Drug-exposed | 55 | 21 | 5 | 81 |
| Drug-free | 54 | 39 | 9 | 102 |
| Expressions checked | 112 | 72 | 16 | 200 |
Table 2
Order perturbations of size 1 and 2 for Methylobacterium extorquens.
The landscape has no sign epistasis. However, perturbations of size 2 reveal that the landscape is not additive.
| Perturbation of size | 1 | 2 |
|---|---|---|
| Number of perturbations | 0 | 3 |
| Expressions checked | 112 | 72 |
Additional files
Download links
A two-part list of links to download the article, or parts of the article, in various formats.
Downloads (link to download the article as PDF)
Open citations (links to open the citations from this article in various online reference manager services)
Cite this article (links to download the citations from this article in formats compatible with various reference manager tools)
Rank orders and signed interactions in evolutionary biology
eLife 9:e51004.
https://doi.org/10.7554/eLife.51004


