Can sleep protect memories from catastrophic forgetting?
- Department of Medicine, University of California, San Diego, United States
- Department of Computer Science and Engineering, University of California, San Diego, United States
Figures
Figure 1
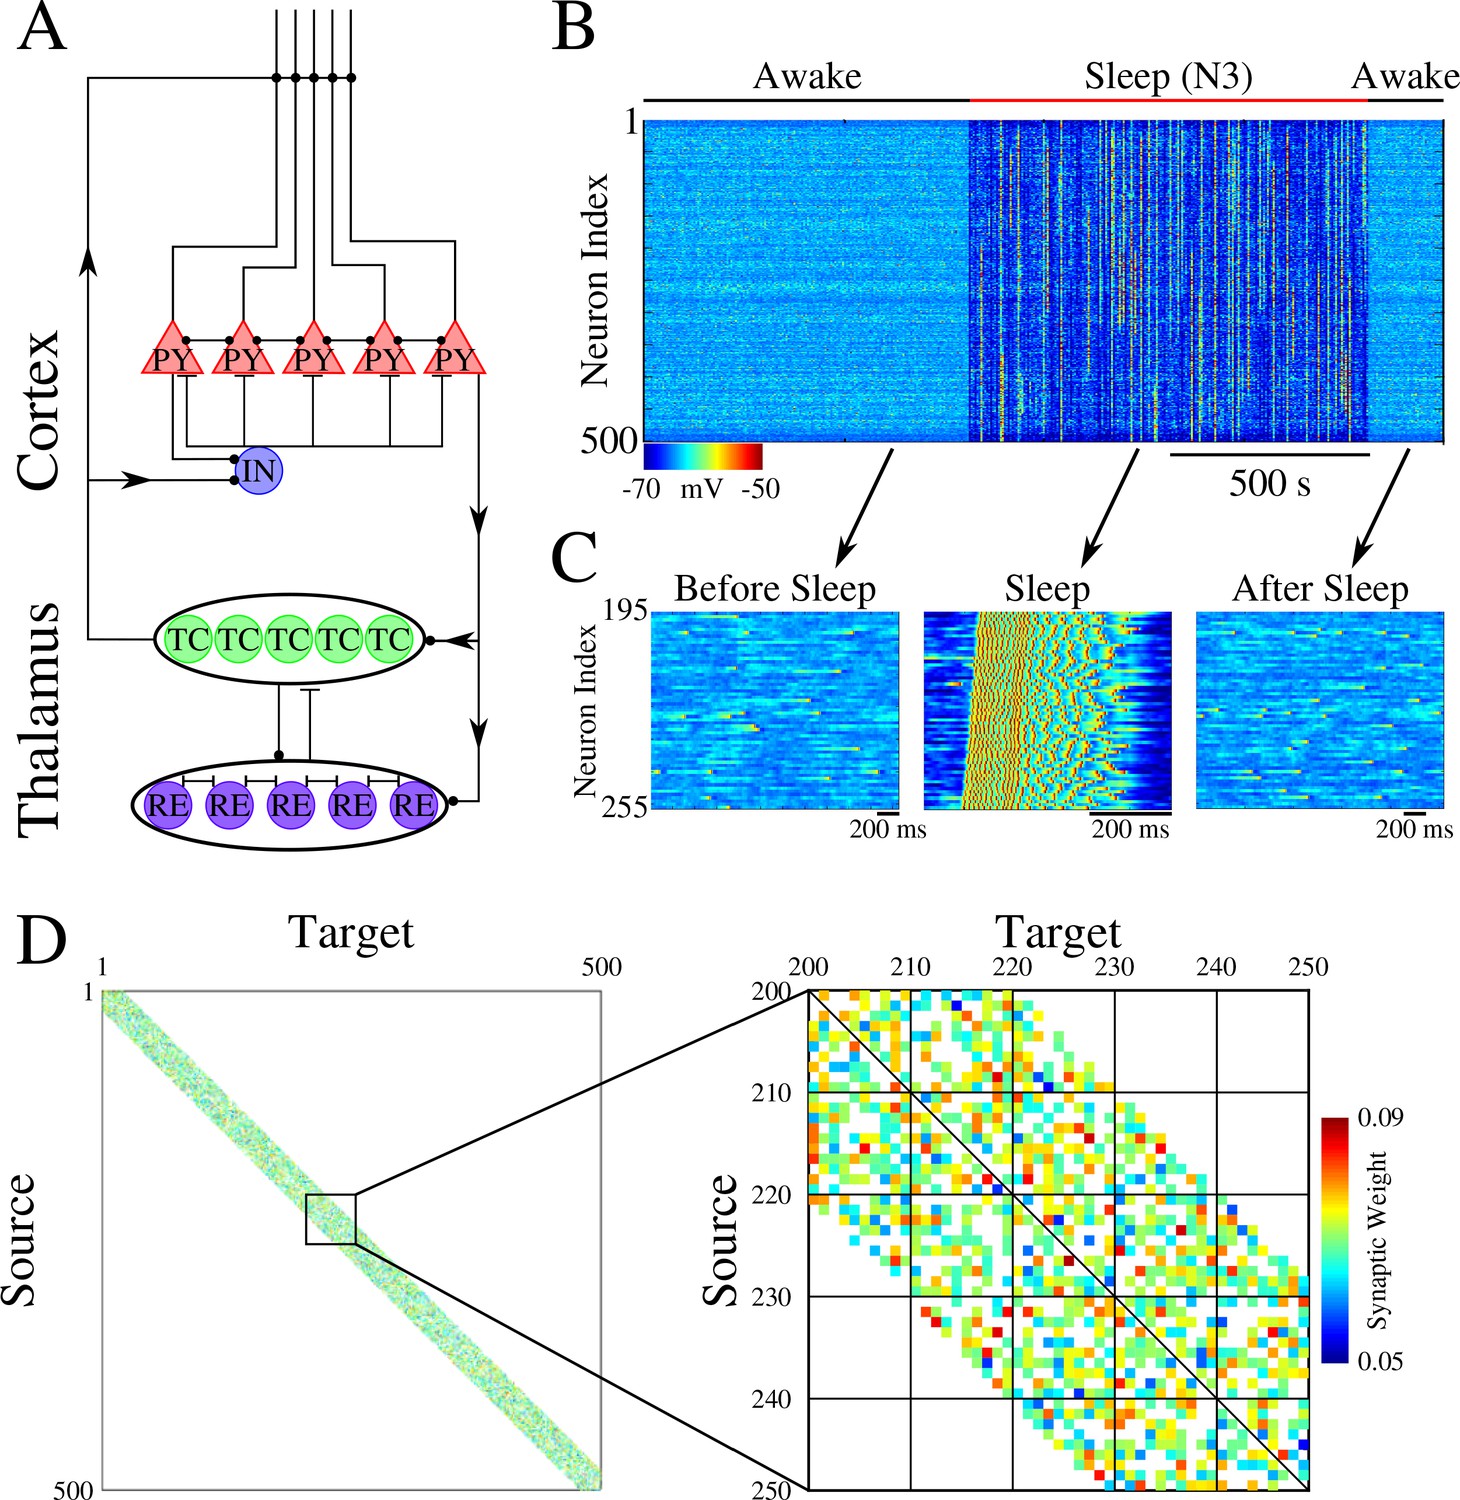
Network architecture and baseline dynamics.
(A) Basic network architecture (PY: excitatory pyramidal neurons; IN: inhibitory interneurons; TC: excitatory thalamocortical neurons; RE: inhibitory thalamic reticular neurons). Excitatory synapses are represented by lines terminating in a dot, while inhibitory synapses are represented by lines terminating in bars. Arrows indicate the direction of the connection. (B) Behavior of a control network exhibiting wake-sleep transitions. Cortical PY neurons are shown. Color represents the voltage of a neuron at a given time during the simulation (dark blue – hyperpolarized potential; light blue / yellow – depolarized potential; red - spike). (C) Zoom-in of a subset of neurons from the network in B (time is indicated by arrows). Left and right panels show spontaneous activity during awake-like state before and after sleep, respectively. Middle panel shows example of activity during sleep. (D) Left panel shows the initial weighted adjacency matrix for the network in B. The color in this plot represents the strength of the AMPA connections between PY neurons, with white indicating the lack of synaptic connection. Right panel shows the initial weighted adjacency matrix for the subregion indicated on the left.
Figure 2 with 1 supplement

Two spatially separated memory sequences show no interference during training and both are strengthened by subsequent sleep.
(A) Network activity during periods of testing (T), training of two spatially separated memory sequences (S1/S2), and sleep (N3). Cortical PY neurons are shown. Color indicates voltage of neurons at a given time. (B) Left panels show an example of training sequence 1 (S1, top) and sequence 2 (S2, bottom). Middle panels show examples of testing both sequences prior to sleep. Right panels show examples of testing after sleep. Note, after sleep, both sequences show better completion. (C) Performance of S1 and S2 completion before any training (baseline), after S1 training, after S2 training, and after sleep (red). (D) Synaptic weight matrices show changes of synaptic weights in the regions trained for S1 and S2. Left panel shows weights after training S1; middle panel shows weights after training S2; right panel shows weights after sleep. Color indicates strength of AMPA synaptic connections. (E) Distributions of the net sum of synaptic weights each neuron receives from all the neurons belonging to its left neighboring group (S1 direction) vs its right neighboring group (opposite direction, defined as S1* direction below) within a trained region at baseline (left), after S1 training (middle) and after sleep (right). (F) Synaptic weight-based directionality index before/after training (gray bars) and after sleep (red bar).
Figure 2—figure supplement 1
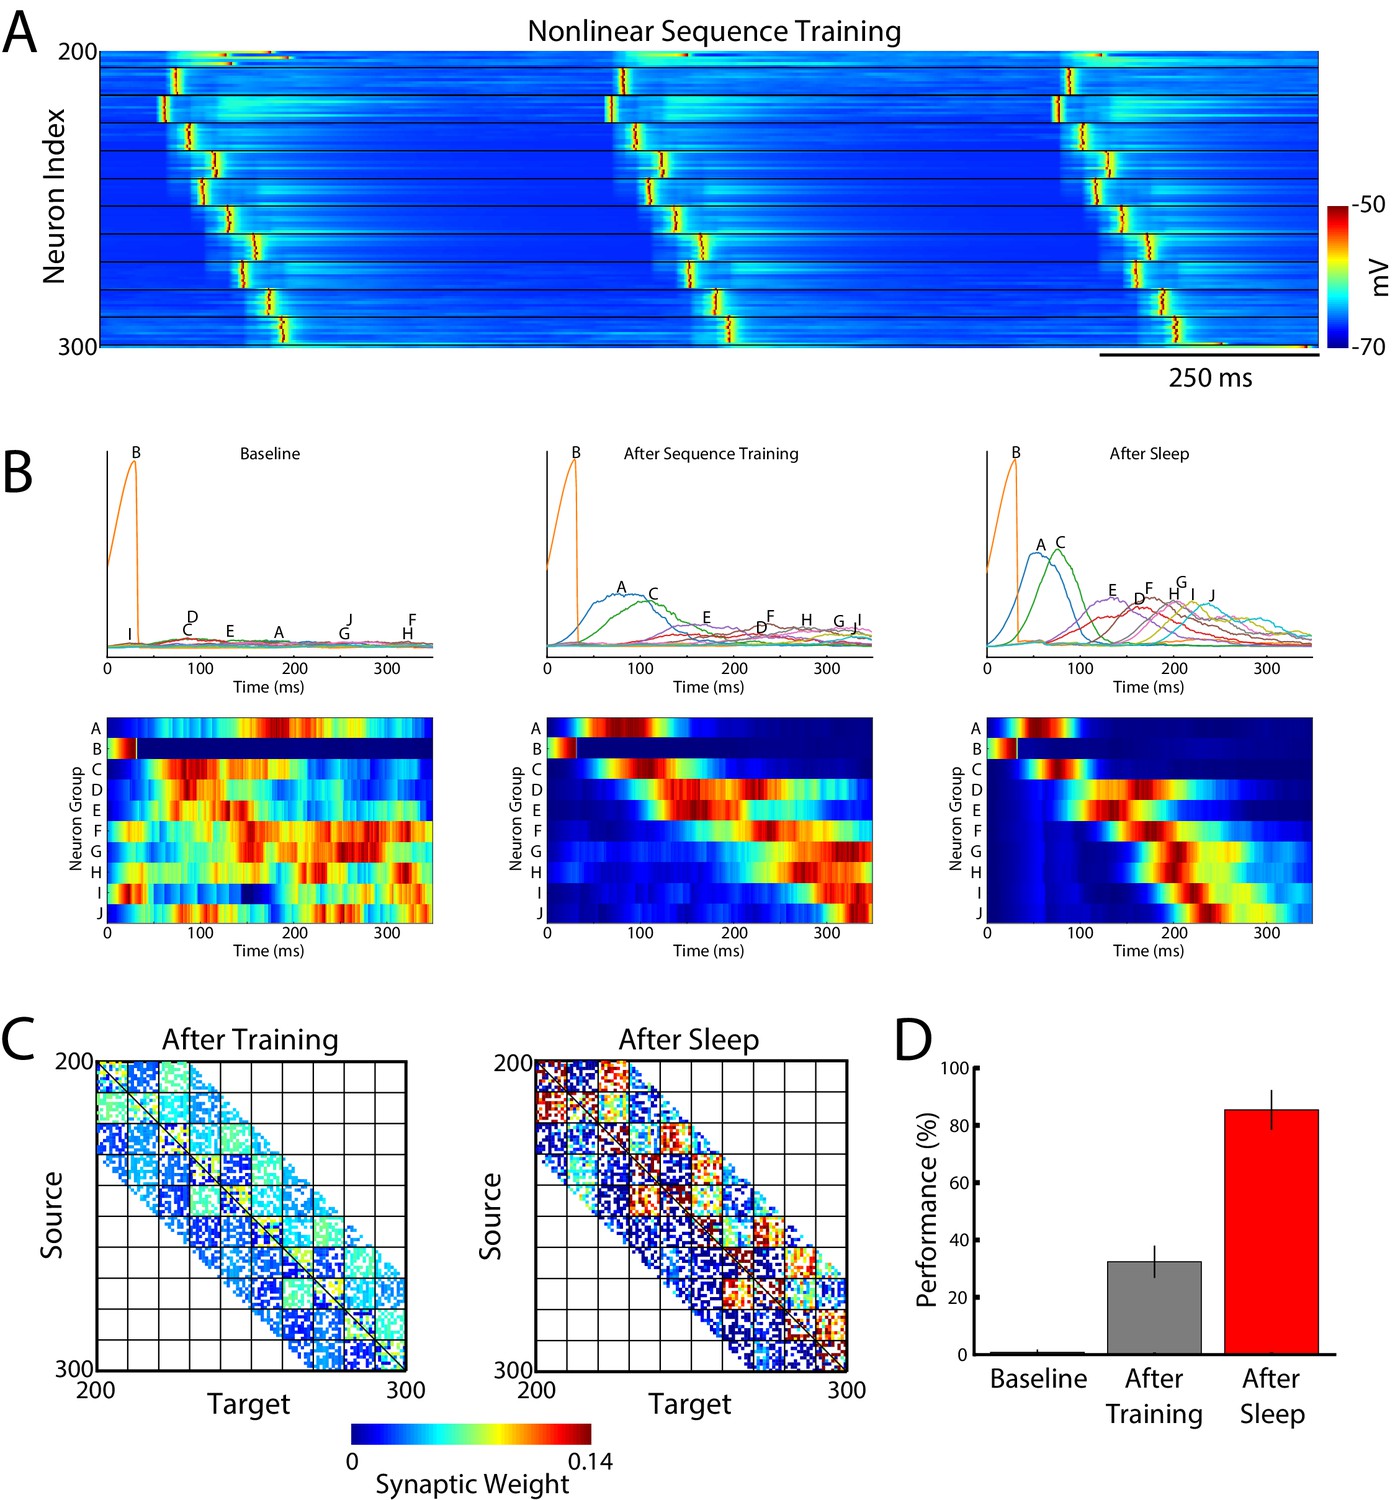
Sleep replay improves performance for complex non-linear sequences.
(A) Example of the training protocol used for training a long non-linear sequence - BACEDFHGIJ. (B) Average group activations during baseline testing (left), after sequence training (middle), and after sleep (right). Top panels show average group firing rates during testing periods. Letters above each line indicate the group in the sequence. Sleep results in increase of the firing rates (higher peaks) and sharpening of the response times (narrower distribution) as compared to "before sleep". Bottom panels show normalized average group responses during testing periods. Sleep leads to an improvement and tuning of the responses such that testing after sleep results in the correct ordering of group activations and faster completion of the sequence. (C) Synaptic weight matrices in the trained region of the network before (left) and after (right) sleep. Color indicates synaptic strength. (D) Performance of the sequence completion at baseline, after training, and after sleep (red).
Figure 3
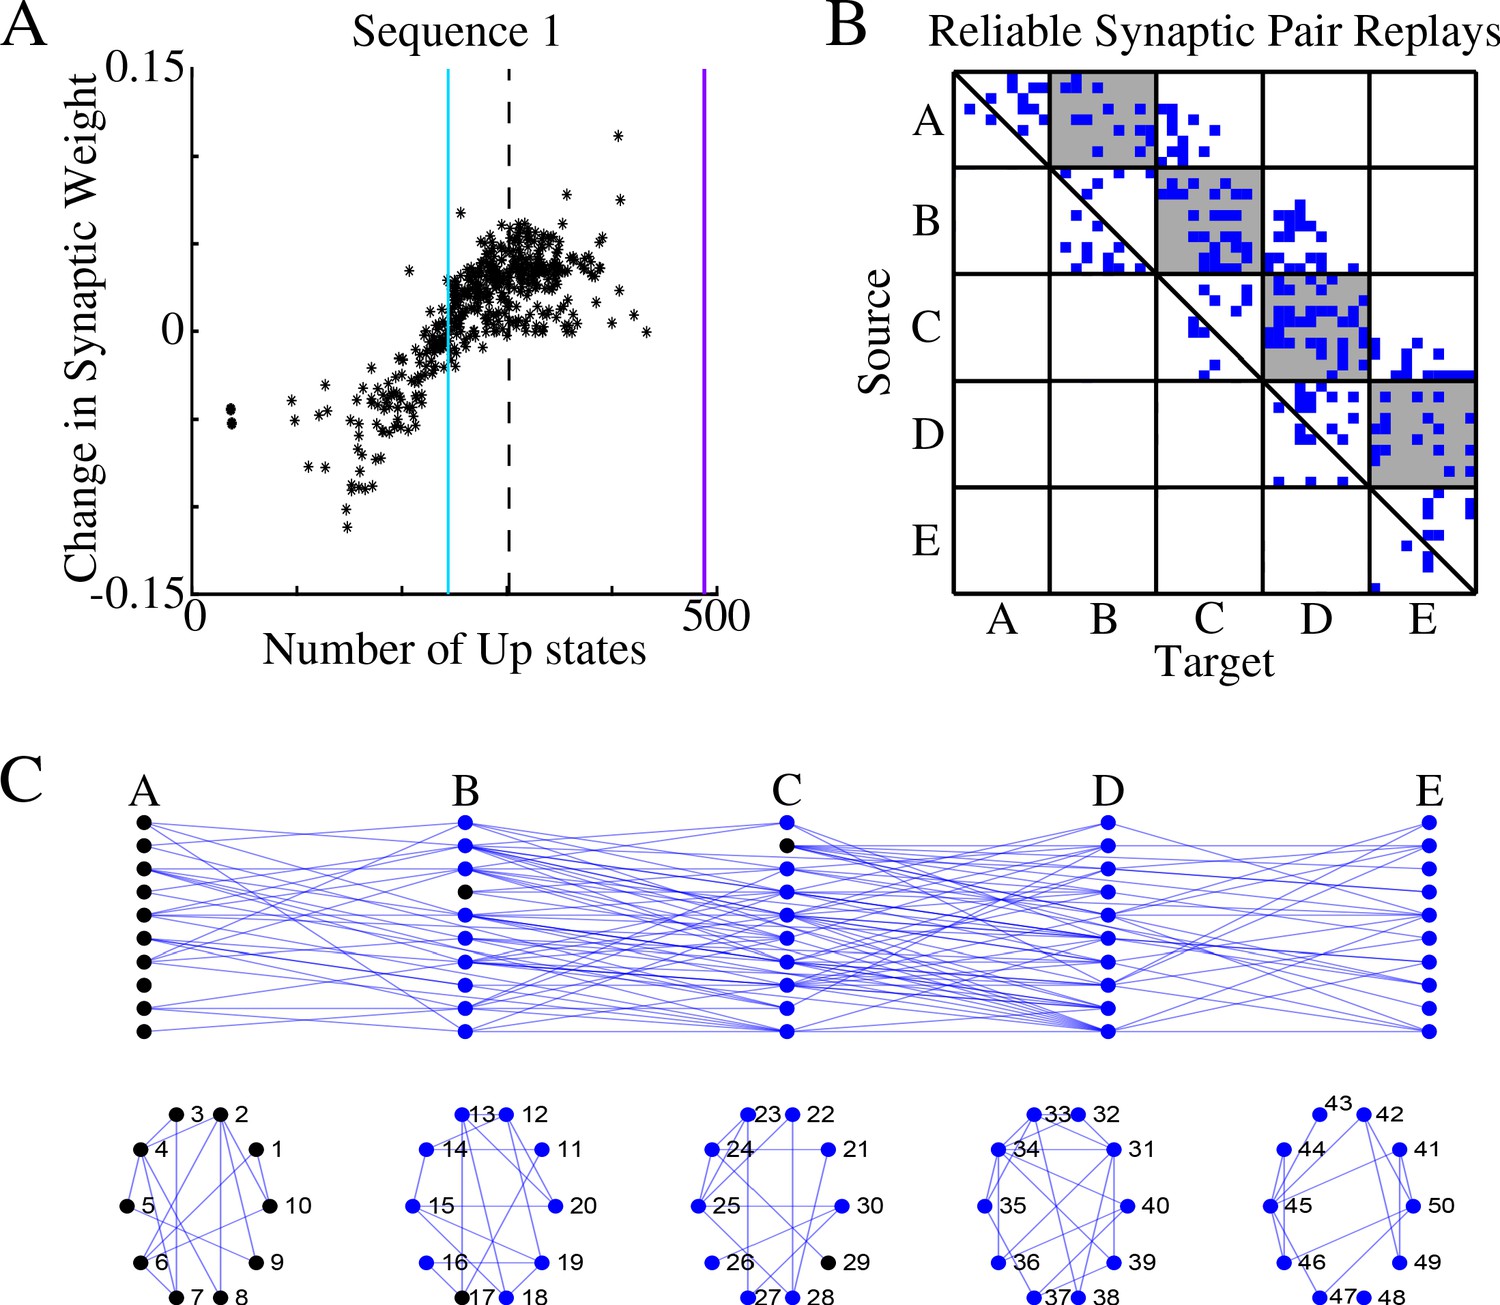
Sleep replay strengthens synapses to improve memory recall.
(A) Change in synaptic weight over entire sleep period as a function of the number of Up states where a given synapse was replayed. Each star represents a synapse in the direction of S1. Dashed line indicates the threshold (66% of Up states) used to identify synapses that are replayed reliably for analysis in B; purple line indicates the maximum number of Up states; blue line demarcates the 50% mark of the total number of Up states. (B) Thresholded connectivity matrix indicating synaptic connections (blue) showing reliable replays in the trained region. Grey boxes highlight between group connections. (C) Network's graph showing between group (top) and within group (bottom) connections. Edges shown here are those synapses which revealed reliable replays of S1 as shown in B. Nodes are colored blue if they receive at least one of the synapses identified in panel B.
Figure 4 with 1 supplement
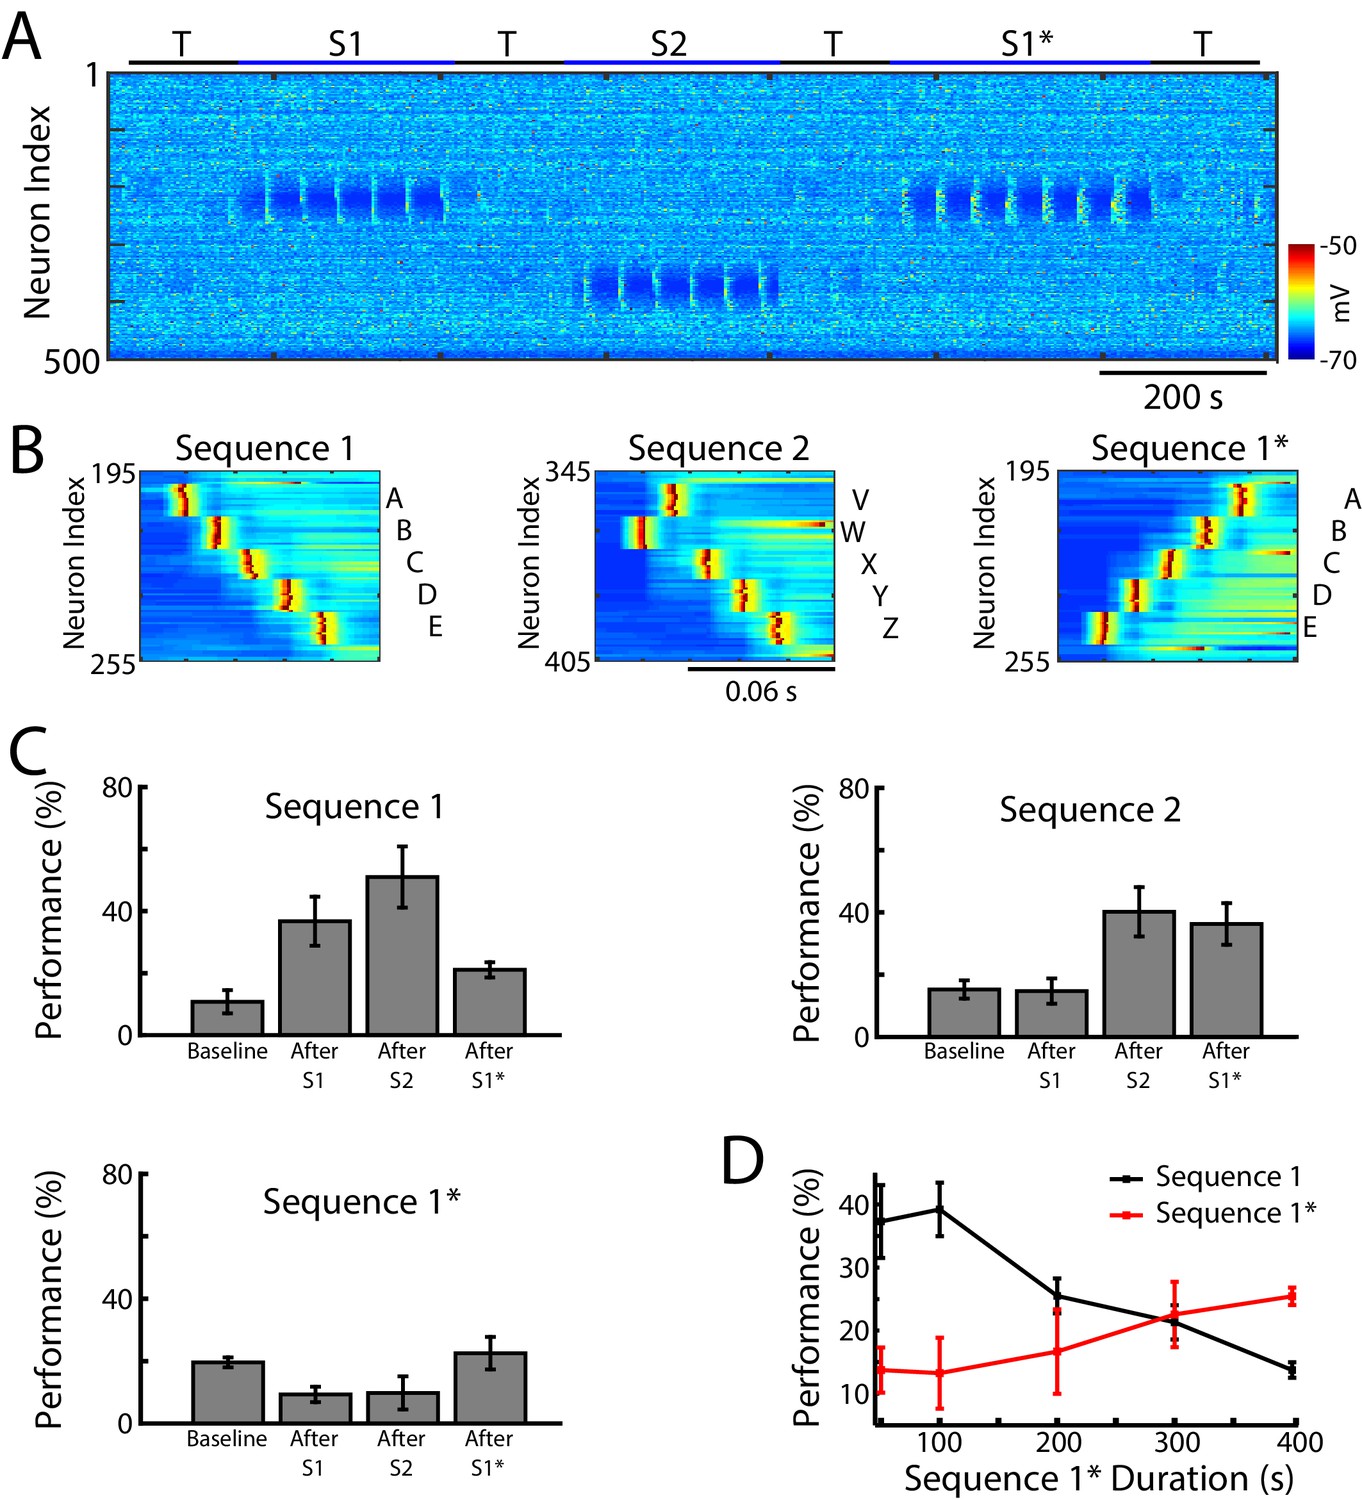
Training of overlapping memory sequences results in catastrophic interference.
(A) Network activity (PY neurons) during training and testing periods for three memory sequences in awake-like state. Note, sequence 1 (S1) and sequence 1* (S1*) are trained over the same population of neurons. Color indicates the voltage of the neurons at a given time. (B) Examples of sequence training protocol for S1 (left), S2 (middle), and S1* (right). (C) Performances for the three sequences at baseline, and after S1, S2 and S1* training. Training of S1* leads to reduction of S1 performance. (D) Performance of S1 (black) and S1* (red) as a function of S1* training duration. Note that longer S1* training increases degradation of S1 performance.
Figure 4—figure supplement 1
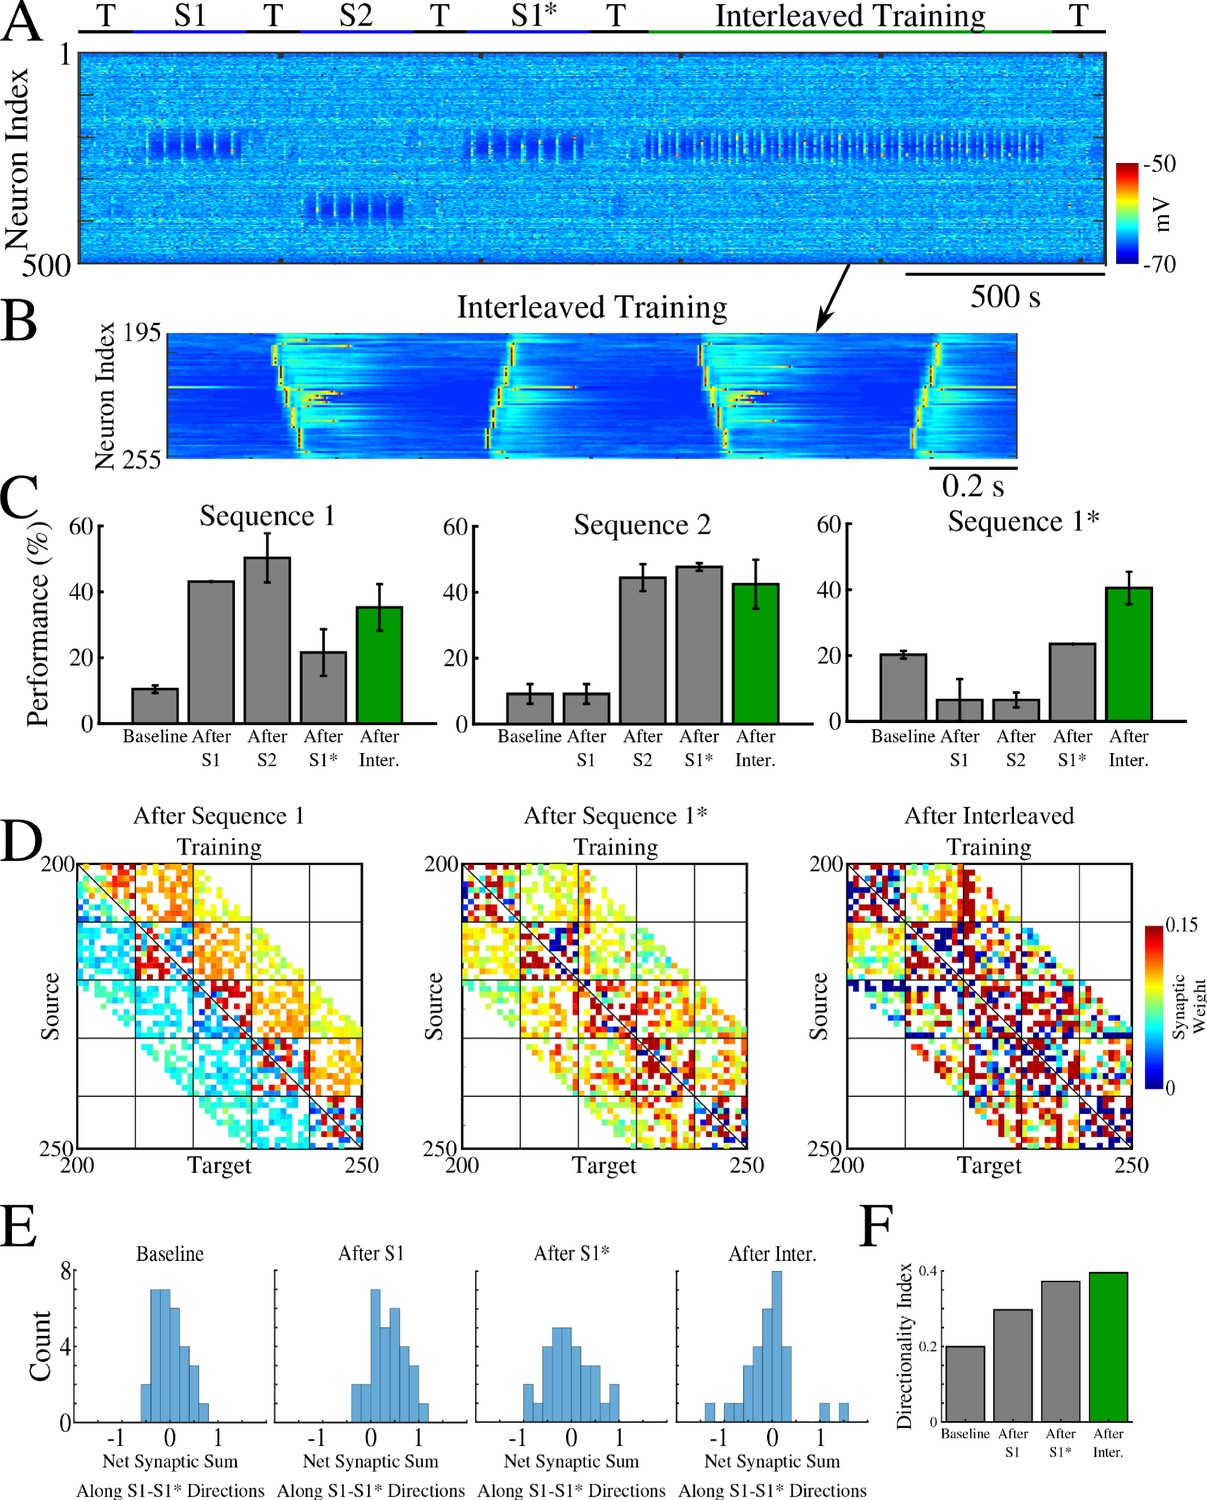
Interleaved training of the old and new memory sequences prevents the old sequence from forgetting and improves performance for both memories.
(A) Network activity during sequential training of memory sequences S1→ S2→ S1* (blue bars) followed by interleaved training of S1/S1* (green bar). (B) Example of stimulation protocol used for interleaved training of S1/S1*. (C) Testing of S1, S2, and S1* shows increase in performance of S1 and S1* after interleaved training (green). (D) Weighted adjacency matrices showing changes after initial sequential training of S1 and S1*, and after interleaved S1/S1* training. (E) Distributions of the net sum of synaptic weights each neuron receives from all the neurons belonging to its left vs right neighboring groups within a trained region at baseline (left), after training S1 (middle/left), after training S1* (middle/right), and after interleaved training (right). (F) Synaptic weight-based directionality index before/after training both sequences (gray bars) and after interleaved training (green bar).
Figure 5 with 1 supplement
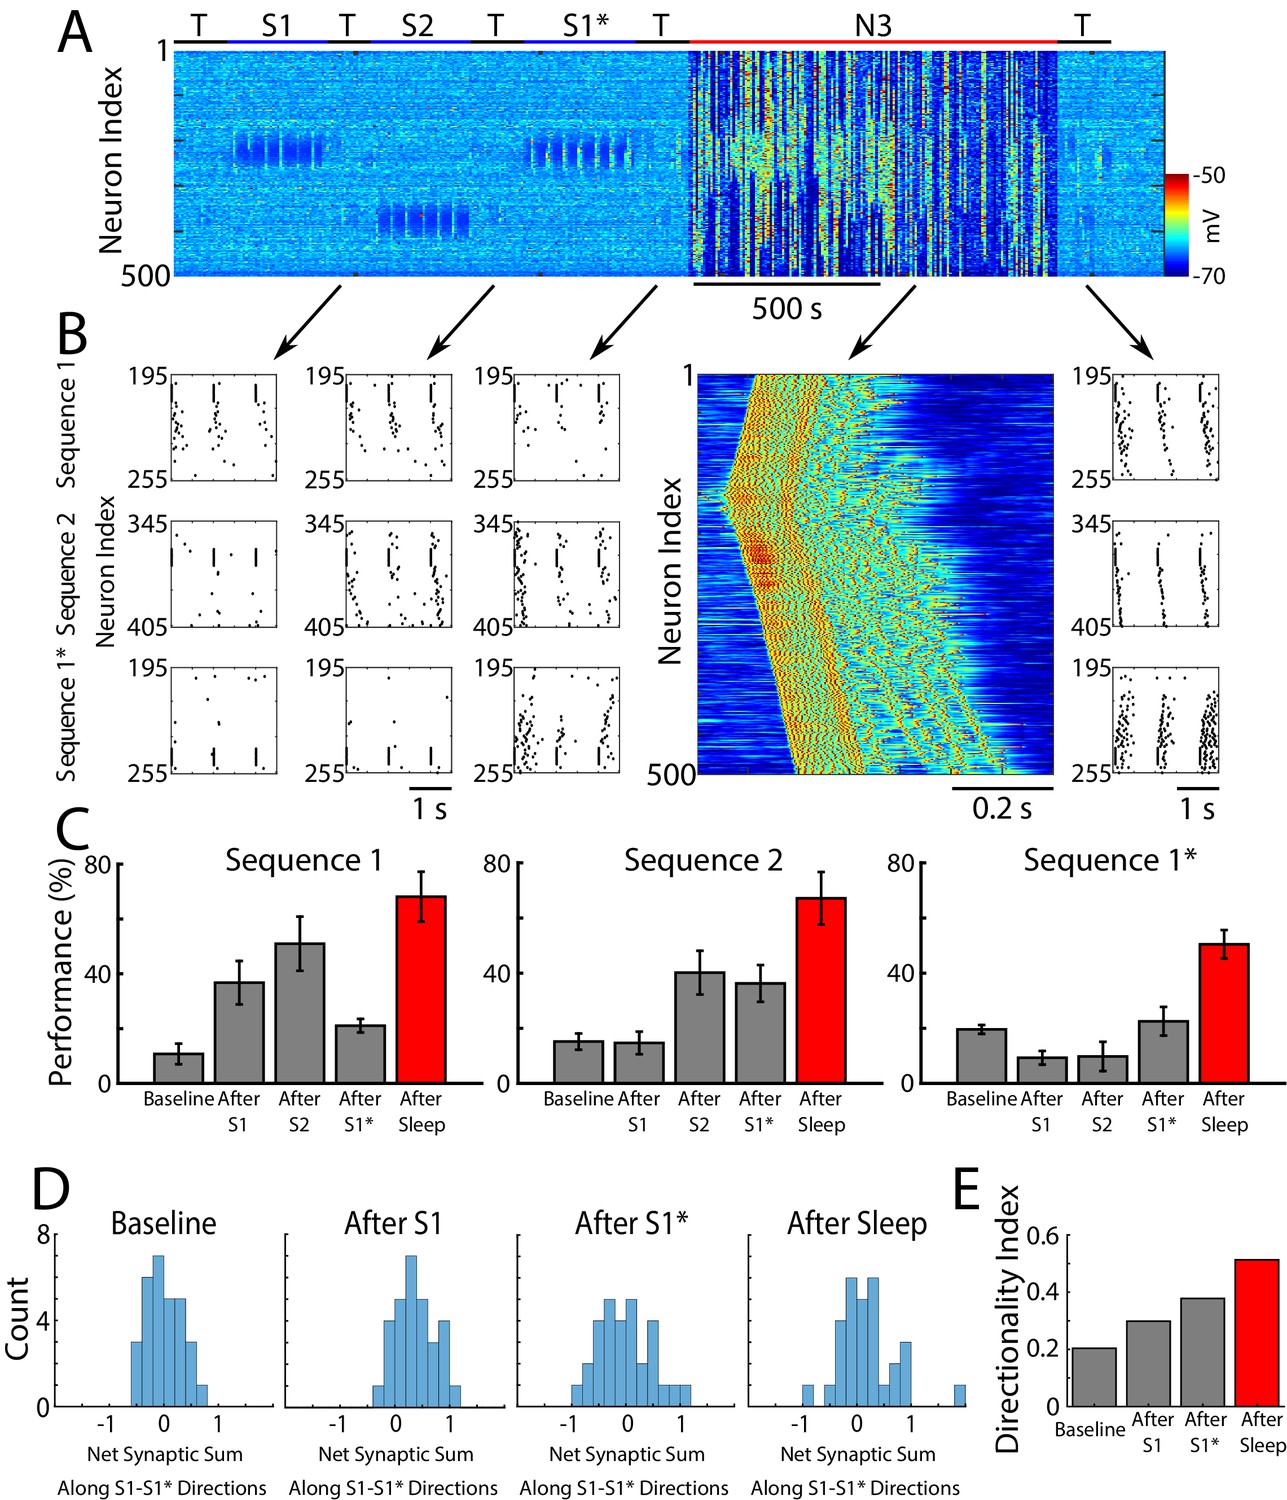
Sleep prevents the old memory sequence from forgetting and improves performance for all memories.
(A) Network activity (PY neurons) during sequential training of sequencies S1/S2/S1* (blue bars) followed by N3 sleep (red bar). No stimulation was applied during sleep. (B) Examples of testing for each trained memory at different times. The top row corresponds to the testing of S1, middle is testing of S2, and bottom is testing of S1*. Heatmap shows characteristic cortical Up state during SWS. (C) Testing of S1, S2, and S1* shows damage to S1 after training S1*, and increase in performance for all three sequences after sleep (red bars). (D) Distributions of the net sum of synaptic weights each neuron receives from all the neurons belonging to its left vs right neighboring groups within a trained region at baseline (left), after training S1 (middle/left), after training S1* (middle/right), and after sleep (right). Wider distribution indicates presence of neurons that are strongly biased to one sequence or the other. (E) Synaptic weight-based directionality index before/after training (gray bars) and after sleep (red bar).
Figure 5—figure supplement 1

Training of a new memory that interferes with previously consolidated old memory leads to forgetting that can be reversed by subsequent sleep.
(A) Network activity (PY neurons) during training of S1 (150 s), S1* (350 s) (blue bars) and N3 sleep (red bars). No stimulation was applied during sleep. (B) Examples of testing periods for each trained memory at different times. The top row corresponds to the testing of sequence 1 (S1) and bottom is testing of sequence 1* (S1*). Arrows indicate time of specific testing period. (C) Performance of S1 (S1*) at baseline, after each training period and after each sleep period (red) for the network shown in A and B. (D) Performance of S1 (S1*) at baseline, after each training period and after each sleep period (red) for a network with longer (450 s) S1* training.
Figure 6
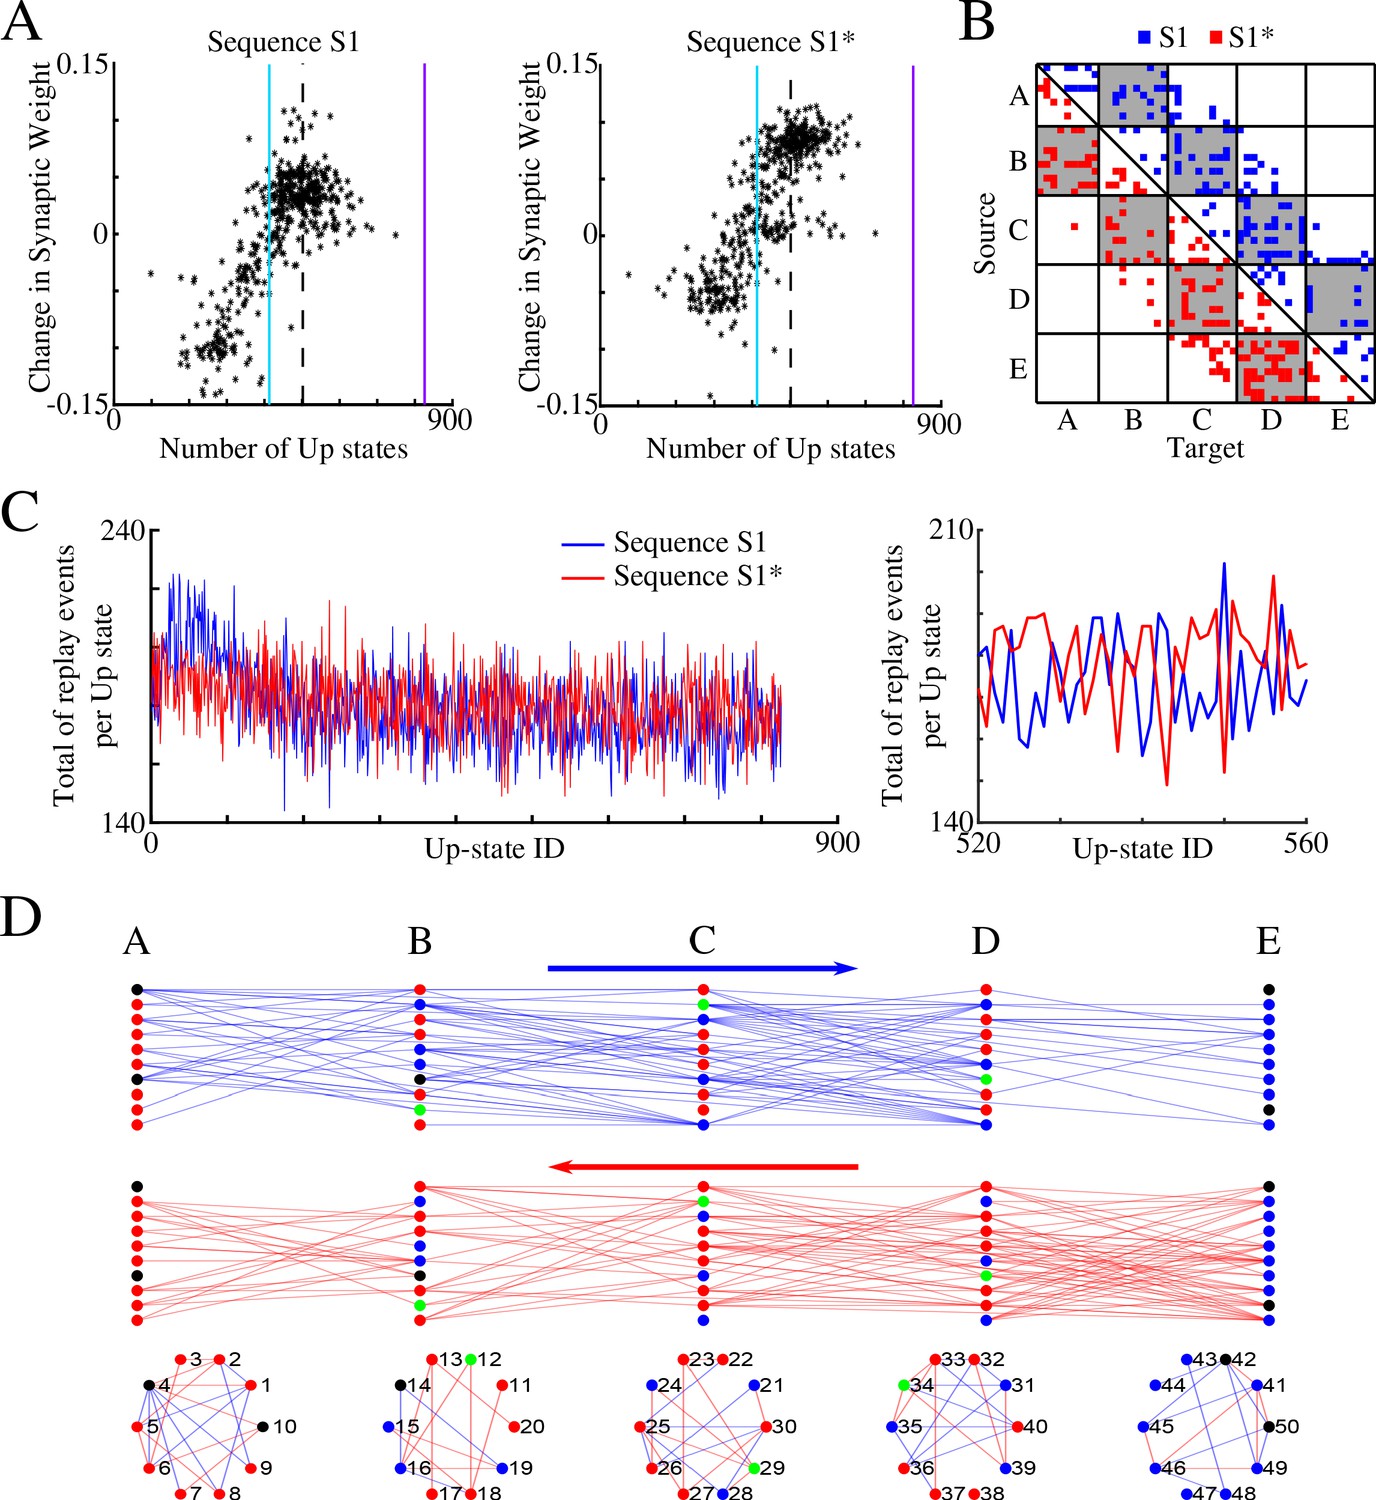
Sleep promotes replay of both overlapping memory sequences during each Up state.
(A) Change in synaptic weight over entire sleep period as a function of the number of Up states where a given synapse was preferentially replayed. Each star represents a synapse in the direction of S1 (left) or S1* (right). Dashed line indicates the threshold (66% of Up states) used to identify synapses that are replayed reliably for analysis in (B); purple line indicates the maximum number of Up states; blue line demarcates the 50% mark of the total number of Up states. (B) Thresholded connectivity matrix indicating synaptic connections showing reliable replays for S1 (blue) or S1* (red). Grey boxes highlight between group connections. (C) Number of replay events for inter-group synapses per Up state across all Up states (left) and a subset of Up states (right) for S1 (blue) and S1* (red). Note that both sequences show similar high number of replays across all Up states, suggesting that both sequences are replayed during each Up state. (D) Network's graphs showing between group (top/middle) and within group (bottom) connections after sleep. Edges shown here are those which revealed reliable replays of S1 (blue) and S1* (red) as shown in B (right). Nodes are colored blue (red) if more than 50% of their incoming connections show reliable replay in direction of S1 (S1*). Green nodes indicate neurons with high in-degrees, receiving the same number of ‘replayed’ synapses from left and right, and black indicates that none of these conditions are met.
Figure 7 with 2 supplements
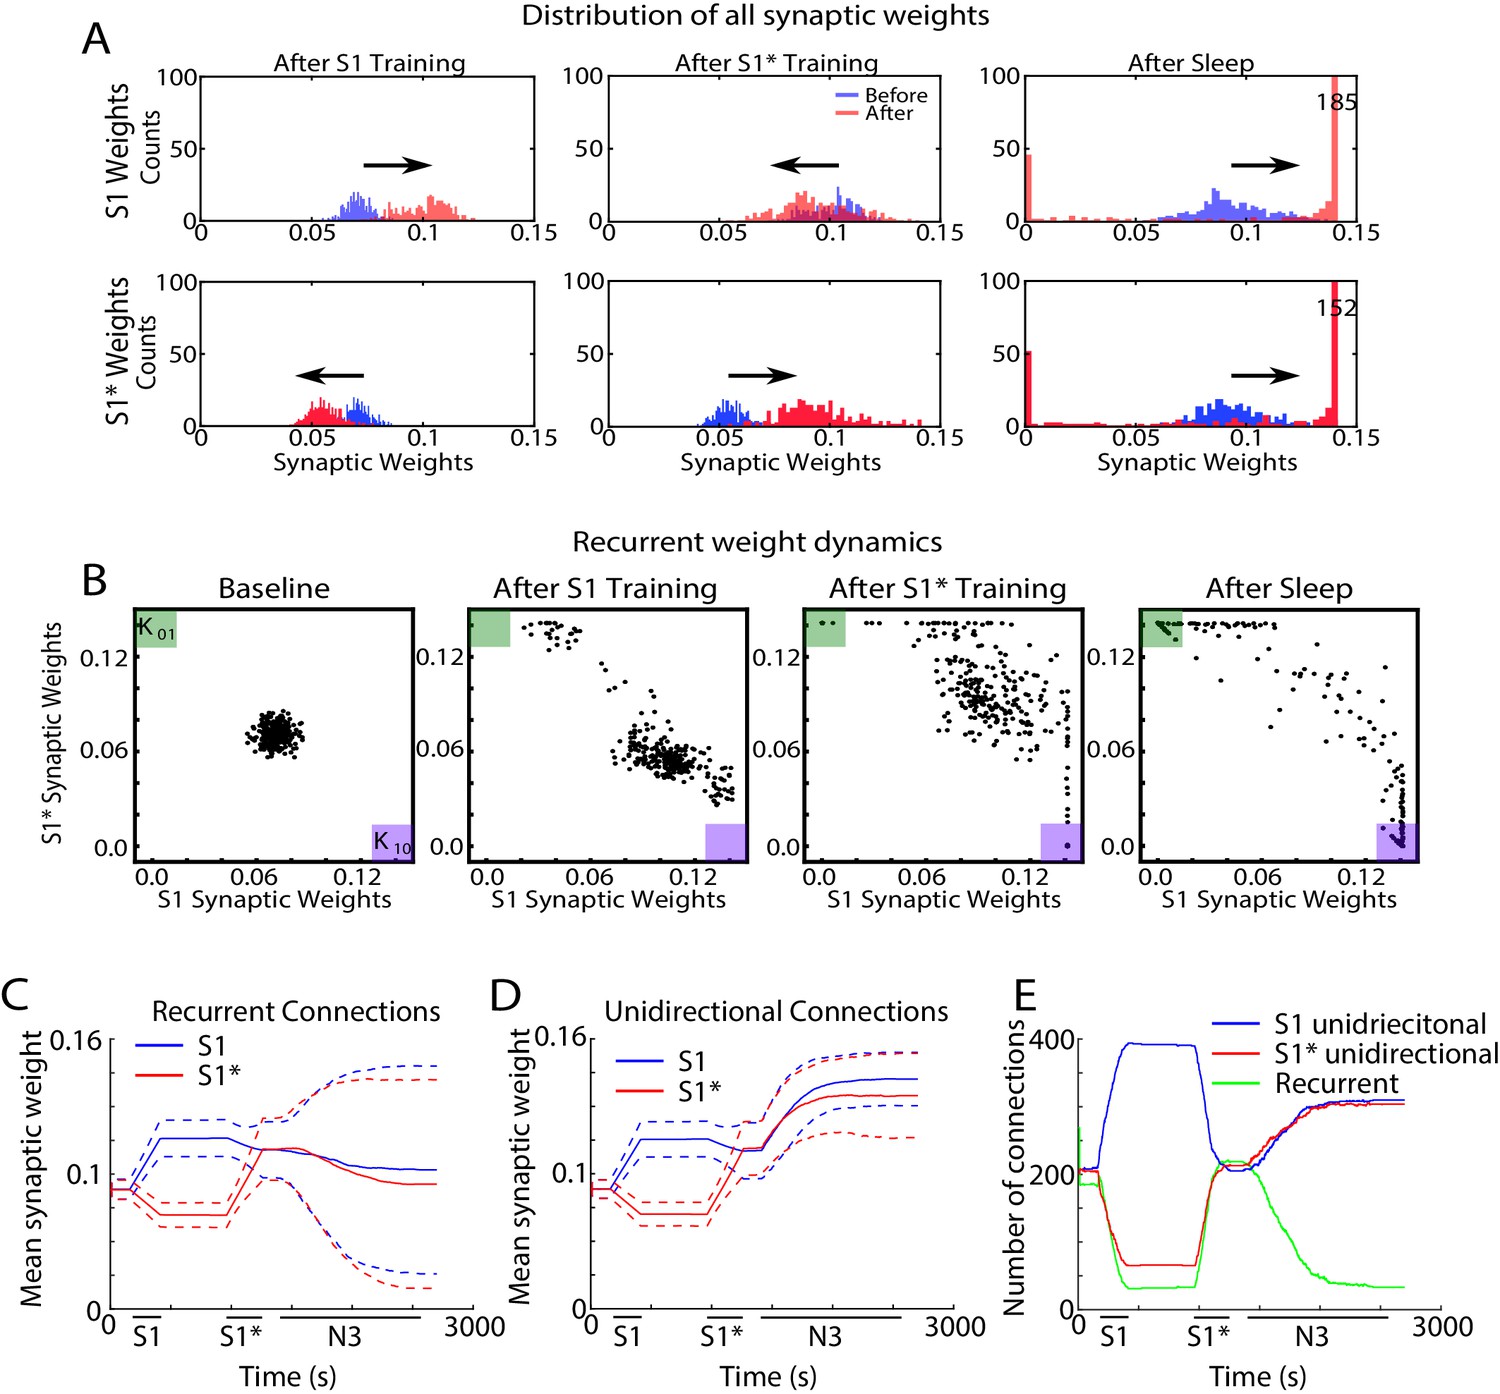
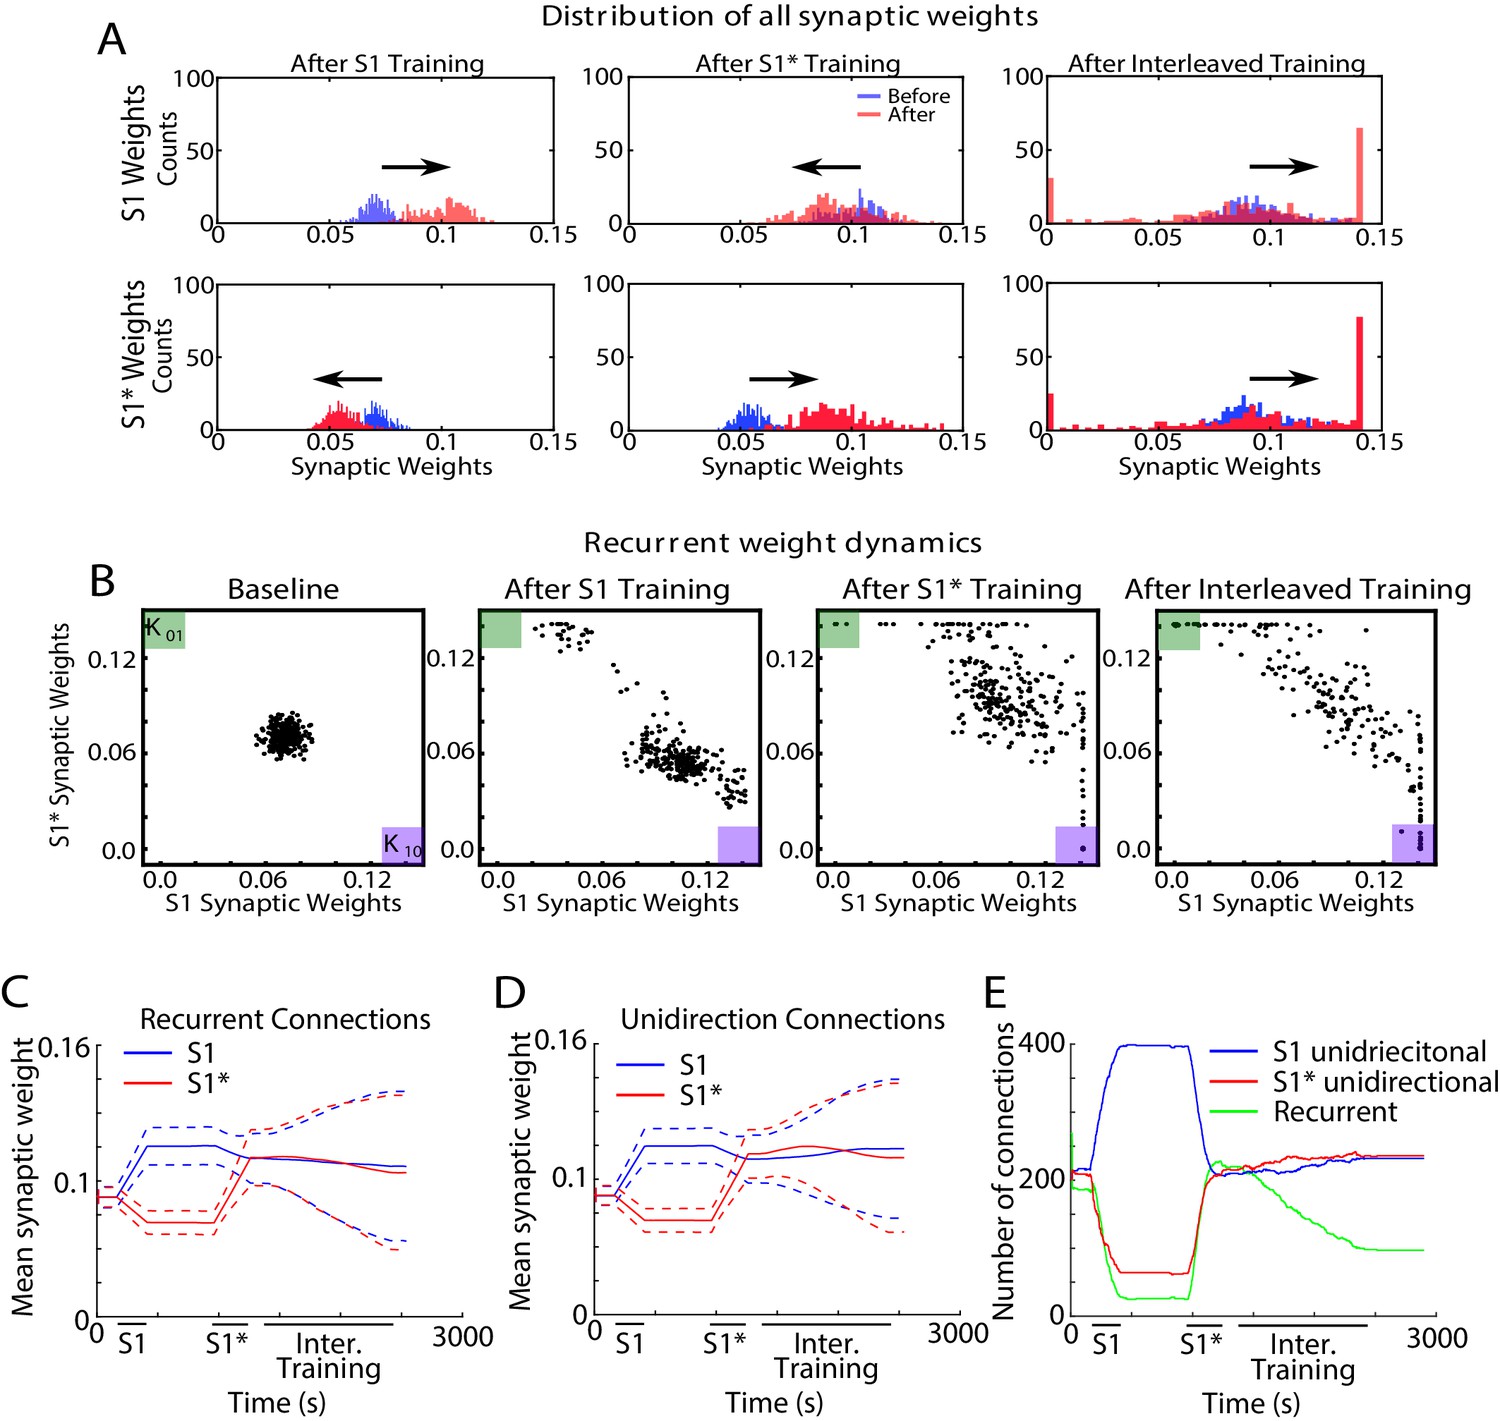
Sleep promotes unidirectional synaptic connectivity with different subsets of synapses becoming specific to the old or new memory sequences.
(A) Dynamics of synaptic weight distributions from the trained region. Top row shows strength of synapses in direction of S1. Bottom row shows strength of synapses in direction of S1*. Blue shows the starting points for weights, and red shows new weights after different specific events, for example, S1 training, S1* training, sleep. (B) Scatter plots show synaptic weights for all reciprocally connected pairs of neurons before and after training (left/middle) and after sleep (right). For each pair of neurons (e.g., n1-n2), the X-coordinate shows the strength of Wn1→n2 synapse and the Y-coordinate shows the strength of Wn2→n1 synapse. The green (K01) and purple (K10) boxes show the locations in the scatter plot representing synaptic pairs with strong preference for S1* (green) or S1 (purple). (C) The evolution of the mean synaptic strength (solid line) and the standard deviation (dashed line) of recurrent connections in S1 (blue) and S1* (red) direction. Note the large standard deviation after sleep indicating strong synaptic weight separation, so each recurrent neuronal pair supports preferentially either S1 or S1*. (D) The evolution of the mean synaptic weight (solid line) and the standard deviation (dashed line) of unidirectional connections in S1 (blue) and S1* (red) direction. Note the overall increase in synaptic strength after sleep. (E) The number of functionally recurrent and unidirectional connections in the trained region of the network as a function of time, obtained after thresholding the network connectivity matrix with threshold 0.065 (which is smaller than the initial mean synaptic strength). Note the decrease of functionally recurrent connections and increase of functionally unidirectional connections after sleep.
Figure 7—figure supplement 1
Interleaved training revealed synaptic weight dynamics that are similar to sleep but result in less segregation of synaptic weights.
(A) Dynamics of synaptic weight distributions from the trained region. Top row shows strength of synapses in direction of S1. Bottom row shows strength of synapses in direction of S1*. Blue shows the starting points for weights, and red shows new weights after different specific events, for example, S1 training, S1* training, interleaved training. (B) Scatter plots show synaptic weights for all pairs of neurons contributing to both S1 and S1* before and after training (left/middle) and after interleaved training (right). For each pair of neurons (e.g., n1-n2), the X-coordinate shows the strength of Wn1→n2 synapse and the Y-coordinate shows the strength of Wn2→n1 synapse. The green (K01) and purple (K10) boxes show the locations in the scatter plot representing synaptic pairs with strong preference for S1* (green) or S1 (purple). (C) The evolution of the mean synaptic strength (solid line) and the standard deviation (dashed line) of recurrent connections in S1 (blue) and S1* (red) direction. (D) The evolution of the mean synaptic weight (solid line) and the standard deviation (dashed line) of unidirectional connections in S1 (blue) and S1* (red) direction. Note the lack of overall increase in synaptic strength after interleaved training as compared to sleep (Figure 7C). (E) The number of functionally recurrent and unidirectional connections in the trained region of the network as a function of time obtained after thresholding connectivity matrix with threshold 0.065 (which is smaller than the initial mean synaptic strength).
Figure 7—figure supplement 2
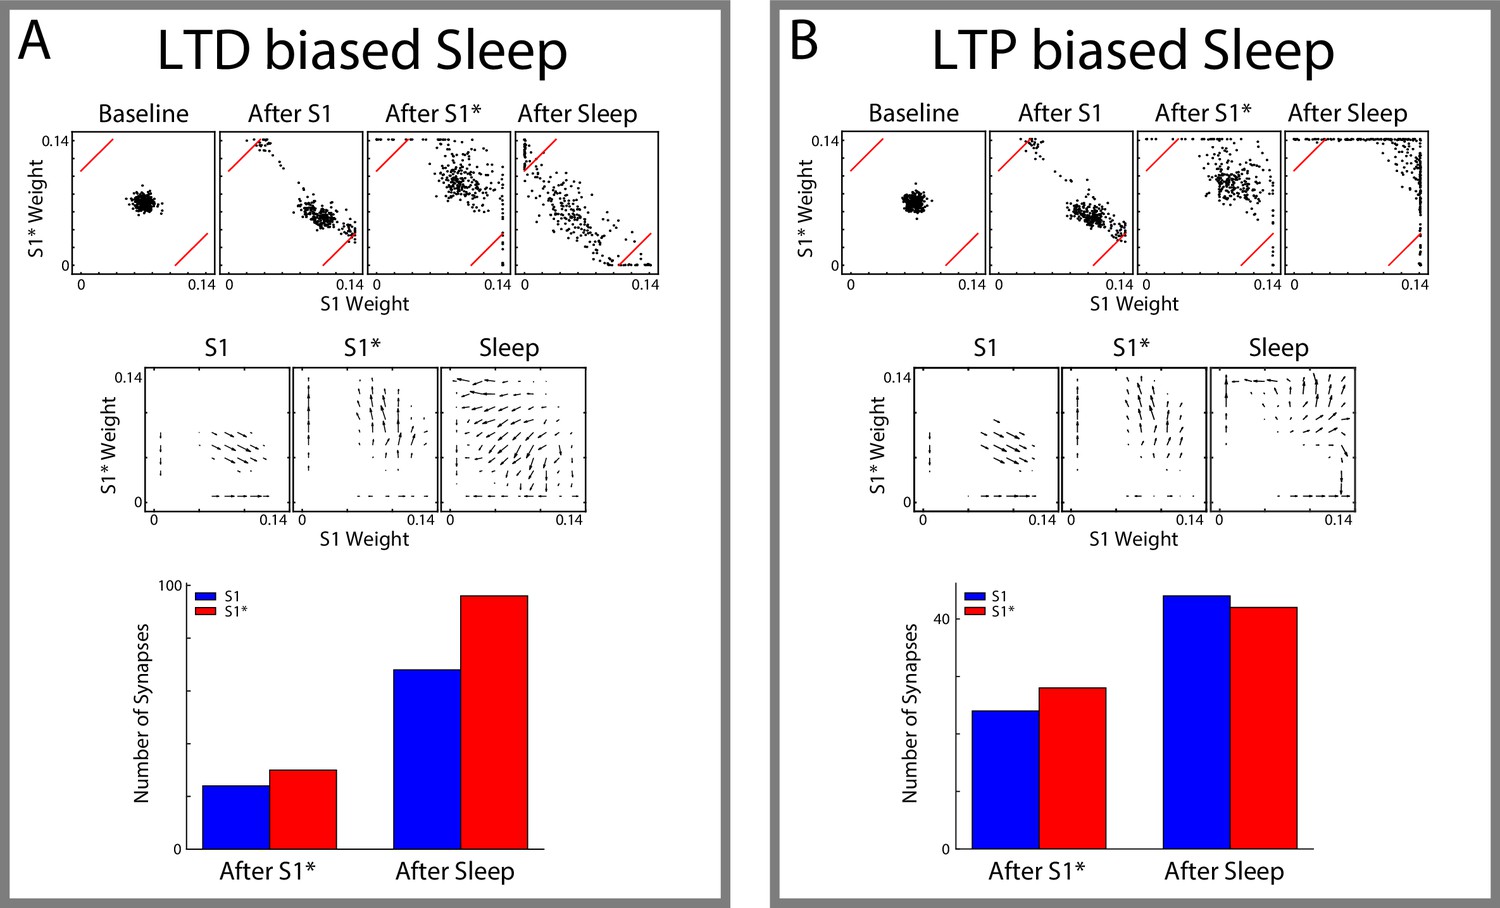
Synaptic plasticity that is biased towards LTP or LTD also results in memory orthogonalization during sleep .
Synaptic dynamics for LTP/LTD ratio biased towards LTD (A+/A-=0.0019/0.002) (A) or LTP (A+/A-=0.0021/0.002) (B). Top, Scatter plots showing synaptic weights for all reciprocally connected pairs of neurons before and after training (left/middle) and after sleep (right). For each pair of neurons (e.g., n1-n2), the X-coordinate shows the strength of Wn1→n2 synapse and the Y-coordinate shows the strength of Wn2→n1 synapse. The red lines indicate the thresholds used to determine synapses which are preferentially strong for S1 (bottom right ) or S1* (top left ). Middle, Vector fields summarizing the average synaptic weights dynamics of the scatter plots in the top panel. Arrows point in the direction of the average movement of synaptic weights and length of the arrows indicates the amplitude of the movement. Bottom, Total number of synapses which are preferentially strong for S1 (blue) or S1* (red) after training S1*/before sleep (left) and after sleep (right). Thresholds for determining preference for either sequence are indicated by red lines in the scatter plots.
Figure 8
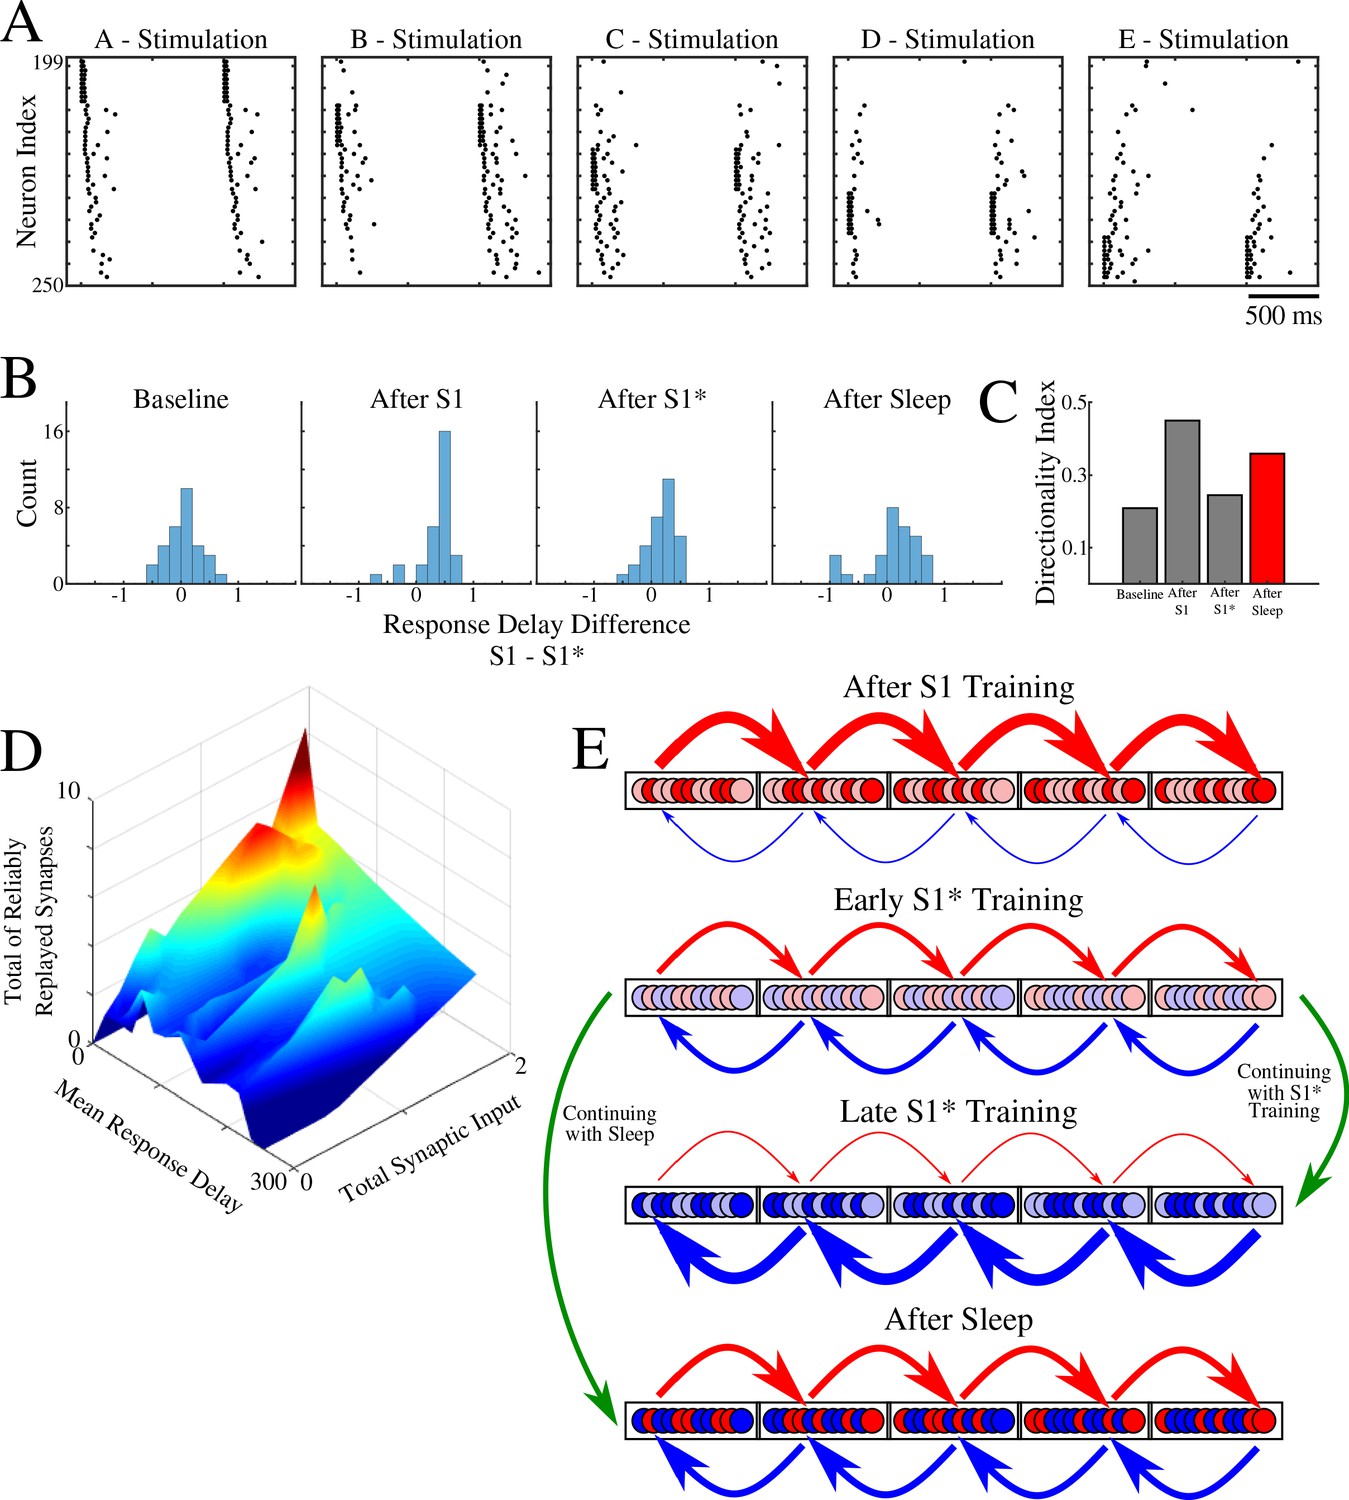
Population of neurons participating in reliable replay during sleep overlaps with the early responders during memory recall.
(A) Characteristic examples of the network activity showing spiking events during stimulations of each individual ‘letter’ of a memory sequence in awake. (B) Distributions of the differences in response delay for all neurons from the trained region when the respective left vs right neighboring groups are stimulated, as shown in A. (C) Response delay-based directionality index before/after training of each sequence (S1/S1*) in gray, and after sleep (red). (D) 3-D surface plot showing, for each neuron from a trained region, the number of incoming synapses demonstrating reliable replays during sleep (z-axis), mean response delay during testing (as in panel A) after sleep (y-axis), and total synaptic input to a neuron after sleep (x-axis). Note that neurons receiving highest total synaptic inputs in specific network direction after sleep are also those who respond with shortest delay during testing recall in that direction after sleep and also those who receive the highest number of synapses demonstrating reliable replay during sleep. (E) Simplified cartoon of the network connectivity after different training phases followed by sleep. Arrows indicate connections between neurons (nodes) with blue arrows being connections strong for S1 and red for S1*. Blue and red nodes represent neurons that contribute (weakly - light colors; strongly - dark colors) to recall of S1 and S1*, respectively. Top, network configuration after S1 training – all nodes and connections are allocated to S1. Middle/Top, network configuration after initial S1* training – nodes/connections start to learn S1* and ‘unlearn’ S1. The information about the old memory S1 is still available. Middle/Bottom, network configuration after continuing S1* training – all nodes/connections are allocated to S1*. All information about S1 is lost. Bottom, network configuration when initial S1* training is followed by sleep – orthogonalization of memory traces, some nodes/connection are allocated to S1 and others to S1*.
Author response image 1
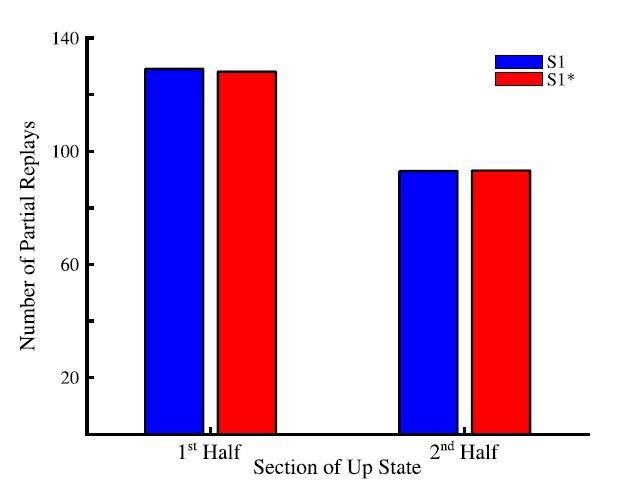
Total number of partial sequence replays for sequence S1 (blue) and S1* (red) during the first half (left) and last half (right) of up states during sleep.
Author response image 2
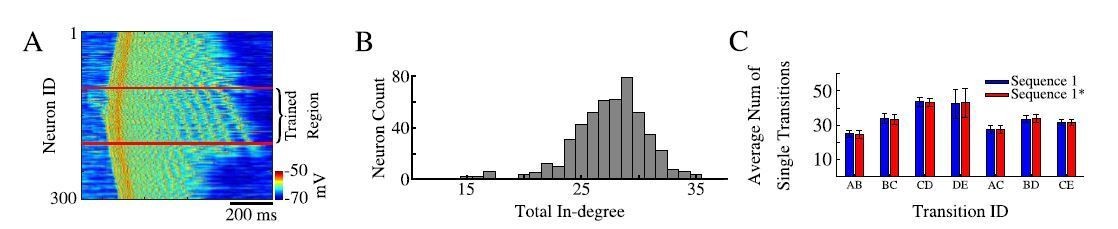
Sequence replays during sleep.
(A) Representative up state showing full sequence replays within the trained region of the network. (B) Histogram of the total in-degree of the neurons in our model. The x-axis is the in-degree or total number of synaptic inputs between excitatory neurons. The y-axis indicates the number of excitatory neurons which receive a given number of synaptic inputs. (C) Average number of single / partial transition replays across all up states for S1 ( blue) or S1* (red).
Additional files
Download links
A two-part list of links to download the article, or parts of the article, in various formats.
Downloads (link to download the article as PDF)
Open citations (links to open the citations from this article in various online reference manager services)
Cite this article (links to download the citations from this article in formats compatible with various reference manager tools)
Can sleep protect memories from catastrophic forgetting?
eLife 9:e51005.
https://doi.org/10.7554/eLife.51005


