Local emergence in Amazonia of Plasmodium falciparum k13 C580Y mutants associated with in vitro artemisinin resistance
- Laboratoire de parasitologie, Centre Nationale de Référence du Paludisme, World Health Organization Collaborating Center for surveillance of antimalarial drug resistance, Institut Pasteur de la Guyane, French Guiana
- Ecole Doctorale n°587, Diversités, Santé, et Développement en Amazonie, Université de Guyane, French Guiana
- Ministry of Public Health, Guyana
- Broad Institute of MIT and Harvard, United States
- Department of Immunology and Infectious Diseases, Harvard T.H. Chan School of Public Health, United States
- Department of Microbiology and Immunology, Columbia University Irving Medical Center, United States
- Department of Communicable Diseases and Environmental Determinants of Health, Pan American Health Organization/World Health Organization, United States
- Malaria Branch, Division of Parasitic Diseases and Malaria, Center for Global Health, Centers for Disease Control and Prevention, United States
- Pan American Health Organization, Guyana
- Service de Maladies Infectieuses et Tropicales, Centre Hospitalier Andrée Rosemon, French Guiana
- Ecosystèmes Amazoniens et Pathologie Tropicale (EPAT), EA3593, Université de Guyane, French Guiana
- Global Malaria Program, World Health Organization, Switzerland
- Division of Infectious Diseases, Department of Medicine, Columbia University Irving Medical Center, United States
Figures
Figure 1
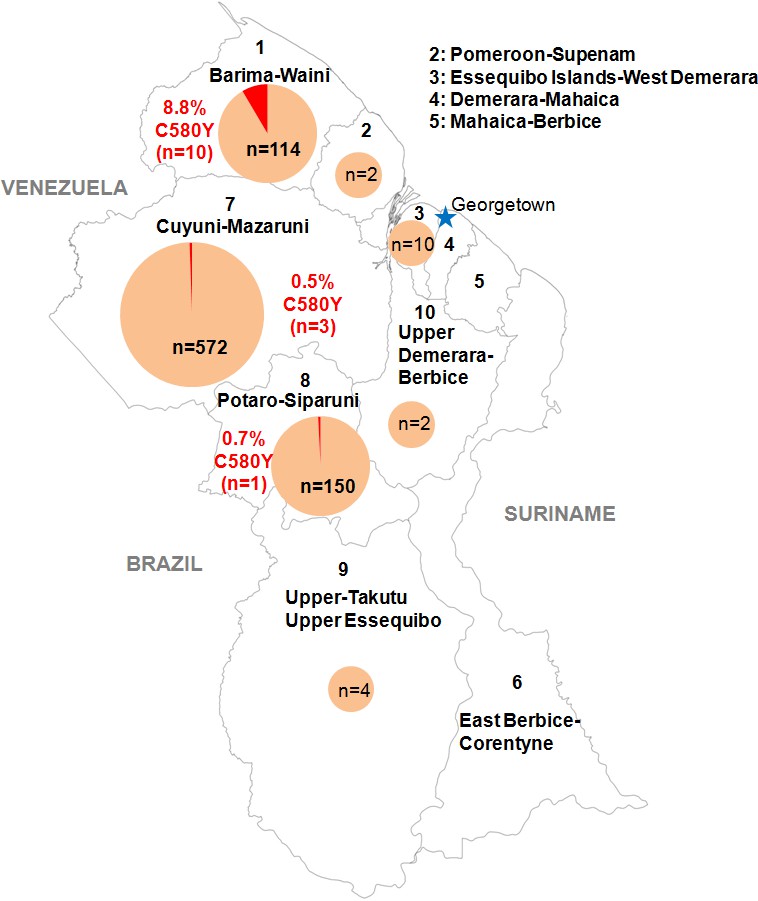
Distribution of the pfk13 C580Y mutant parasites among Guyana regions.
Pie charts represent the total number of isolates analyzed per region. Mutants are represented in red.
-
Figure 1—source data 1
Number of clinical samples with pfk13 propeller segment WT or C580Y mutant, analyzed by sampling regions in Guyana from March 2016 to September 2017.
- https://cdn.elifesciences.org/articles/51015/elife-51015-fig1-data1-v1.xlsx
Figure 2 with 1 supplement
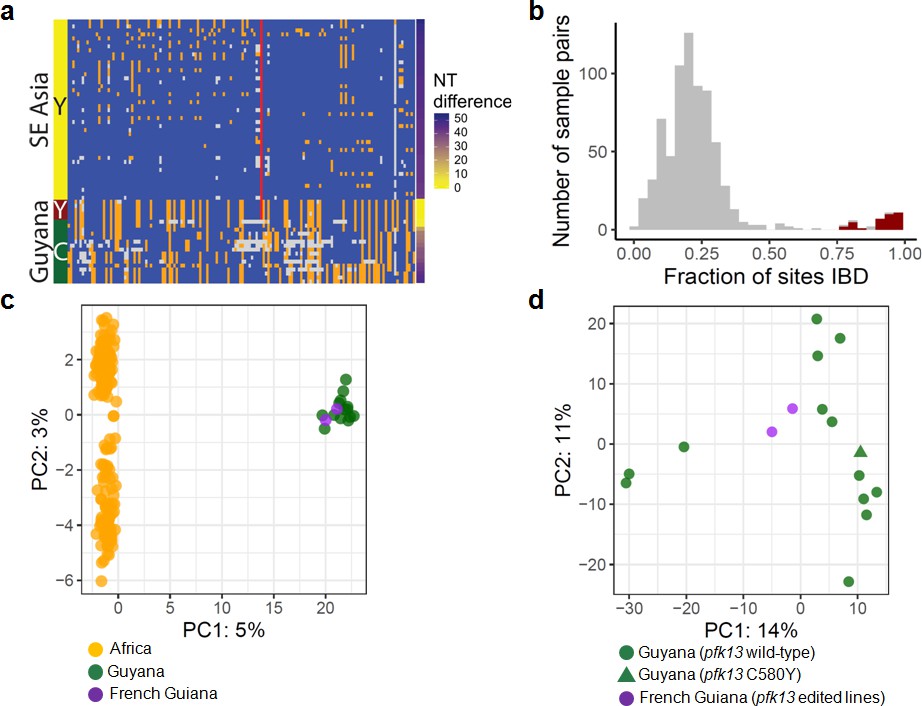
Whole-genome sequence analysis of pfk13 C580Y mutant parasites in Guyana.
(a) Comparison of the haplotypic background of pfk13 C580Y mutant parasites from Guyana, 2016, and Southeast Asia, 2010–2012. Across Pf3k samples from Cambodia, Thailand, and Vietnam, 45 unique C580Y-coding haplotypic backgrounds were identified and compared to haplotypes from Guyana. Columns represent 149 sites containing non-singleton single nucleotide polymorphisms (SNPs) found within a 150 kb segment surrounding the pfk13 C580Y-coding allele. At a given site, the more common allele is marked blue, the less common allele is orange, and missing calls are grey. The Y-coding variant for codon 580 of pfk13 is represented by the red blocks; wild-type is blue. Only the five pfk13 C580Y mutant samples with fewer than 15% missing calls are depicted here. (b) Analysis of relatedness at the whole-genome level among Guyana clones. Pairwise identity-by-descent (IBD) was estimated for all pairs of Guyana samples with high quality whole-genome sequence data (<70% missing calls). Pairwise comparisons between samples exhibiting the pfk13 C580Y allele are indicated in red, and show uniformly high levels of relatedness, suggesting a single clonal lineage harboring the resistance mutation. (c, d) Principal components analysis of parasites from Guyana or other geographic regions using SNP calls from whole-genome sequence data. (c) The parasites from Guyana and French Guiana form a single cluster when compared with parasites from Africa. (d) The two edited parasite lines from French Guiana are highly similar to the sequenced parasite samples from Guyana including a pfk13 mutant.
Figure 2—figure supplement 1
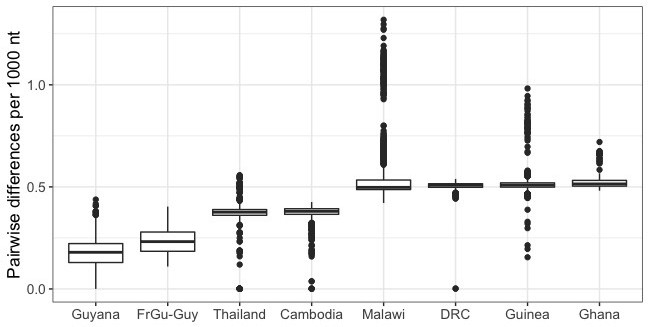
Number of single nucleotide differences between pairs of parasites within different geographic locations.
The median number of nucleotide differences between the two edited French Guianan lines and Guyanese parasites (FrGu-Guy; 0.23 per thousand nucleotides) is lower than the median nucleotide differences between parasite pairs drawn from within any of the other analyzed populations. To account for potential differences in sequencing depth and quality across populations, calculations were made using a set of high quality SNP calls (GATK quality score >20;<80% missing calls for the given population). FrGu: French Guiana, Guy: Guyana, DRC: Democratic Republic of Congo.
Figure 3
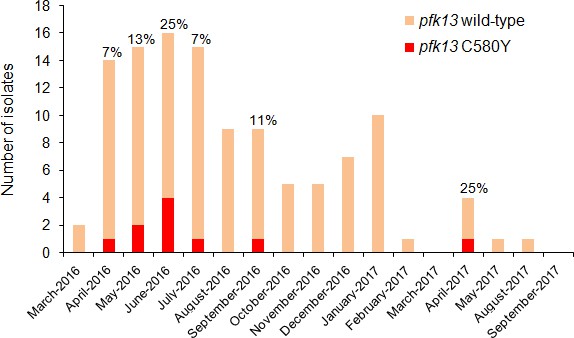
Temporal distribution of pfk13 C580Y mutants in Region 1 of Guyana per month of collection, 2016–2017.
The percentage of pfk13 C580Y mutants for each month of identification is represented above each bar.
-
Figure 3—source data 1
Number of clinical samples with pfk13 WT or C580Y mutant alleles in Region 1 of Guyana from March 2016 to September 2017.
- https://cdn.elifesciences.org/articles/51015/elife-51015-fig3-data1-v1.xlsx
Figure 4
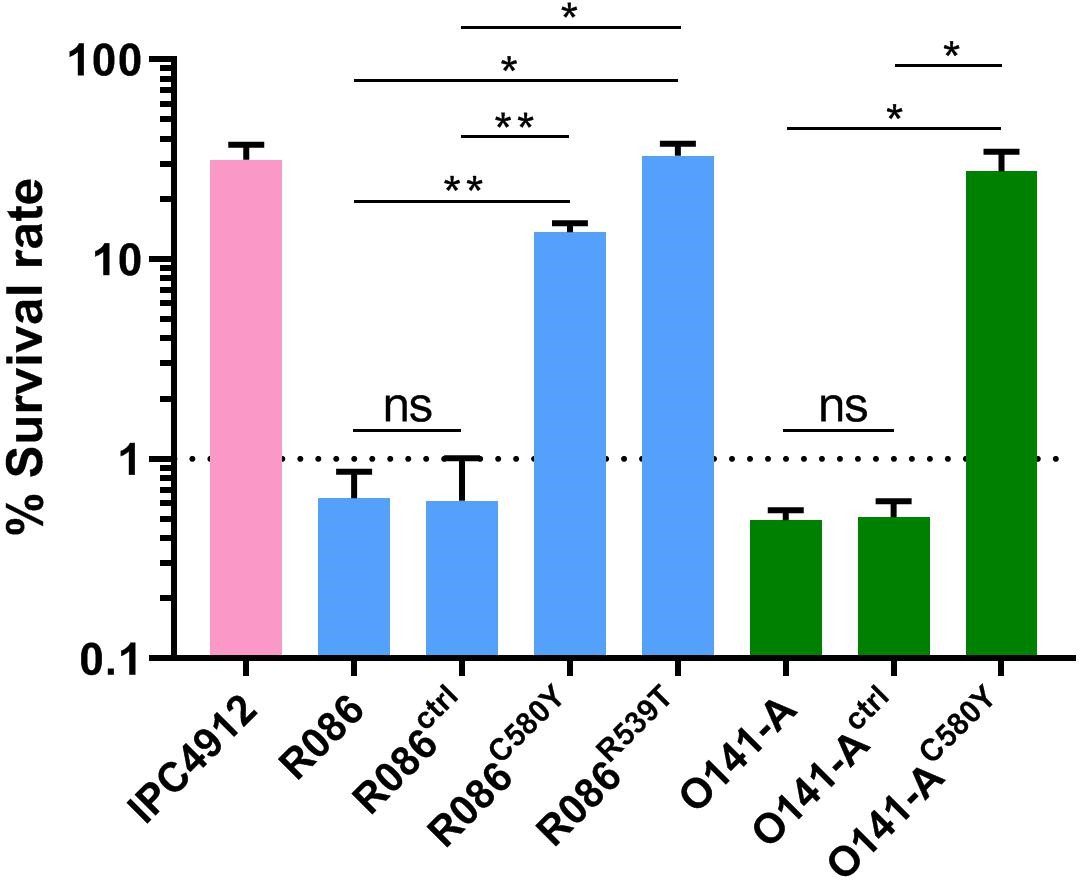
Ring-stage Survival Assays in parasites from French Guiana.
Data show survival rates of ring-stage parasites (0–3 hr post invasion of human erythrocytes) after a 6 hr pulse of 700 nM DHA, as measured by microscopy 66 hr later. Data illustrate mean ± SEM percent survival from three independent repeats compared with dimethyl sulfoxide (DMSO)-treated parasites as a control for two isolates from French Guiana (O141-A, R086). Parents harbored wild-type pfk13 allele, and for zinc-finger nuclease edited isogenic parasites, control (ctrl) isolates harbored wild-type pfk13 allele with silent mutations or pfk13 mutations (C580Y or R539T). IPC4912, a Cambodian reference strain harboring the I543T pfk13 mutation was used as a control. A parasite line is considered resistant when the survival rate is greater than 1%. Student’s t-test was used to assess significant differences between survival rates of parental and pfk13-edited parasites. *p<0.05; **p<0.01; ns: not significant.
-
Figure 4—source data 1
Survival rates obtained on pfk13 gene-edited (wild-type, C580Y or R539T) isogenic field isolates from French Guiana.
- https://cdn.elifesciences.org/articles/51015/elife-51015-fig4-data1-v1.xlsx
Figure 5 with 2 supplements
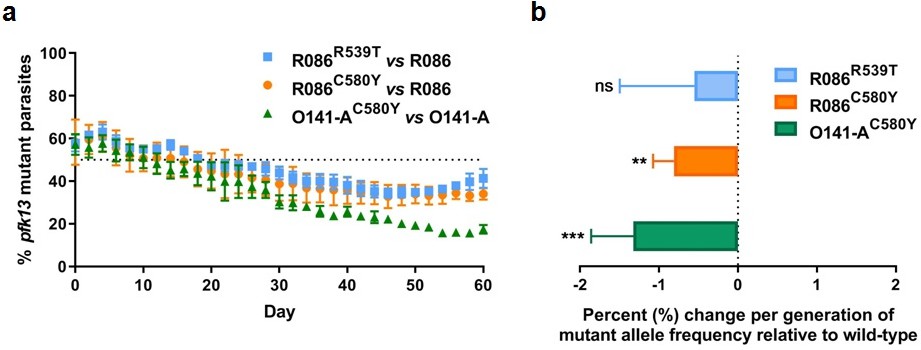
Competition growth assays of pfk13 mutant and wild-type parasites.
(a) Frequency of wild-type and mutant parasites in co-culture, as measured by TaqMan allelic discrimination qPCR. Data show the percentage of pfk13 mutant parasites in the culture over 60 days with sampling every two days. Error bars represent the SEM of pfk13 mutant allele frequency between the two biological replicates (including two technical replicates for qPCR). A percentage below 50% indicates the mutant was less fit than the isogenic pfk13 wild-type line. (b) Percentage change per generation of pfk13 mutant allele frequency relative to wild-type. Data show that pfk13 mutations confer an in vitro fitness cost in both parasite lines. Differences in growth rates were calculated as the percent change in pfk13 mutant allele frequency averaged over 30 generations. Error bars represent the SEM of percentage growth change between the two biological sampling experiments calculated for every generation in each co-culture. Significance was calculated using the Wilcoxon signed-rank test in every generation across the two biological replicate experiments. **p<0.01, ***p<0.001; ns: not significant.
-
Figure 5—source data 1
Proportion of pfk13 mutants compared to pfk13 wild-type during 60 days of in vitro co-culture.
- https://cdn.elifesciences.org/articles/51015/elife-51015-fig5-data1-v1.xlsx
Figure 5—figure supplement 1
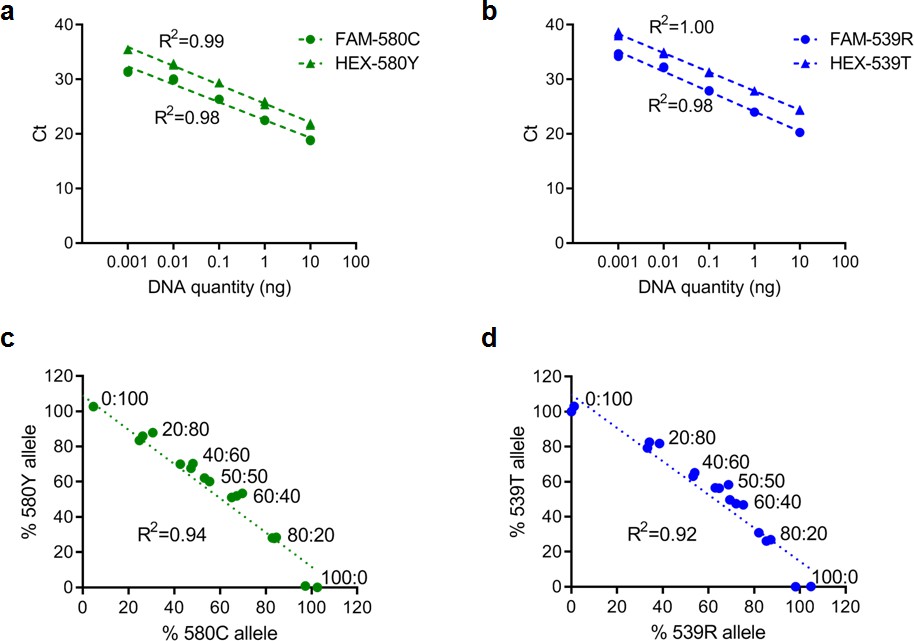
Representative standard curves for qPCR reactions targeting pfk13 C580/C580Y or pfk13 R539/R539T allele.
(a, b) Standard curves showing good amplification efficiency (between 88% and 95%) and high sensitivity using 10-fold serially diluted genomic DNA obtained from wild-type pfk13 C580 and R539 or mutant pfk13 C580Y or R539T parasites. (c, d) Scatter plots for percent wild-type and mutant alleles in multiplexed qPCR assays using pre-defined mixtures of plasmids. We used mixtures comprising of pfk13 C580 and C580Y or R539 and R539T expressing plasmids in fixed molar ratios of wild-type: mutant alleles (0:100, 20:80, 40:60, 50:50, 60:40, 80:20, 100:0) to validate the specificity of using TaqMan qPCR assays to determine the pfk13 allele frequency.
-
Figure 5—figure supplement 1—source data 1
Data for establishment of standard curves and pre-defined set of mixtures of each pfk13 allele (C580Y or R539T) used in the optimization of the Taqman allelic discrimination qPCR assays.
- https://cdn.elifesciences.org/articles/51015/elife-51015-fig5-figsupp1-data1-v1.xlsx
Figure 5—figure supplement 2
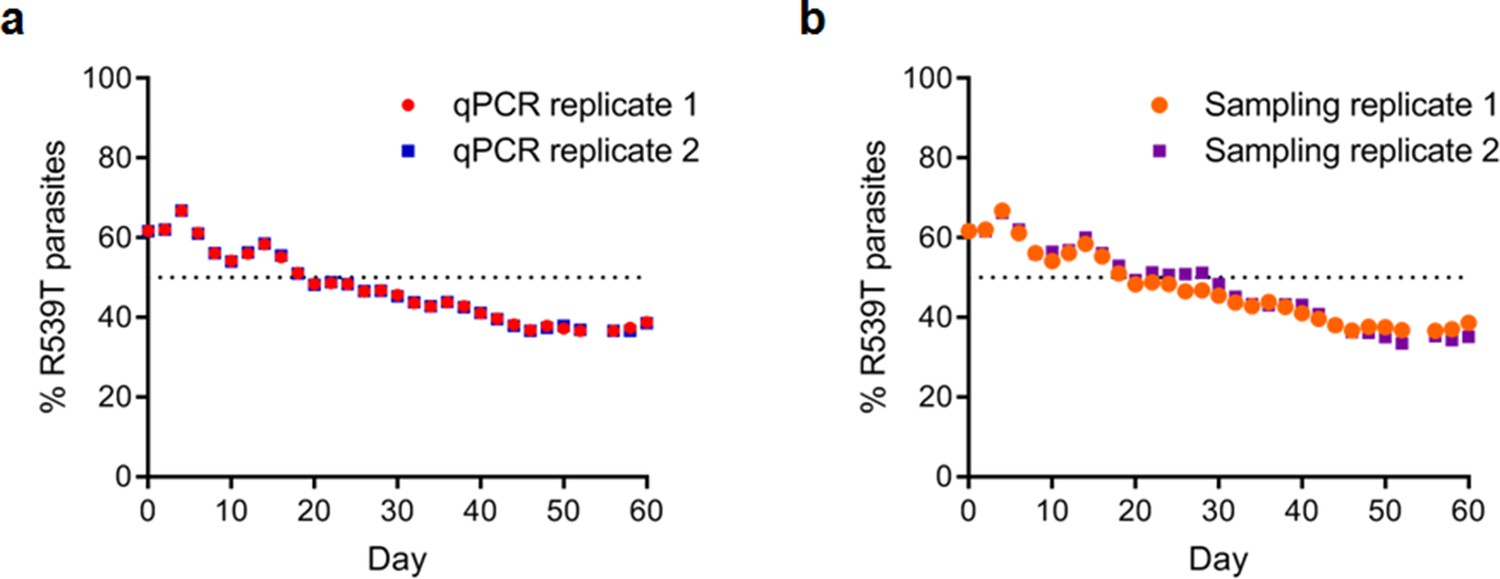
Reproducibility of TaqMan allelic discrimination qPCR performed on R086R539T and R086 parasites.
(a) Scatter plots show the percentage of pfk13 R539T parasites in two separate qPCR technical replicate runs which correlate perfectly. (b) Scatter plots show the percentage of pfk13 R539T parasites in two independent sampling replicates over 60 days in culture, which showed consistent trends.
-
Figure 5—figure supplement 2—source data 1
Data for the reproducibility of the Taqman allelic discrimination assay across qPCR repeats and sampling replicates performed with R086WT vs R086R539T parasites.
- https://cdn.elifesciences.org/articles/51015/elife-51015-fig5-figsupp2-data1-v1.xlsx
Tables
Table 1
pfk13 microsatellite analysis of Guyanese and Cambodian isolates.
| Name | Region | Year of collection | −31.9 | −6.36 | −3.74 | −0.15 | K13° | 3.4 | 8.6 | 15.1 | 72.3 |
|---|---|---|---|---|---|---|---|---|---|---|---|
| T145 | 1 | 2016 | 203 | 277 | 170 | 206 | C580 | 138 | 262 | 144 | 244 |
| T237 | 7 | 2016 | 203 | 277 | 170 | 206 | C580 | 138 | 262 | 144 | 244 |
| T244 | 1 | 2016 | 203 | 280 | 170 | NA | C580 | 138 | NA | 144 | NA |
| T305 | 1 | 2016 | 203 | 277 | 170 | 206 | C580 | 138 | 262 | 144 | 244 |
| T345 | 1 | 2016 | 203 | 277 | 170 | 206 | C580 | 138 | 262 | 144 | 244 |
| T364 | 1 | 2016 | 203 | 277 | 170 | 206 | C580 | 138 | 262 | 144 | 244 |
| T378 | 1 | 2016 | 203 | 277 | 170 | 206 | C580 | NA | 262 | 144 | 244 |
| T385 | 7 | 2016 | 203 | 277 | 170 | 206 | C580 | 138 | 262 | 144 | 244 |
| T445 | 1 | 2016 | 203 | 277 | 170 | 206 | C580 | NA | 262 | 144 | 244 |
| T490 | 7 | 2016 | 203 | 280 | 170 | 206 | C580 | NA | 262 | 144 | 244 |
| T508 | 8 | 2016 | 203 | 277 | 170 | 206 | C580 | 138 | 262 | 144 | 244 |
| T314 | 1 | 2016 | NA | NA | NA | NA | C580 | NA | NA | NA | NA |
| T649 | 1 | 2016 | NA | NA | NA | NA | C580 | NA | NA | NA | NA |
| GUY0183 | 1 | 2017 | ND | ND | ND | ND | C580 | ND | ND | ND | ND |
| T208 | 7 | 2016 | 203 | 280 | 152 | 192 | WT | 138 | 284 | 138 | 244 |
| T265 | 7 | 2016 | 203 | 280 | 156 | 192 | WT | 102 | 262 | 144 | 238 |
| T317 | 1 | 2016 | NA | NA | 156 | 190 | WT | NA | 262 | 144 | 244 |
| T332 | 7 | 2016 | NA | NA | 154 | 190 | WT | 102 | 262 | 144 | 244 |
| T504 | 8 | 2016 | 203 | 280 | 152 | 192 | WT | 138 | 284 | 138 | 244 |
| T524 | 7 | 2016 | NA | NA | 170 | 192 | WT | 102 | 270 | NA | NA |
| T634 | 8 | 2016 | 205 | 280 | 156 | 192 | WT | 102 | 262 | 144 | 238 |
| T724 | 8 | 2016 | 203 | 280 | 154 | 192 | WT | NA | 284 | 138 | 240 |
| Guyana A* | 1 and 7 | 2010 | 203 | 277 | 170 | 206 | C580 | 138 | 262 | 144 | 244 |
| Guyana B* | 7 | 2010 | 203 | 277 | 170 | 206 | C580 | 138 | 262 | 144 | 240 |
| MRA 1236* | 2010 | 201 | 283 | 146 | 194 | C580 | 130 | 286 | 138 | NA | |
| MRA 1240* | 2011 | 201 | 283 | 146 | 194 | R539 | 122 | 264 | 138 | 244 | |
| MRA 1241* | 2011 | 201 | 283 | 146 | 194 | I453 | 130 | 290 | 138 | 244 | |
| 3D7 | 207 | 283 | 164 | 226 | WT | 160 | 274 | 147 | 242 | ||
| 7G8 | 225 | 280 | 158 | 196 | WT | 102 | 262 | 144 | 240 |
-
°Codons 438–704, NA: No Amplification, ND: Not Done, *: Mutants from Chenet et al., 2016 according to the new size-assignment for microsatellites.
Additional files
-
Source code 1
Source code to calculate the nucleotide diversity per nucleotide.
- https://cdn.elifesciences.org/articles/51015/elife-51015-code1-v1.pl
-
Source code 2
Source code to calculate the nucleotide diversity per genomic region.
- https://cdn.elifesciences.org/articles/51015/elife-51015-code2-v1.pl
-
Source code 3
Example of input file to do calculations.
- https://cdn.elifesciences.org/articles/51015/elife-51015-code3-v1.txt
-
Supplementary file 1
Resistance genotype profiles of parasites from Guyana and French Guiana.
- https://cdn.elifesciences.org/articles/51015/elife-51015-supp1-v1.docx
-
Supplementary file 2
Guyana SWGA associated markers.
- https://cdn.elifesciences.org/articles/51015/elife-51015-supp2-v1.xlsx
-
Supplementary file 3
Comparison of synonymous nucleotide diversity per country.
- https://cdn.elifesciences.org/articles/51015/elife-51015-supp3-v1.docx
-
Supplementary file 4
List of the sets of forward and reverse primers and dual fluorescent-labeled FAM/HEX MGB probes used.
- https://cdn.elifesciences.org/articles/51015/elife-51015-supp4-v1.docx
-
Transparent reporting form
- https://cdn.elifesciences.org/articles/51015/elife-51015-transrepform-v1.docx
Download links
A two-part list of links to download the article, or parts of the article, in various formats.
Downloads (link to download the article as PDF)
Open citations (links to open the citations from this article in various online reference manager services)
Cite this article (links to download the citations from this article in formats compatible with various reference manager tools)
Local emergence in Amazonia of Plasmodium falciparum k13 C580Y mutants associated with in vitro artemisinin resistance
eLife 9:e51015.
https://doi.org/10.7554/eLife.51015


