Coordination of tissue cell polarity by auxin transport and signaling
- University of Alberta, Canada
Figures
Figure 1
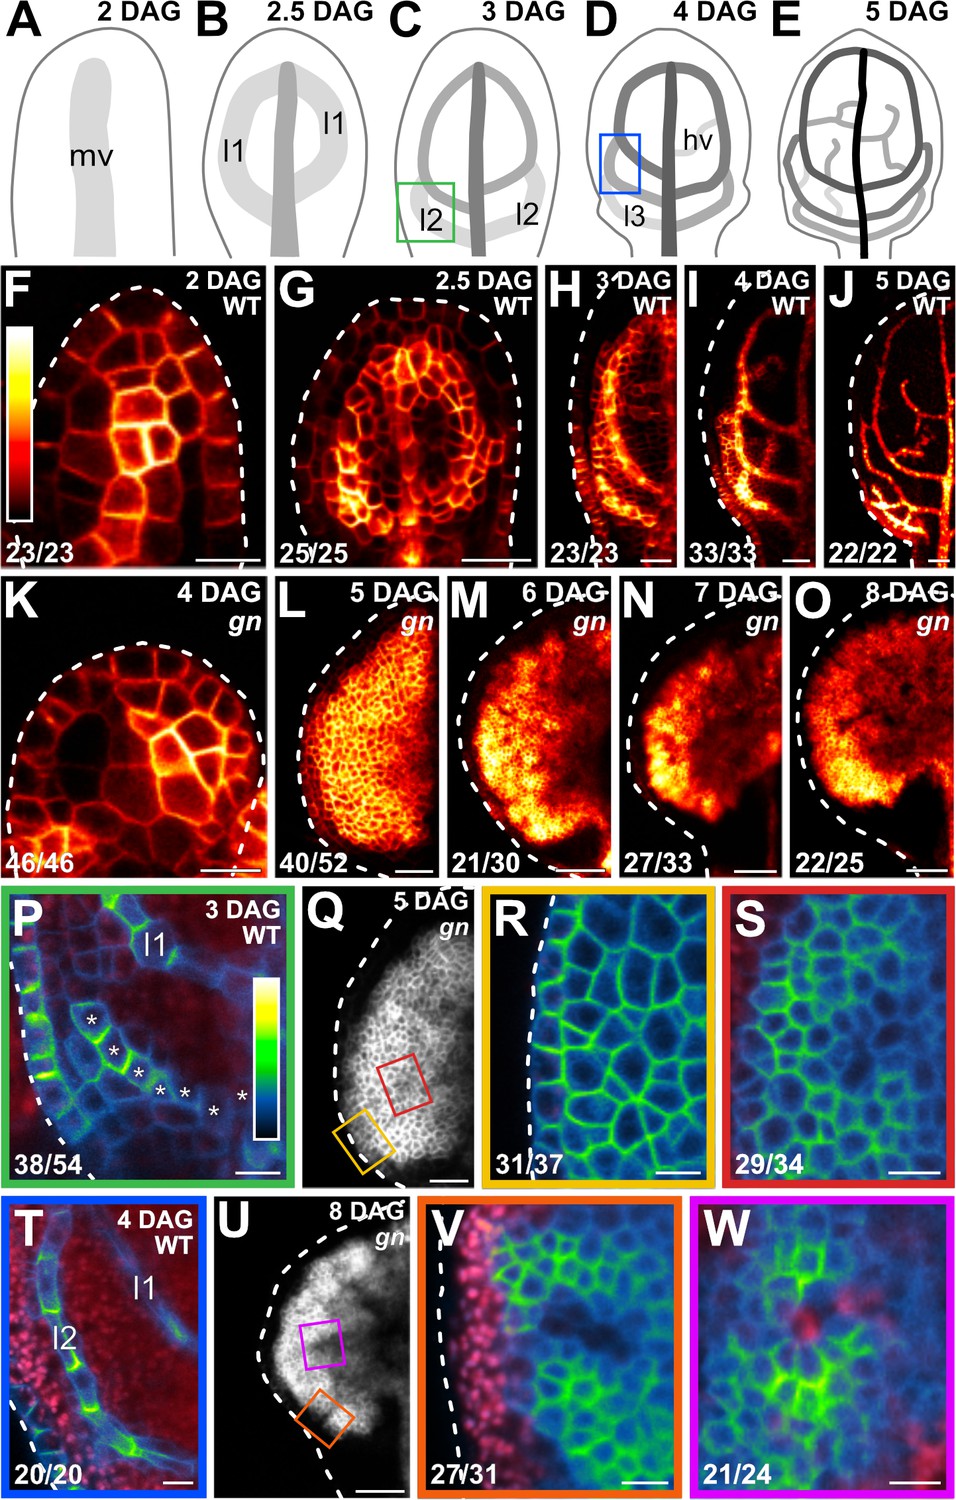
PIN1 expression and localization during gn leaf development.
(A–Q,T,U) Top right: leaf age in days after germination (DAG). (A–E) Veins form sequentially during Arabidopsis leaf development: the formation of the midvein (mv) is followed by the formation of the first loops of veins (‘first loops’; l1), which in turn is followed by the formation of second loops (l2) and minor veins (hv) (Mattsson et al., 1999; Sieburth, 1999; Kang and Dengler, 2004; Scarpella et al., 2004). Loops and minor veins differentiate in a tip-to-base sequence during leaf development. Increasingly darker grays depict progressively later stages of vein development. Boxes in C and D illustrate positions of closeups in P and T. l3: third loop. (F–W) Confocal laser scanning microscopy. First leaves. For simplicity, only half-leaves are shown in H–J and L–O. Dashed white line in F–R and T–V delineates leaf outline. (F–Q,T,U) Top right: genotype. (F–P,R–T,V,W) Bottom left: reproducibility index. (F–O) PIN1::PIN1:YFP expression; look‐up table (ramp in F) visualizes expression levels. (P,R–T,V,W) PIN1::PIN1:GFP expression; look‐up table (ramp in P) visualizes expression levels. Red: autofluorescence. Stars in P label cells of the developing second loop. (Q,U) PIN1::PIN1:YFP expression. Boxes in Q and in U illustrate positions of closeups in R and S, and in V and W, respectively. Bars: (F,P,R–T,V,W) 10 µm; (G,I,L,Q) 30 µm; (H,K) 20 µm; (J,M–O,U) 60 µm.
Figure 2 with 2 supplements

Vascular phenotype spectrum of gn.
(A,B) Vein pattern of WT mature first leaf. In A: red, midvein; orange, loops; gray, minor veins. (B–J) Dark‐field illumination of mature first leaves illustrating phenotype classes (top right): class 0, narrow I‐shaped midvein and scalloped vein‐network outline (B); class a1, dense vein network and apically thickened vein‐network outline (not shown); class a2, open vein-network outline (C); class a3, fragmented vein network (D); class a4, open vein-network outline and fragmented vein network (E); class a5, open vein-network outline, fragmented vein network, and apically thickened vein‐network outline (F); class a6, wide midvein, dense network of thick veins, and jagged vein‐network outline (G); class a7, dense network of thick veins that fail to join the midvein in the bottom half of the leaf and pronouncedly jagged vein‐network outline (H); class a8, wide midvein and shapeless vascular cluster (I); class a9, fused leaves with wide midvein and shapeless vascular cluster (not shown); class a10, shapeless vascular cluster (J). (K–M) Details of vascular clusters illustrating vascular elements uniformly oriented perpendicular to the leaf margin (K) (class a6); vascular elements oriented seemingly randomly at the distal side of the cluster and parallel to the leaf axis at the proximal side of the cluster (L) (classes a8 and a9); and seemingly random orientation of vascular elements (M) (classes a8–a10). (N) Percentages of leaves in phenotype classes. Difference between gn‐18 and WT, between gnfwr and WT, between gnB/E and WT, between gnR5 and WT, between gnvan7 and WT, between gnvan7+fwr;gn‐13 and WT, between gnSALK_103014 and WT, between gn‐13 and WT, and between emb30‐8 and WT was significant at p<0.001 (***) by Kruskal‐Wallis and Mann‐Whitney test with Bonferroni correction. Sample population sizes: WT, 66; gn‐18, 172; gnfwr, 43; gnB/E, 85; gnR5, 93; gnvan7, 109; gnvan7+fwr;gn‐13 no. 5, 97; gnvan7+fwr;gn‐13 no. 7, 93; gnSALK_103014, 32; gn‐13, 56; gnemb30‐8, 45. Bars: (B–F) 1 mm; (G) 0.75 mm; (H,I) 0.5 mm; (J) 0.25 mm; (K–M) 50 µm. See Figure 2—figure supplement 1 for effect of the gn-18 mutation on GN expression. See Figure 2—figure supplement 2 for alternative visual display of distribution of leaves in phenotype classes.
-
Figure 2—source data 1
Distribution and frequency of leaves in phenotype classes and statistical analysis.
- https://cdn.elifesciences.org/articles/51061/elife-51061-fig2-data1-v1.xlsx
Figure 2—figure supplement 1

Effect of the gn-18 mutation on GN expression.
RT‐PCR analysis of GN expression in 4-day-old seedlings of WT and gn-18. The nearly evenly expressed ROC1 (Lippuner et al., 1994) was used as control. Look‐up table visualizes expression levels.
Figure 2—figure supplement 2

Percentages of leaves in phenotype classes.
See legend to Figure 2N for details of statistical analysis and sample population sizes.
Figure 3 with 3 supplements
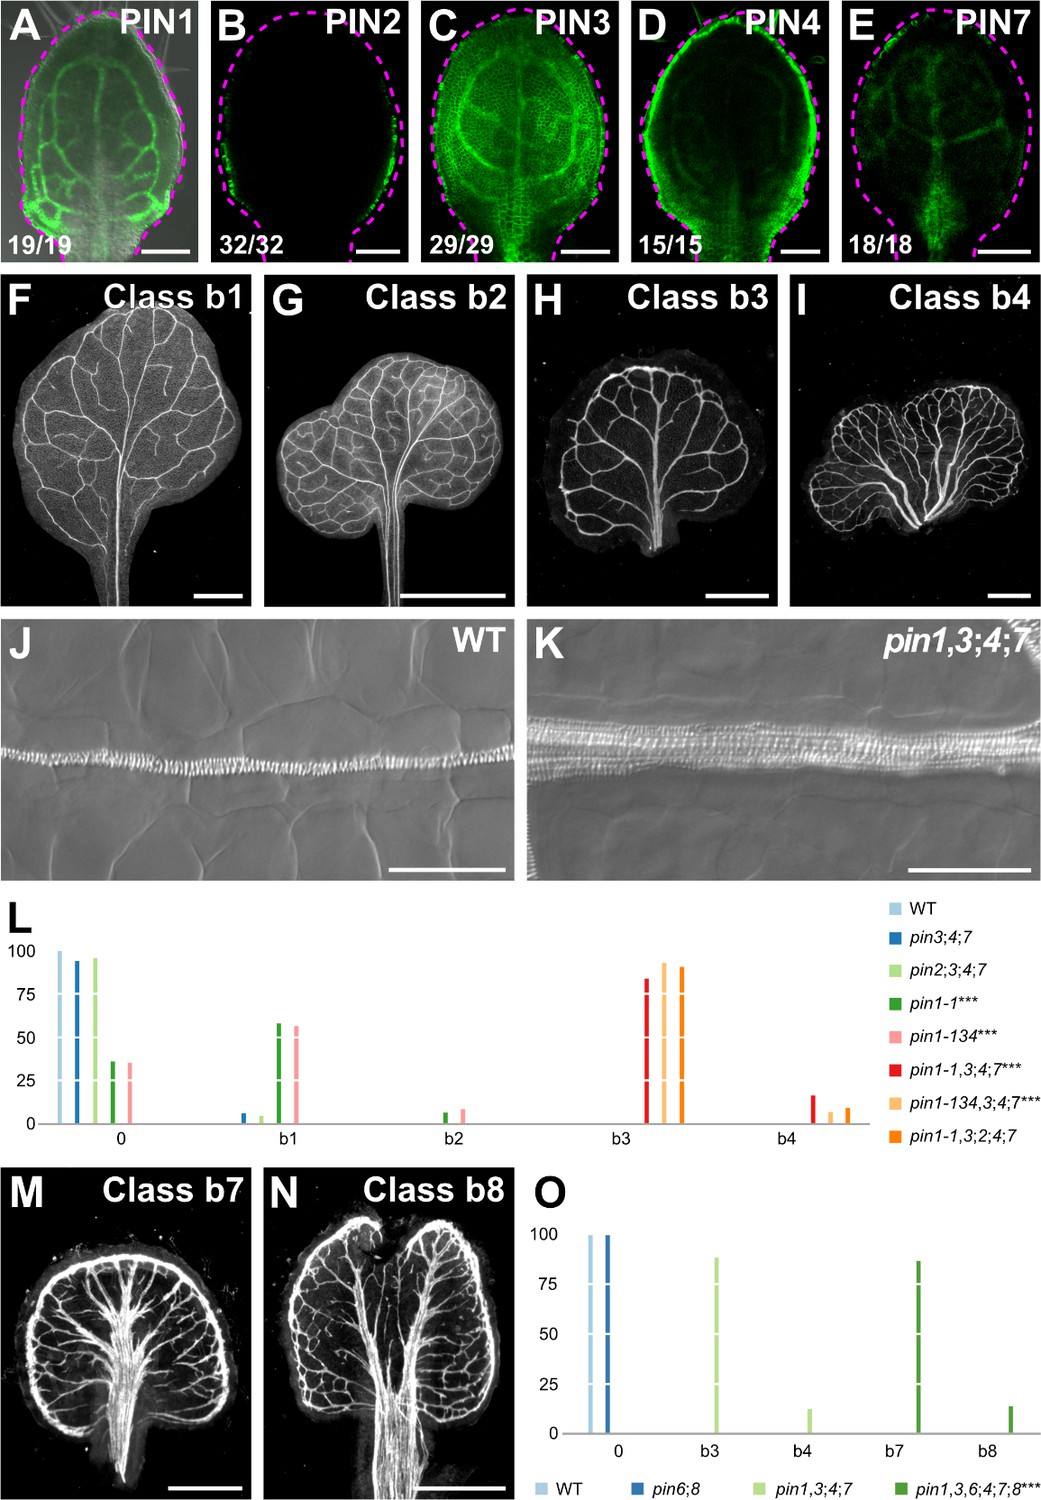
Vein pattern defects of pin mutants.
(A–K,M,N) Top right: expression‐reported gene, phenotype class, or genotype. (B–E) Bottom left: reproducibility index. (A–E) Confocal laser scanning microscopy with (A) or without (B–E) transmitted light; 4‐day‐old first leaves. Dashed magenta line delineates leaf outline. (A) PIN1::PIN1:GFP expression. (B) PIN2::PIN2:GFP expression. (C) PIN3::PIN3:GFP expression. (D) PIN4::PIN4:GFP expression. (E) PIN7::PIN7:GFP expression. (F–I,M,N) Dark‐field illumination images of mature first leaves illustrating phenotype classes: class b1, Y‐shaped midvein and scalloped vein‐network outline (F); class b2, fused leaves with scalloped vein‐network outline (G); class b3, thick veins and scalloped vein‐network outline (H); class b4, fused leaves with thick veins and scalloped vein‐network outline (I); class b7, wide midvein, more lateral‐veins, and conspicuous marginal vein (M); class b8, fused leaves with wide midvein, more lateral‐veins, and conspicuous marginal vein (N). (J,K) Differential interference images of details of WT (J) or pin1‐1,3;4;7 (K) illustrating normal (classes 0, b1, and b2) or thick (classes b3 and b4) veins, respectively. (L,O) Percentages of leaves in phenotype classes (Class 0 defined in Figure 2). (L) Difference between pin1‐1 and WT, between pin1‐134 and WT, between pin1‐1,3;4;7 and pin1‐1, and between pin1‐134,3;4;7 and pin1‐134 was significant at p<0.001 (***) by Kruskal‐Wallis and Mann‐Whitney test with Bonferroni correction. Sample population sizes: WT, 58; pin2;3;4;7, 49; pin3;4;7, 102; pin1‐1, 81; pin1‐134, 48; pin1‐1,3;4;7, 75; pin1‐134,3;4;7, 45; pin1‐1,3;2;4;7, 99. (O) Difference between pin1‐1,3,6;4;7;8 and pin1‐1,3;4;7 was significant at p<0.001 (***) by Kruskal‐Wallis and Mann‐Whitney test with Bonferroni correction. Sample population sizes: WT, 51; pin6;8, 47; pin1‐1,3;4;7, 49; pin1‐1,3,6;4;7;8, 73. Bars: (A–E) 0.1 mm; (F–H) 1 mm; (I) 5 mm; (J,K) 50 µm; (M,N) 0.5 mm. See Figure 3—figure supplement 1 for alternative visual display of distribution of leaves in phenotype classes. See Figure 3—figure supplement 2 for pin mutant seedlings. See Figure 3—figure supplement 3 for cotyledon patterns of pin mutants.
-
Figure 3—source data 1
Distribution and frequency in phenotype classes and statistical analysis of the leaves in Figure 3L and Figure 3—figure supplement 1A.
- https://cdn.elifesciences.org/articles/51061/elife-51061-fig3-data1-v1.xlsx
-
Figure 3—source data 2
Distribution and frequency in phenotype classes and statistical Analysis of the Leaves in Figure 3O and Figure 3—figure supplement 1B.
- https://cdn.elifesciences.org/articles/51061/elife-51061-fig3-data2-v1.xlsx
Figure 3—figure supplement 1
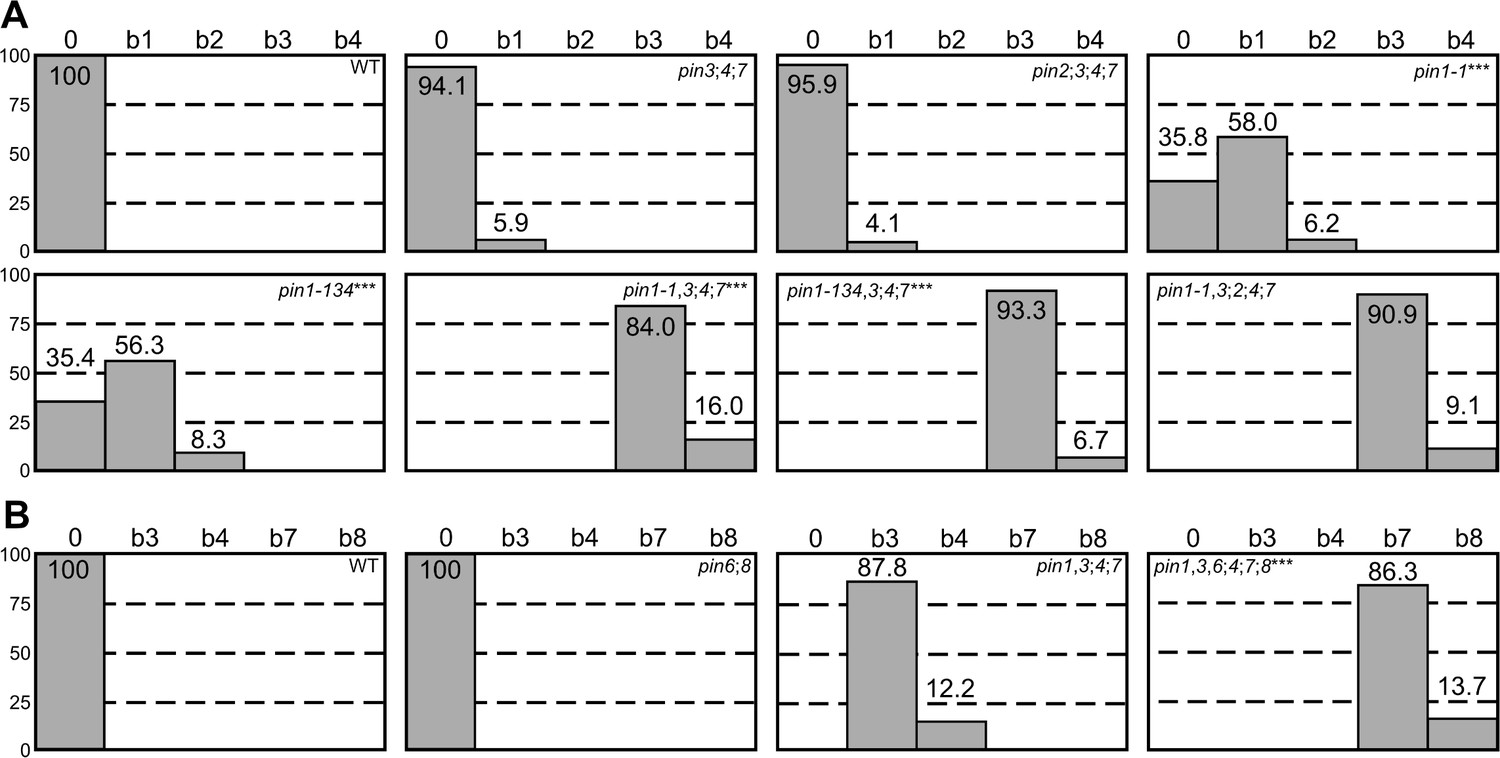
Percentages of leaves in phenotype classes.
Figure 3—figure supplement 2
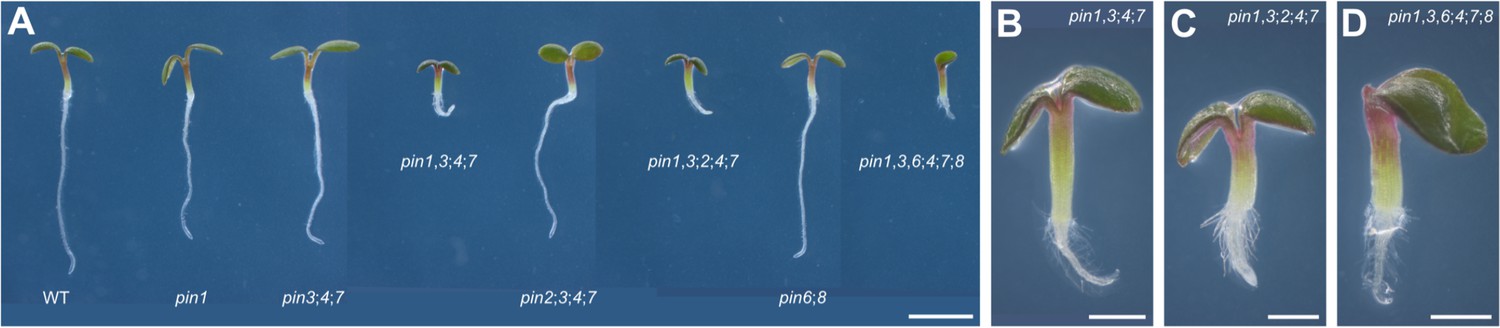
pin mutant seedlings.
(A–D) Dark‐field illumination composite of 3‐day‐old seedlings; genotypes below respective seedlings (A) or top right (B–D). (A) Overview. Because the seedling lineup was wider than the stereomicroscope’s field of view, overlapping images of parts of the lineup were acquired and combined to reconstruct the original lineup. (B–D) Details. Bars: (A) 2 mm; (B–D) 0.5 mm.
Figure 3—figure supplement 3
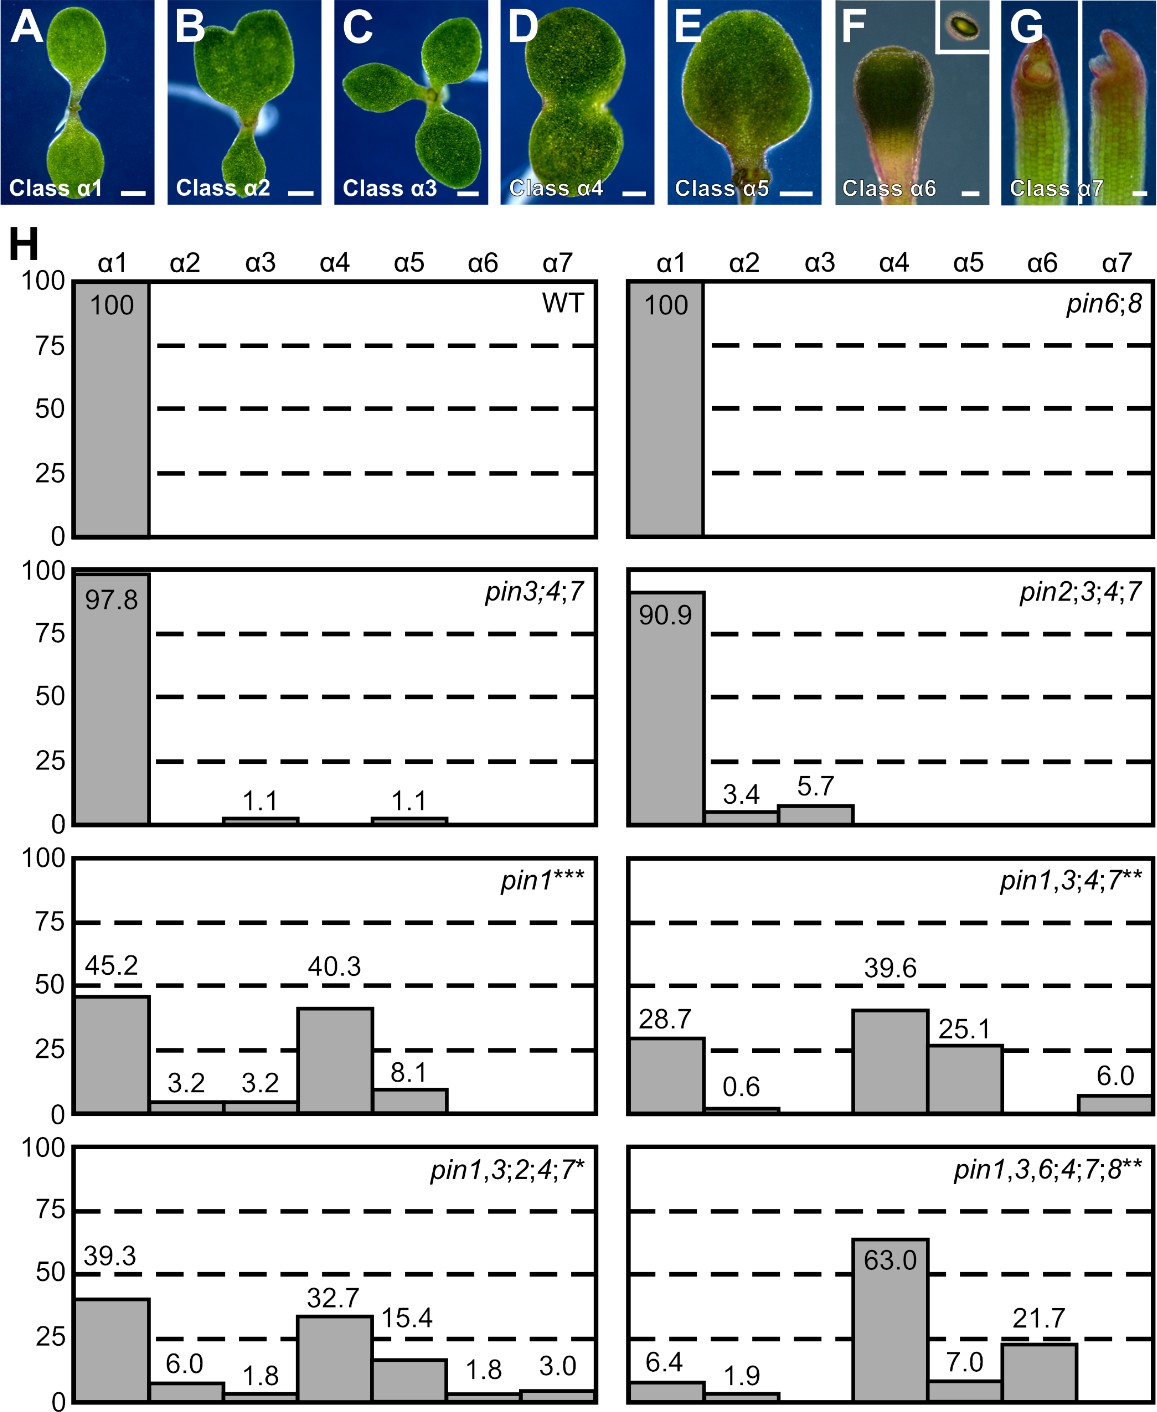
Cotyledon patterns of pin mutants.
(A–G) Dark‐field illumination of 3‐day‐old seedlings illustrating phenotype classes (bottom left): class α1, two separate cotyledons (A); class α2, fused cotyledons and separate single cotyledon (B); class α3, three separate cotyledons (C); class α4, fused cotyledons (D); class α5, single cotyledon (E); class α6, cup‐shaped cotyledon, side view (inset: top view) (F); class α7, small, hood‐like outgrowth (G: left, front view; right, side view). (H) Percentages of seedlings in phenotype classes. Difference between pin1‐1 and WT was significant at p<0.001 (***); between pin1‐1,3;4;7 and pin1‐1, and between pin1‐1,3,6;4;7;8 and pin1‐1 was significant at p<0.01 (**); and between pin1‐1,3;2;4;7 and pin1‐1,3;4;7seven was significant at p<0.05 (*) by Kruskal‐Wallis and Mann‐Whitney test with Bonferroni correction. Sample population sizes: WT, 58; pin6;8, 50; pin3;4;7, 93; pin2;3;4;7, 88; pin1-1, 62; pin1‐1,3;4;7, 167; pin1‐1,3;2;4;7, 168; pin1‐1,3,6;4;7;8, 157. Bars: (A–E) 0.5 mm; (F) 0.25 mm; (G) 0.2 mm.
Figure 4 with 1 supplement
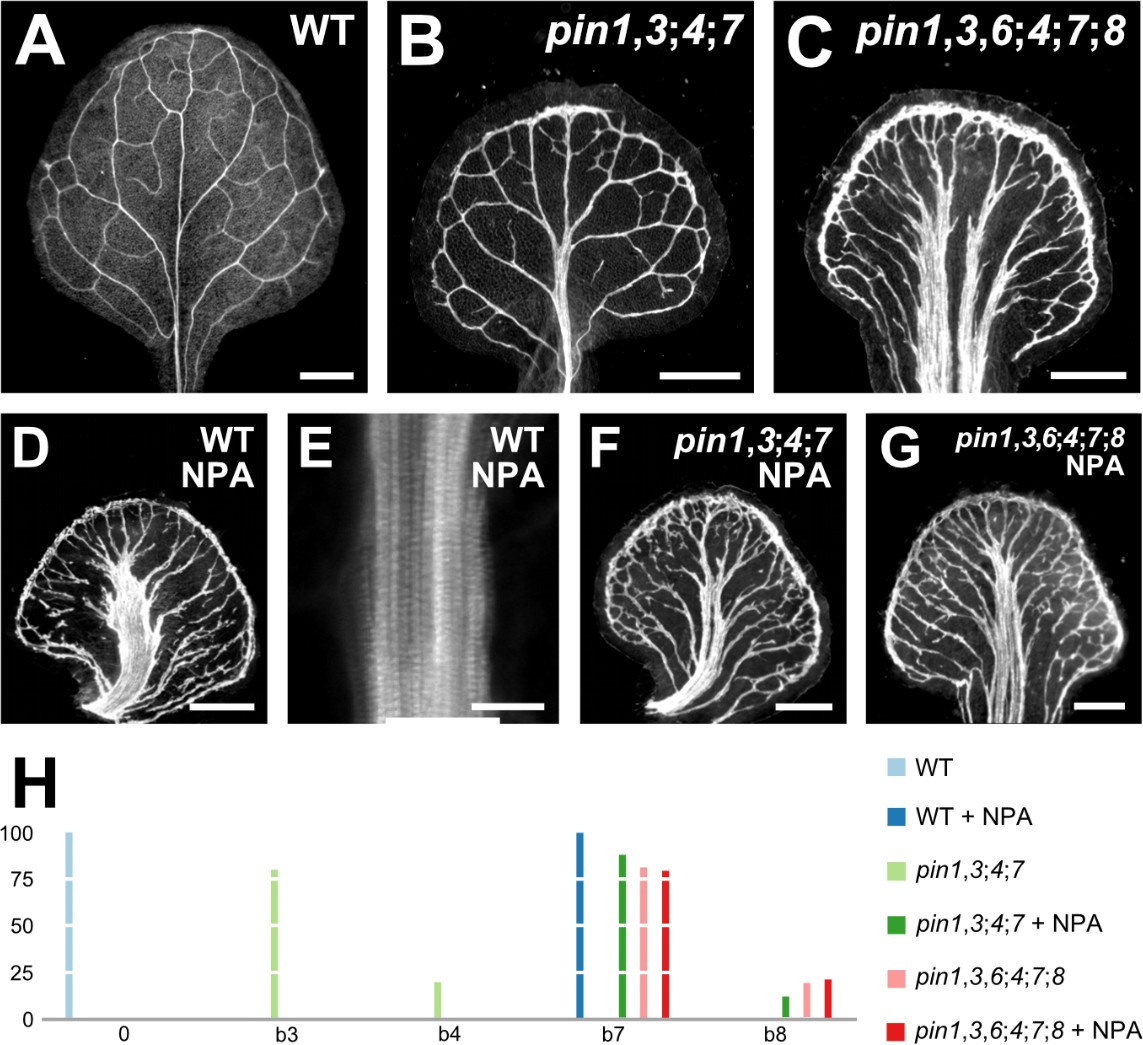
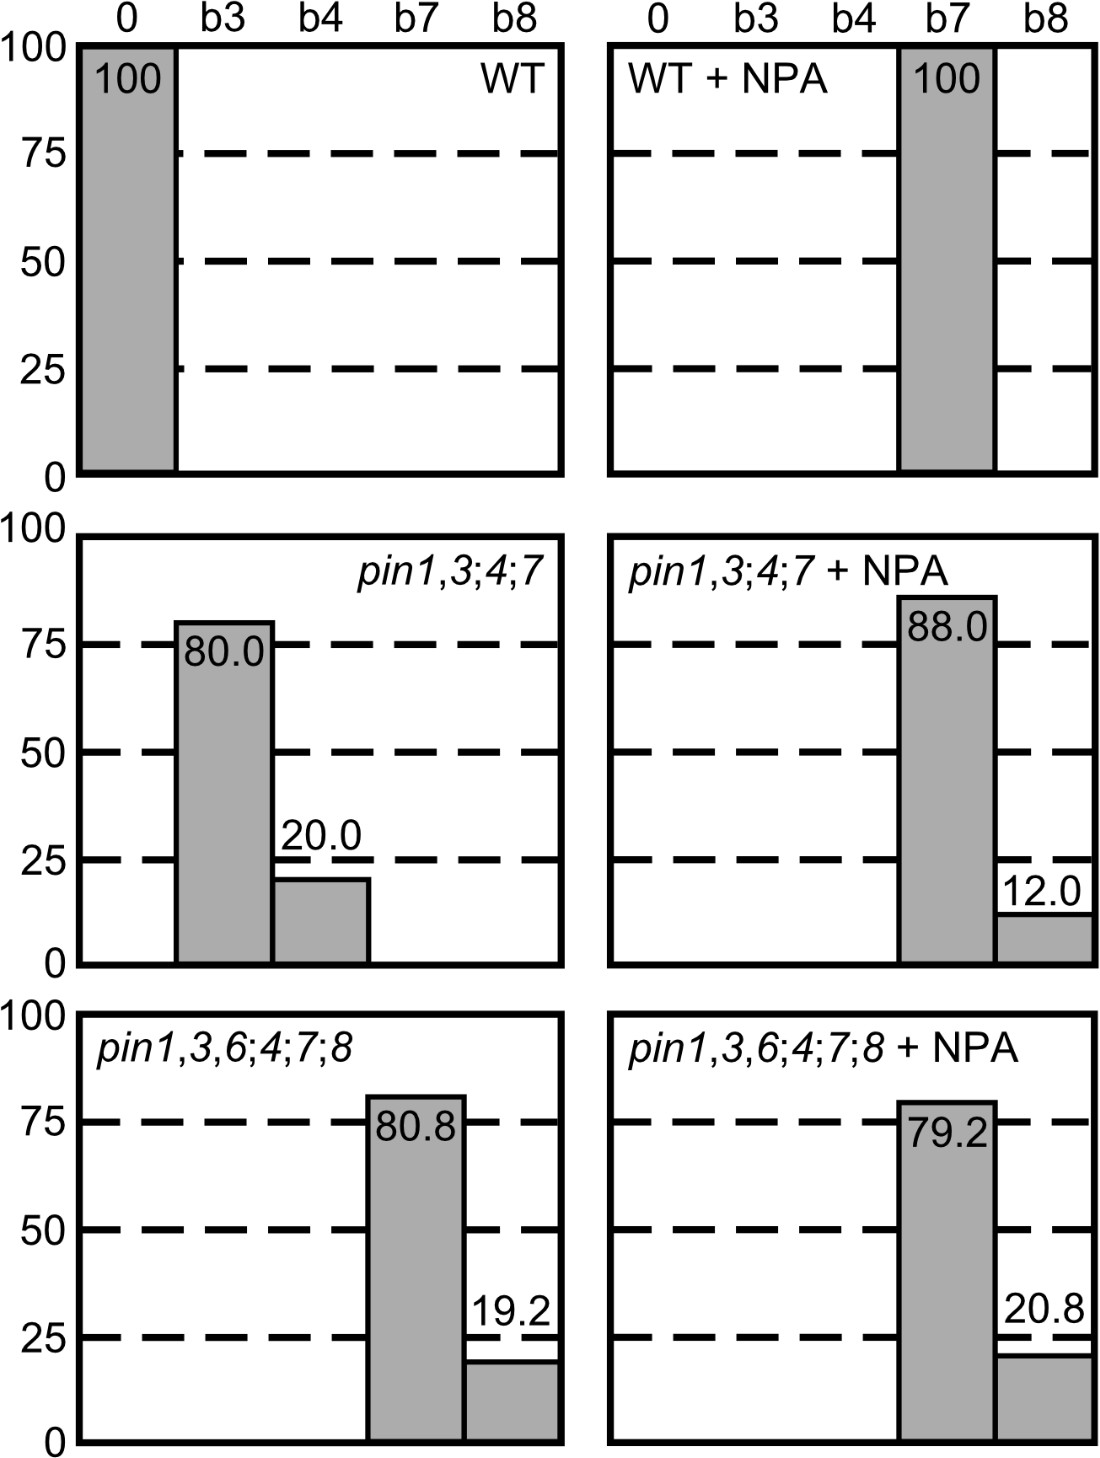
Vein pattern defects induced by chemical inhibition of auxin transport.
(A–G) Top right: genotype and treatment. Dark‐field illumination (A–D,F,G) or confocal laser scanning microscopy (E) of mature first leaves. (E) Detail illustrating thick veins in NPA‐grown WT (compare with Figure 3J). (H) Percentages of leaves in phenotype classes (defined in Figures 2 and 3). Sample population sizes: WT, 38; pin1‐1,3;4;7, 30; pin1‐1,3,6;4;7;8, 73; NPA‐grown WT, 41; NPA‐grown pin1‐1,3;4;7, 58; NPA‐grown pin1‐1,3,6;4;7;8, 48. Bars: (A–D,F,G) 0.5 mm, (E) 25 µm. See Figure 4—figure supplement 1 for alternative visual display of distribution of leaves in phenotype classes.
-
Figure 4—source data 1
Distribution and frequency of leaves in phenotype classes and statistical analysis.
- https://cdn.elifesciences.org/articles/51061/elife-51061-fig4-data1-v1.xlsx
Figure 4—figure supplement 1
Percentages of leaves in phenotype classes.
See legend to Figure 4H for details of statistical analysis and sample population sizes.
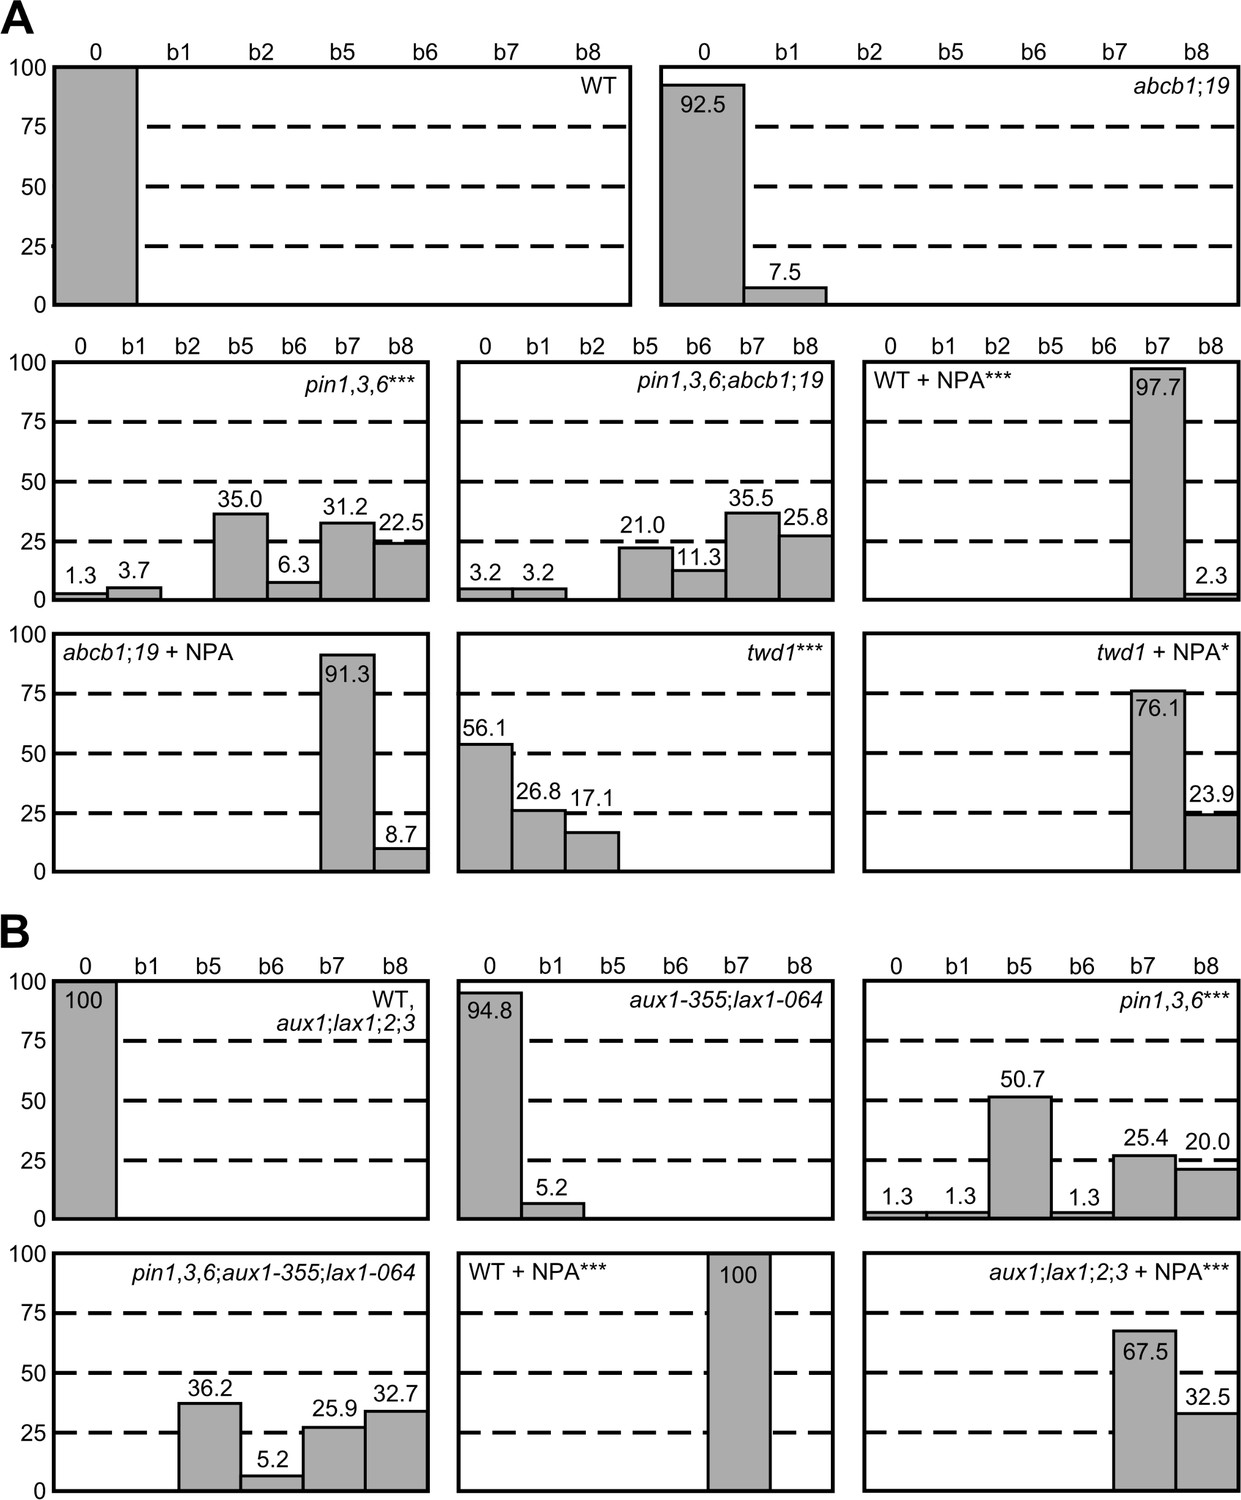
Figure 5 with 3 supplements
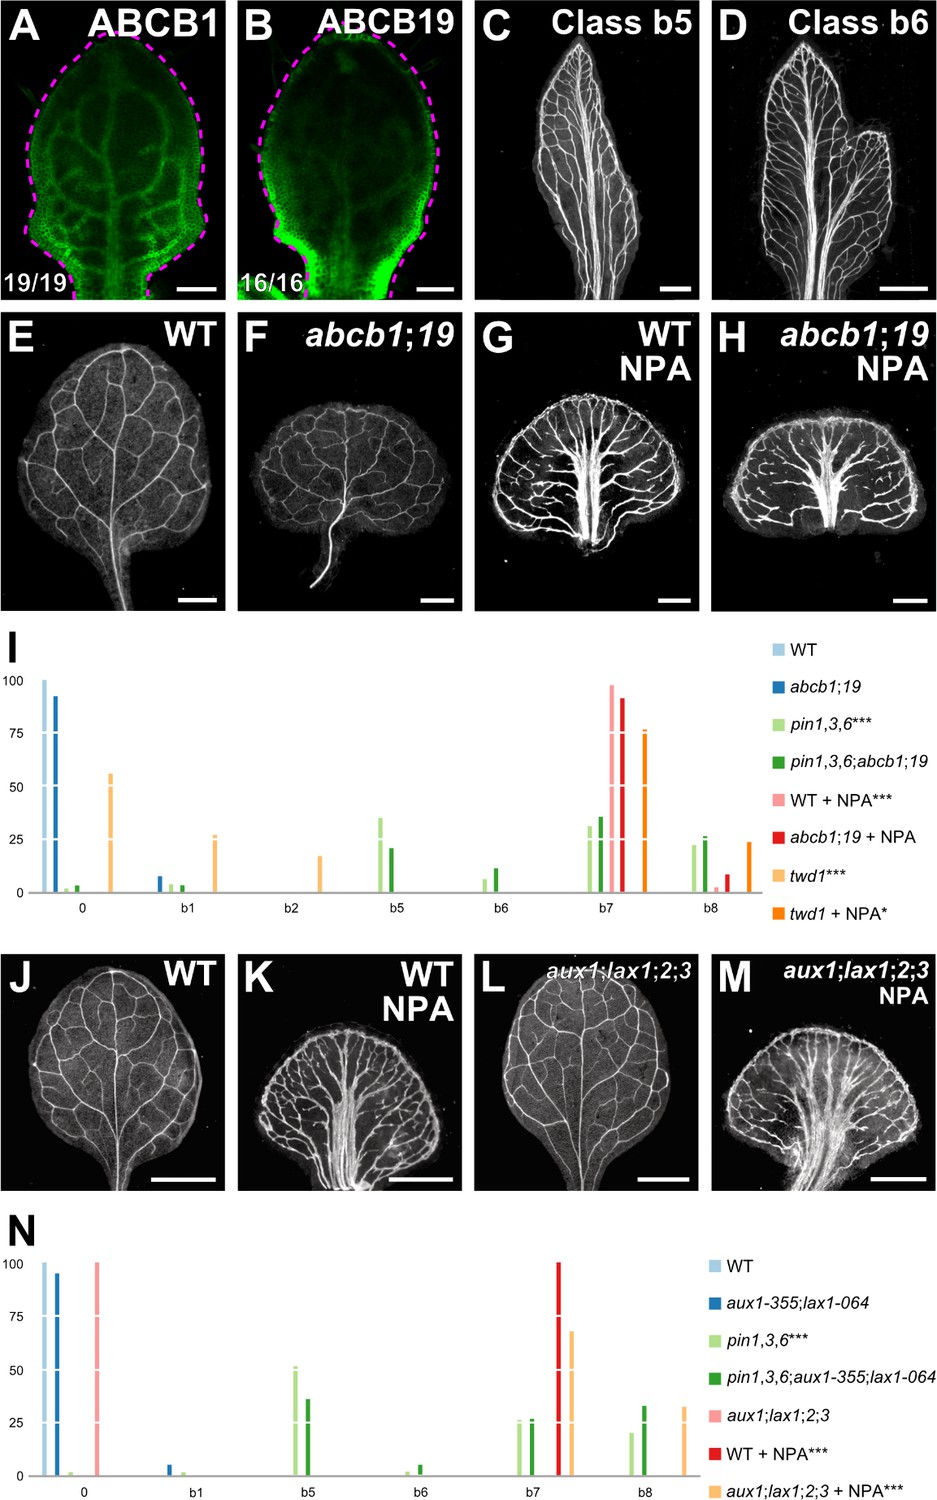
Vascular phenotype of abcb and aux1/lax mutants.
(A,B,E–H,J–M) Top right: expression‐reported gene, genotype, and treatment. (A,B) Bottom left: reproducibility index. (A,B) Confocal laser scanning microscopy; 5‐day‐old first leaves. Dashed magenta line delineates leaf outline. (A) ABCB1::ABCB1:GFP expression. (B) ABCB19::ABCB19:GFP expression. (C–H,J–M) Dark‐field illumination of mature first leaves. (C,D) Phenotype classes: class b5, thick veins and conspicuous marginal vein (C); class b6, fused leaves with thick veins and conspicuous marginal vein (D). (I,N) Percentages of leaves in phenotype classes (Classes 0, b1, b2, b7, and b8 defined in Figures 2 and 3). Difference between pin1‐1,3,6 and WT, between twd1 and WT, and between NPA‐grown WT and WT was significant at p<0.001 (***); and between NPA‐grown twd1 and NPA‐grown WT was significant at p<0.05 (*) by Kruskal‐Wallis and Mann‐Whitney test with Bonferroni correction. Sample population sizes: WT, 41; abcb1;19, 40; pin1‐1,3,6, 80; pin1‐1,3,6;abcb1;19, 62; NPA‐grown WT, 43; NPA‐grown abcb1;19, 46; twd1, 41; NPA‐grown twd1, 46. (N) Difference between pin1‐1,3,6 and WT, between NPA‐grown WT and WT, and between NPA‐grown aux1‐21;lax1;2;3 and NPA‐grown WT was significant at p<0.001 (***) by Kruskal‐Wallis and Mann‐Whitney test with Bonferroni correction. Sample population sizes: WT, 53; aux1‐21;lax1;2;3, 60; aux1‐355;lax1‐064, 77; pin1‐1,3,6, 75; pin1‐1,3,6;aux1‐355;lax1‐064, 58; NPA‐grown WT, 46; NPA‐grown aux1‐21;lax1;2;3, 40. Bars: (A,B) 0.1 mm; (C–H) 0.5 mm.; (J–M) 1 mm. See Figure 5—figure supplement 1 for alternative visual display of distribution of leaves in phenotype classes. See Figure 5—figure supplement 2 for cotyledon patterns of pin, abcb, and aux1/lax mutants. See Figure 5—figure supplement 3 for effect of the aux1-355 mutation on AUX1 expression and of the lax1-064 mutation on LAX1 expression.
-
Figure 5—source data 1
Distribution and frequency in phenotype classes and statistical analysis of the leaves in Figure 5I and Figure 5—figure supplement 1A.
- https://cdn.elifesciences.org/articles/51061/elife-51061-fig5-data1-v1.xlsx
-
Figure 5—source data 2
Distribution and frequency in phenotype classes and statistical analysis of the leaves in Figure 5N and Figure 5—figure supplement 1B.
- https://cdn.elifesciences.org/articles/51061/elife-51061-fig5-data2-v1.xlsx
Figure 5—figure supplement 1
Percentages of leaves in phenotype classes.
Figure 5—figure supplement 2
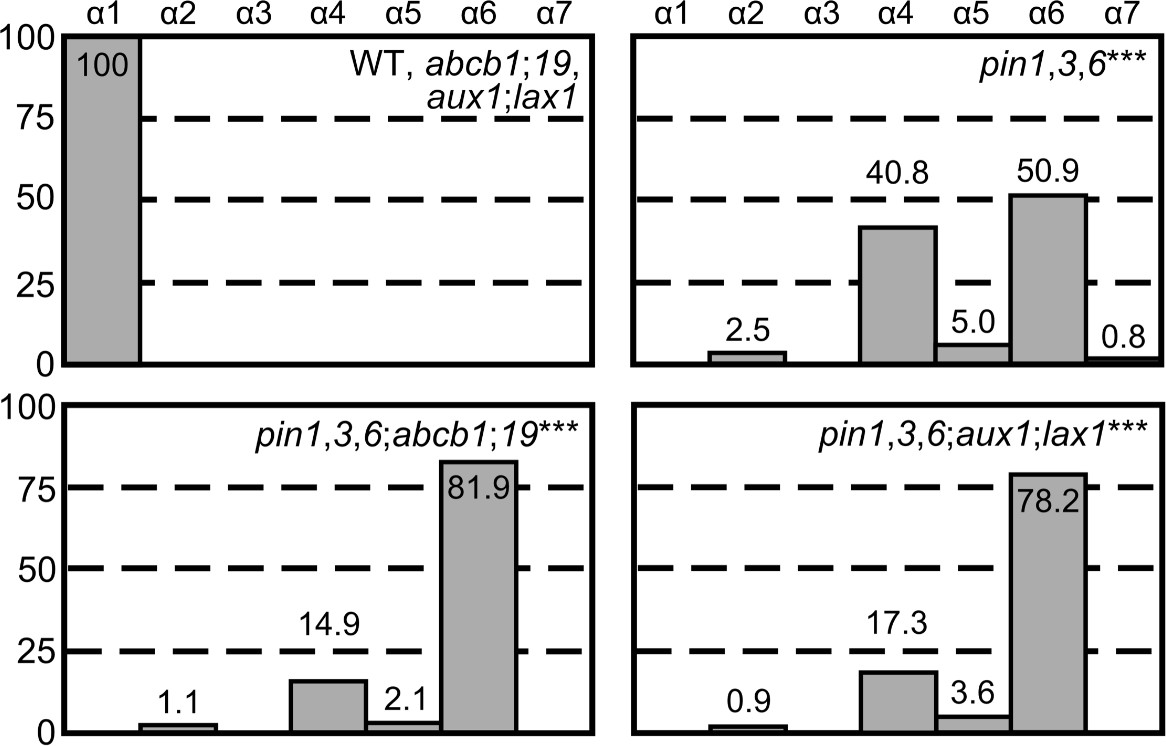
Cotyledon patterns of pin, abcb, and aux1/lax mutants.
Percentages of seedlings in phenotype classes (defined in Figure 3—figure supplement 3). Difference between pin1‐1,3,6 and WT, between pin1‐1,3,6;abcb1;19 and pin1‐1,3,6, and between pin1‐1,3,6;aux1‐355;lax1‐064 and pin1‐1,3,6 was significant at p<0.001 (***) by Kruskal‐Wallis and Mann‐Whitney test with Bonferroni correction. Sample population sizes: WT, 56; abcb1;19, 75; aux1‐355;lax1‐064, 87; pin1‐1,3,6, 120; pin1‐1,3,6;abcb1;19, 94; pin1‐1,3,6;aux1‐355;lax1‐064, 110.
Figure 5—figure supplement 3

Effect of the aux1-355 Mutation on AUX1 Expression and of the lax1-064 Mutation on LAX1 Expression.
(A,B) RT‐PCR analysis of expression of AUX1 (A) or LAX1 (B) in 4-day-old seedlings of WT and aux1-355 (A) or WT and lax1-064 (B). The nearly evenly expressed ROC1 (Lippuner et al., 1994) was used as control. Look‐up table (ramp in Figure 2—figure supplement 1) visualizes expression levels.
Figure 6 with 5 supplements
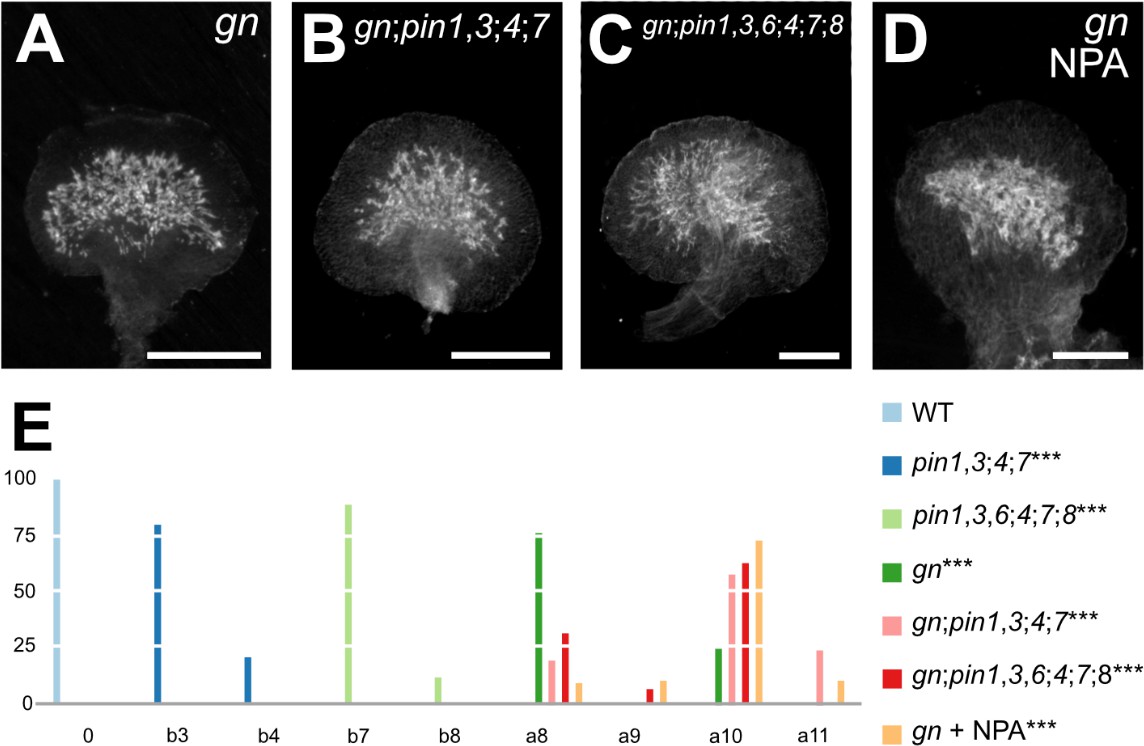
Vascular Defects of auxin-transport-inhibited gn.
(A–D) Dark‐field illumination of mature first leaves. Top right: genotype and treatment. (E) Percentages of leaves in phenotype classes (Classes 0, a8–a10, b3, b4, b7, and b8 defined in Figures 2 and 3; class a11, fused leaves with shapeless vascular cluster — not shown). Difference between pin1‐1,3;4;7 and WT, between pin1‐1,3,6;4;7;8 and WT, between gn and WT, between gn‐13;pin1‐1,3;4;7 and pin1‐1,3;4;7, between gn‐13;pin1‐1,3,6;4;7;8 and pin1‐1,3,6;4;7;8, and between NPA‐grown gn‐13 and pin1‐1,3,6;4;7;8 was significant at p<0.001 (***) by Kruskal‐Wallis and Mann‐Whitney test with Bonferroni correction. Sample population sizes: WT, 63; pin1‐1,3;4;7, 53; pin1‐1,3,6;4;7;8, 52; gn‐13, 69; gn‐13;pin1‐1,3;4;7, 21; gn‐13;pin1‐1,3,6;4;7;8, 16; NPA‐grown gn‐13, 60. Bars: (A–D) 0.5 mm. See Figure 6—figure supplement 1 for alternative visual display of distribution of leaves in phenotype classes. See Figure 6—figure supplement 2 for pin and gn mutant seedlings. See Figure 6—figure supplement 3 for seedling axes of pin and gn mutants. See Figure 6—figure supplement 4 for cotyledon patterns of pin and gn mutants. See Figure 6—figure supplement 5 for cotyledon vein patterns of pin and gn mutants.
-
Figure 6—source data 1
Distribution and frequency of leaves in phenotype classes and statistical analysis.
- https://cdn.elifesciences.org/articles/51061/elife-51061-fig6-data1-v1.xlsx
Figure 6—figure supplement 1
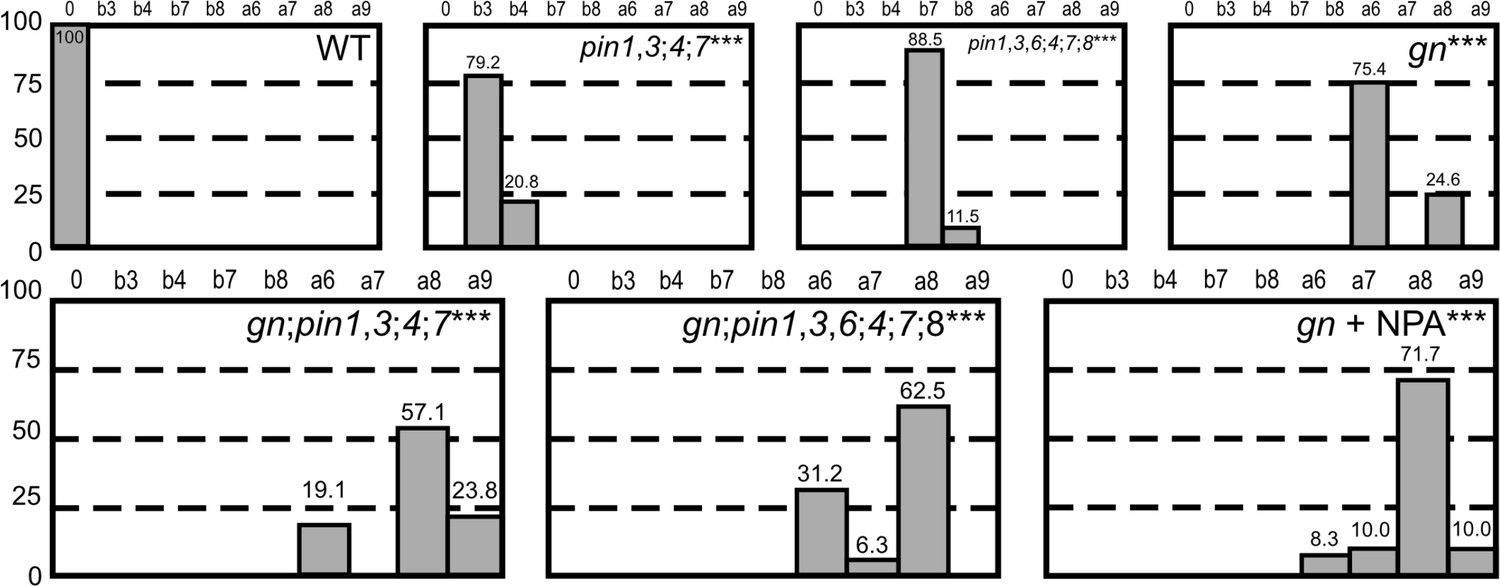
Percentages of leaves in phenotype classes.
See legend to Figure 6E for details of statistical analysis and sample population sizes.
Figure 6—figure supplement 2
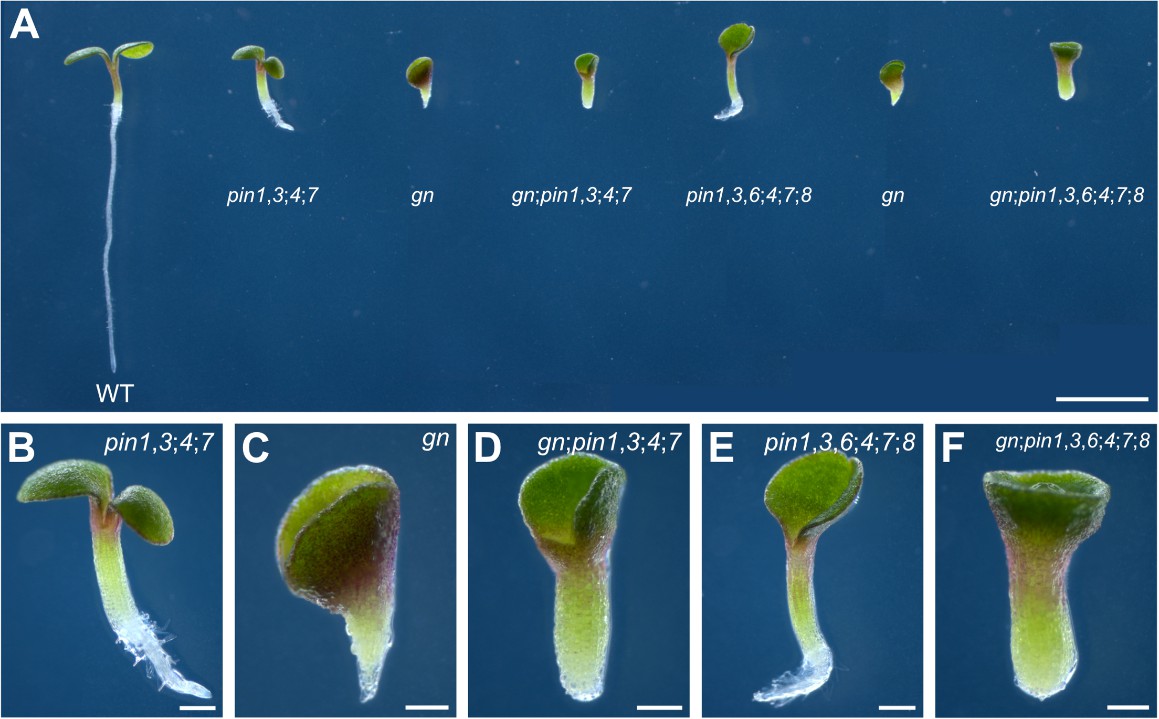
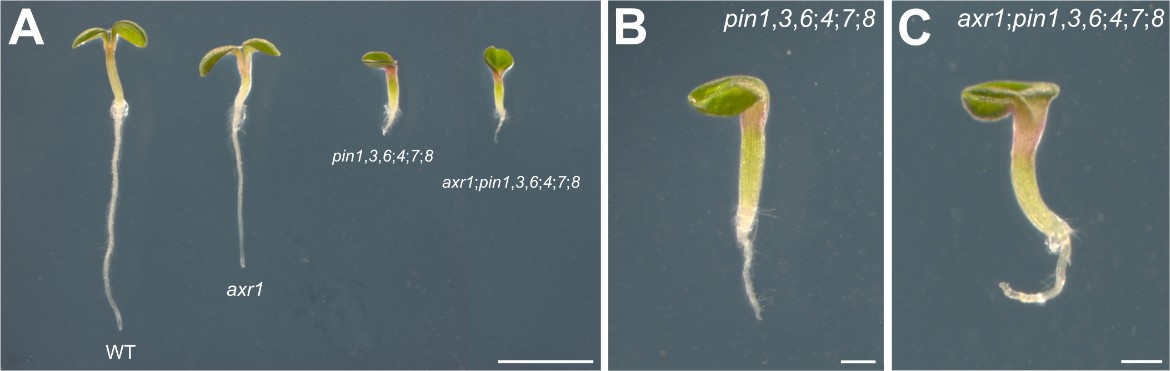
pin and gn mutant seedlings.
(A–F) Dark‐field illumination composite of 3‐day‐old seedlings. (A) Overview. Because the seedling lineup was wider than the stereomicroscope’s field of view, overlapping images of parts of the lineup were acquired and combined to reconstruct the original lineup. (B–F) Details. Genotypes below respective seedlings (A) or top right (B–F). The phenotype in (D) segregated in approximately one‐sixteenth of the progeny of plants homozygous for pin3, pin4, and pin7, and heterozygous for pin1 and gn — no different from the one‐sixteenth frequency expected for the gn;pin1,3;4;7 homozygous mutants by Pearson’s chi‐squared (χ2) goodness‐of‐fit test (Supplementary file 2K). We genotyped 10 of the seedlings with that phenotype and found they were gn;pin1,3;4;7 homozygous mutants. The phenotype in (F) segregated in approximately one‐sixteenth of the progeny of plants homozygous for pin3, pin4, pin6, pin7, and pin8, and heterozygous for pin1 and gn — no different from the one‐sixteenth frequency expected for the gn;pin1,3,6;4;7;8 homozygous mutants by Pearson’s chi‐squared (χ2) goodness‐of‐fit test (Supplementary file 2K). We genotyped 10 of the seedlings with that phenotype and found they were gn;pin1,3,6;4;7;8 homozygous mutants. Bars: (A) 2 mm; (B–F) 0.25 mm.
Figure 6—figure supplement 3
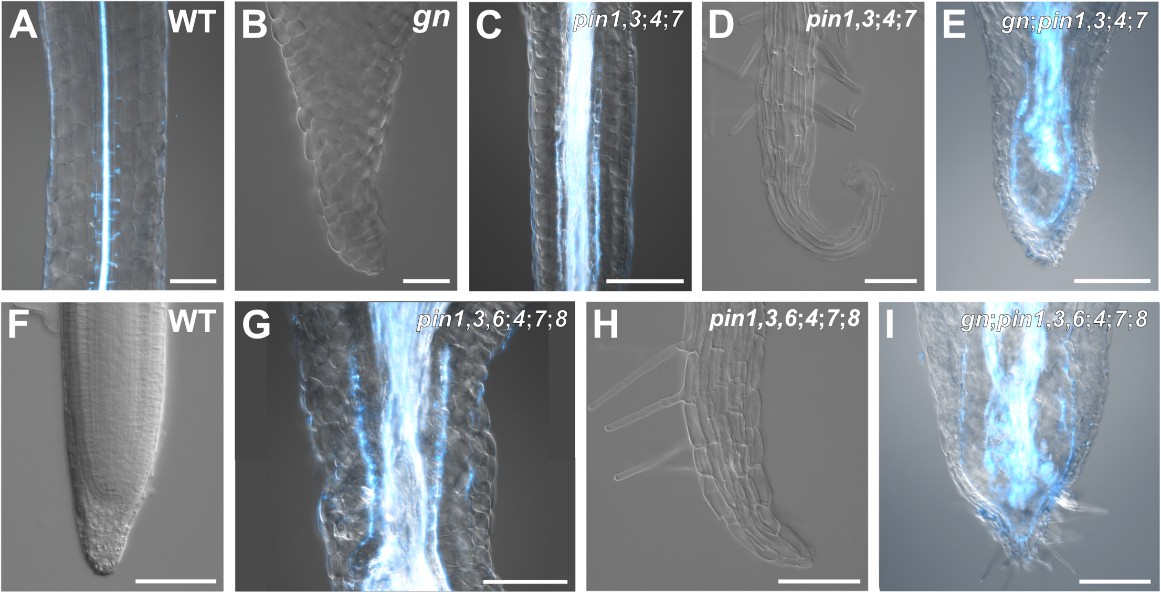
Seedling axes of pin and gn mutants.
(A–I) Overlay of dark-field (false-colored in cyan) and differential-interference-contrast illumination of 4- (WT), 3- (gn) or 7- (all other genotypes) day-old seedlings. Top right: genotype. (A,C,G) Hypocotyl. (B) Basal peg (Berleth and Jurgens, 1993). (D,F,H) Root. (E,I) Hypocotyl/root. Bars: (A,B,D,F,H) 100 µm; (C,E,I,G) 250 µm.
Figure 6—figure supplement 4
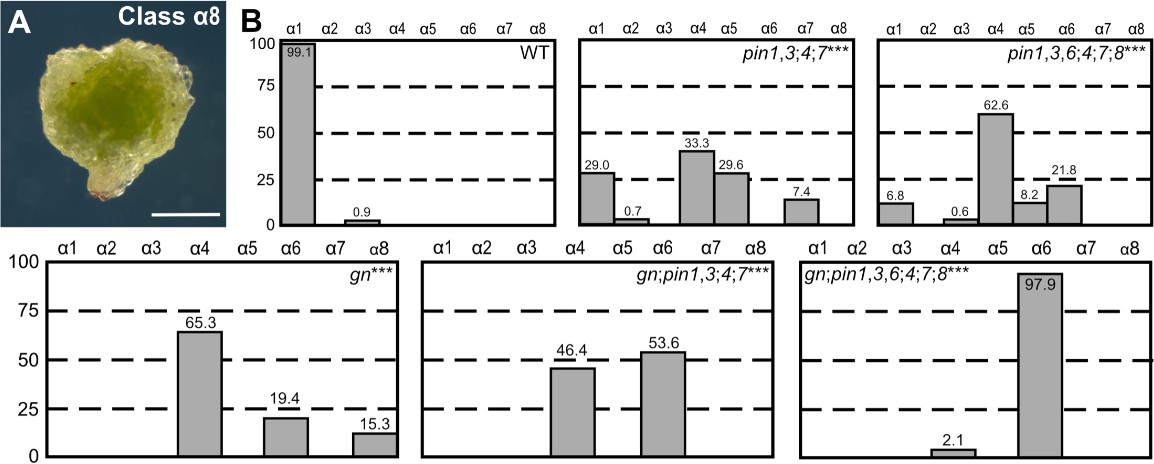
Cotyledon patterns of pin and gn mutants.
(A) Dark‐field illumination of a 5‐day‐old seedling illustrating phenotype class α8 (heart-shaped seedling). (B) Percentages of seedlings in phenotype classes (classes α1–α7 defined in Figure 3—figure supplement 3). Difference between pin1‐1,3;4;7 and WT, between pin1‐1,3,6;4;7;8 and WT, between gn‐13 and WT, between gn‐13;pin1‐1,3;4;7 and pin1‐1,3;4;7, and between gn‐13;pin1‐1,3,6;4;7;8 and pin1‐1,3,6;4;7;8 was significant at p<0.001 (***) by Kruskal‐Wallis and Mann‐Whitney test with Bonferroni correction. Sample population sizes: WT, 111; pin1‐1,3;4;7, 135; pin1‐1,3,6;4;7;8, 147; gn‐13, 72; gn‐13;pin1‐1,3;4;7, 84; gn‐13;pin1‐1,3,6;4;7;8, 93. Bar: (A) 0.5 mm.
Figure 6—figure supplement 5
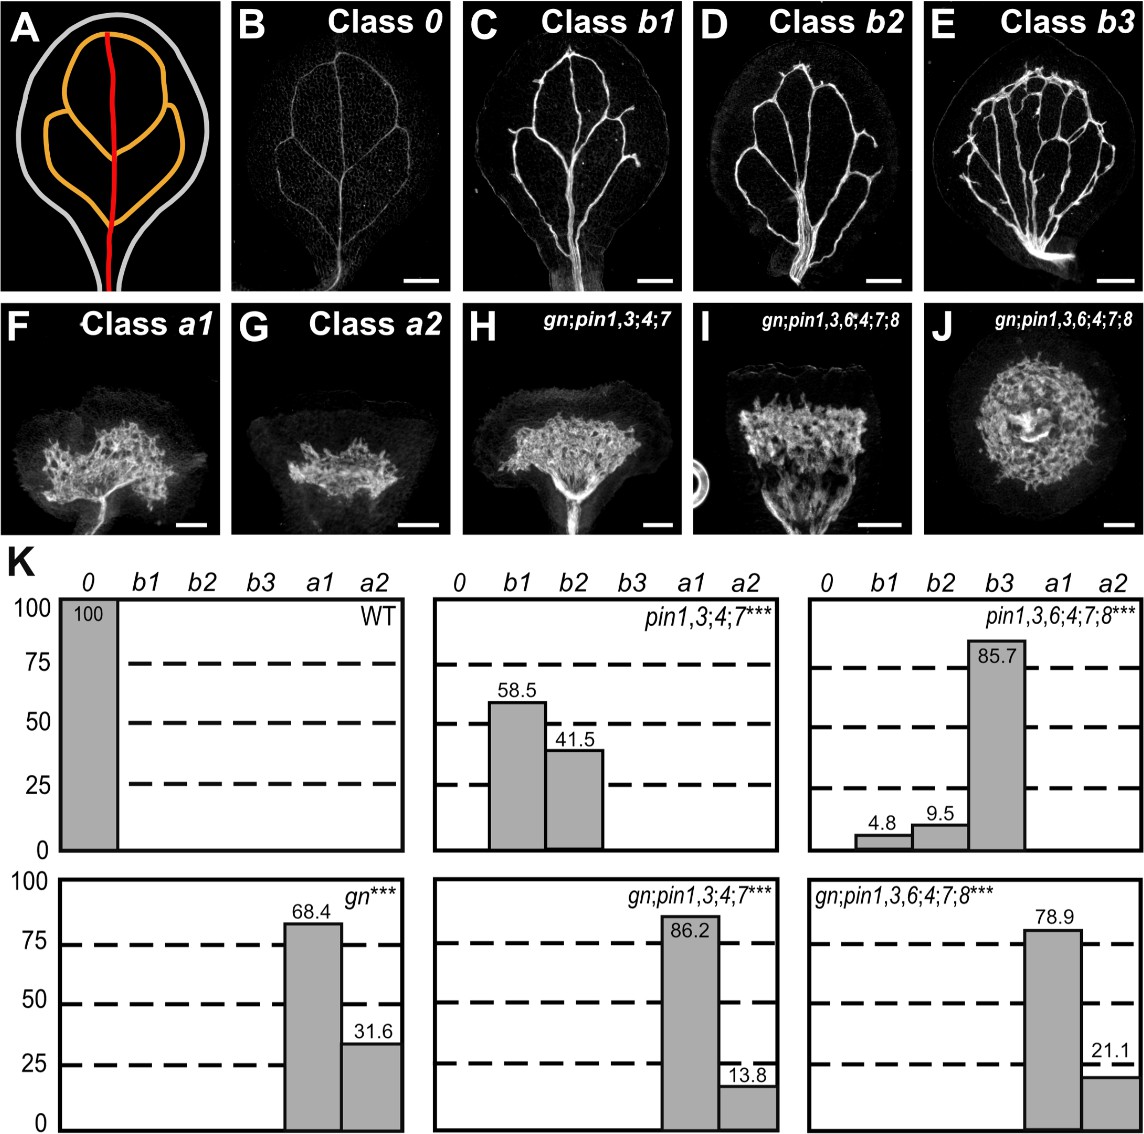
Cotyledon vein patterns of pin and gn mutants.
(A,B) Vein pattern of WT mature cotyledon. In (A): red, midvein; orange, vein loops. (B–J) Dark‐field illumination of mature cotyledons. Top right: phenotype class or genotype. (B–G) Phenotype classes: class 0, I‐shaped midvein and three or four loops (B); class b1, I‐shaped midvein, thick veins and minor veins (C); class b2, Y‐shaped midvein, thick veins and minor veins (D); class b3, thick veins, loops joining midvein at base of cotyledon and apically thickened vein‐network outline (E); class a1, shapeless vascular cluster with short stretches of vascular elements connecting cluster to base of cotyledon (F); class a2, shapeless vascular cluster (G). (H–J) Dark‐field illumination of mature cotyledons of gn‐13;pin1‐1,3;4;7 (class a1) (N) or gn‐13;pin1‐1,3,6;4;7;8 (class a1) (I, side view; J, top view). (K) Percentages of cotyledons in phenotype classes. Difference between pin1‐1,3;4;7 and WT, between pin1‐1,3,6;4;7;8 and WT, between gn‐13 and WT, between gn-13;pin1‐1,3;4;7 and pin1‐1,3;4;7, and between gn‐13;pin1‐1,3,6;4;7;8 and pin1‐1,3,6;4;7;8 was significant at p<0.001 (***) by Kruskal‐Wallis and Mann‐Whitney test with Bonferroni correction. Sample population sizes: WT, 52; pin1‐1,3;4;7, 65; pin1‐1,3,6;4;7;8, 63; gn‐13, 57; gn‐13;pin1‐1,3;4;7, 65; gn‐13;pin1‐1,3,6;4;7;8, 57. Bars: (B–J) 0.25 mm.
Figure 7 with 1 supplement
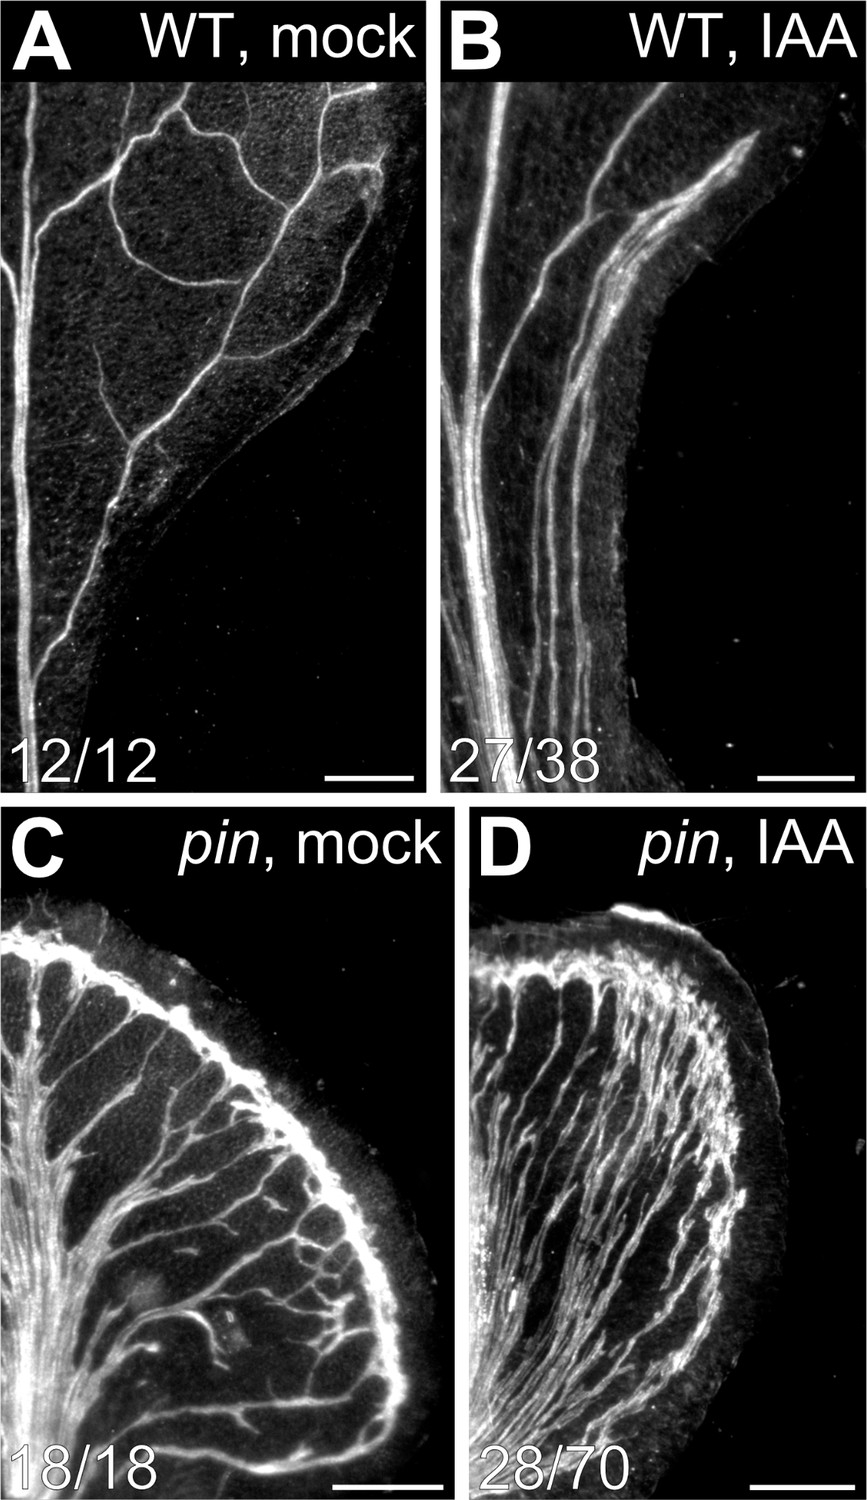
Auxin-induced vein formation in pin mutants.
(A–D) Top right: genotype and treatment. Dark‐field illumination of mature first leaves of WT (A,B) or pin1‐1,3,6;4;7;8 (C,D) at side of application of lanolin paste (A,C) or lanolin paste containing 1% IAA (B,D). Bars: (A) 0.5 mm; (B–D) 0.25 mm. See Figure 7—figure supplement 1 for additional effects of auxin application to pin mutants.
Figure 7—figure supplement 1
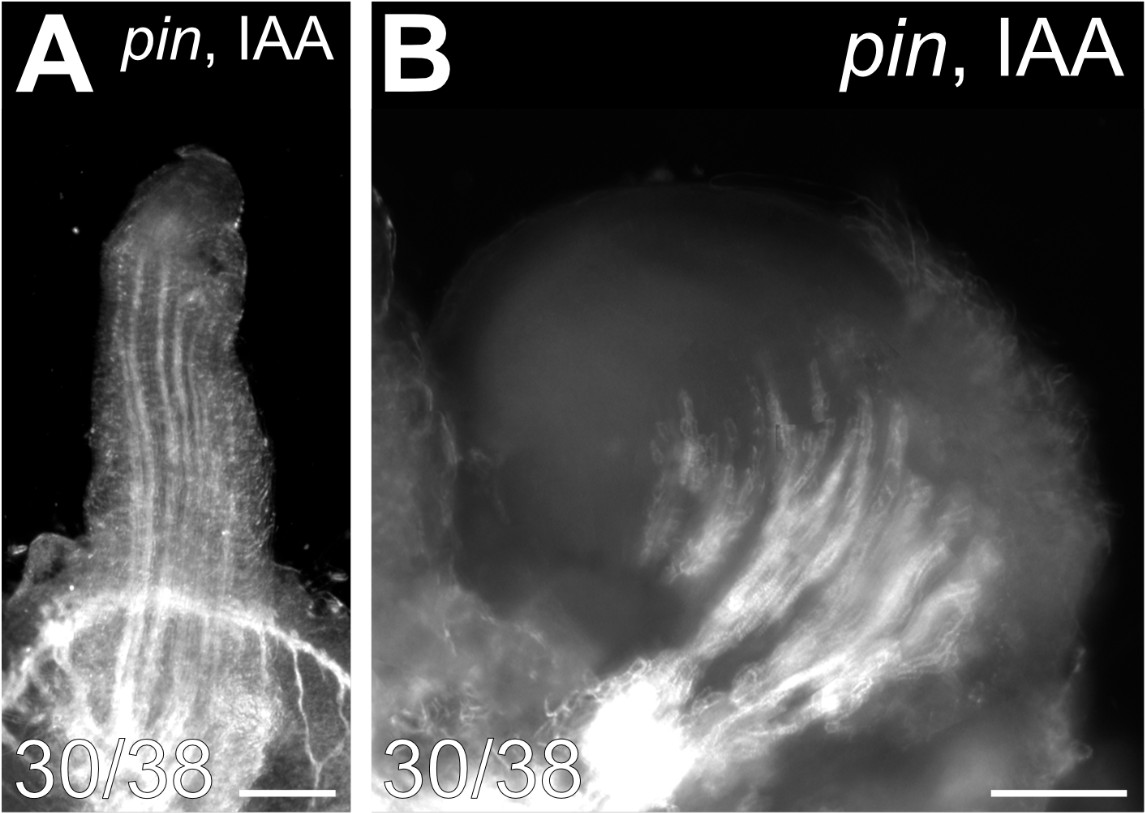
Auxin-induced formation of vascularized tissue outgrowths in pin mutants.
Top right: genotype and treatment. Dark‐field illumination of mature first leaves of pin1‐1,3,6;4;7;8 at side of application of lanolin paste containing 1% IAA. Bars: (A) 0.25 mm; (B) 0.1 mm.
Figure 8 with 4 supplements
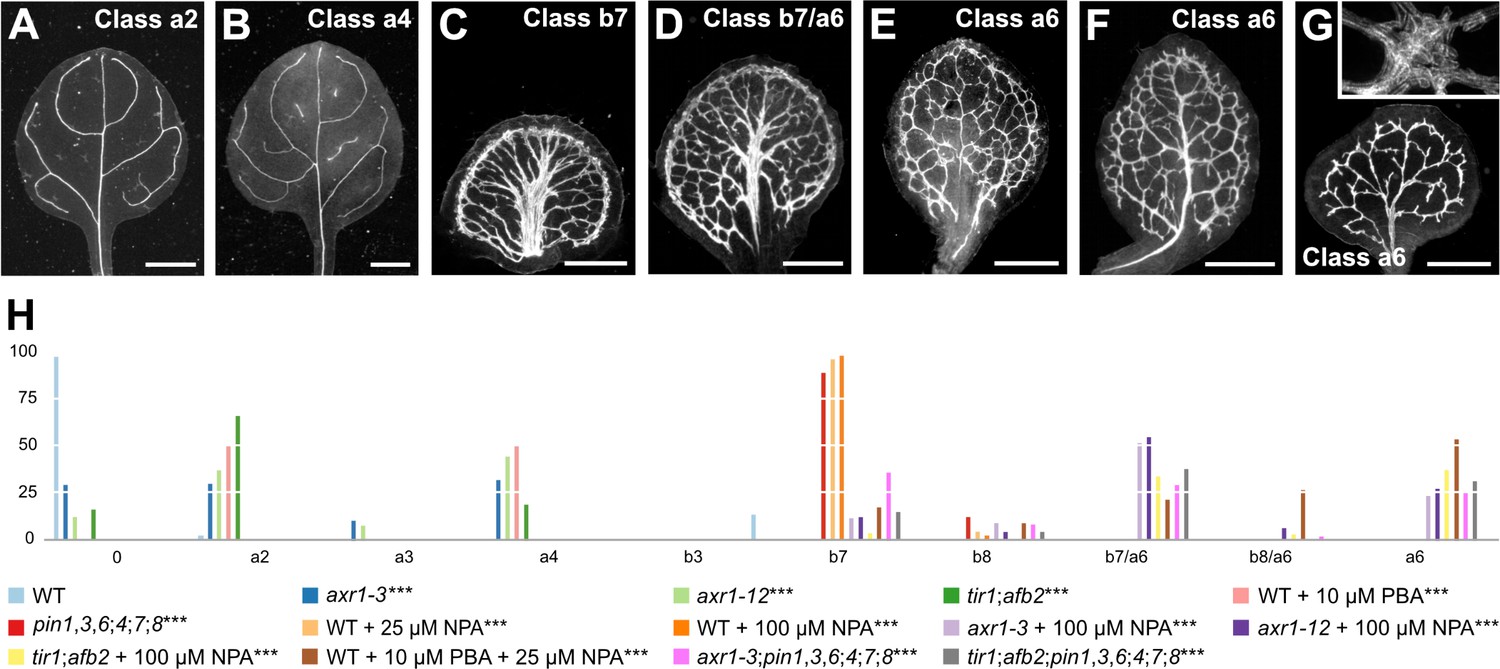
Auxin-signaling-dependent vein patterning in the absence of auxin transport.
(A–G) Dark‐field illumination of mature leaves illustrating phenotype classes (A–F, top right; G, bottom left): class a2 (axr1-3; A); class a4 (tir1;afb2; B); class b7 (NPA-grown WT; C); class b7/a6, wide midvein, more lateral‐veins, dense network of thick veins, and conspicuous marginal vein (NPA-grown axr1-12; D); class b8/a6, fused leaves with wide midvein, more lateral‐veins, dense network of thick veins, and conspicuous marginal vein (not shown); class a6 (E: PBA- and NPA-grown WT; F: NPA-grown tir1;afb2; G: tir1;afb2;pin1‐1,3,6;4;7;8); inset in (G) illustrates cluster of seemingly randomly oriented vascular elements. (H) Percentages of leaves in phenotype classes (Classes 0, a2–a4, a6, b3, b7, and b8 defined in Figures 2 and 3). Difference between axr1‐3 and WT, between axr1‐12 and WT, between tir1;afb2 and WT, between PBA-grown WT and WT, between pin1‐1,3,6;4;7;8 and WT, between NPA‐grown WT and WT, between NPA‐grown axr1‐3 and NPA‐grown WT, between NPA‐grown axr1‐12 and NPA‐grown WT, between NPA‐grown tir1;afb2 and NPA‐grown WT, between PBA- and NPA-grown WT and NPA-grown WT, between axr1‐3;pin1‐1,3,6;4;7;8 and pin1‐1,3,6;4;7;8, and between tir1;afb2;pin1‐1,3,6;4;7;8 and pin1‐1,3,6;4;7;8 was significant at p<0.001 (***) by Kruskal‐Wallis and Mann‐Whitney test with Bonferroni correction. Sample population sizes: WT, 47; axr1‐3, 41; axr1‐12, 41; tir1;afb2, 42; PBA-grown WT, 55; pin1‐1,3,6;4;7;8, 43; NPA‐grown WT, 48 (25 µM) or 146 (100 µM); NPA‐grown axr1‐3, 101; NPA‐grown axr1‐12, 103; NPA‐grown tir1;afb2, 65; PBA- and NPA-grown WT, 105; axr1‐3;pin1‐1,3,6;4;7;8, 62; tir1;afb2;pin1‐1,3,6;4;7;8, 75. Bars: (A,B) 1 mm; (C–E) 0.75 mm (F,G) 0.5 mm. See Figure 8—figure supplement 1 for alternative visual display of distribution of leaves in phenotype classes. See Figure 8—figure supplement 2 for pin and axr1 mutant seedlings. See Figure 8—figure supplement 3 for cotyledon patterns of pin, axr1, and tir1;afb2 mutants. See Figure 8—figure supplement 4 for pin and tir1;afb2 mutant seedlings.
-
Figure 8—source data 1
Distribution and frequency of leaves in phenotype classes and statistical analysis.
- https://cdn.elifesciences.org/articles/51061/elife-51061-fig8-data1-v1.xlsx
Figure 8—figure supplement 1
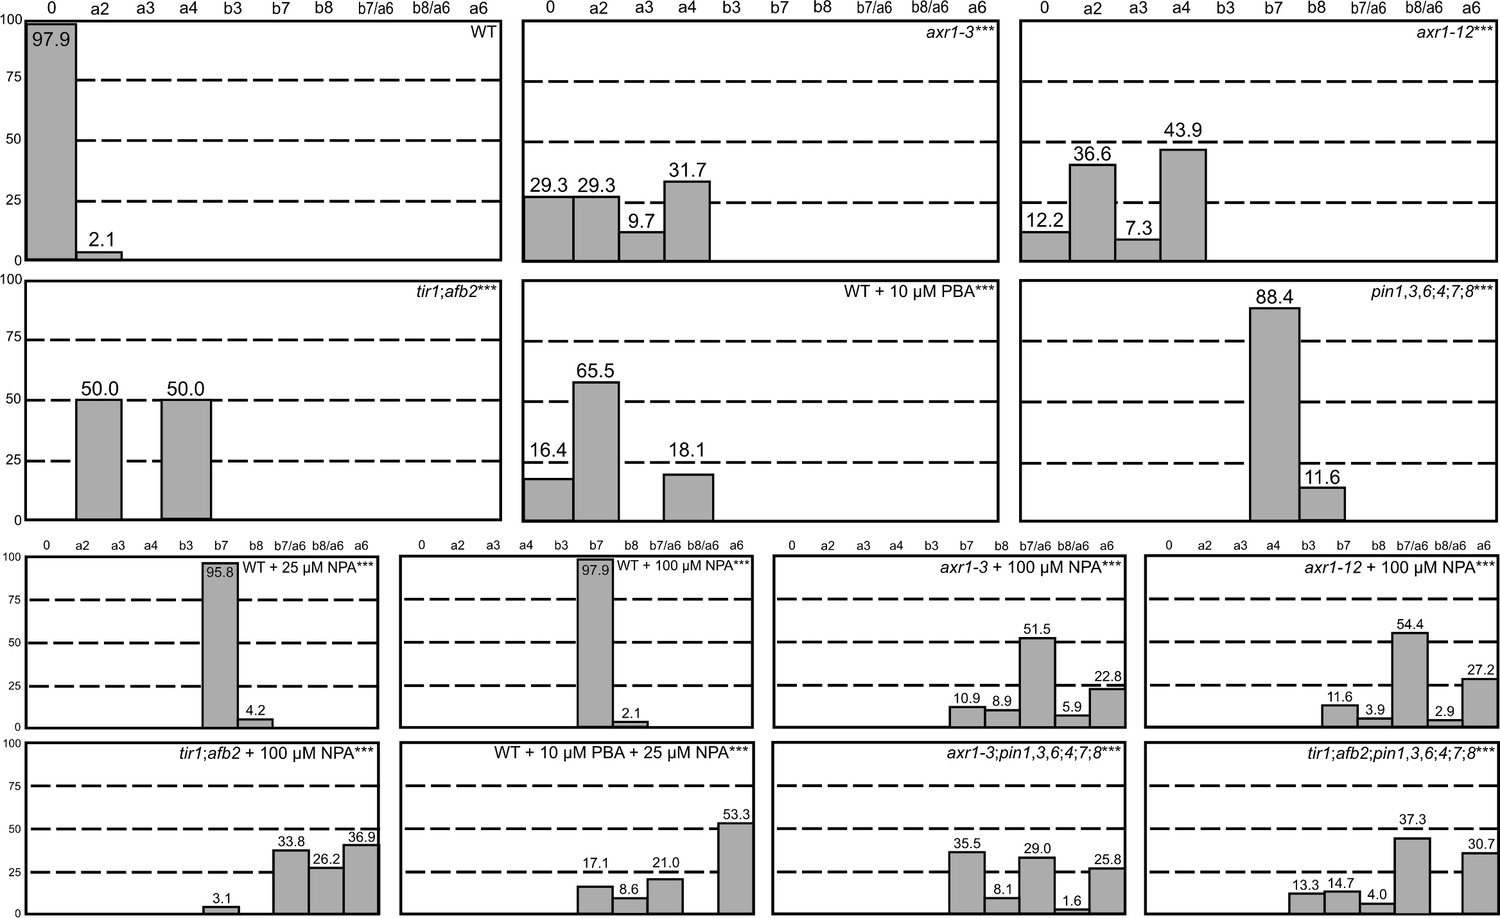
Percentages of leaves in phenotype classes.
See legend to Figure 8H for details of statistical analysis and sample population sizes.
Figure 8—figure supplement 2
pin and axr1 mutant seedlings.
(A,B) Dark‐field illumination composite of 3‐day‐old seedlings; genotypes below respective seedlings (A) or top right (B). (A) Overview. (B) Details. Bars: (A) 2 mm; (B) 0.5 mm.
Figure 8—figure supplement 3

Cotyledon patterns of pin, axr1, and tir1;afb2 mutants.
Percentages of seedlings in phenotype classes (defined in Figure 3—figure supplement 3). Difference between pin1‐1,3,6;4;7;8 and WT, and between tir1;afb2;pin1‐1,3,6;4;7;8 and pin1‐1,3,6;4;7;8 was significant at p<0.001 (***) by Kruskal‐Wallis and Mann‐Whitney test with Bonferroni correction. Sample population sizes: WT, 59; axr1‐3, 49; tir1;afb2, 44; pin1‐1,3,6;4;7;8, 50; axr1‐3;pin1‐1,3,6;4;7;8, 146; tir1;afb2;pin1‐1,3,6;4;7;8, 75.
Figure 8—figure supplement 4

pin and tir1;afb2 mutant seedlings.
(A–C) Dark‐field (A,B) or differential-interference-contrast (C) illumination of 3‐day‐old seedlings; genotypes below respective seedlings (A) or top right (B,C). (A) Overview. (B) Detail. (C) Basal peg (Berleth and Jurgens, 1993). Bars: (A) 2 mm; (B) 0.5 mm; (C) 0.1 mm.
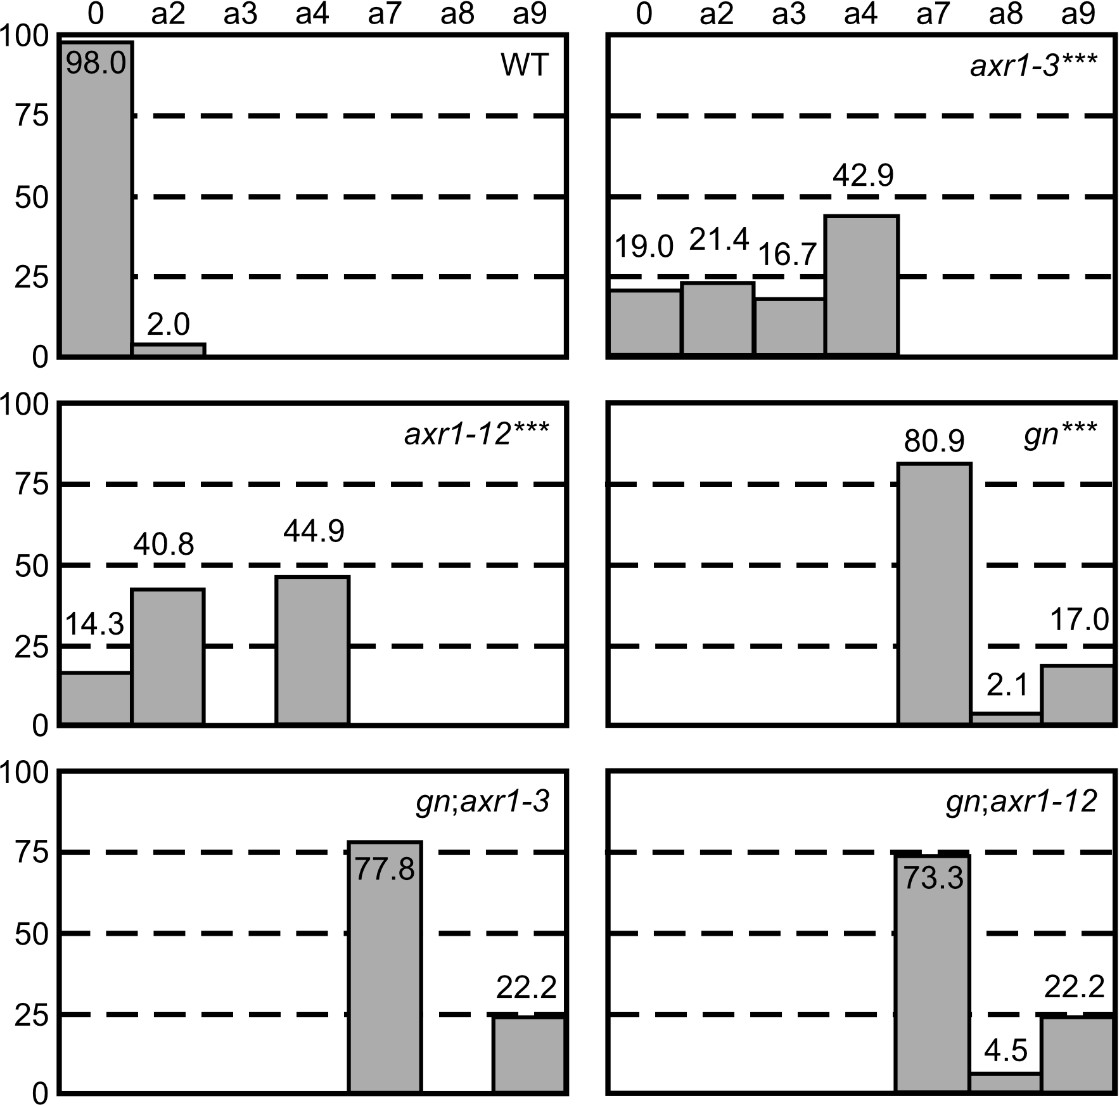
Figure 9 with 4 supplements
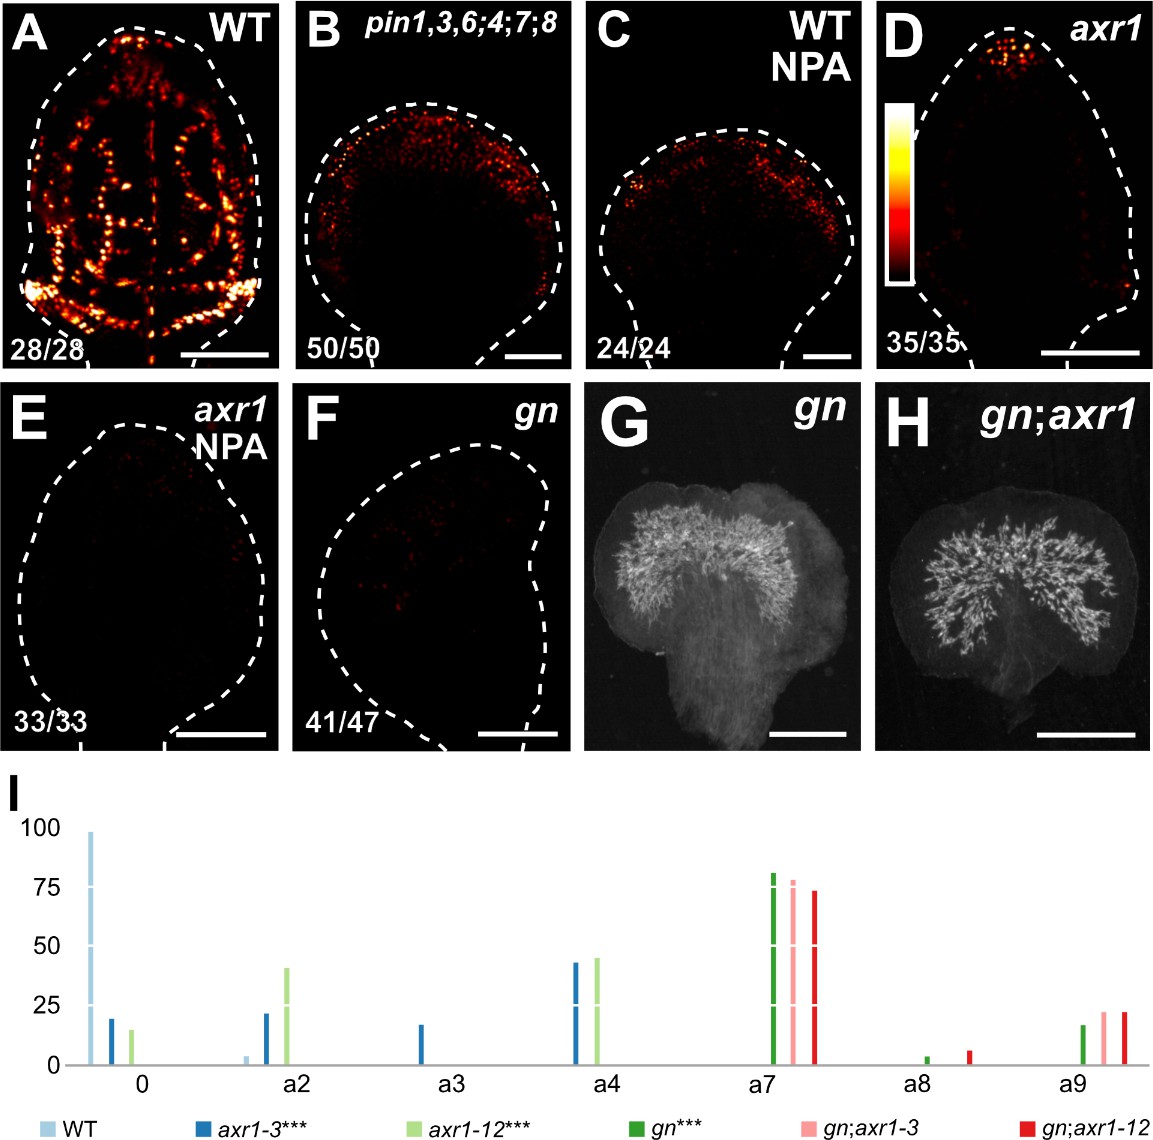
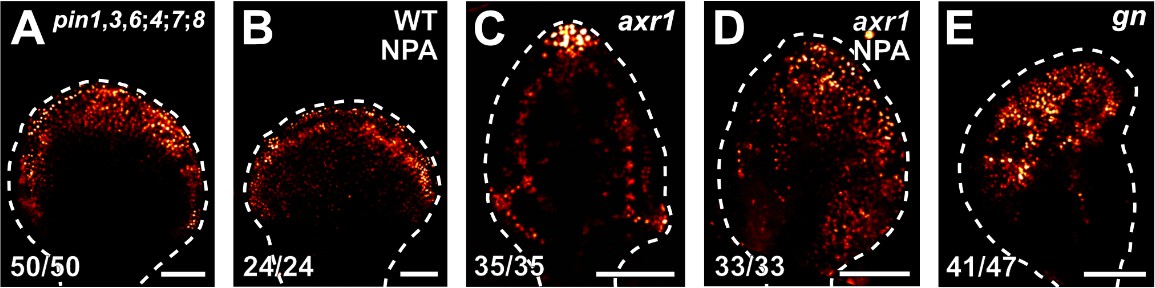
Auxin-signaling-dependent vascular development in gn.
(A–F) Confocal laser scanning microscopy; first leaves 4 (A,C), 5 (B,D,E) or 6 (F) days after germination. DR5rev::nYFP expression; look‐up table (ramp in D) visualizes expression levels. Top right: genotype and treatment. Bottom left: reproducibility index. Dashed white line delineates leaf outline. Images were taken at identical settings. (G,H) Dark‐field illumination of mature first leaves. Top right: genotype. (I) Percentages of leaves in phenotype classes (defined in Figure 2). Difference between axr1‐3 and WT, between axr1‐12 and WT, and between gn‐13 and WT was significant at p<0.001 (***) by Kruskal‐Wallis and Mann‐Whitney test with Bonferroni correction. Sample population sizes: WT, 49; axr1‐3, 42; axr1‐12, 49; gn‐13, 47; gn‐13;axr1‐3, 45; gn‐13;axr1‐12, 45. Bars: (A–F) 100 µm; (G,H) 0.75 mm. See Figure 9—figure supplement 1 for images of DR5rev::nYFP expression taken by matching signal intensity to detector’s input range (~5% saturated pixels). See Figure 9—figure supplement 2 for gn and axr1 mutant seedlings. See Figure 9—figure supplement 3 for cotyledon patterns of gn and axr1 mutants. See Figure 9—figure supplement 4 for alternative visual display of distribution of leaves in phenotype classes.
-
Figure 9—source data 1
Distribution and frequency of leaves in phenotype classes and statistical analysis.
- https://cdn.elifesciences.org/articles/51061/elife-51061-fig9-data1-v1.xlsx
Figure 9—figure supplement 1
Auxin response in developing leaves.
(A–F) Confocal laser scanning microscopy; first leaves 4 (B), 5 (A,C,D) or 6 (E) days after germination. DR5rev::nYFP expression; look‐up table (ramp in Figure 9D) visualizes expression levels. Top right: genotype and treatment. Bottom left: reproducibility index. Dashed white line delineates leaf outline. Images were taken by matching signal intensity to detector’s input range (~5% saturated pixels).
Figure 9—figure supplement 2
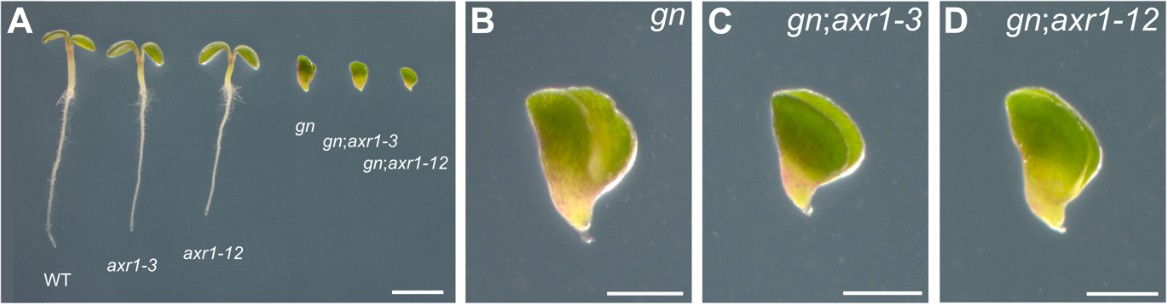
gn and axr1 mutant seedlings.
(A–D) Dark-field illumination composite of 3‐day‐old seedlings; genotypes below respective seedlings (A) or top right (B–D). (A) Overview. Because the seedling lineup was wider than the stereomicroscope’s field of view, overlapping images of parts of the lineup were acquired and combined to reconstruct the original lineup. (B–D) Details. Bars: (A) 2 mm; (B–D) 0.5 mm.
Figure 9—figure supplement 3

Cotyledon patterns of gn and axr1 mutants.
Percentages of seedlings in phenotype classes (defined in Figure 3—figure supplement 3 and Figure 6—figure supplement 4). Difference between gn‐13 and WT was significant at p<0.001 (***); and between gn‐13;axr1‐12 and gn‐13 was significant at p<0.01 (**) by Kruskal‐Wallis and Mann‐Whitney test with Bonferroni correction. Sample population sizes: WT, 86; axr1‐3, 87; axr1‐12, 47; gn‐13, 62; gn‐13;axr1‐3, 70; gn‐13;axr1‐12, 50.
Figure 9—figure supplement 4
Percentages of leaves in phenotype classes.
See legend to Figure 9I for details of statistical analysis and sample population sizes.
Figure 10

Auxin-transport- and auxin-signaling-dependent coordination of PIN1 localization in gn developing leaves.
(A,G) Increasingly darker grays depict progressively later stages of vein development. Boxes illustrate positions of closeups in B and H, respectively. hv: minor vein; l1, l2 and l3: first, second and third loops; mv: midvein. (B–F,H–L) Confocal laser scanning microscopy. First leaves. Top right: genotype, treatment and leaf age in days after germination (DAG). Dashed white line delineates leaf outline. Bottom left: reproducibility index. PIN1::PIN1:GFP expression; look‐up table (ramp in H) visualizes expression levels. Red: autofluorescence. (I) 24/35 of second loops failed to connect to the first loop. Bars: (B–F,H–L) 20 µm.
Figure 11
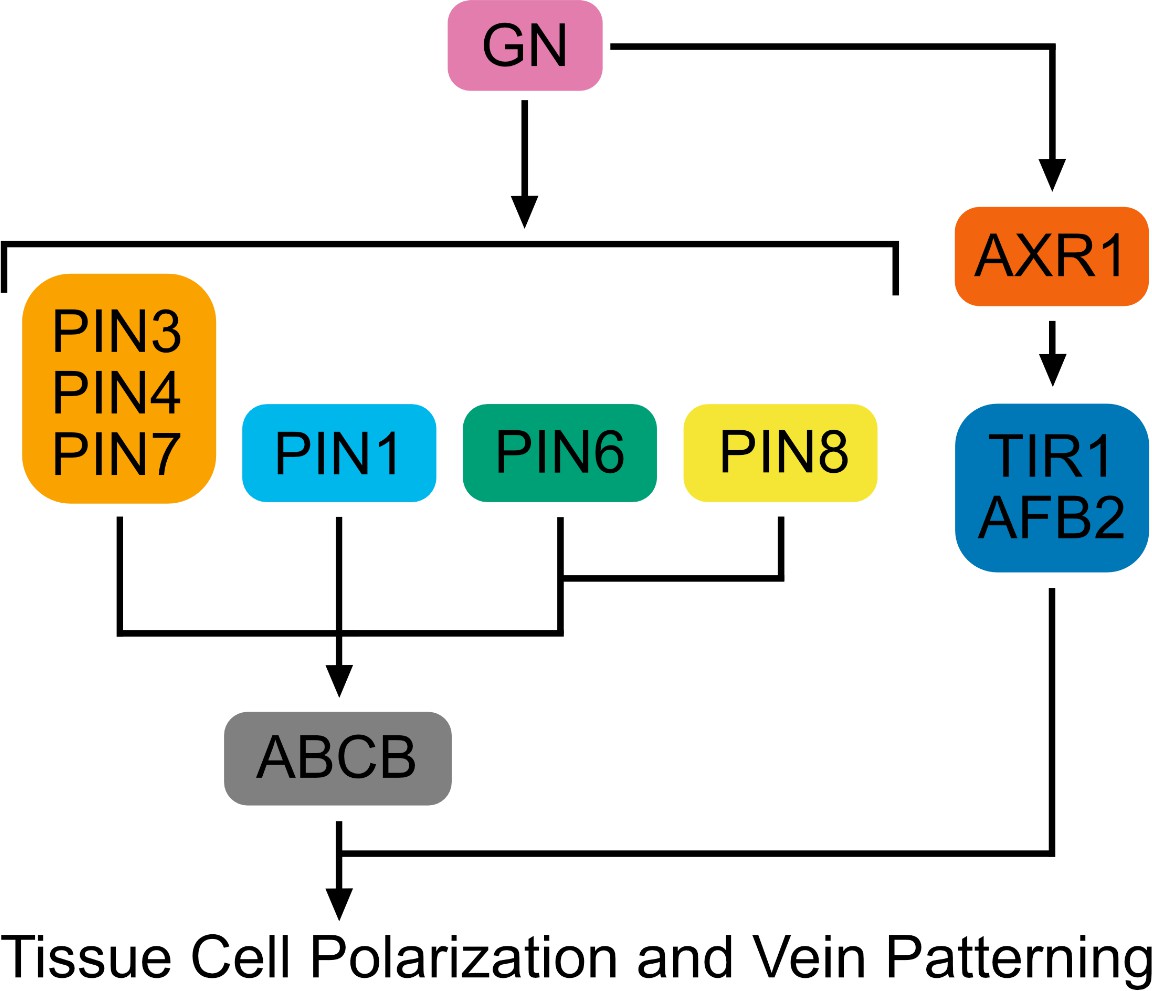
Interpretation summary.
Genetic interaction network controlling tissue cell polarization and vein patterning. Arrows indicate positive effects.
Additional files
-
Supplementary file 1
Key resources table.
- https://cdn.elifesciences.org/articles/51061/elife-51061-supp1-v1.docx
-
Supplementary file 2
Supplementary tables.
(A) Embryo viability of WT, pin3;4;7, and pin2;3;4;7. (B) Embryo viability of toz, mp, pin1, pin1,3;4;7, pin1,3;2;4;7, and pin1,3,6;4;7;8. (C) Embryo viability of pin1, pin1,3;4;7, pin1,3;2;4;7, and pin1,3,6;4;7;8. (D) Embryo viability of WT, abcb1, abcb19, abcb1;19, and twd1. (E) Embryo viability of toz, mp, pin1,3,6, and pin1,3,6;abcb1;19. (F) Embryo viability of pin1,3,6 and pin1,3,6;abcb1;19. (G) Embryo viability of WT, aux1, lax1, aux1;lax1, and aux1;lax1;2;3. (H) Embryo viability of toz, mp, pin1,3,6, and pin1,3,6;aux1;lax1. (I) Embryo viability of pin1,3,6 and pin1,3,6;aux1;lax1. (J) Embryo viability of axr1;axl, tir1;afb2, gn;pin1,3;4;7, and gn;pin1,3,6;4;7;8. (K) Embryo viability of gn;pin1,3;4;7 and gn;pin1,3,6;4;7;8. (L) Embryo viability of WT, axr1, and tir1;afb2. (M) Embryo viability of toz, mp, pin1,3,6;4;7;8, pin1,3,6;4;7;8;axr1, and pin1,3,6;4;7;8;tir1;afb2. (N) Embryo viability of pin1,3,6;4;7;8;axr1 and pin1,3,6;4;7;8;tir1;afb2. (O) Embryo viability of toz, mp, gn and gn;axr1. (P) Embryo viability of gn and gn;axr1. (Q) Genotyping strategies. (R) Light paths.
- https://cdn.elifesciences.org/articles/51061/elife-51061-supp2-v1.pdf
-
Transparent reporting form
- https://cdn.elifesciences.org/articles/51061/elife-51061-transrepform-v1.docx
Download links
A two-part list of links to download the article, or parts of the article, in various formats.
Downloads (link to download the article as PDF)
Open citations (links to open the citations from this article in various online reference manager services)
Cite this article (links to download the citations from this article in formats compatible with various reference manager tools)
Coordination of tissue cell polarity by auxin transport and signaling
eLife 8:e51061.
https://doi.org/10.7554/eLife.51061


