Pan-mammalian analysis of molecular constraints underlying extended lifespan
- Joint Carnegie Mellon University-University of Pittsburgh PhD Program in Computational Biology, United States
- University of Pittsburgh, United States
- University of Utah, United States
Figures
Figure 1 with 11 supplements
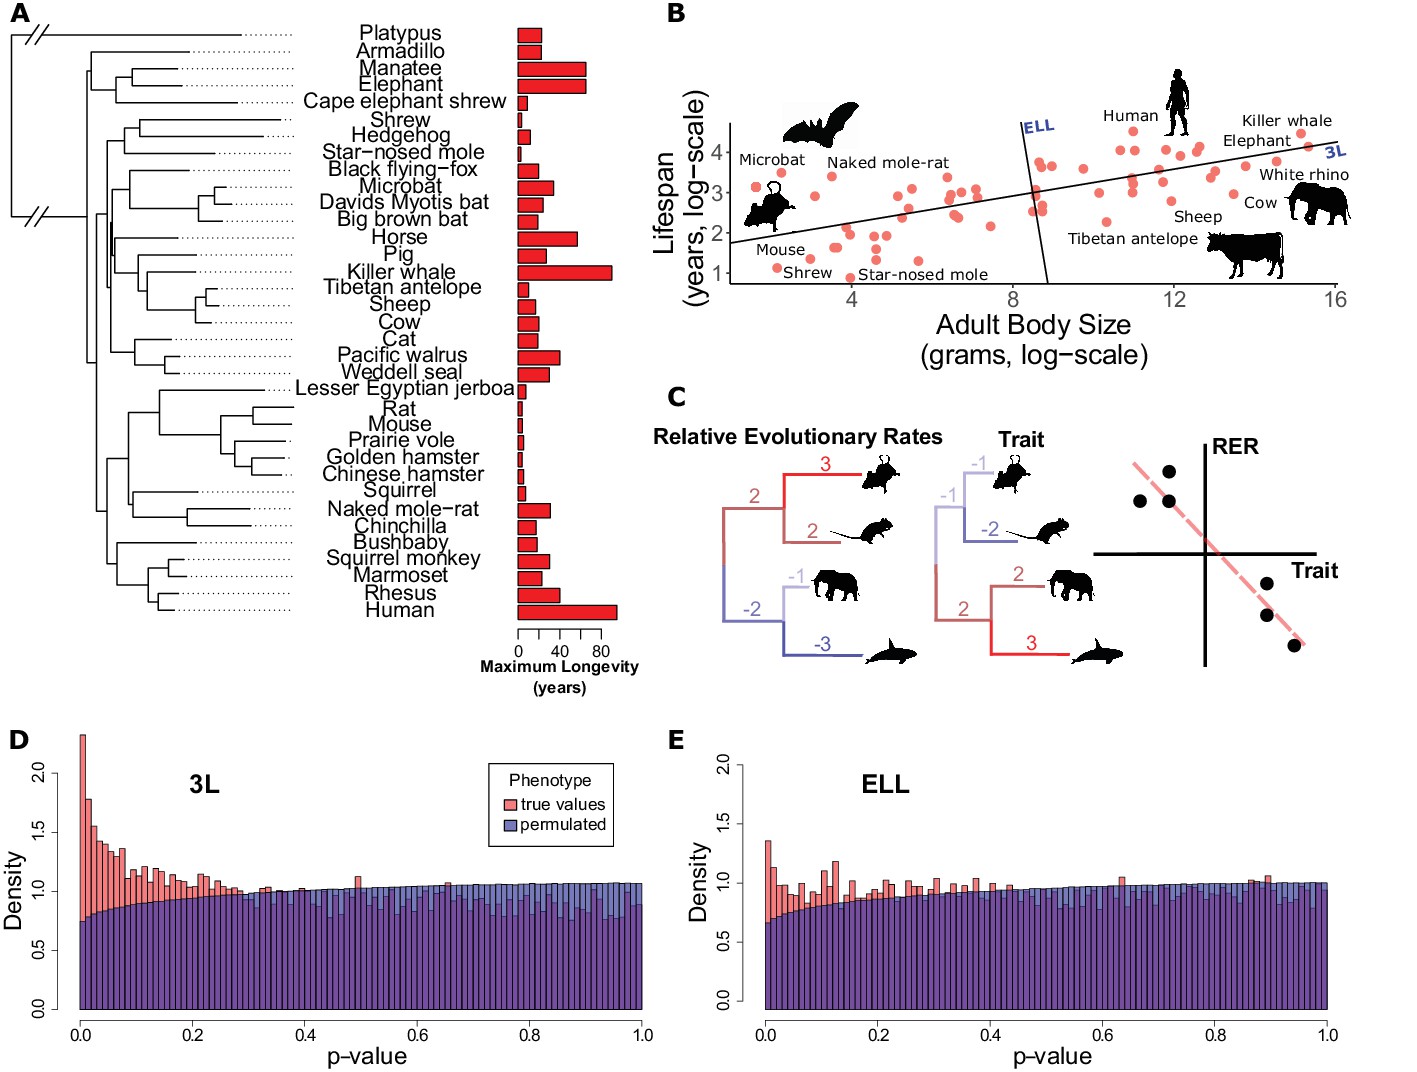
Many genes have evolutionary rates correlated with longevity phenotypes as demonstrated by analysis with RERconverge.
(A) A subset of species used for this analysis alongside their maximum longevity values. Lifespan varies widely across mammals independent of phylogeny. (B) Mammal body size and maximum lifespan values for 61 species. Lines represent the 3L phenotype and the ELL phenotype (also see Figure 1—figure supplement 1). (C) RERconverge pipeline to find correlation between relative evolutionary rates of genes and change in lifespan phenotypes. (D and E) Distribution of p-values from correlations between evolutionary rates of genes and change in the 3L and ELL phenotypes indicate an enrichment of significant correlations (also see Figure 1—figure supplement 11).
Figure 1—figure supplement 1
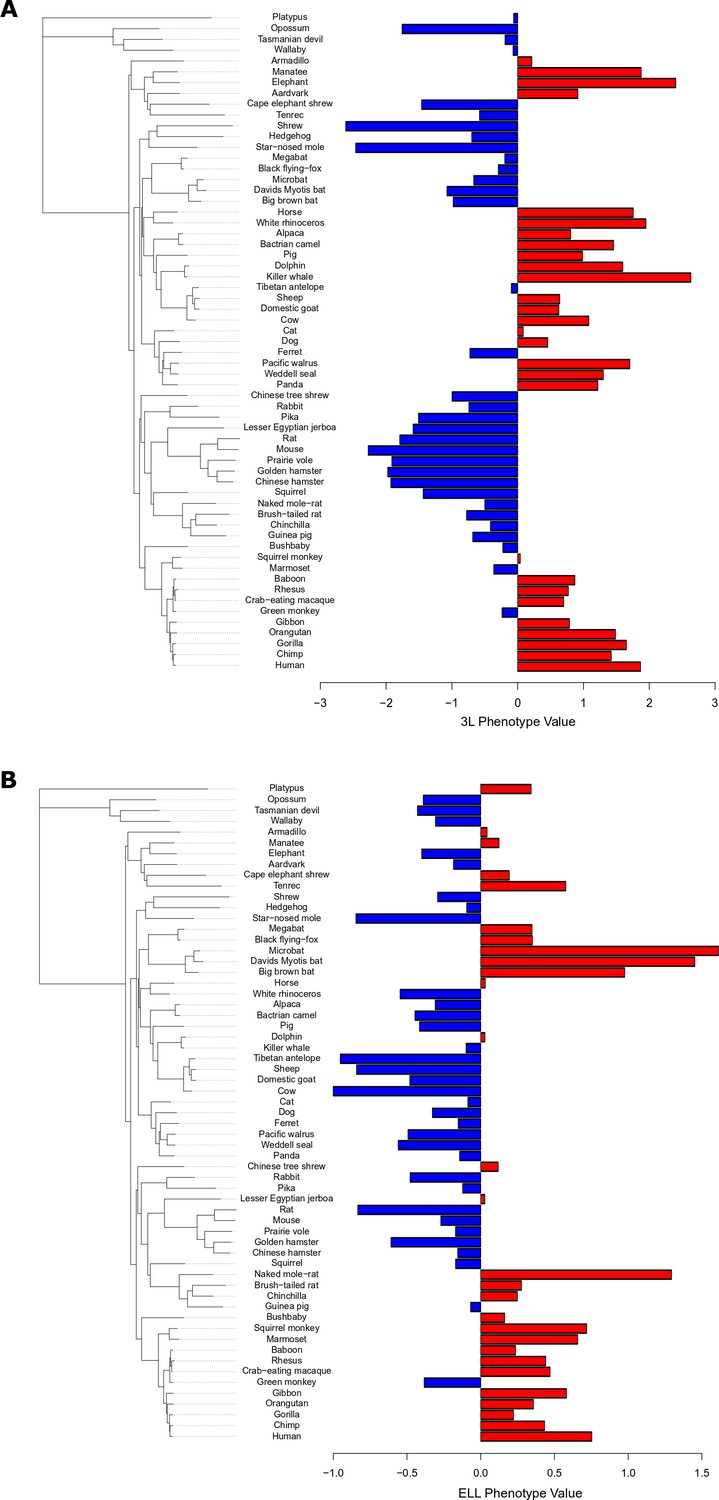
3L phenotype values (A) and ELL phenotype values (B) for 61 mammal species alongside mammalian phylogenetic tree.
Figure 1—figure supplement 2
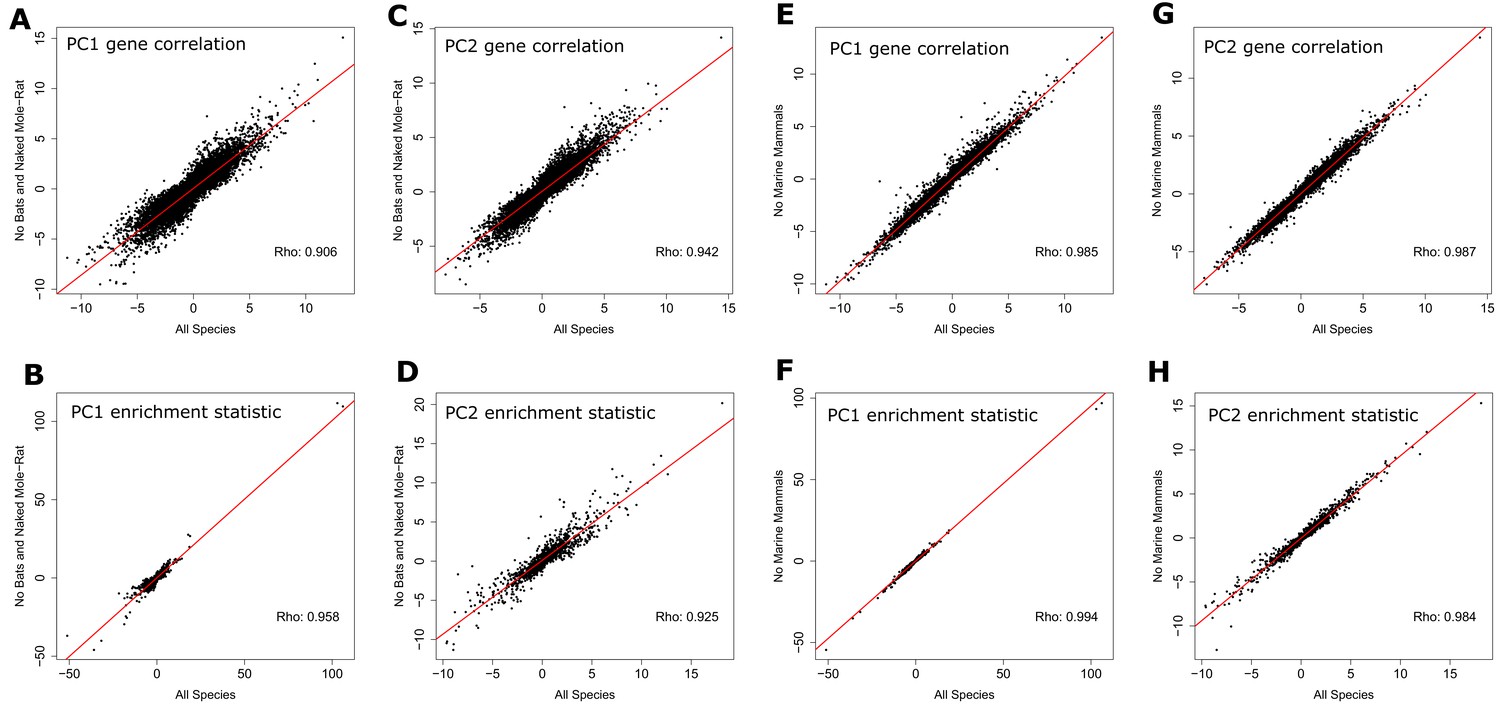
Correlation statistics for genes and enrichment statistics for canonical pathways plotted with statistics calculated from data with bat and naked mole-rat removed (A, B, C, and D) and with marine species removed (E, F, G, and H).
Points plotted are the sign of the correlation statistic times the negative log p-value of the correlation for genes (A, C, E, and G) and the sign of the enrichment statistic times the negative log p-value of canonical pathway enrichment (B, D, F, and H). These data indicate a strong relationship between results from the full species set and the partial species sets, which suggests the bats, naked mole-rat, and marine mammals do not strongly influence the results.
Figure 1—figure supplement 3
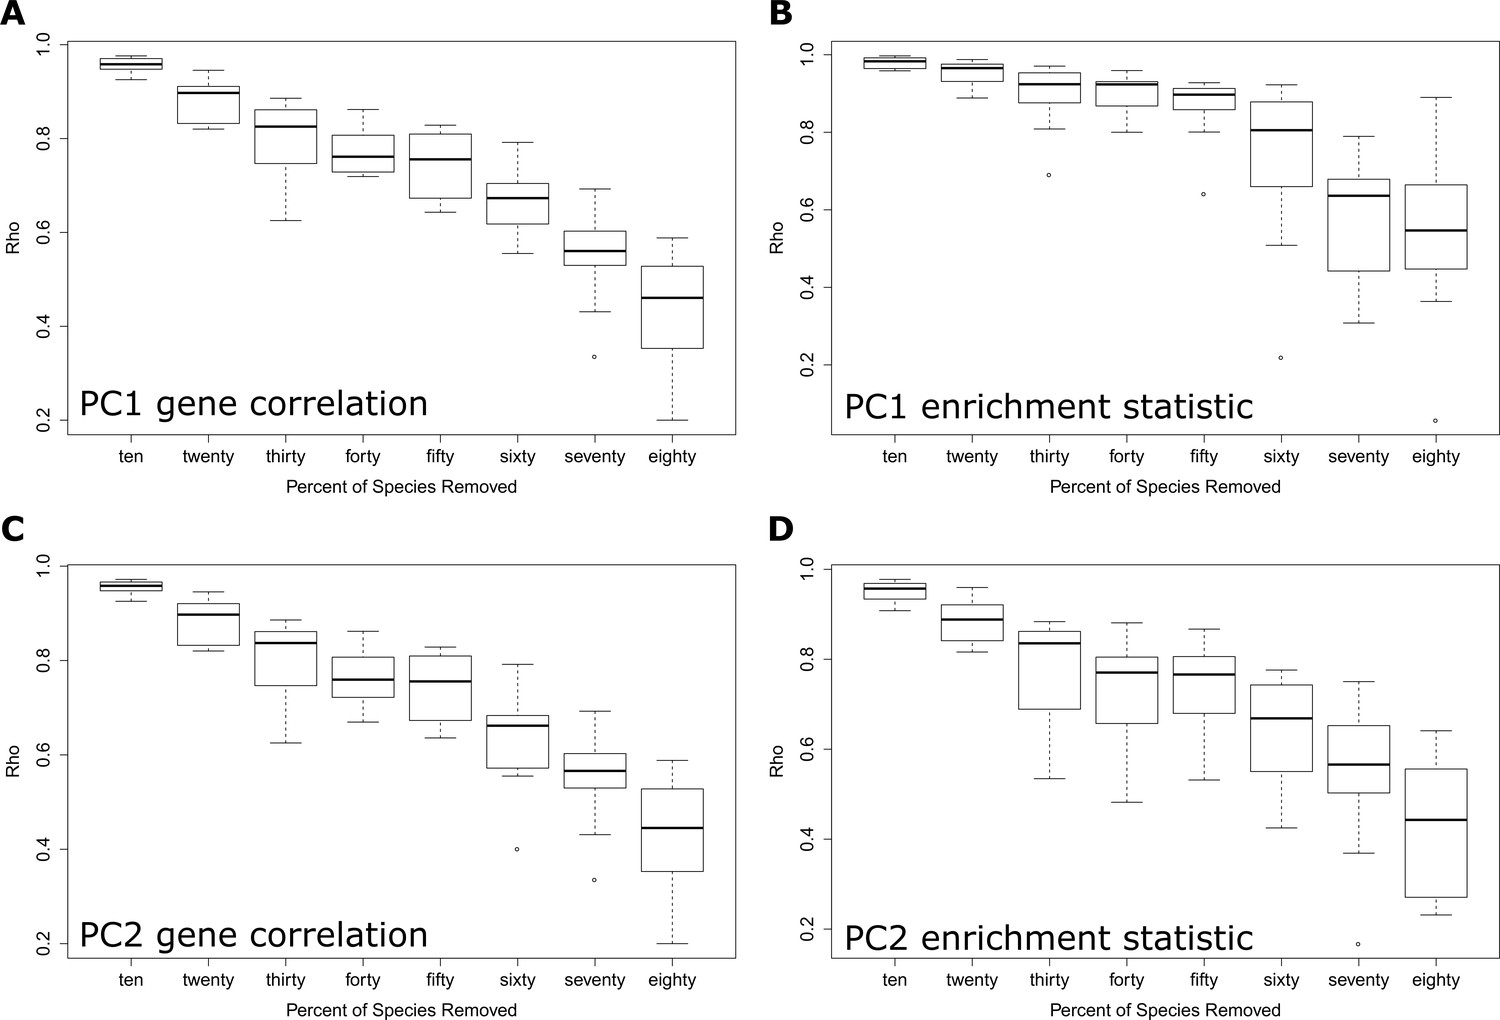
Each panel demonstrates the correlation between results using all species and results with ten to eighty percent of species removed.
Panels (A and B) show results from the PC1 phenotype 3L and panels (C and D) show results from the PC2 phenotype ELL. Panels (A and C) show correlations between gene results as quantified by the sign of the correlation statistic times the negative log p-value of the gene correlation. Panels (B and D) show correlations between enrichment results as quantified by the sign of the pathway enrichment statistic times the negative log p-value of the pathway enrichment statistic. There is a strong relationship between results from the full dataset and results from partial datasets, which suggest that the results are generally robust to species presence and absence.
Figure 1—figure supplement 4
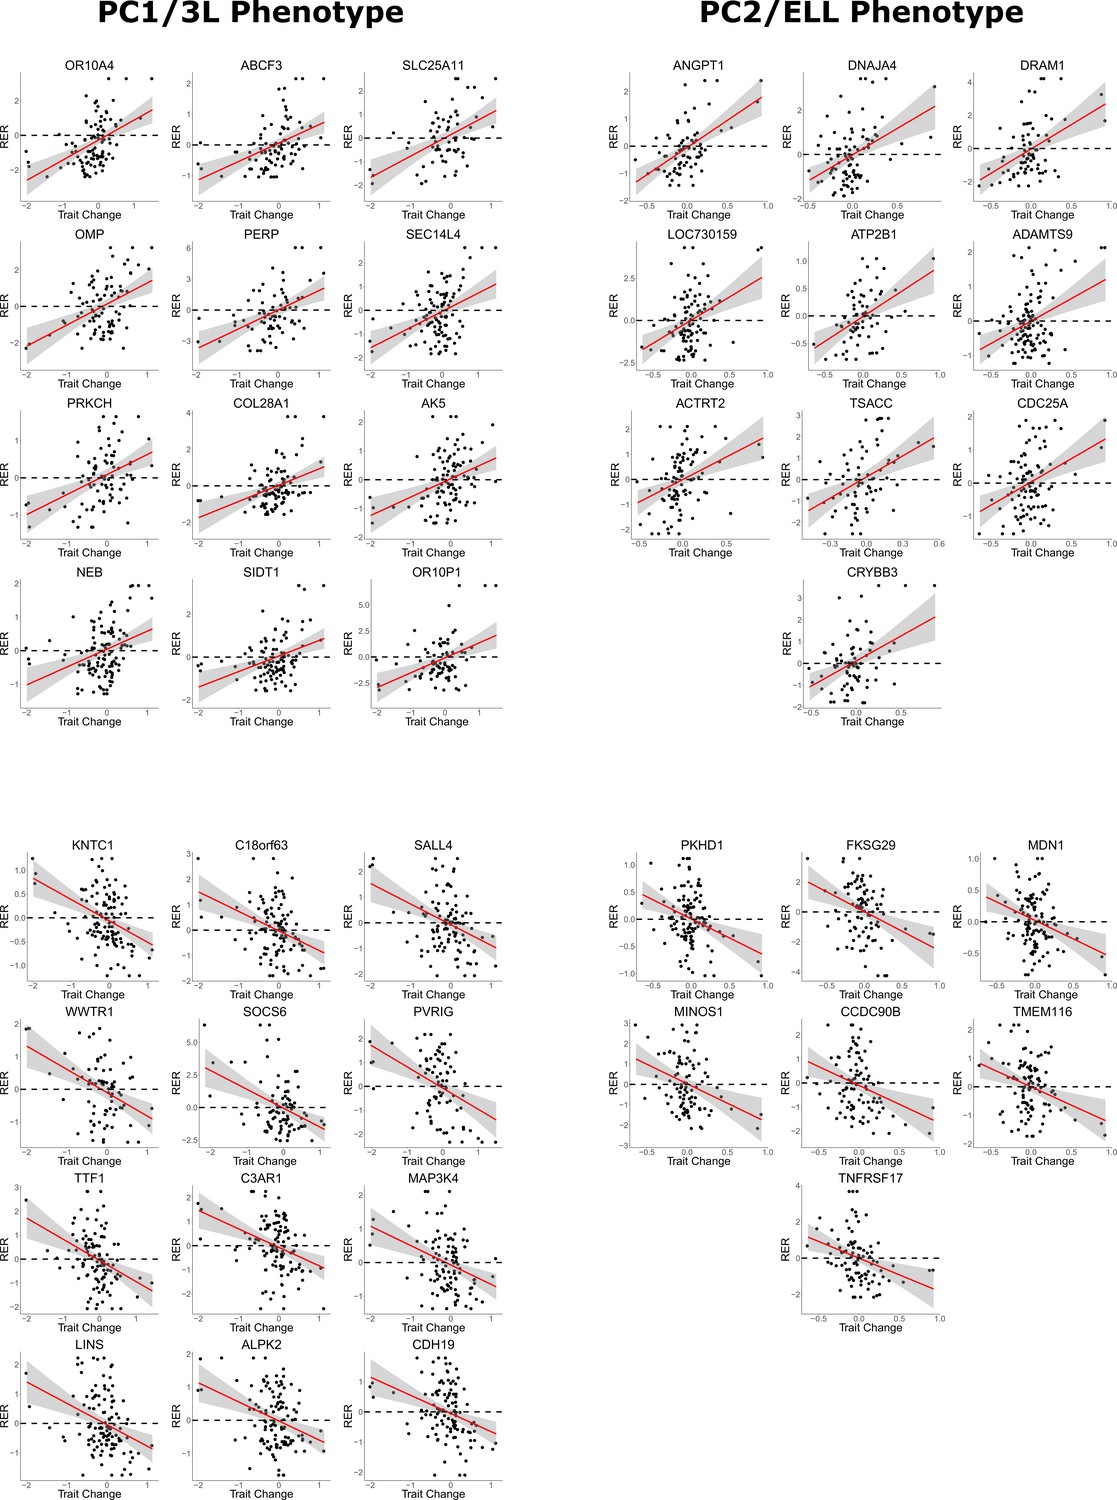
Scatterplots for both 3L and ELL phenotype trait change versus relative evolutionary rate.
Genes depicted for the 3L phenotype have adjusted correlation p-values below 0.15, genes depicted for ELL positive correlations have adjusted correlation p-values below 0.4, and genes depicted for ELL negative correlations have adjusted correlation p-values below 0.5.
Figure 1—figure supplement 5
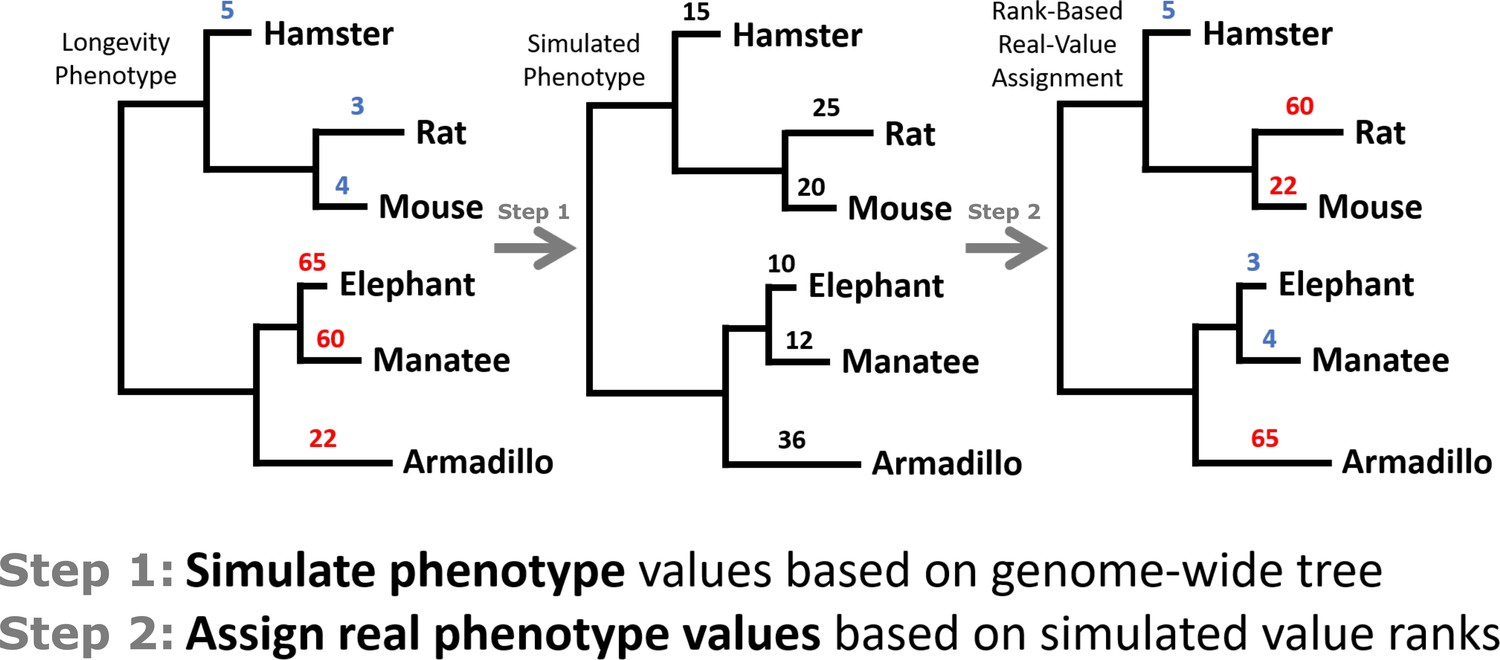
Diagram of a toy example of permulation calculations.
Starting with 3L or ELL phenotypes, new phenotype values are simulated based on average genome-wide evolutionary rate. Original phenotype values are then reassigned to species based on the ranks of simulated values and used as the new permulated phenotype values.
Figure 1—figure supplement 6
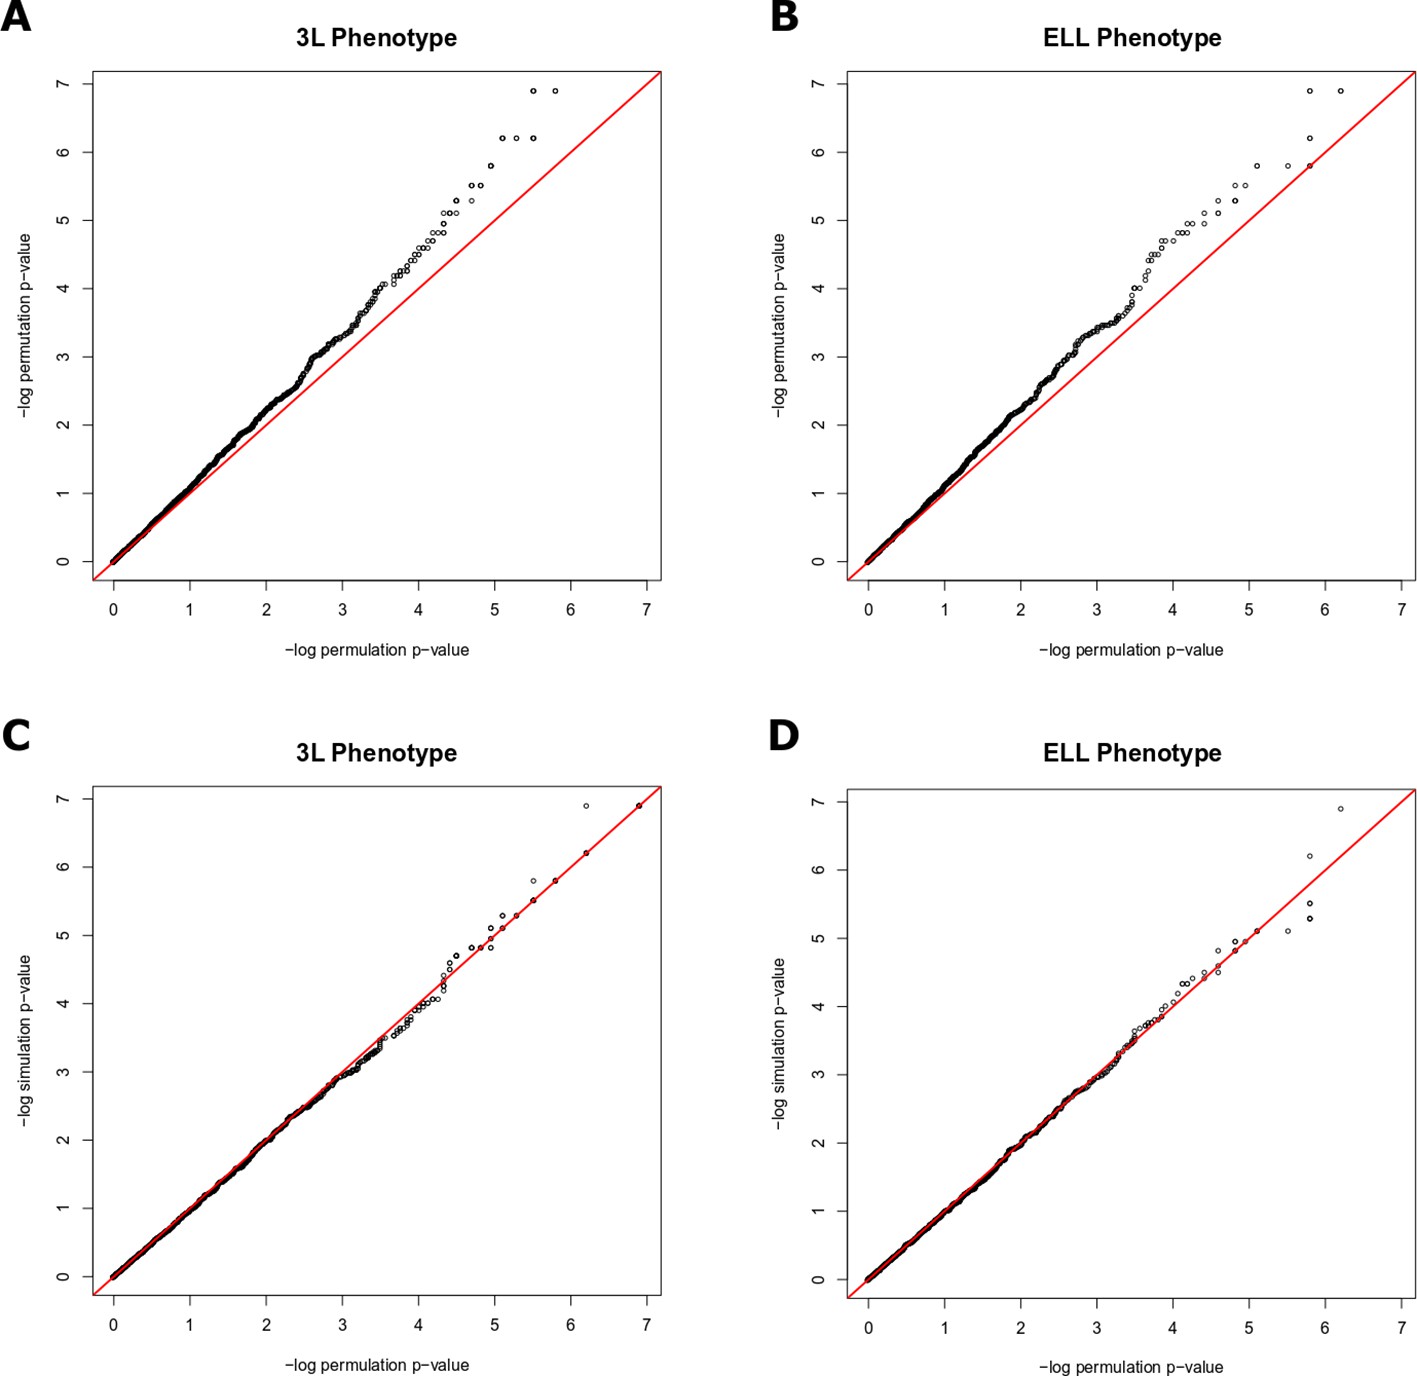
Quantile-quantile plots demonstrating that permulation p-values are more conservative than permutation p-values for both 3L and ELL phenotypes (A and B) and permulation p-values are equally as conservative as simulation p-values for both 3L and ELL phenotypes (C and D).
Figure 1—figure supplement 7

Phylogenetic tree with all 61 mammal species used for RERconverge analysis.
Branch lengths represent average evolutionary rates for each species as estimated by RERconverge. This tree topology was first reported in Meyer et al. (2018) and was created based on two widely-accepted phylogenies (Bininda-Emonds et al., 2007; Meredith et al., 2011) and extensive literature review.
Figure 1—figure supplement 8
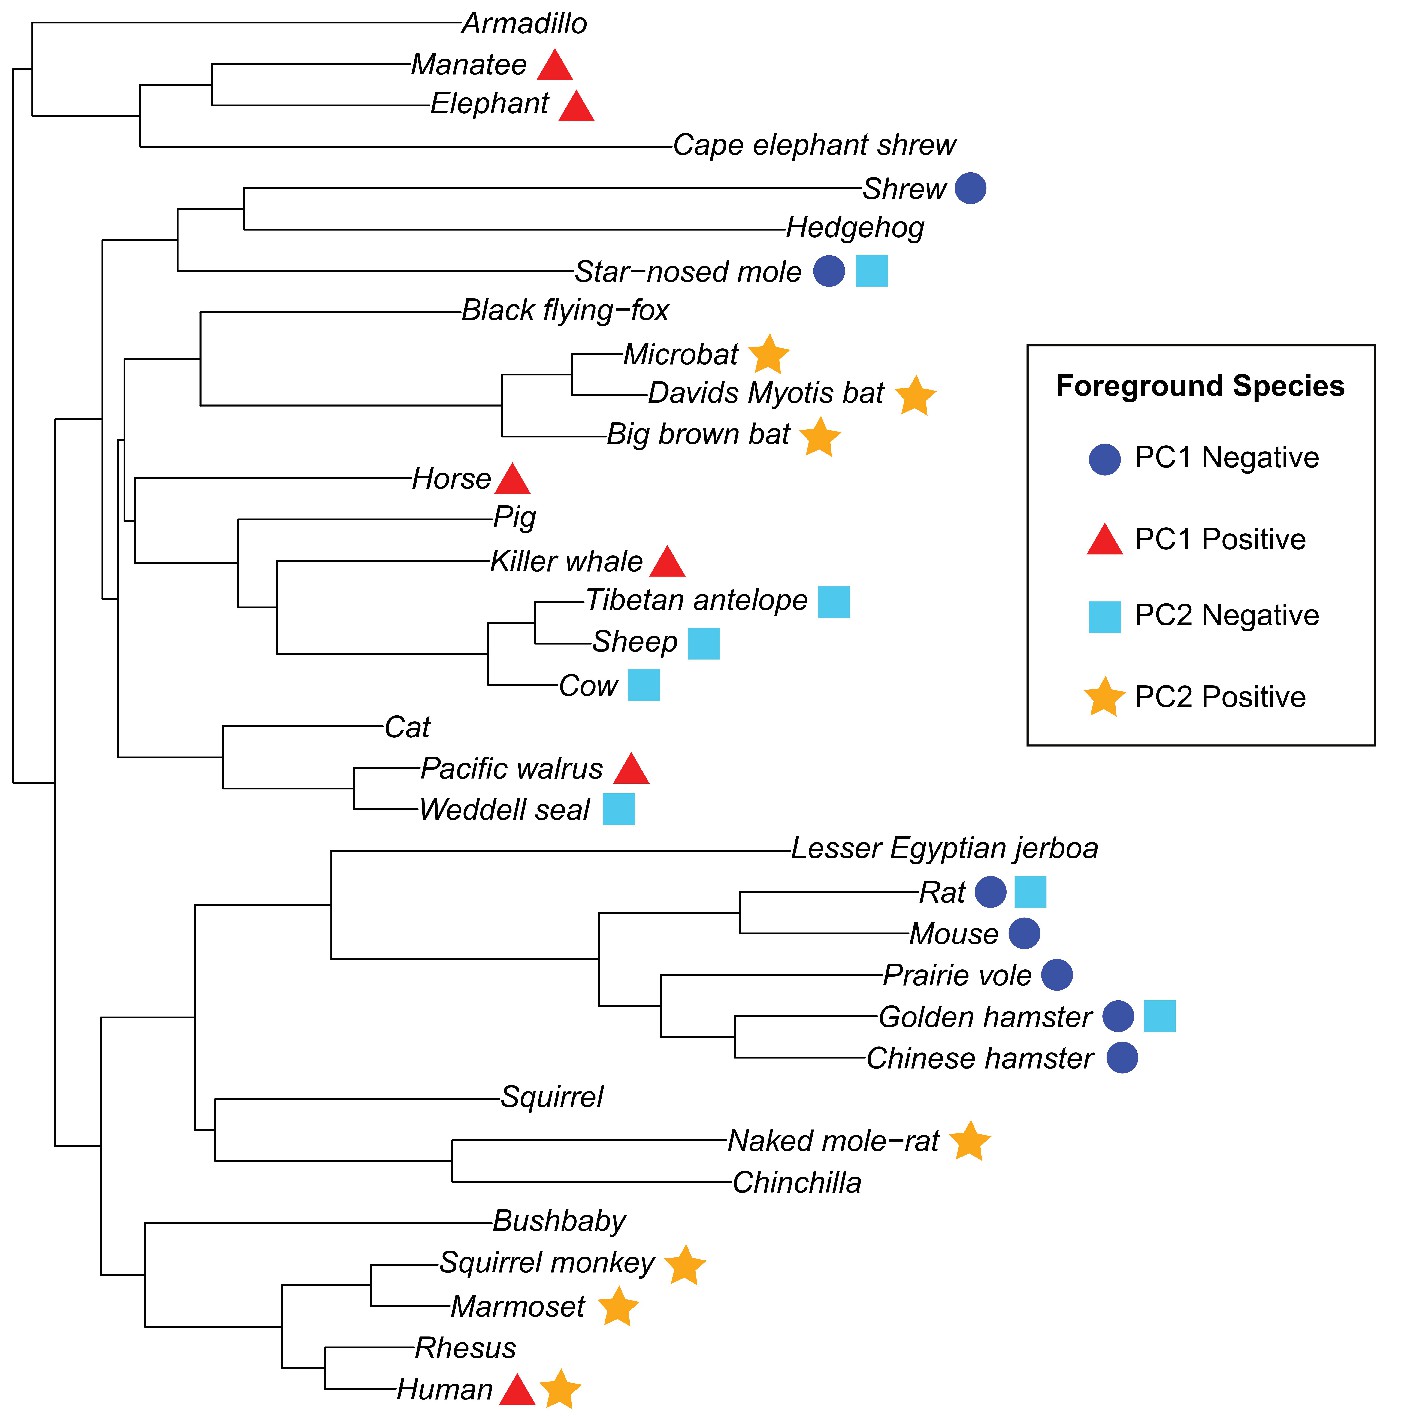
Phylogenetic tree with 34 placental mammal species used for branch-site tests for positive selection.
Species used as foreground for each of the four phenotypes (PC1 = 3L, PC2 = ELL) are represented by symbols and shapes.
Figure 1—figure supplement 9
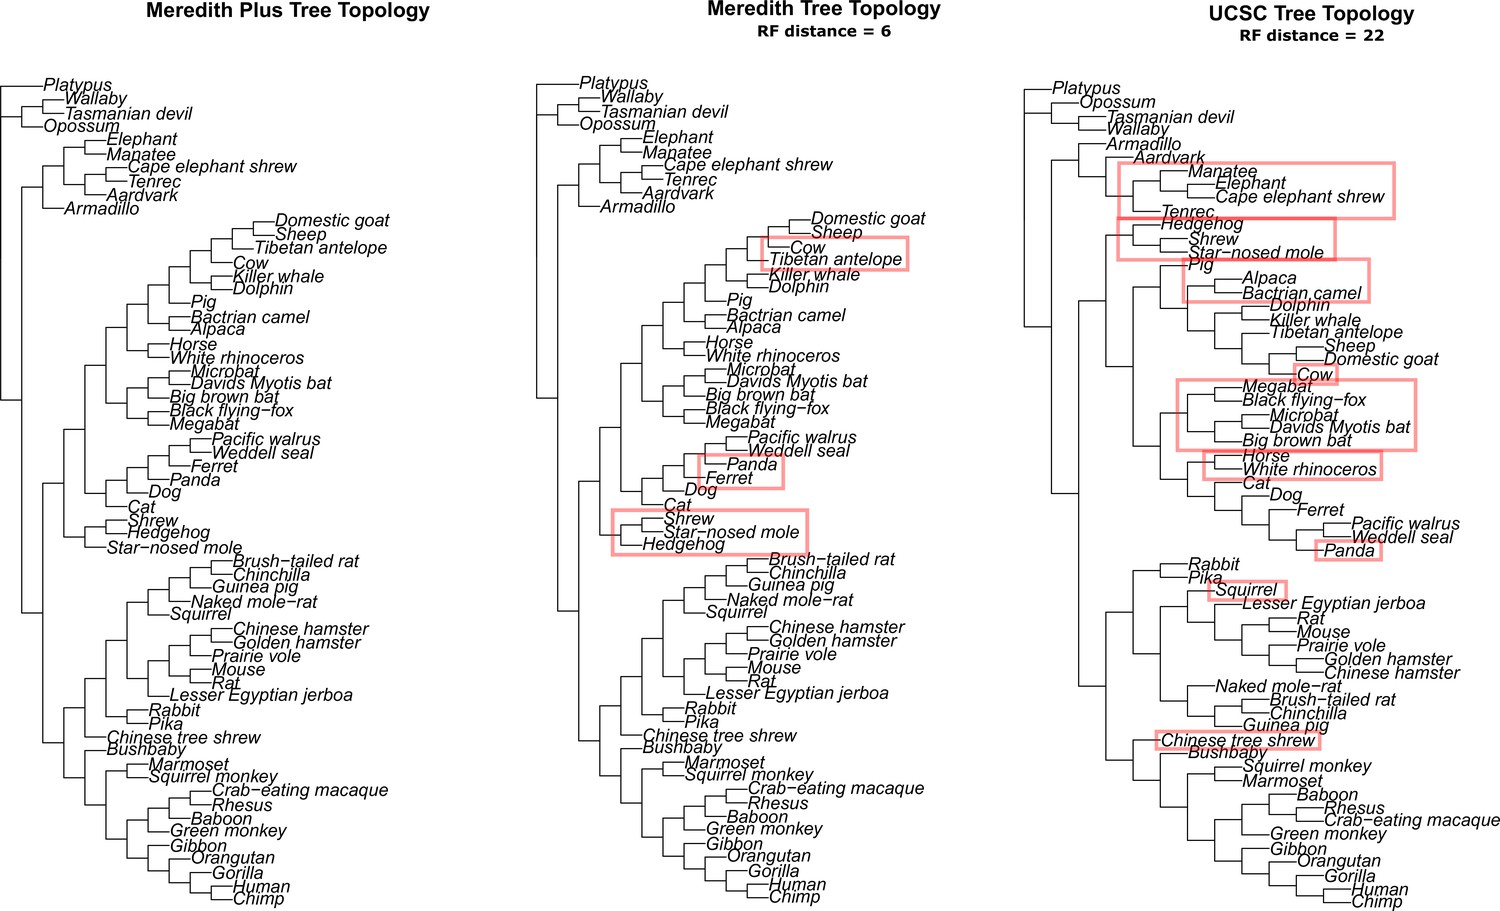
Alternative tree topologies used to test for robustness to phylogeny topology errors and incomplete lineage sorting.
Figure 1—figure supplement 10
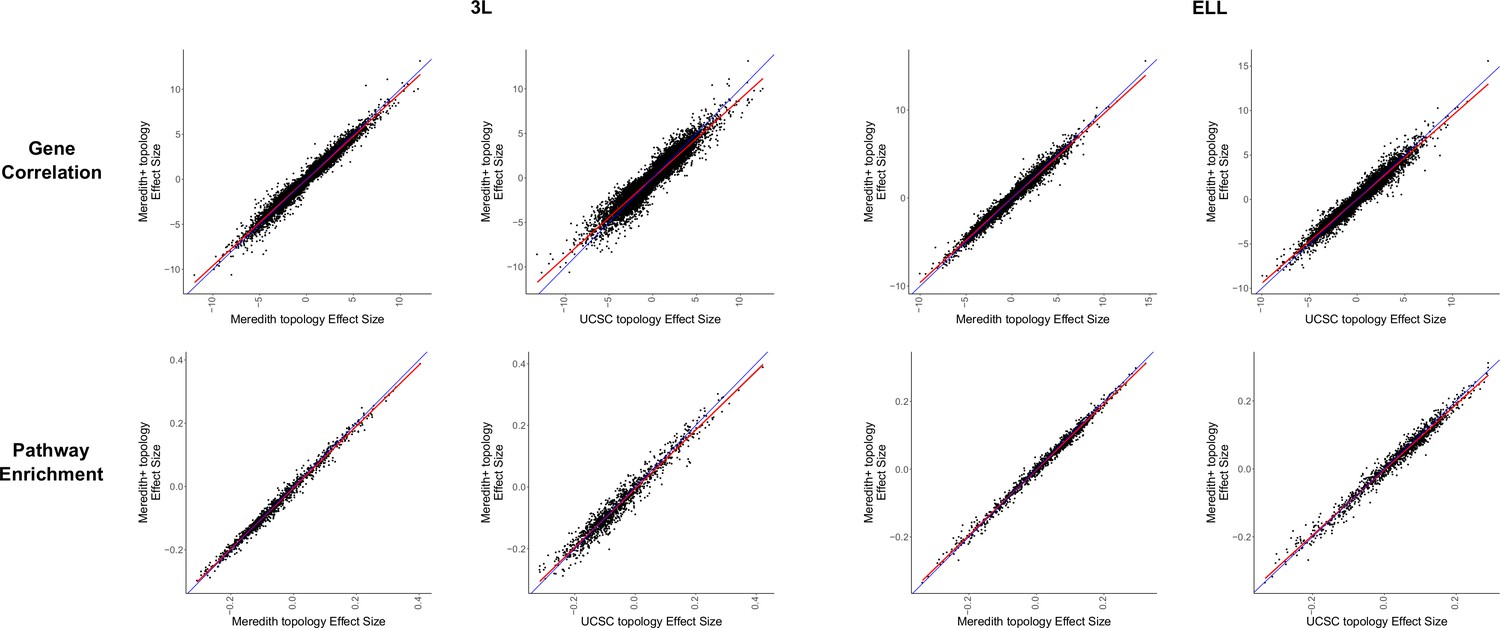
Correlations between gene correlation and pathway enrichment statistics between alternative tree topologies and the Meredith+ tree topology used for all other analyses.
Correlations between results are very strong, indicating that the results are robust to differences in tree topology.
Figure 1—figure supplement 11
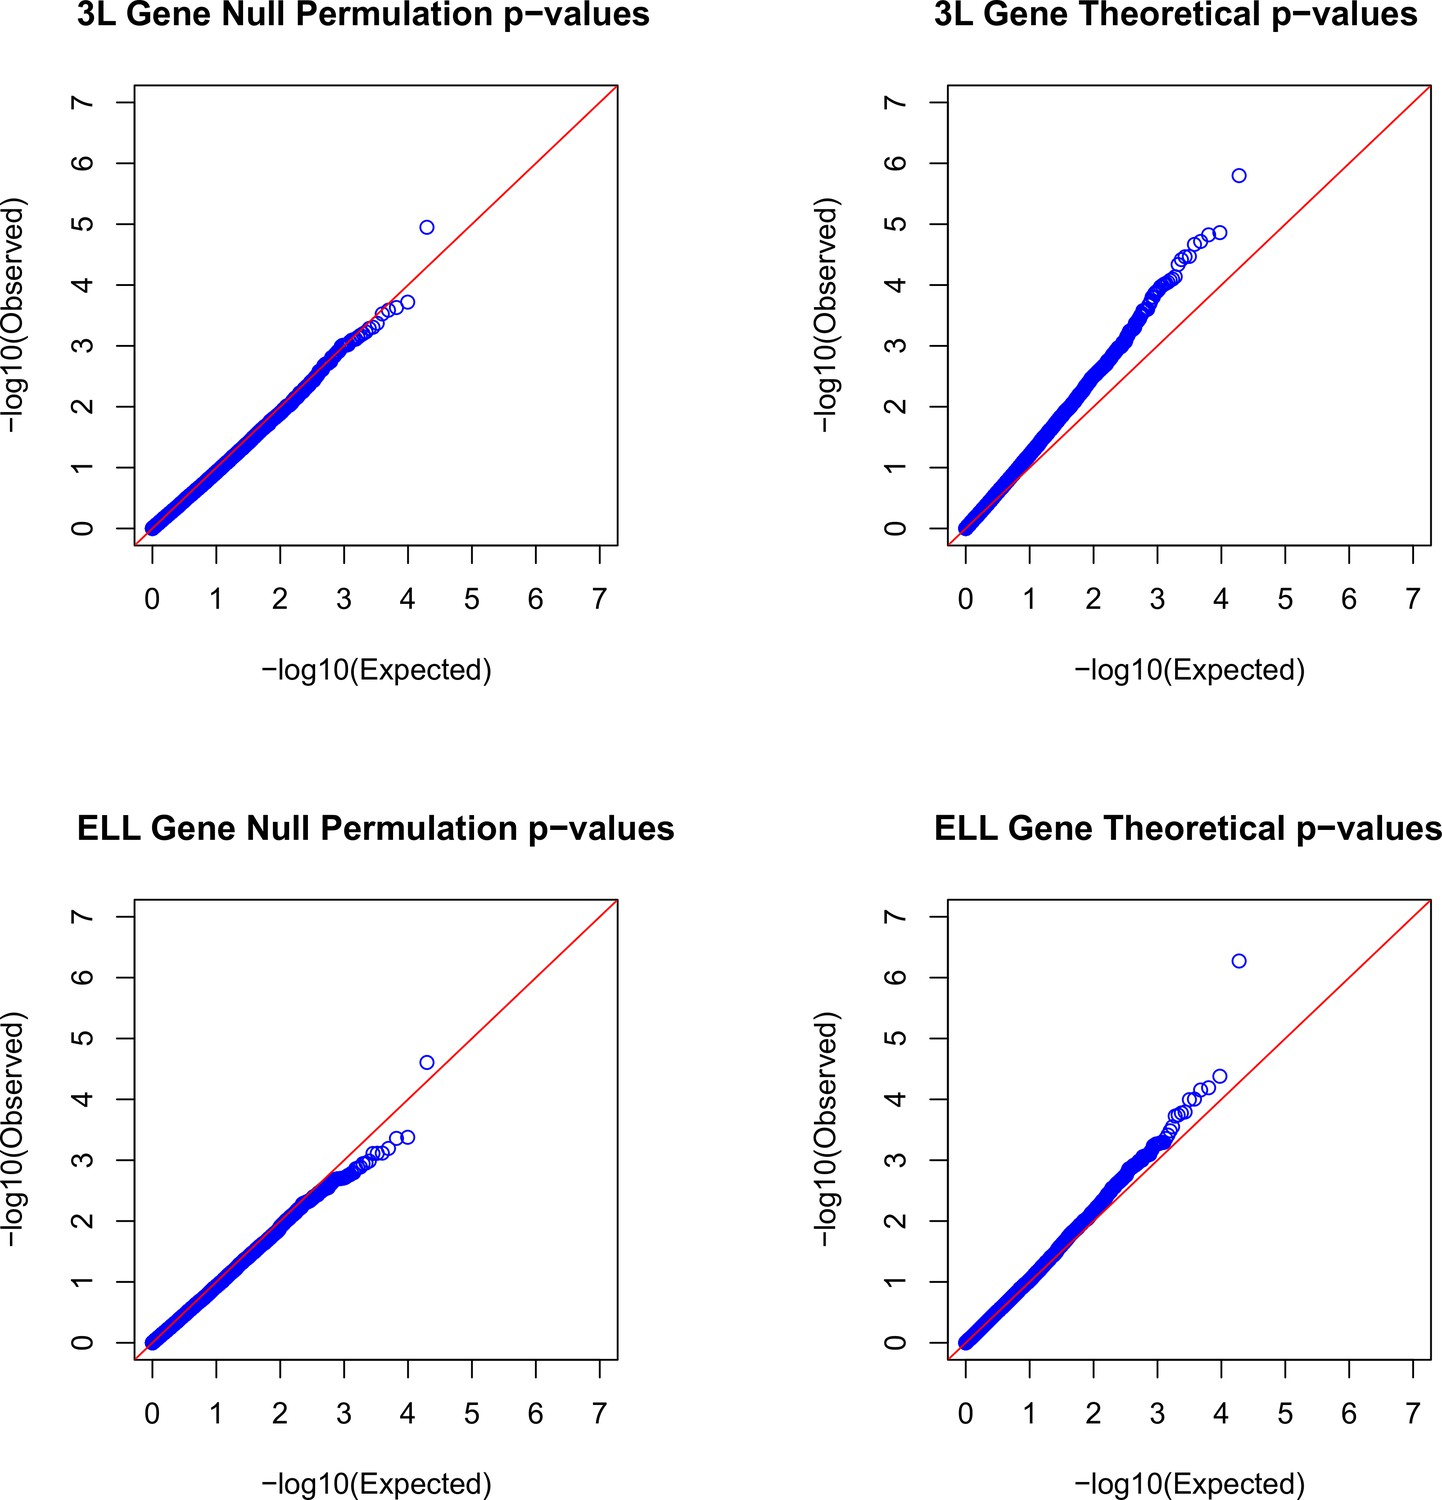
Q-Q plots demonstrating the relationship between null gene permulation p-values and a standard uniform distribution and theoretical gene p-values and a standard uniform distribution for both 3L and ELL phenotypes.
Figure 2
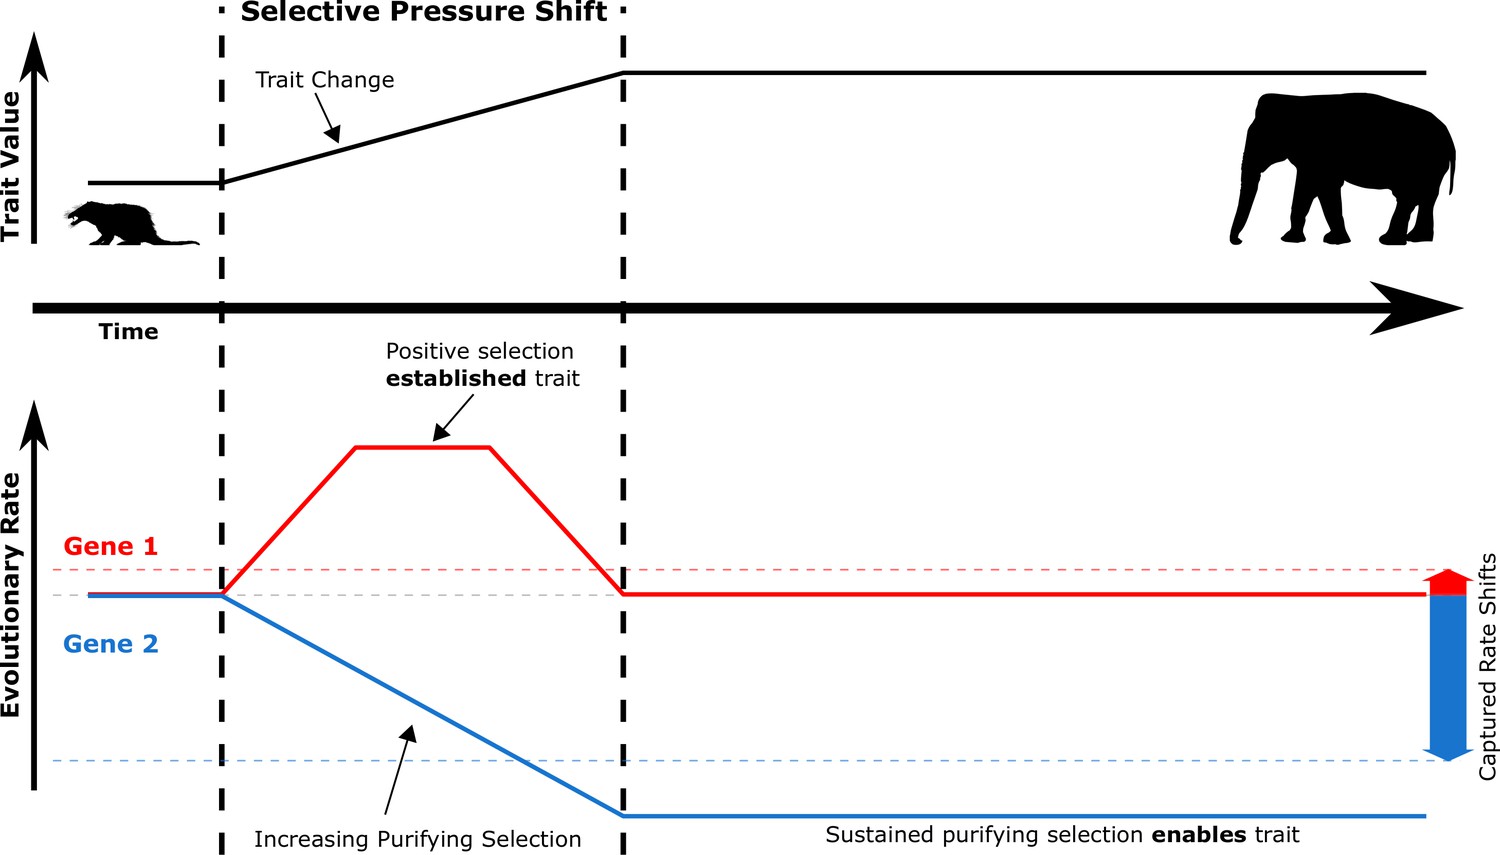
During selective pressure shifts that drive phenotypic changes, the genetic evolutionary rate landscape shifts for many genes.
Imagine a simplified case where Gene 1 and Gene 2 start at the same evolutionary rate (solid red and blue lines, respectively). Trait-driving genes like Gene 1 enter a transient state of increased evolutionary rates to drive trait change. Complementary genes that support the trait like Gene 2 experience increased purifying selection to allow the trait to persist as it is established. True rates (solid red and blue lines) are not measurable because they represent rates at inaccessible ancestral evolutionary timepoints – only accessible extant sequences can be used to access average rates over time (dashed red and blue lines, which represent positive and negative RERs). Therefore, transient periods of positive selection are less readily able to be captured by RERconverge than sustained purifying selection due to the greater magnitude of their captured rate shifts.
Figure 3 with 1 supplement
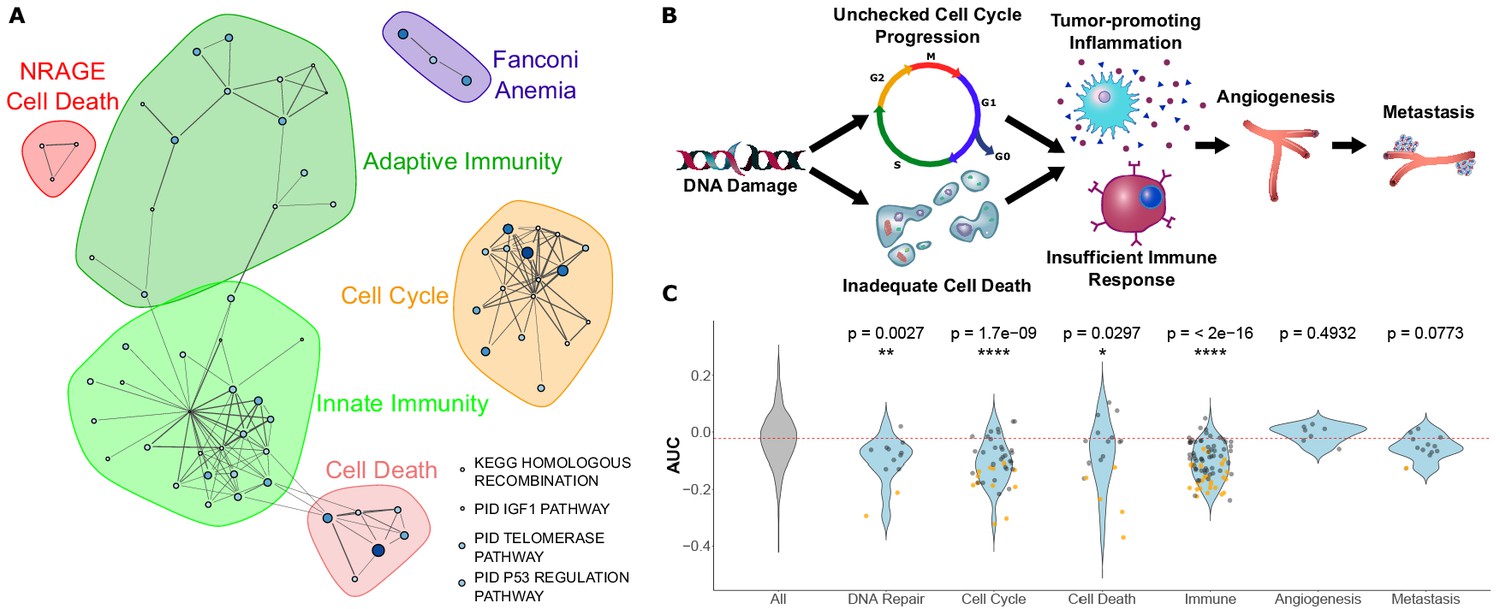
Pathways that evolve slower in long-lived, large-bodied mammals are related to control of cancer.
(A) Significantly enriched pathways under increased constraint in species with larger values of the 3L phenotype. Each dot represents a pathway, and the size and color of the dot represents the negative log of the rank-sum enrichment statistic. Width of lines connecting pathways represent the number of genes the pathways have in common. (B and C) Pathways under increased constraint in 3L species play various roles in cancer control. Pathways associated with early stages of cancer development (DNA repair, cell cycle control, cell death, and immune functions) are significantly enriched, while pathways for later stages of cancer development (angiogenesis and metastasis) are not enriched. In C), each dot represents a pathway. Yellow dots have significant permulation p-values while black dots do not. Note that dots for ‘All’ pathways are excluded for the sake of clarity.
Figure 3—figure supplement 1
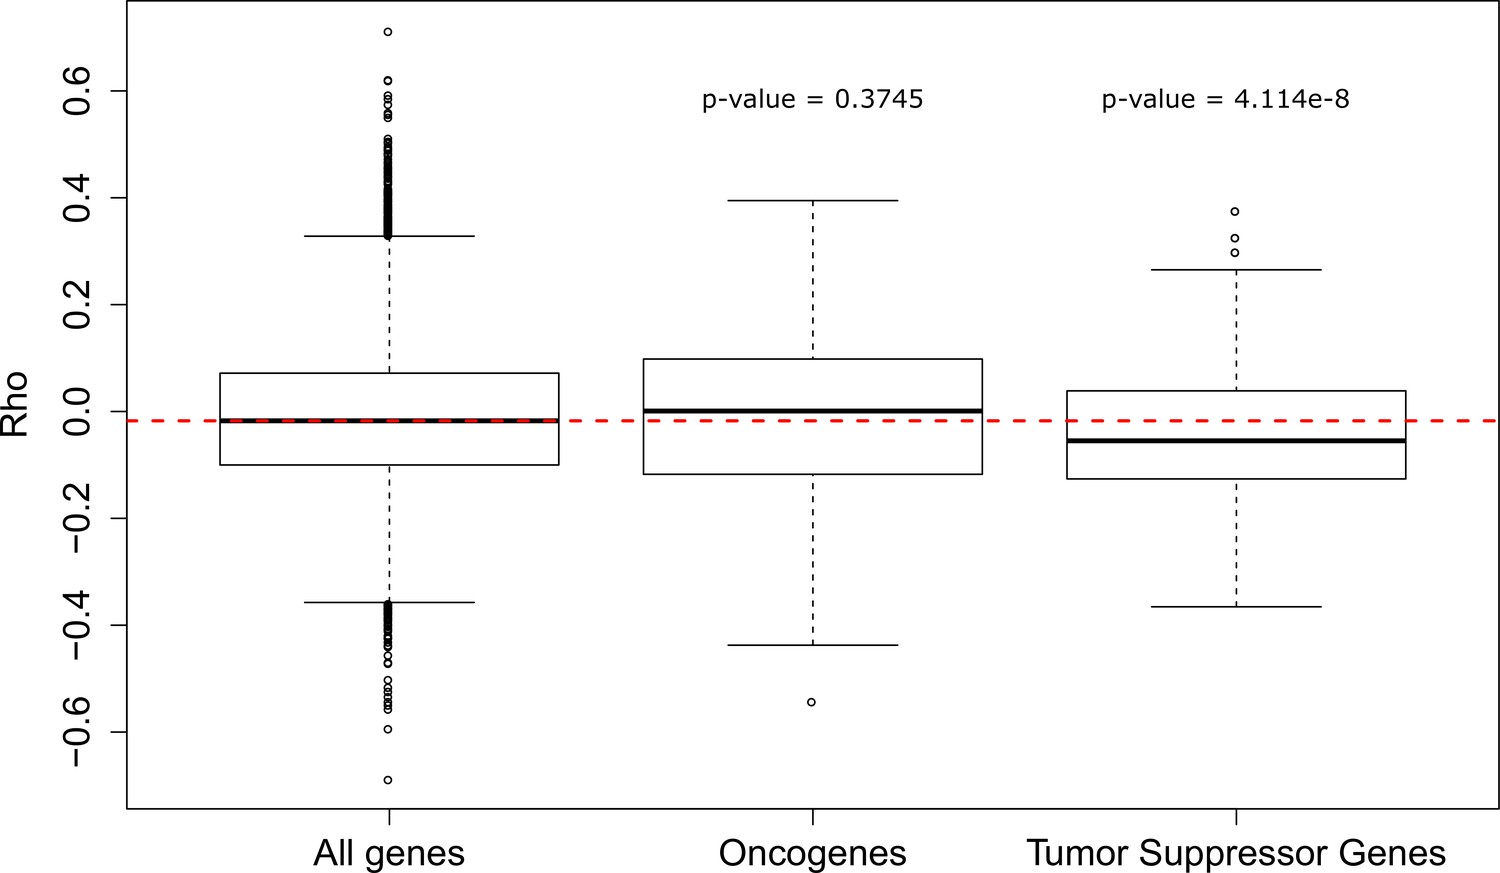
Correlation statistics (Rho) for gene evolutionary rate with PC1 3L phenotype.
Oncogenes show no significant difference in Rho compared to all genes, which tumor suppressor genes show significantly more negative correlations (Wilcoxon Rank-Sum).
Figure 4
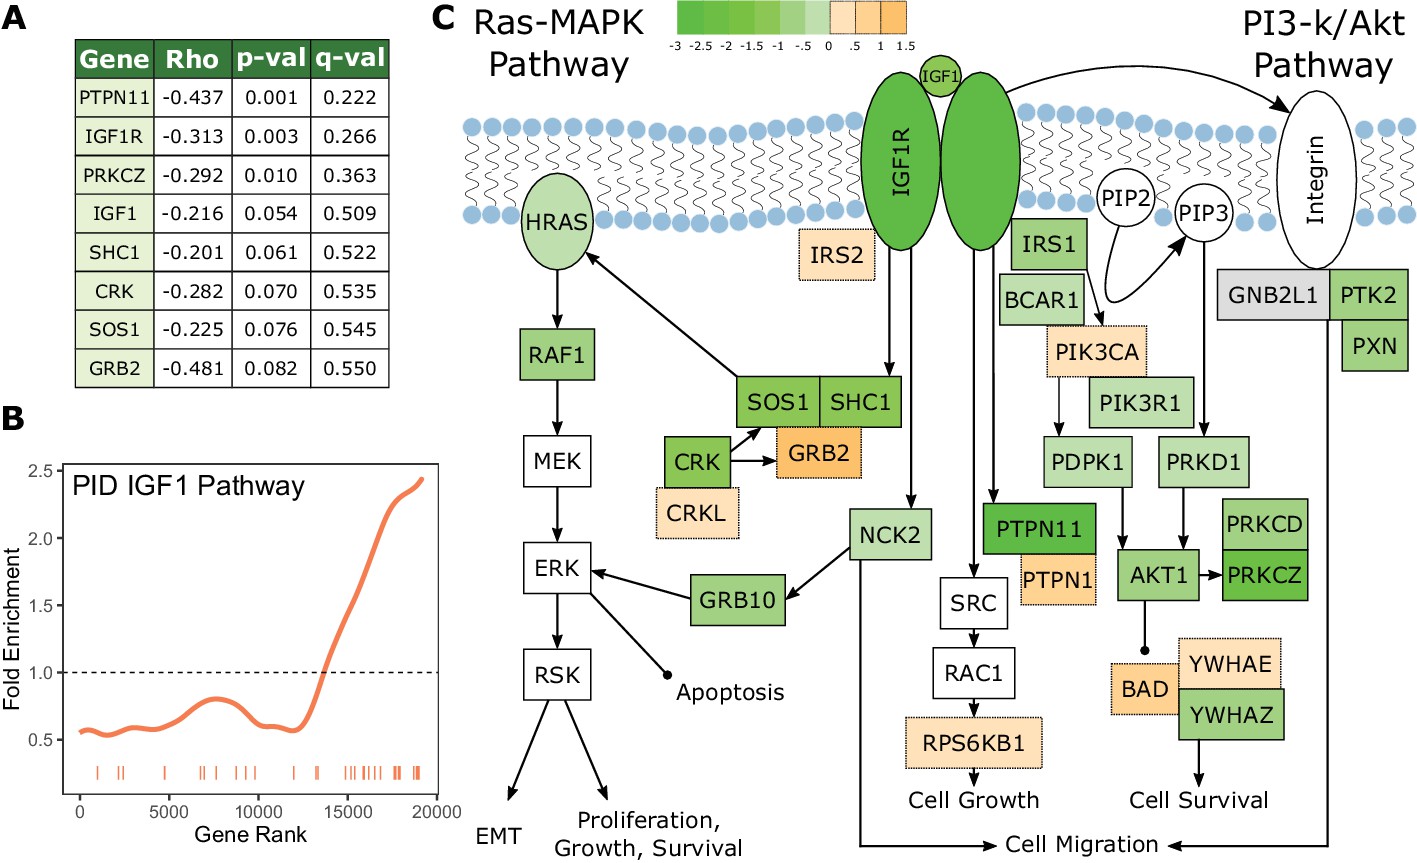
The IGF1 signaling pathway is under increased evolutionary constraint in long-lived, large-bodied mammals.
(A) IGF1 signaling pathway genes are significantly correlated with change in the 3L phenotype. (B) The IGF1 signaling pathway is significantly enriched for increased evolutionary constraint in large, long-lived species. The barcode indicates ranks of genes in the pathway within the list of all pathway-annotated genes. The worm indicates enrichment as calculated by a tricube moving average, a type of moving average in which values near the end of the sliding window are down weighted to reduce the effect of extreme values in any given window. The dashed horizontal line marks the null value indicating no enrichment. (C) The IGF1 signaling pathway contains many genes whose evolutionary rates are negatively correlated with the 3L phenotype. Shading indicates the Rho-signed negative log p-value for the correlation. Genes in white are not included in the IGF1 pathway annotation used to calculate pathway enrichment statistics, but they are included in the diagram for sake of completeness. The GNB2L1 gene (gray) is in the IGF1 pathway annotation, but correlation statistics were not calculated for that gene because too few branches in the gene tree met the minimum branch length cut-off.
Figure 5
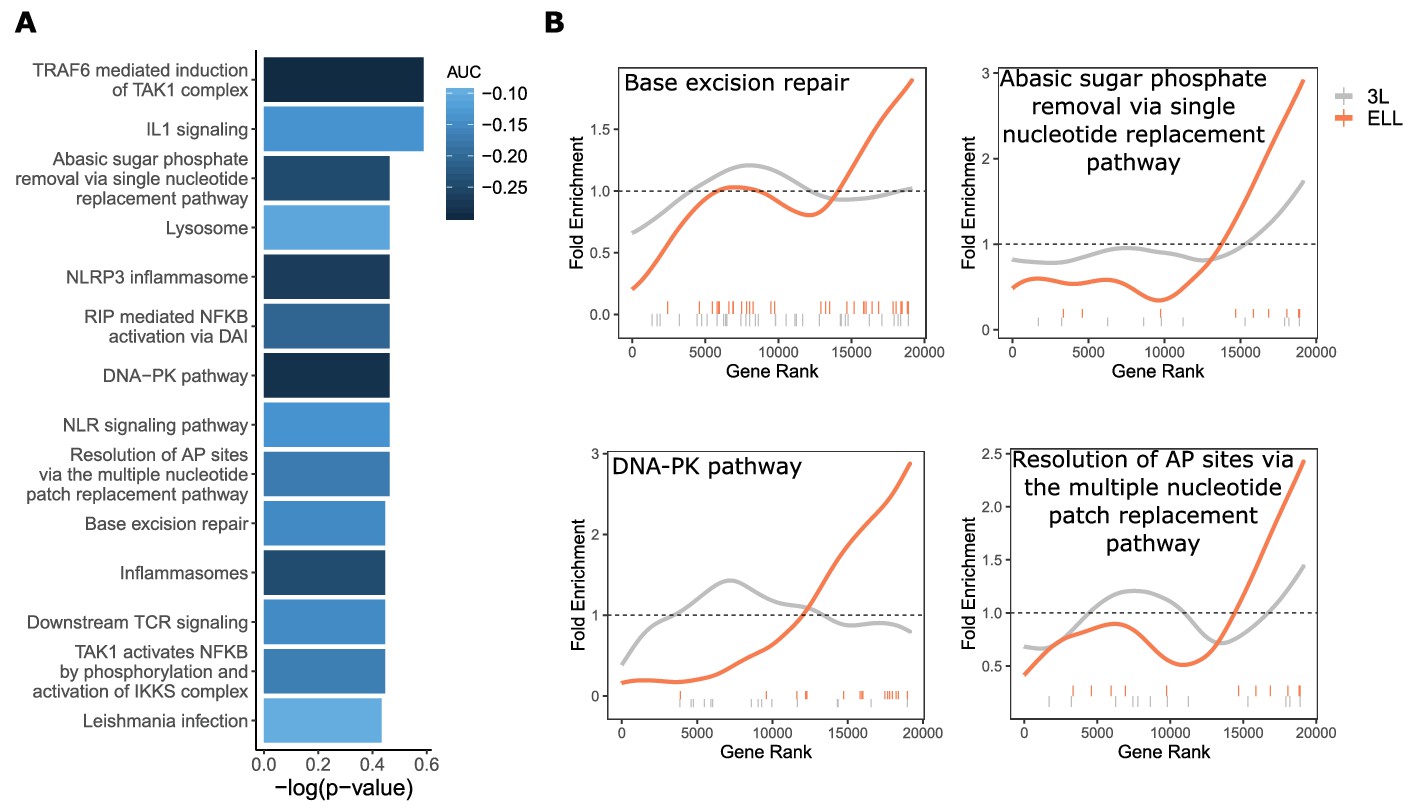
DNA repair pathways are under increased evolutionary constraint in mammals that are exceptionally long-lived given their body size.
(A) Significantly enriched pathways under increased constraint in species with larger values of the ELL phenotype. Bar height indicates the negative log permulation p-value for each pathway, and the color of bars indicates the pathway enrichment statistic. (B) DNA repair pathways are more significantly enriched for increased evolutionary constraint in species with large values of the ELL phenotype than species with large values of the 3L phenotype. The barcodes indicate ranks of genes in the pathways within the list of all pathway-annotated genes. The worms indicate enrichment as calculated by a tricube moving average, a type of moving average in which values near the end of the sliding window are down weighted to reduce the effect of extreme values in any given window. The dashed horizontal lines mark the null value indicating no enrichment.
Additional files
-
Supplementary file 1
Phenotype values.
Includes longevity, body size, 3L, and ELL values for the 61 mammal species used for analyses.
- https://cdn.elifesciences.org/articles/51089/elife-51089-supp1-v1.xlsx
-
Supplementary file 2
Pathway enrichment analysis results.
Pathway enrichment results for both the 3L and ELL phenotypes using MSigDB canonical pathway annotations.
- https://cdn.elifesciences.org/articles/51089/elife-51089-supp2-v1.xlsx
-
Supplementary file 3
Pathway clustering for 3L enriched pathways.
Pathway group membership for the 3L phenotype as depicted in Figure 2.
- https://cdn.elifesciences.org/articles/51089/elife-51089-supp3-v1.xlsx
-
Supplementary file 4
Gene-phenotype evolutionary rate correlation and subtree analysis gene-phenotype correlation results.
Correlation statistics between gene evolutionary rates and phenotype values as obtained from RERconverge for both the 3L and ELL phenotypes separated by correlation direction. Also included are statistics from species removal analyses.
- https://cdn.elifesciences.org/articles/51089/elife-51089-supp4-v1.xlsx
-
Supplementary file 5
Subtree analysis pathway enrichment results.
Pathway enrichment statistics from species removal analyses for both the 3L and ELL phenotypes using MSigDB canonical pathway annotations.
- https://cdn.elifesciences.org/articles/51089/elife-51089-supp5-v1.xlsx
-
Supplementary file 6
Branch-site model tests for positive selection results.
Results from branch-site model tests on genes to detect genes under positive selection in species at both extremes of the 3L and ELL phenotypes.
- https://cdn.elifesciences.org/articles/51089/elife-51089-supp6-v1.xlsx
-
Transparent reporting form
- https://cdn.elifesciences.org/articles/51089/elife-51089-transrepform-v1.docx
Download links
A two-part list of links to download the article, or parts of the article, in various formats.
Downloads (link to download the article as PDF)
Open citations (links to open the citations from this article in various online reference manager services)
Cite this article (links to download the citations from this article in formats compatible with various reference manager tools)
Pan-mammalian analysis of molecular constraints underlying extended lifespan
eLife 9:e51089.
https://doi.org/10.7554/eLife.51089


