β11-12 linker isomerization governs acid-sensing ion channel desensitization and recovery
- Graduate Program in Cellular and Molecular Pharmacology and Physiology, United States
- Biomedical Engineering Program, University of Rochester, United States
- Department of Pharmacology and Physiology, University of Rochester Medical Center, United States
- Department of Chemistry and Biomolecular Sciences, University of Ottawa, Canada
Figures
Figure 1 with 1 supplement
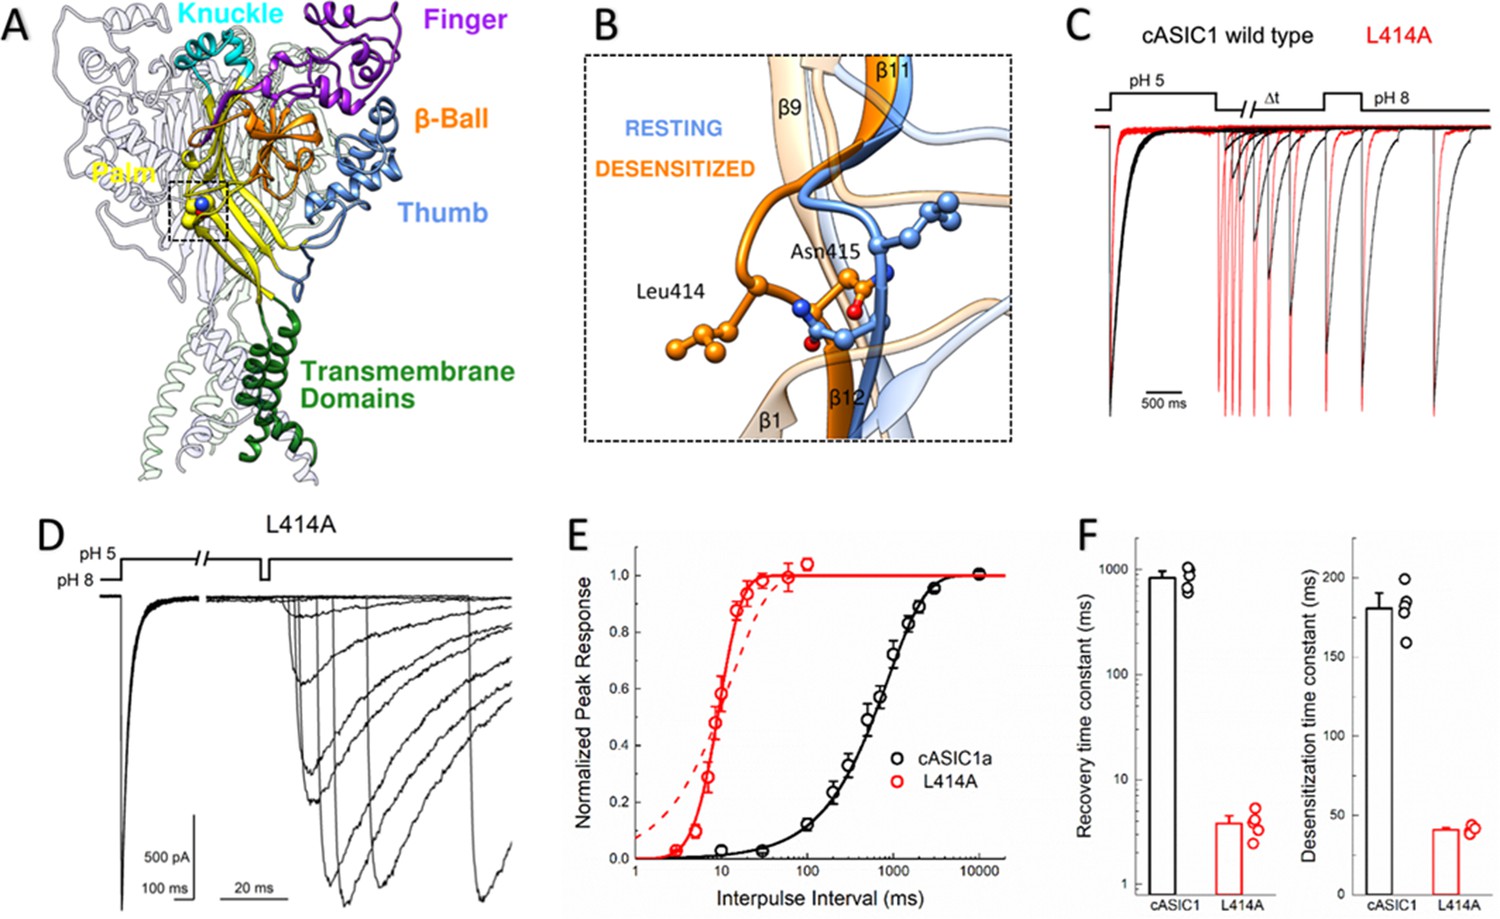
L414A drastically accelerates cASIC1 desensitization and recovery.
(A) Crystal structure of the low-pH desensitized states of cASIC1 (PDB:4NYK) with major domains of one subunit colored and labeled. Boxed region contains the β11–12 linker. (B) Closeup view of locally aligned β11–12 linkers of resting (blue, PDB:5WKV) and desensitized states (orange). Leu414 and Asn415 side chains are depicted as ball and stick. The view has been rotated approximately 90 degrees compared to A). (C) Normalized outside-out patch recordings of wild-type cASIC1 (black traces) and L414A (red traces) during a paired pulse recovery protocol. (D) Representative recording of L414A responses during a modified paired pulse protocol to examine very brief inter-pulse intervals. Note the different time scales before and after the x-axis break. The pH protocol for the shortest inter-pulse interval of 3 ms is shown. (E) Recovery from desensitization time course across patches for cASIC1 wild type (black) and L414A (red). Solid lines are fits using Equation 1. The dashed line is a fit using Equation 1 but with the slope factor, m, set to 1. (F) Summary of time constants of recovery from (left panel) and entry to (right panel) desensitization for wild type (black bars and circles) and L414A (red bars and circles). The error bars are S.E.M. and the circles are individual patches.
Figure 1—figure supplement 1
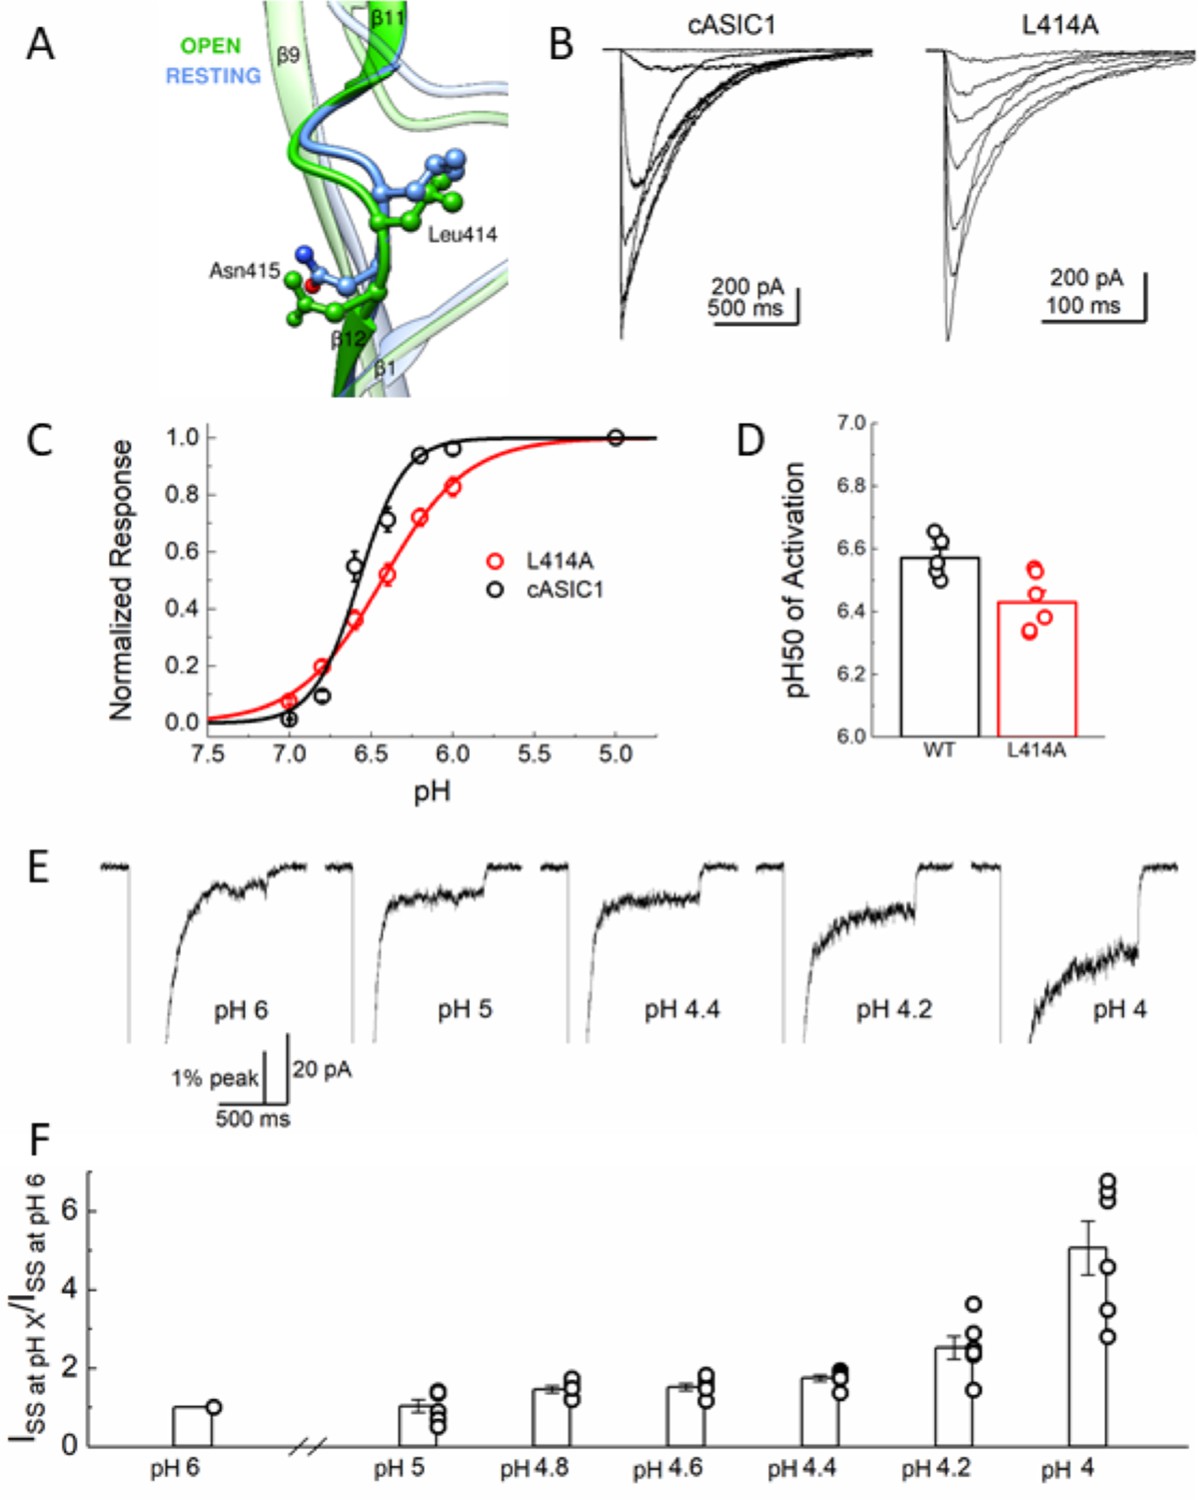
L414A does not substantially alter the pH dependence of activation.
(A) Local alignment of the β11–12 linker of resting (blue, PDB:5WKV) and open (green, PDB:4NTW) states. Leu414 and Asn415 side chains are depicted as ball and stick. (B) Representative responses from cASIC1 wild type (left) and L414A (right) to pH stimuli ranging from pH 7 to 5. (C) Summary of pH response curves for cASIC1 wild type (black) and L414A (red). (D) pH50 values of activation for all patches from panel (C). (E) Representative patch recording of L414A when activated by pH 6, 5, 4.4, 4.2 and 4 (left to right) but zoomed in on the sustained current. (F) Summary of fold increase in sustained current for L414A patches at a range of pH values. Note the sizeable increase around the previously reported pH50 for this mutation. All error bars are S.E.M. and the circles are individual patches.
Figure 2
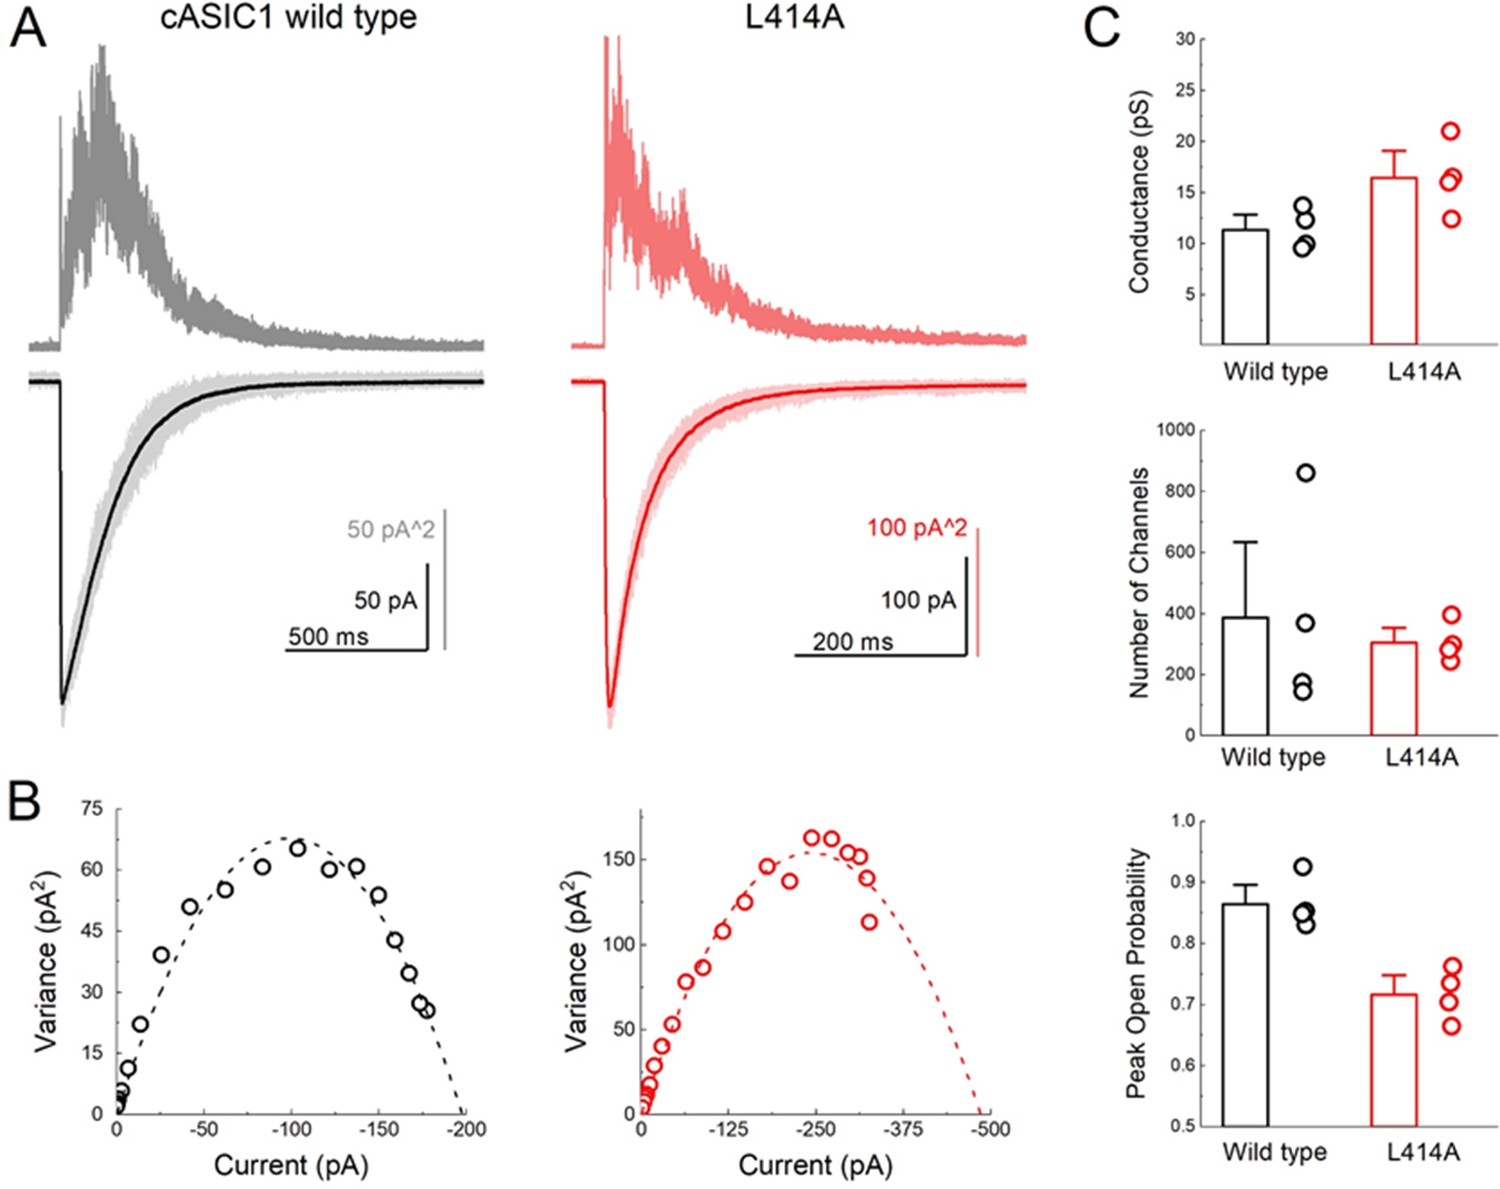
L414A lowers the open probability of cASIC1.
(A) Representative recordings of wild type (black and gray traces) and L414A (red traces) during a non-stationary fluctuation protocol. The solid downward traces represent an average of approximately 70 individual sweeps, which are collectively shown in light color (lower panels). The upward traces are the ensemble variances from each patch (upper panels). (B) Current-variance plot from each patch in (A) with the dotted line depicting the fit to Equation 4. (C) Summary plots of conductance, the number of channels and the calculated peak open probability from each patch. The error bars are S.E.M. and the circles are individual patches.
Figure 3 with 3 supplements

Deprotonation of L414A cASIC1 reduces the stability of the β11–12 linker in the desensitized state.
(A) Calculated RMSD as a function of time (left) and across the entire simulation (middle) for Cα atoms of amino acid residues 409–420 of protonated cASIC1 wild type (black) or L414A (red) over 200 ns of simulation. (A, right) Calculated RMSF from the same simulations. Each chain from each of three independent runs is represented as a single trace. (B) Same as in A) but for deprotonated simulations, 400 ns.
Figure 3—figure supplement 1
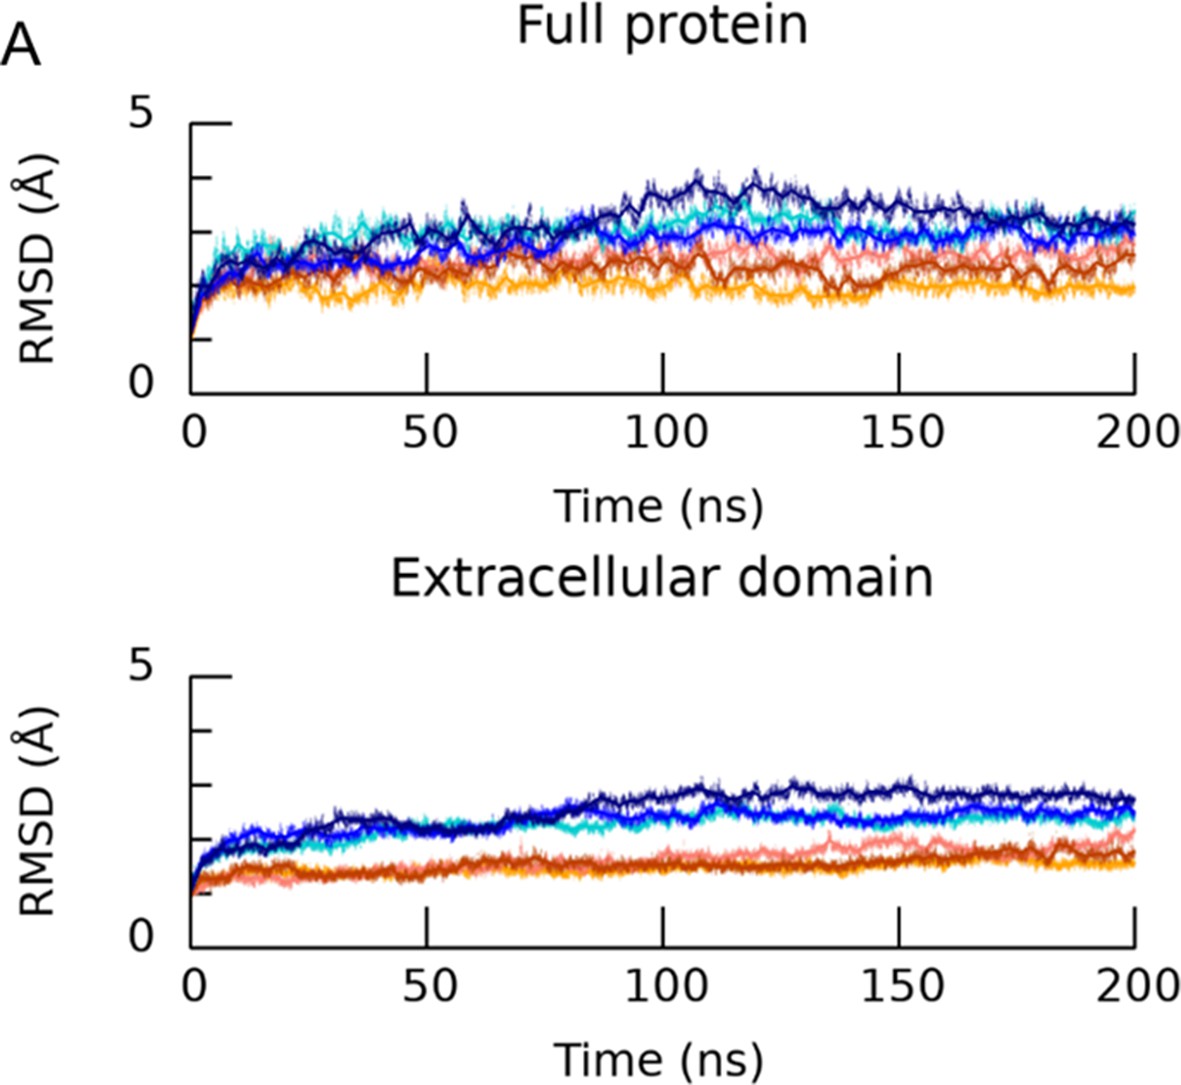
The employed protonation scheme stabilizes the desensitized conformation of cASIC1.
(A, upper) Calculated Cα RMSD of the simulated protonated desensitized state (blue shades) or deprotonated state (red shades) versus the desensitized structure (PDB ID 4NYK). Each trace is one repeat. (A, lower) Same as above but for the extracellular domain of cASIC1.
Figure 3—figure supplement 2
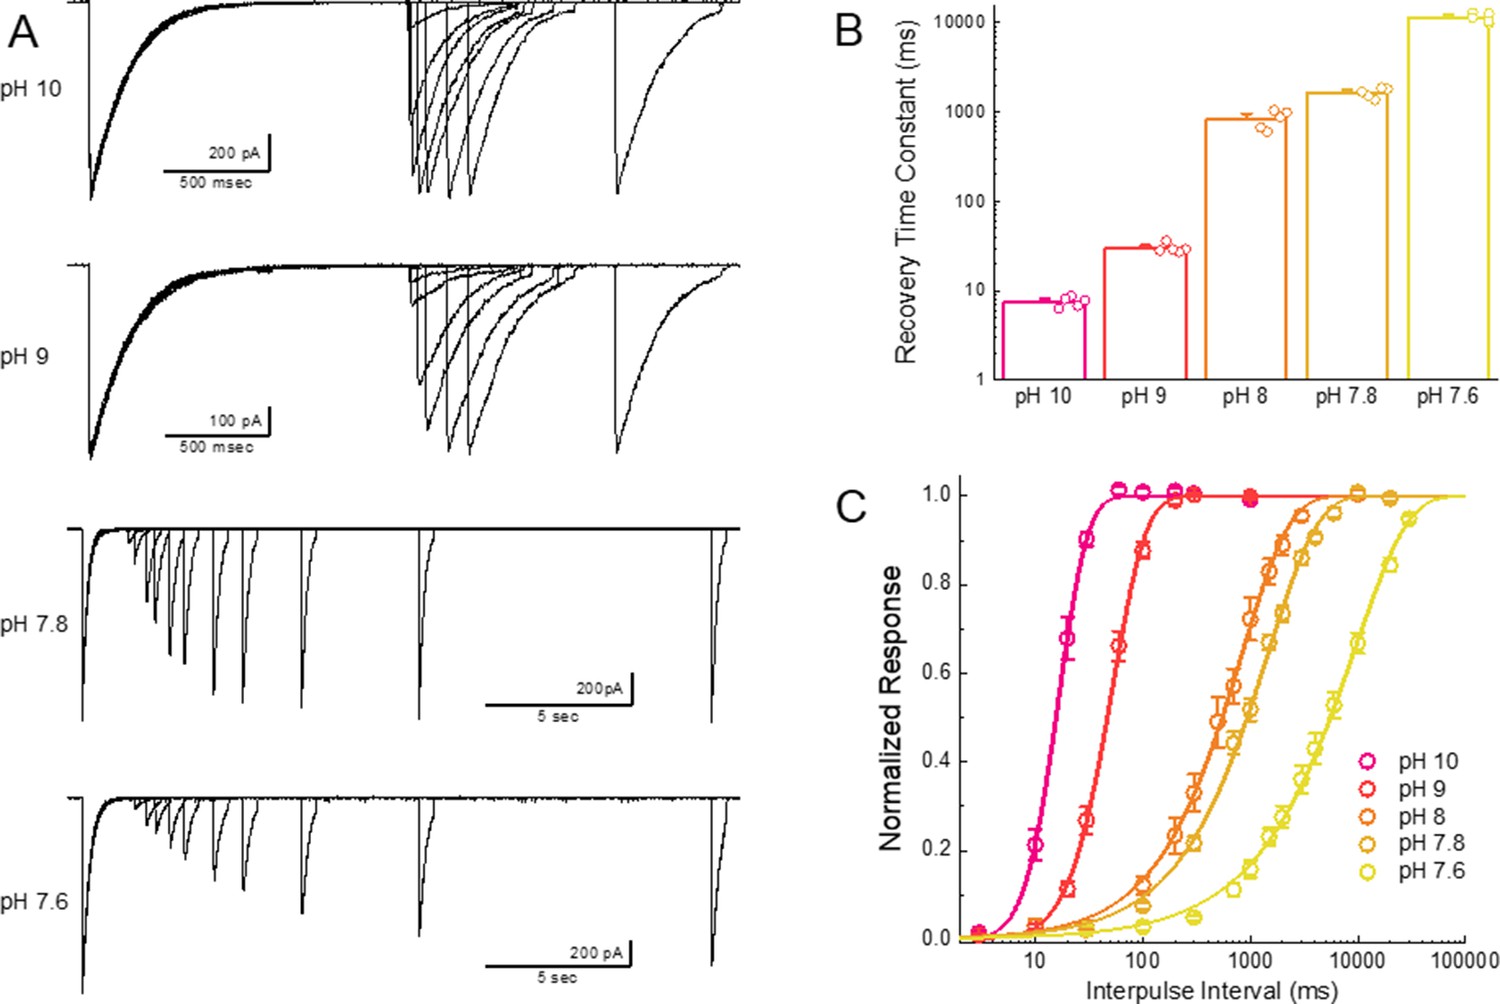
Recovery is accelerated by alkaline inter-pulse pH values.
(A) Representative recordings of cASIC1 wild type during recovery from desensitization protocols using the indicated inter pulse pH. Note the changing time bases. (B) Summary of recovery time constants for all patches at various inter pulse pH values. (C) Average recovery from desensitization curves for all patches from panel B). The error bars are S.E.M. and the circles are individual patches.
Figure 3—figure supplement 3
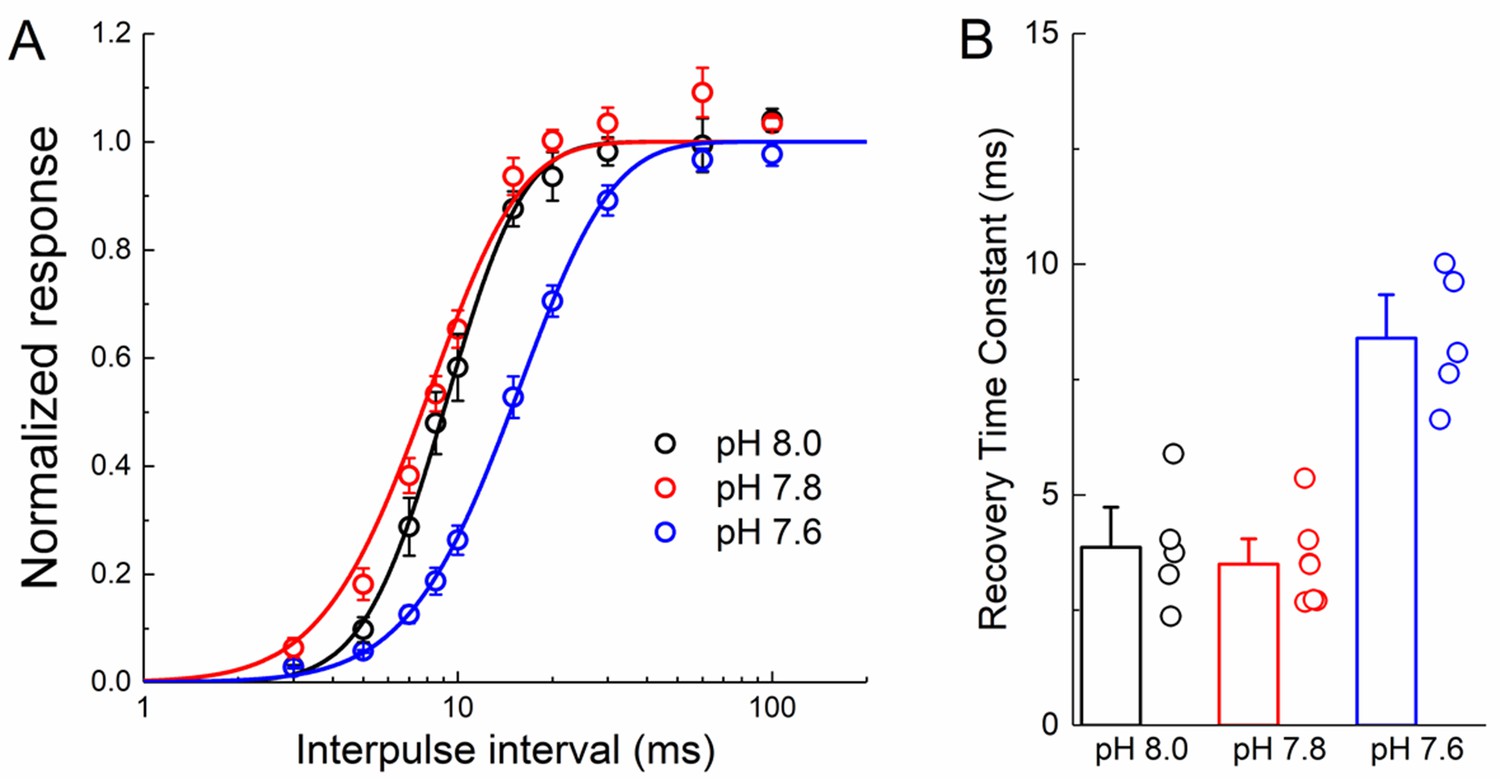
L414A recovery from desensitization has reduced pH-dependence.
(A) Average recovery from desensitization curves for L414A patches at the indicated interpulse pH. (B) Summary of recovery time constants for all patches at various inter pulse pH values. The error bars are S.E.M. and the circles are individual patches.
Figure 4 with 1 supplement
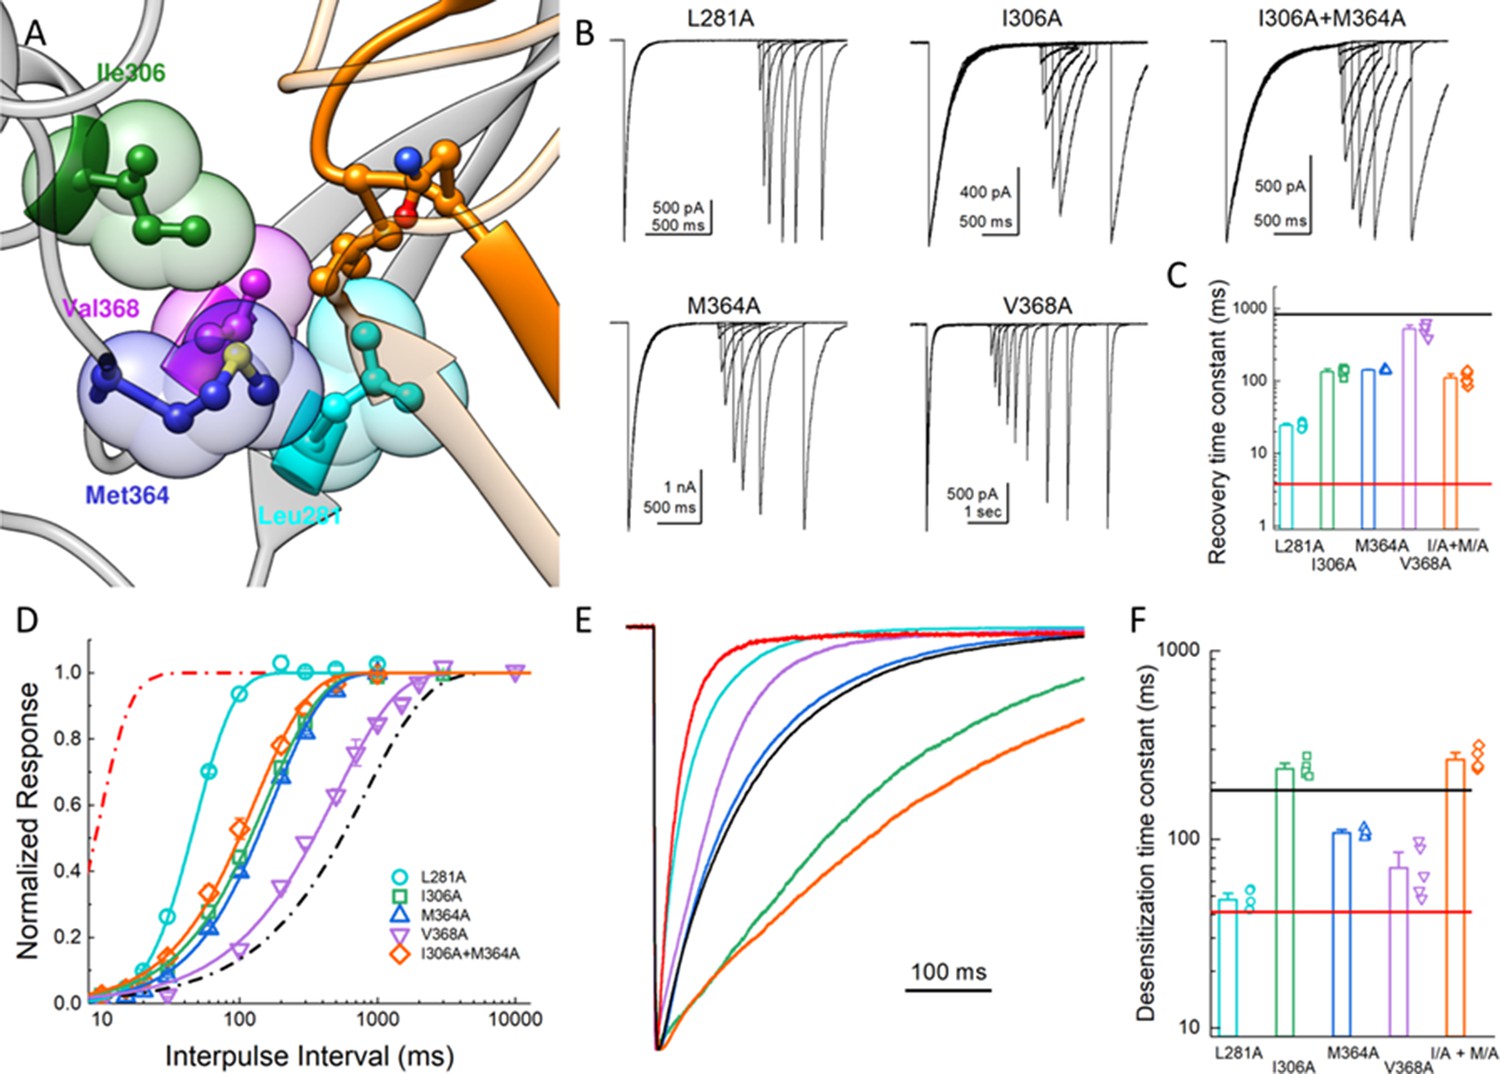
Hydrophobic patch influences the kinetics of desensitization and recovery.
(A) Structure of the low-pH desensitized state (PDB:4NYK). The β11–12 linker is shown in orange. The adjacent subunit is depicted in gray with hydrophobic residues poised to interact with Leu414 shown in individual colors as ball and stick and partially transparent spheres. (B) Representative recordings of paired pulse protocols for Ala substitutions in the hydrophobic patch. (C) Summary of recovery time constants from all patches for each mutant. The black and red lines illustrate the time constants for wild type and L414A, respectively. (D) Summary of recovery curves as a function of inter pulse interval for each mutant. (E) Representative traces showing the entry into desensitization for each mutation as well as the time constants of entry for all patches (F). The solid lines show the time constants for wild type (black) and L414A (red). The error bars are S.E.M. and the circles are individual patches.
Figure 4—figure supplement 1
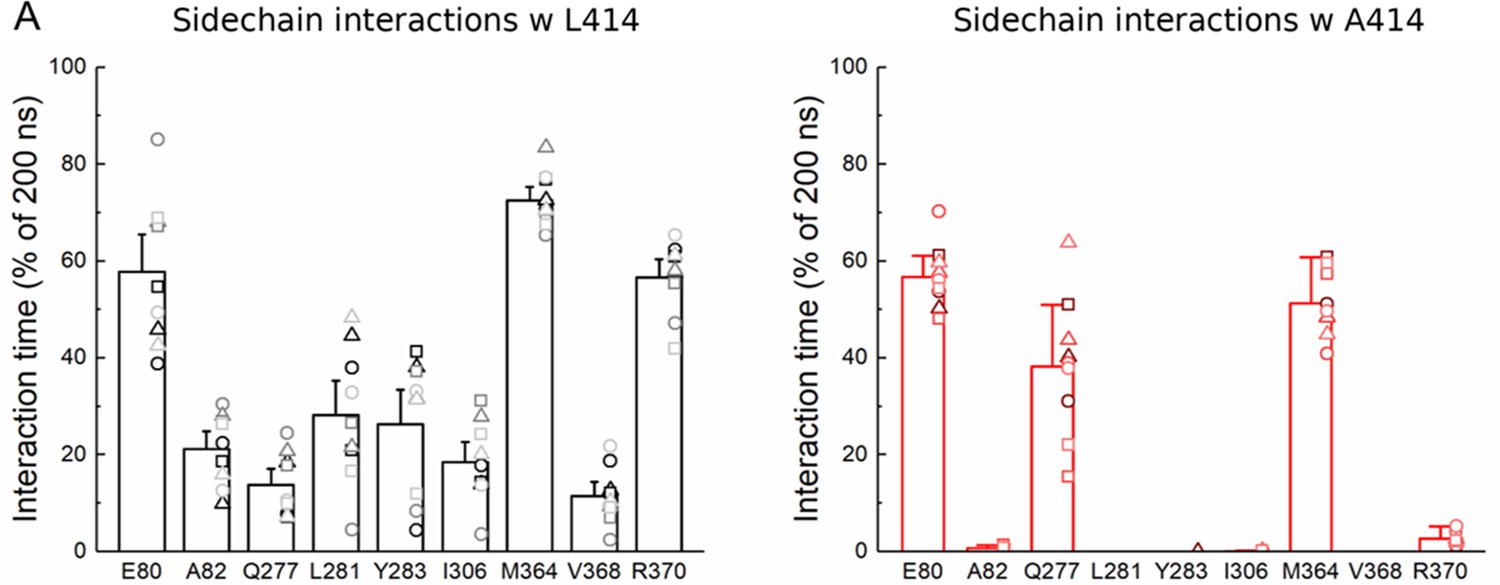
L414A reduces interactions with adjacent residues.
(A) Percentage of time the indicated residue is within 4 Å of the Leu414 (left) or Ala414 (right) side chain (hydrogen atoms omitted). Each molecular dynamics simulation run is represented as a specific symbol (circle, square or triangle) while each chain is indicated by color.
Figure 5 with 1 supplement
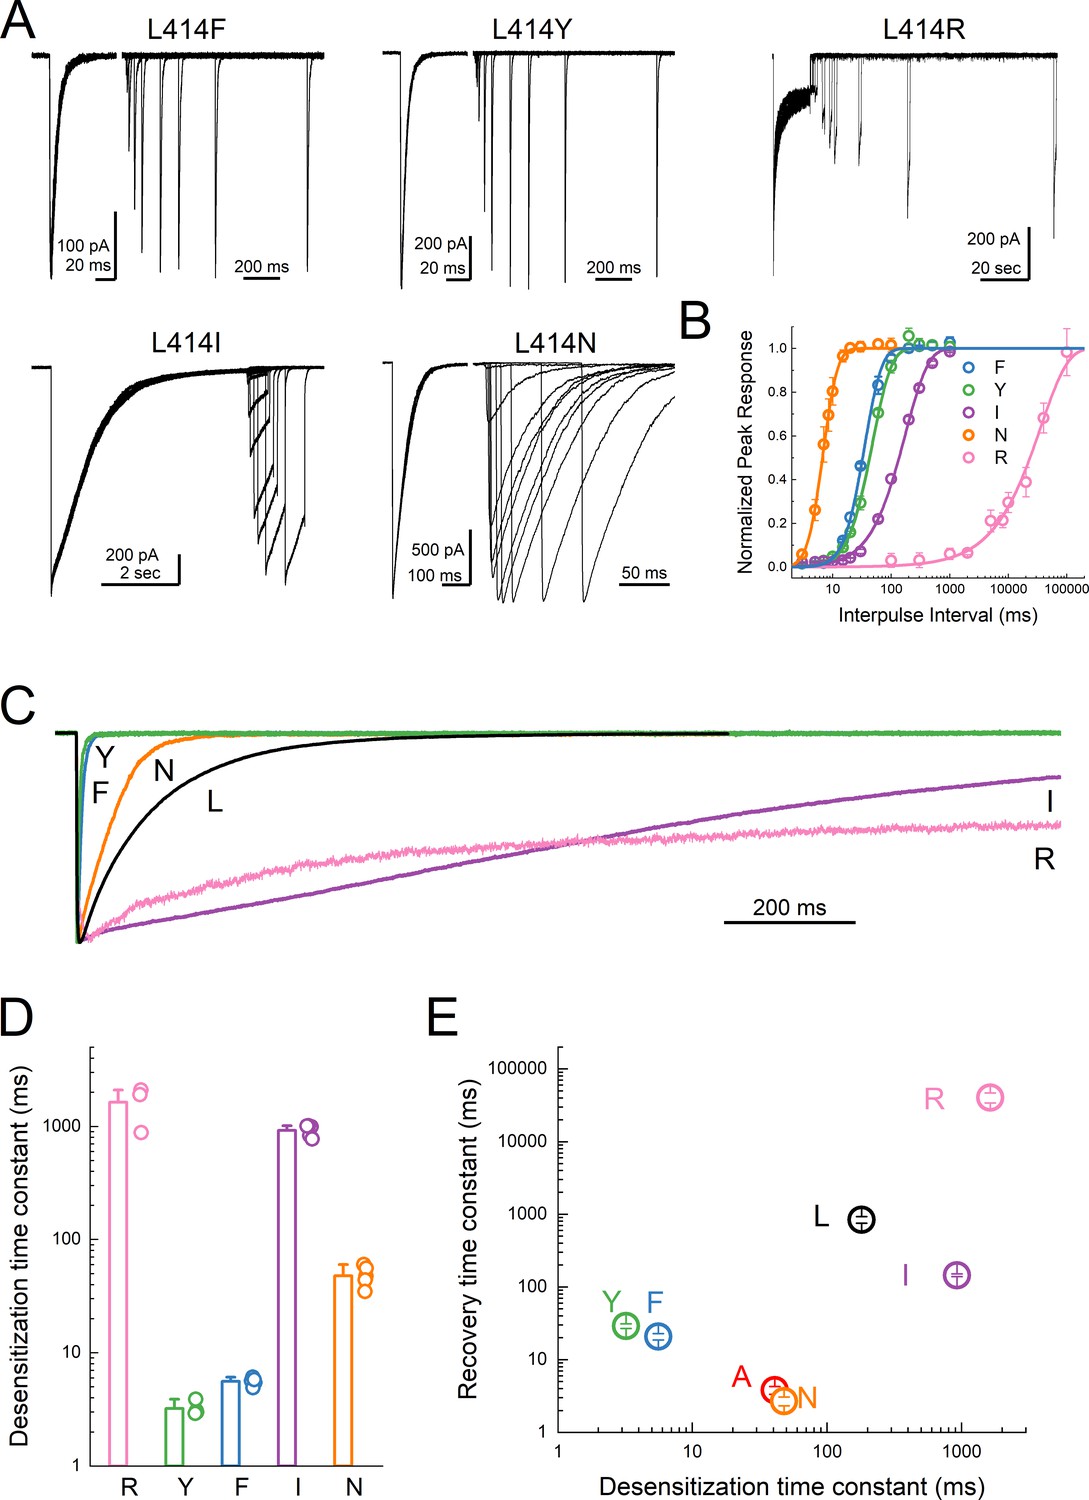
Substitutions at the Leu414 position produce a wide range of desensitization kinetics.
(A) Representative recordings of recovery from desensitization protocols for a range of Leu414 substitutions. Note that for L414F, L414Y and L414N, the x axis has been broken into two different time scales (B) Summary of recovery as a function of inter pulse interval for all mutations. (C) Example traces of desensitization kinetics for the mutant panel. (D) Summary of desensitization time constants across all patches. The error bars are S.E.M. and the circles are individual patches. (E) Log-log scatter plot of the desensitization time constant and the recovery time constant for each mutation. Note that large side chains, ie. R, F or Y, can produce either very fast or very slow kinetics.
Figure 5—figure supplement 1
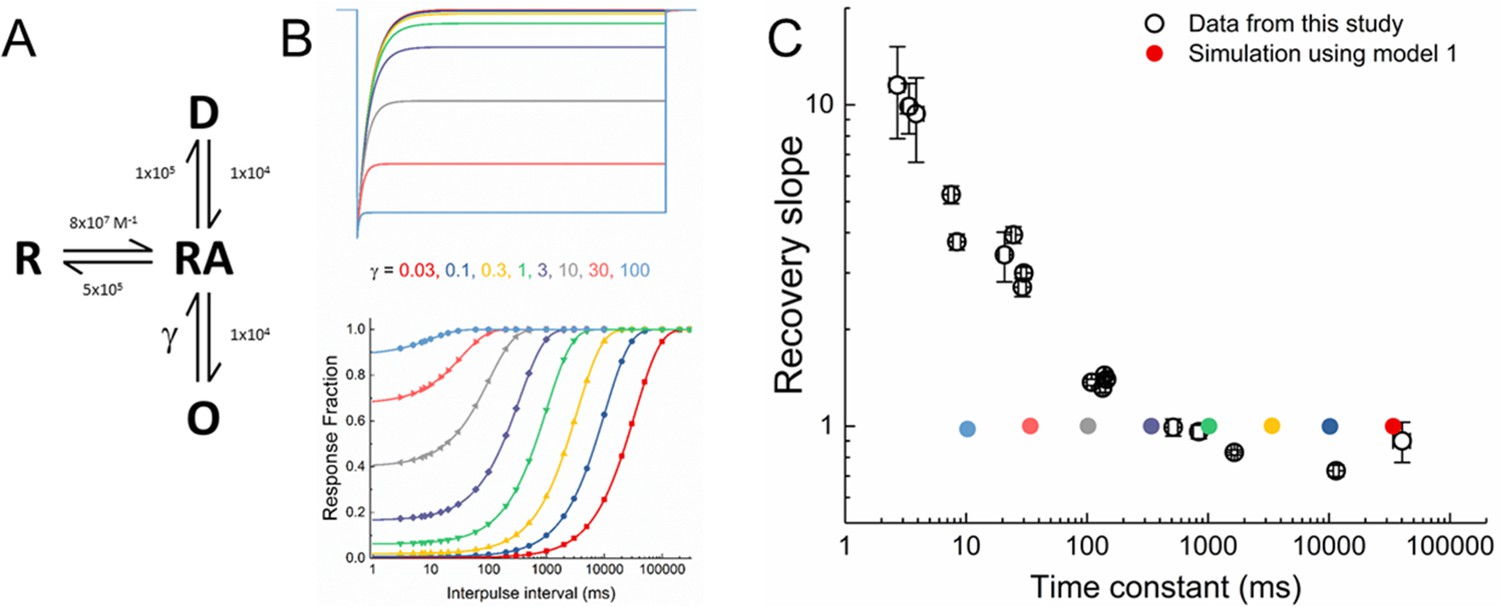
Simple kinetic model cannot recapitulate ASIC gating.
(A) Four-state kinetic model with rate constants indicated (units are s−1). (B) Outputs of simple kinetic model 1 in response to a 10 µM agonist application (ie. pH 5, upper) or recovery from desensitization protocol (lower) over a range of γ values as indicated by the corresponding colors. (C) Scatter plot time constants (abscissa) and slopes (ordinate) from recovery fit for all mutants in this study (open circles) and simulations from panel B (filled circles).
Figure 6 with 1 supplement
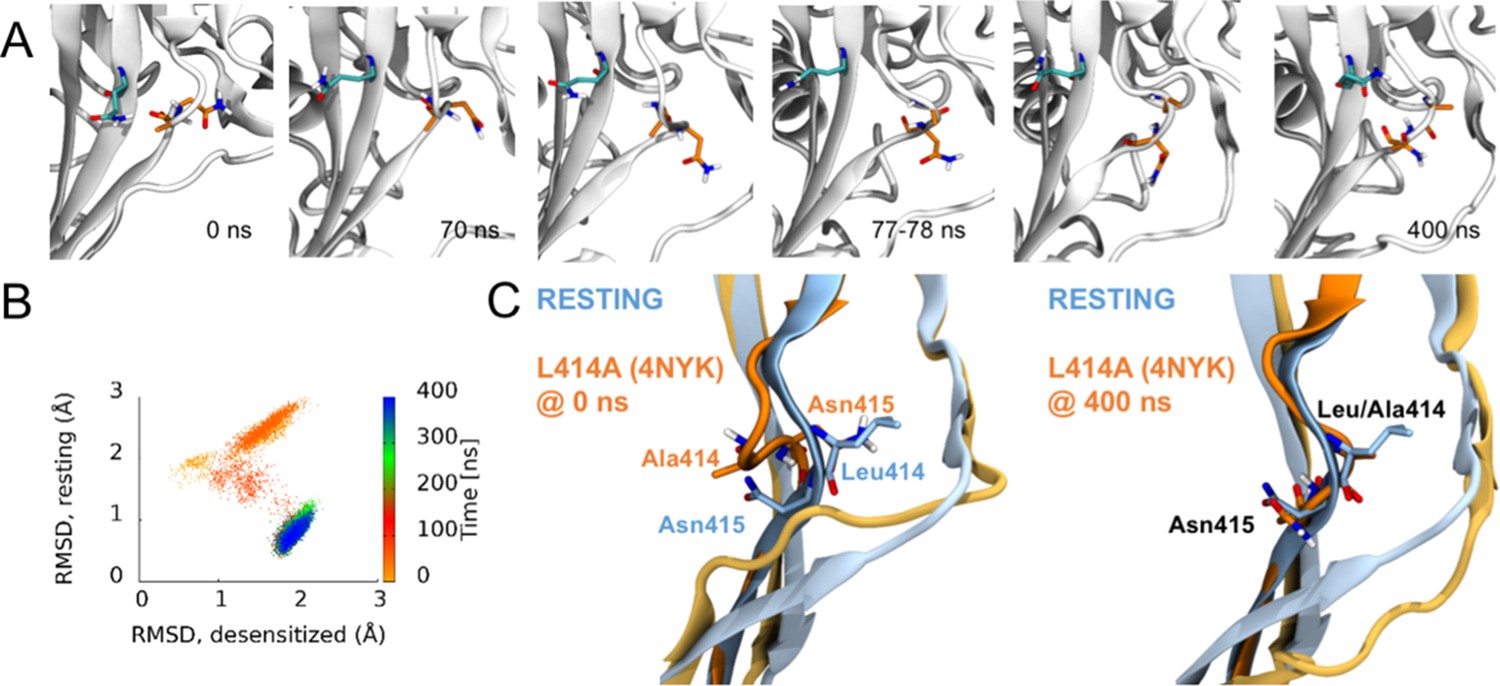
Side chains of 414 and 415 tend to flip along an outward path upon deprotonation of acidic residues.
(A) Snapshots of chain C from repeat c at the indicated time points. A414 and N415 are shown in orange while Q277 is drawn in teal. (B) Calculated Cα RMSD values for amino acid residues 409–420 compared to the desensitized state (x axis) and resting state (y axis) for chain C from repeat c. The dots are colored according to simulation time as illustrated on the right-hand color bar. (D) Structural alignments of initial (left) and final (right) chain C from repeat c positions (orange) compared to resting (blue) state.
Figure 6—figure supplement 1
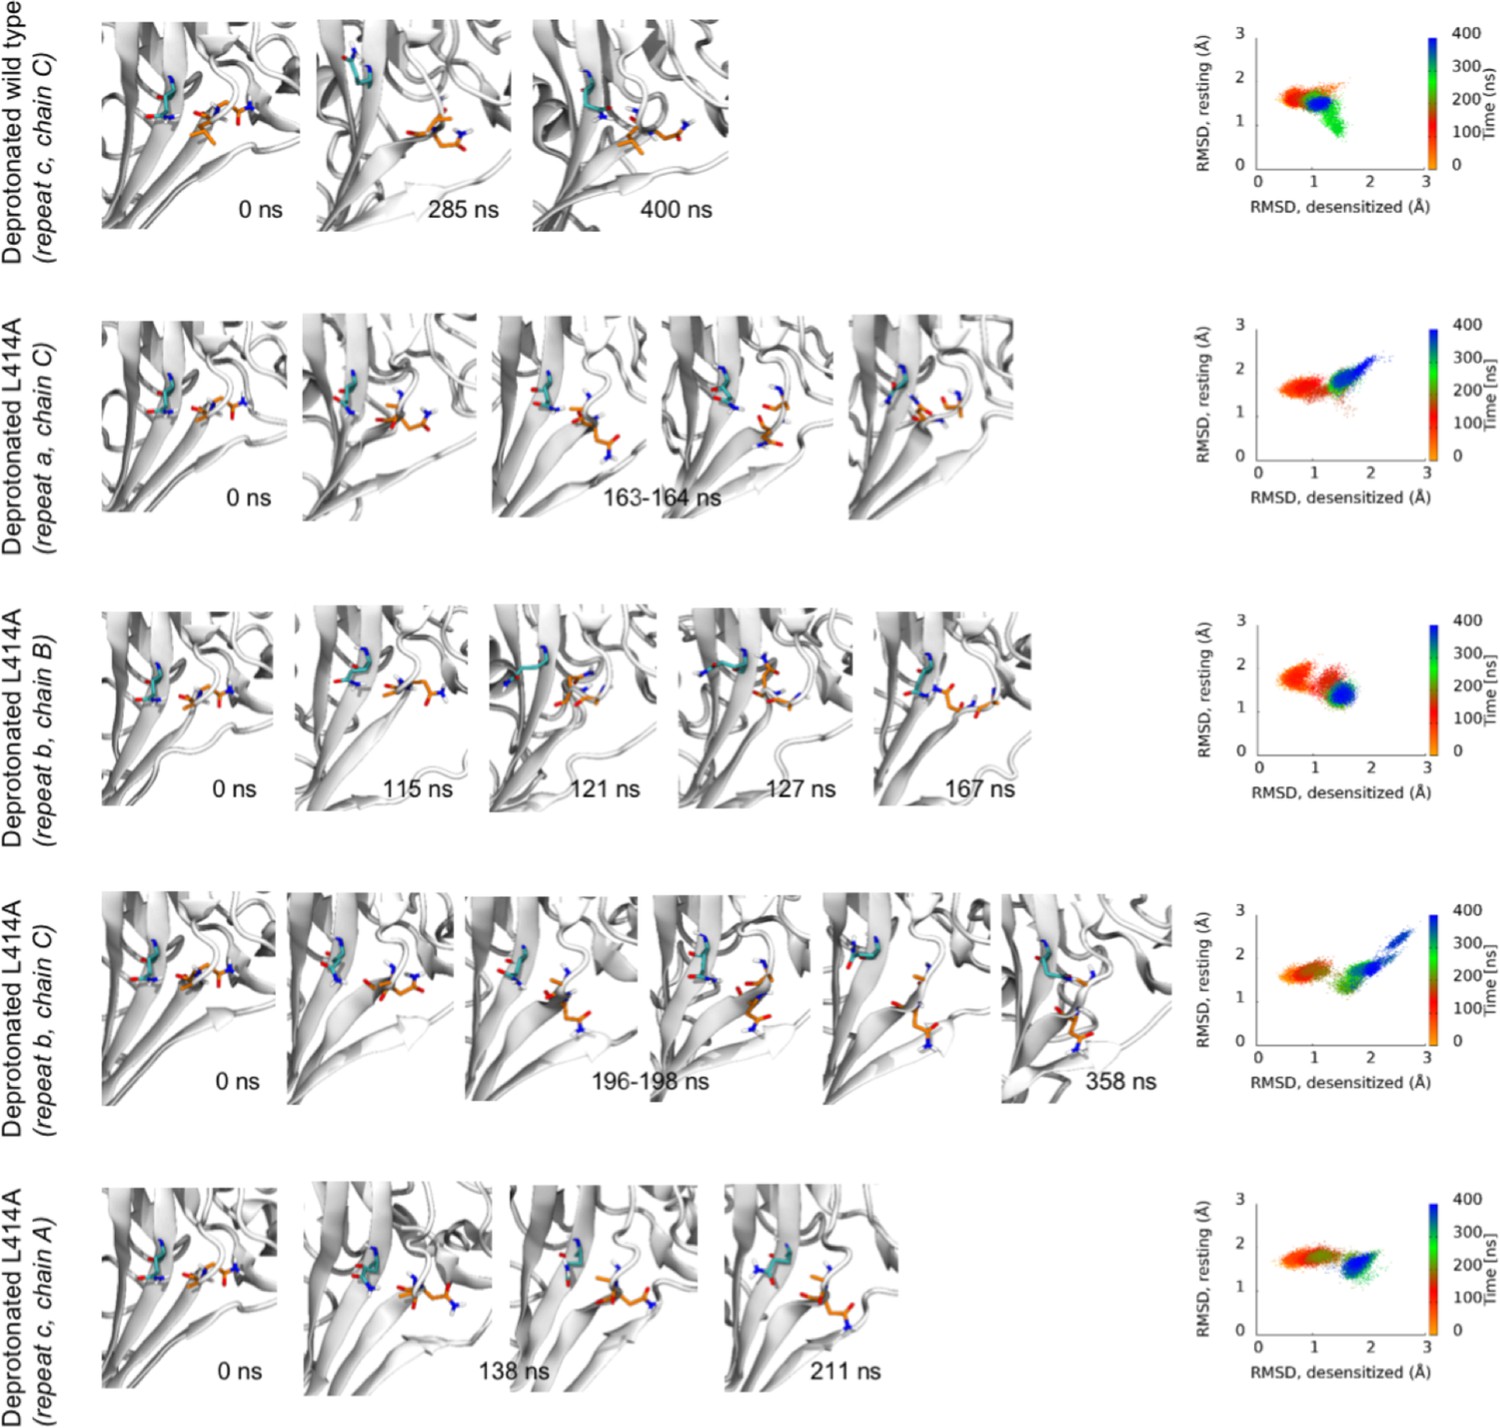
Transitions from desensitized to resting-like states upon deprotonation.
(left) Each row contains structural snapshots from the indicated time points and simulations. L/A414 and N415 are shown in orange while Q277 is drawn in teal. (right) Calculated Cα RMSD values for amino acid residues 409–420 compared to the desensitized state (x axis) and resting state (y axis) for the indicated chain and repeat.
Figure 7 with 1 supplement
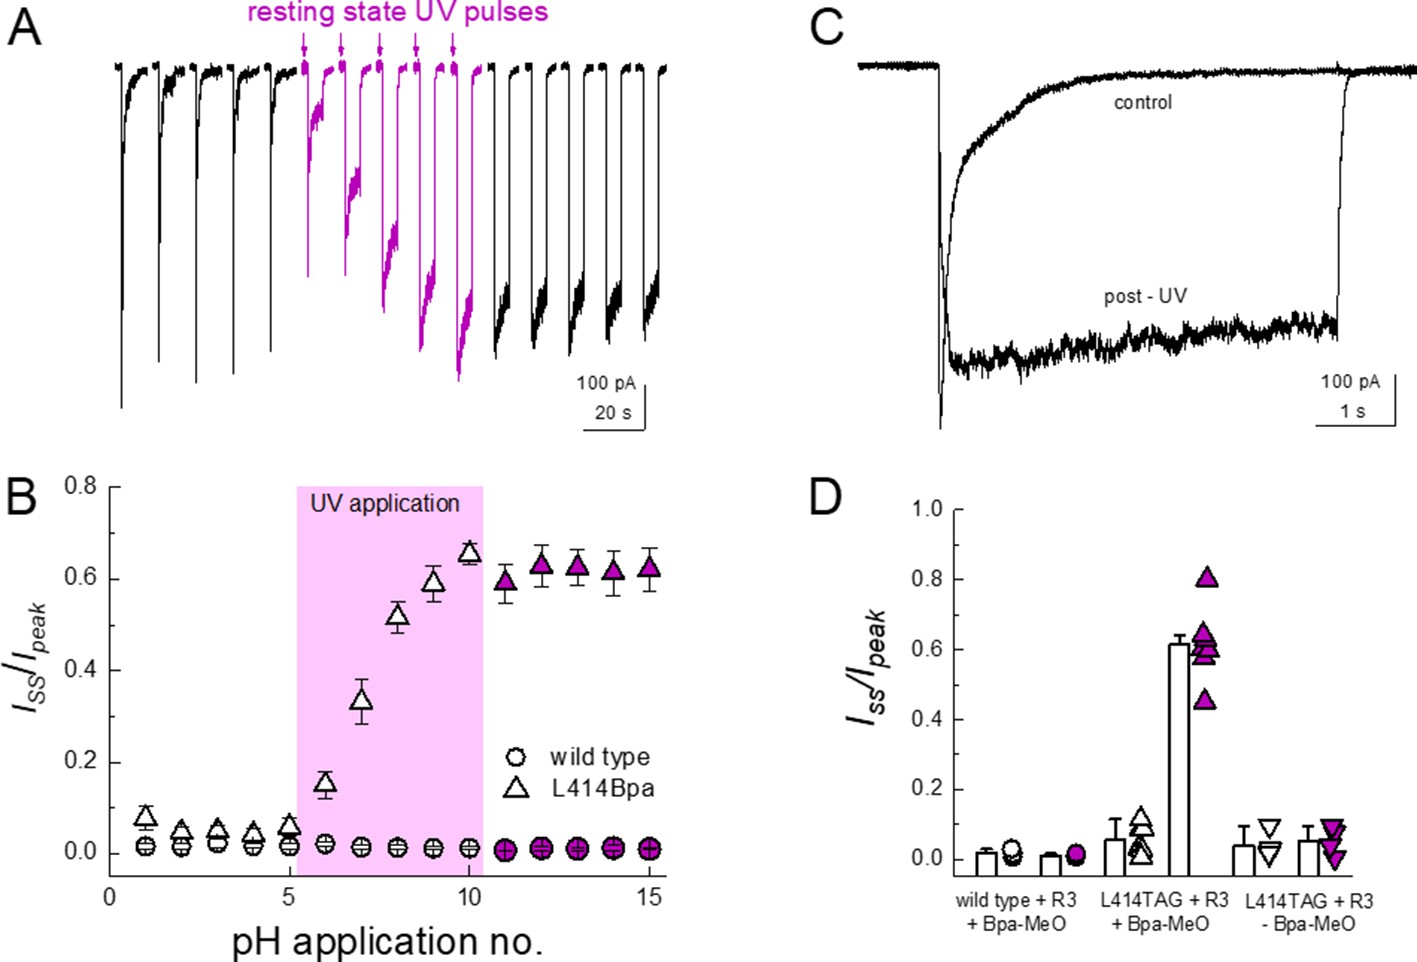
Resting state UV application suppresses the desensitization of L414Bpa.
(A) Representative whole cell recording of cells transfected with L414TAG plus R3 and YAM and supplemented with MeO-Bpa and responding to pH 5 application. Following five pH 5 applications, high-power UV light is pulsed while the channels are in the resting state for additional pH 5 applications (purple traces) followed by applications without UV. (B) Summary of steady state current divided by peak current during pH 5 application before, during and after UV for L414Bpa (triangles) or wild type (circles). (C) Example responses from the same cell as A), before and after UV application. (D) Summary of steady state current divided by peak during pH 5 application for wild-type patches with MeO-Bpa (circles), L414TAG with MeO-Bpa (upward triangles), or L414TAG without MeO-Bpa (downward triangles).
Figure 7—figure supplement 1
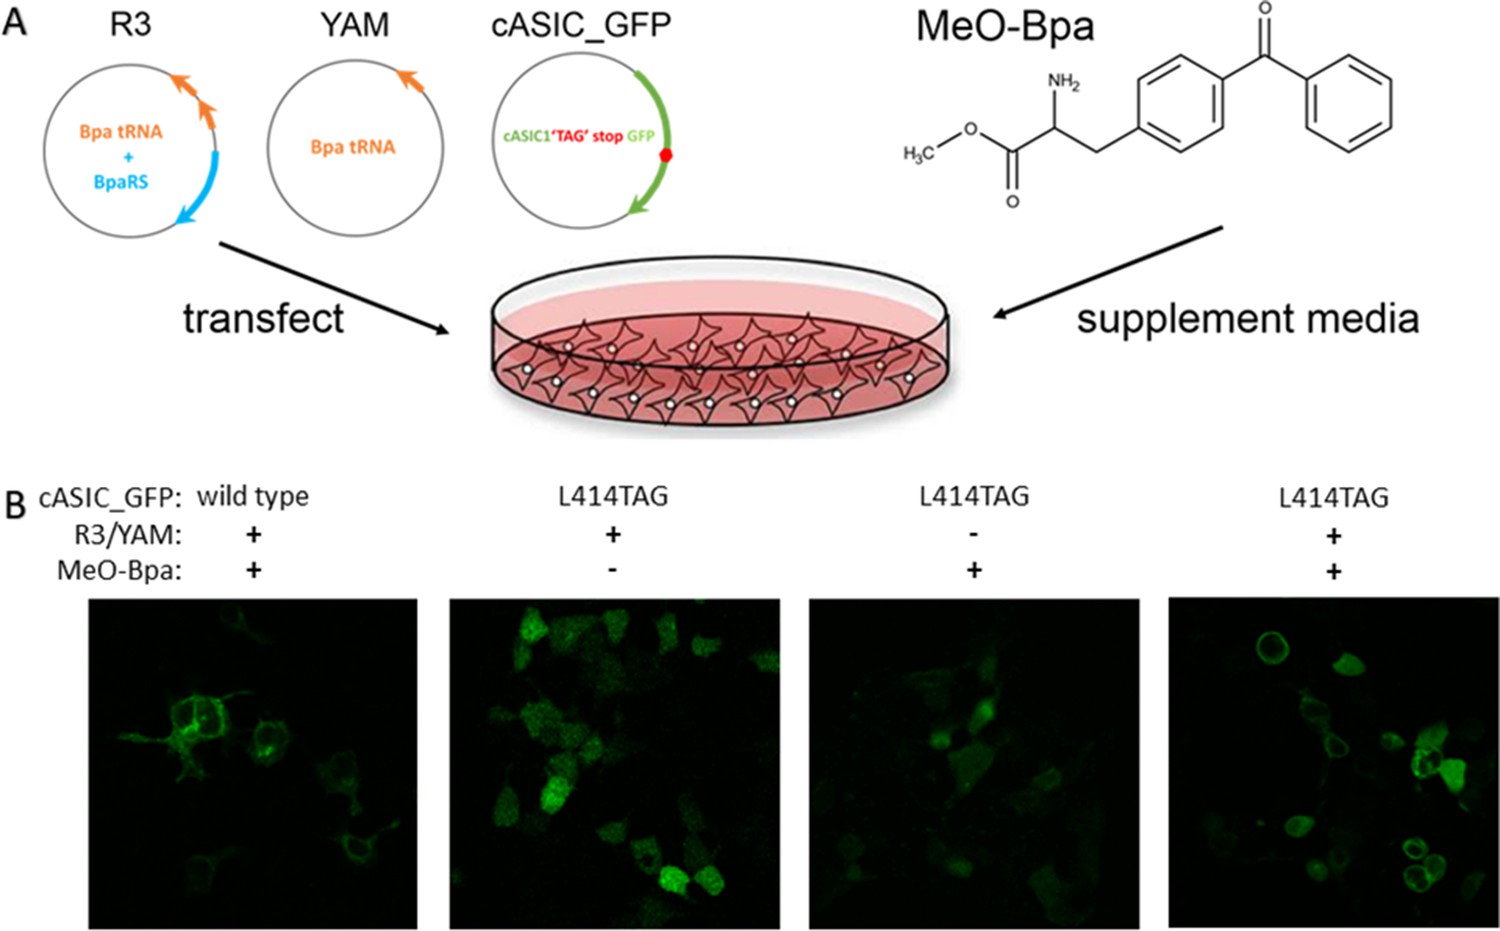
Schematic of non-canonical amino acid incorporation.
(A) Schematic of constructs and chemicals used for ncAA incorporation into mammalian cells. (B) Example confocal images of GFP fluorescence from wild type or L414TAG ASIC conjugated to GFP with or without R3/YAM transfected and MeO-Bpa supplied.
Figure 8
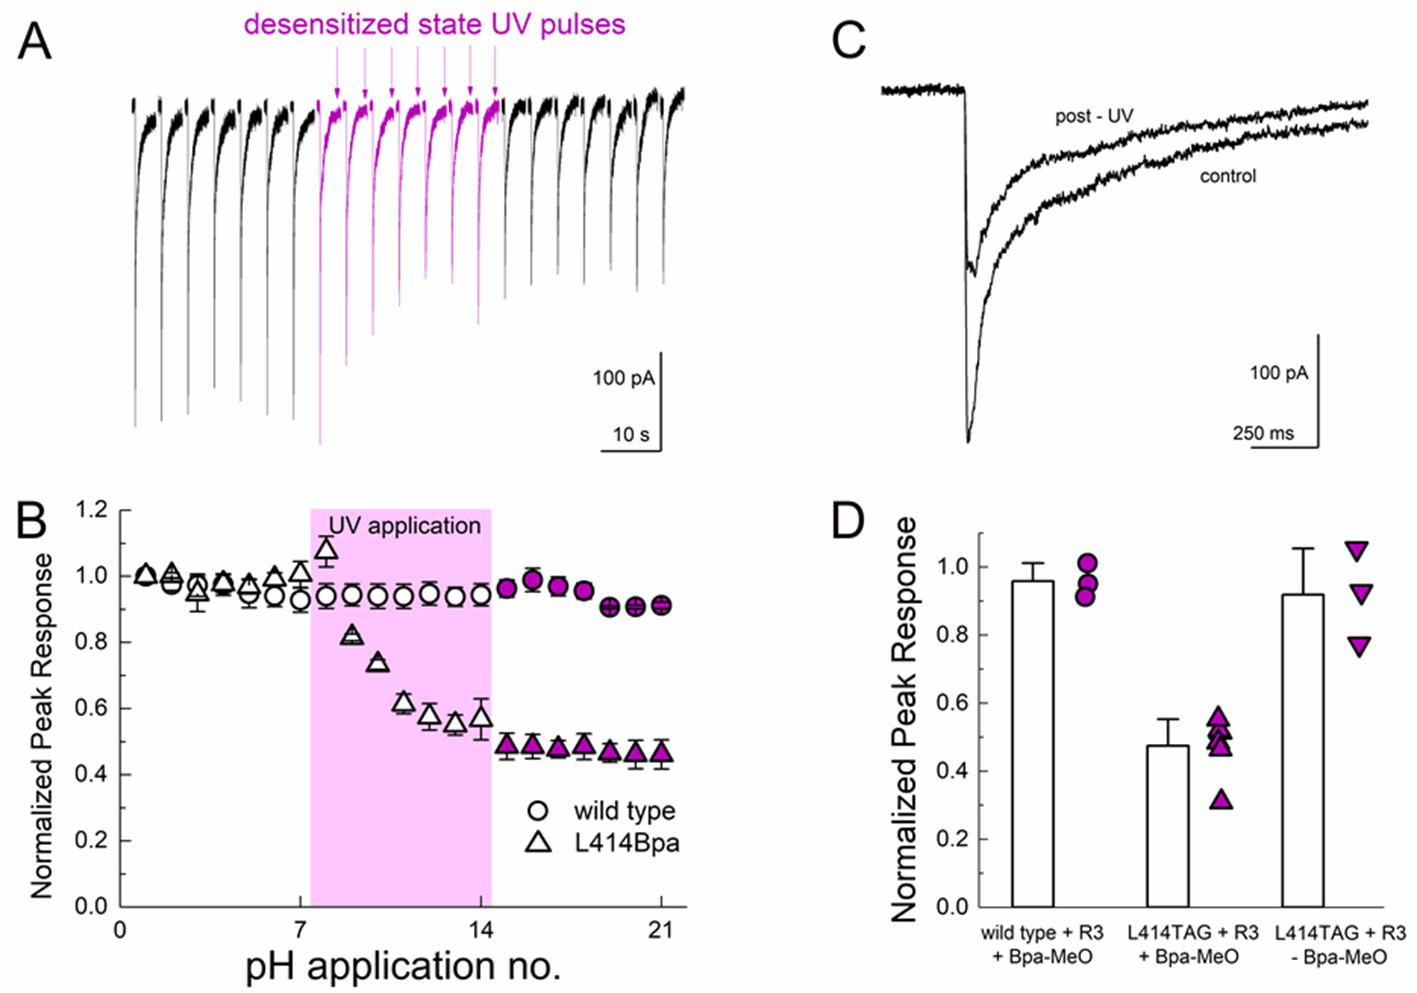
Desensitized state UV application inhibits L414Bpa peak responses.
(A) Representative whole cell recording of cells transfected with L414TAG plus R3 and YAM and supplemented with MeO-Bpa and responding to pH 5 application. At the end of the eighth pH 5 application, UV light is pulsed while the channels are in the desensitized state. UV trains are applied for seven consecutive pH 5 applications (purple traces) followed by applications without UV. (B) Summary of normalized peak currents evoked during pH 5 application before, during and after UV for L414Bpa (triangles) or wild type (circles). (C) Example responses from the same cell as A), before and after UV application. (D) Summary of normalized peak responses for wild type cells with MeO-Bpa (circles), L414TAG with MeO-Bpa (upward triangles), or L414TAG without MeO-Bpa (downward triangles).
Figure 9
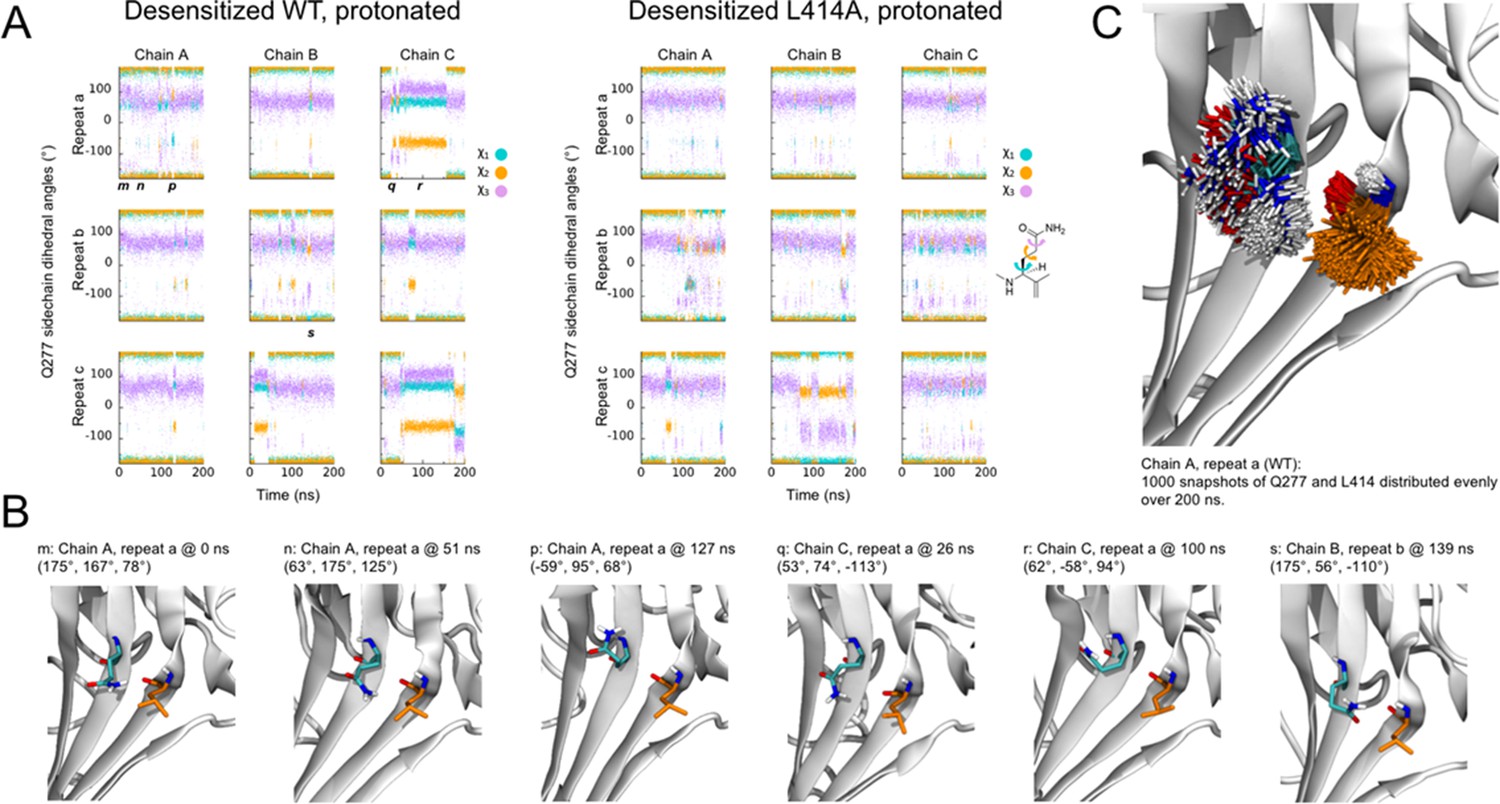
Flexibility of Gln277 residue.
(A) Dihedral angles for the Gln277 side chain from wild type (left) and L414A (right) simulations under protonated (i.e. desensitized) conditions. (B) Snapshots at the indicated time points from wild-type simulations to illustrate various side chain configurations. (C) Overlay of side chain positions from the indicated simulation. Gln277 is shown in teal, Leu414 in orange.
Videos
Video 1
Animation illustrating the β11–12 linker flip.
Only the simulation period 50–90 ns is included. A414 and N415 are shown in licorice with orange carbon atoms. The hydrophobic patch (Leu281, Ile306, M364 and V368) on the neighboring chain, as well as Q277 on the same chain (behind A414 and N415), are illustrated in licorice with gray carbon atoms and transparent surface representation.
Tables
Key resources table
| Reagent type (species) or resource | Designation | Source or reference | Identifiers | Additional information |
|---|---|---|---|---|
| Cell line | HEK293T | ATCC | CRL-3216 | |
| Recombinant DNA reagent | pcDNA3.1+-cASIC1 | Gifted from Dr. Vasanthi Jayaraman PMID: 24196950 | ||
| Recombinant DNA reagent | pcDNA3.1+-codon-optimized-cASIC1_GFP | This paper | cASIC1 codon-optimized for mammalian expression tagged with C-terminal GFP | |
| Recombinant DNA reagent | Codon-optimized-cASIC1_GFP | Integrated DNA Technologies | Linear fragment used in assembly of pcDNA3.1+-codon-optimized-cASIC1_GFP via NEBuilder | |
| Recombinant DNA reagent | R3 plasmid | Custom gene synthesis | Contains 2 copies of Bpa tRNA and one Bpa tRNA synthetase (BpaRS) based on PMID: 17993461 | |
| Recombinant DNA reagent | YAM Bpa tRNA | Gifted from Dr. Vasanthi Jayaraman | Contains 1 copy of Bpa tRNA | |
| Commercial assay or kit | Q5 Hot Start High-Fidelity 2X Master Mix | New England Biolabs, inc | M0494L | PCR |
| Commercial assay or kit | KLD Enzyme Mix | New England Biolabs, inc | M0554S | Mutagenesis ligation |
| Commercial assay or kit | NEBuilder HiFi DNA Assembly Master mix | New England Biolabs, inc | E2621L | Assembly of codon-optimized cASIC1_GFP |
| Chemical compound, drug | Polyethylenimine 25 k | Polysciences, Inc | 23966–1 | Transfection reagent |
| Chemical compound, drug | jetPRIME | Polyplus Transfections | 114–15 | Transfection reagent |
| Chemical compound, drug | Benzylphenylalanine methyl ester (MeO-Bpa) | Parent Bpa purchased from Bachem,conjugated to methyl ester by Dr. Chris Ahern | Noncanonical amino acid methyl ester derivative (40 µM) | |
| Sequence-based reagent | cASIC_P250 | This paper | Sequencing primer | CCACAGCCAGGATCCTCCACTCATCG |
| Sequence-based reagent | Codon-optimizedcASIC_P350 | This paper | Sequencing primer | CATTTCTTGGTTGAAAAGG |
| Software, algorithm | PyMOL | RRID:SCR_000305 | Structure modelling | |
| Software, algorithm | UCSF Chimera | RRID:SCR_004097 | Structure modelling, figures | |
| Software, algorithm | GROMACS v 5.0.7 | http://www.gromacs.org/Downloads | RRID:SCR_014565 | Simulations |
| Software, algorithm | Axograph | RRID:SCR_014284 | Patch clamp acquisition | |
| Software, algorithm | Clampfit | Molecular Devices | RRID:SCR_011323 (pClamp) | Patch clamp analysis |
| Software, algorithm | Origin 2018 | OriginLab Corp | Data fitting, figure preparation | |
| Software, algorithm | MATLAB | MathWorks | RRID:SCR_001622 | Recovery from desensitization analysis |
| Software | VMD | https://www.ks.uiuc.edu/Development/Download/download.cgi?PackageName=VMD | RRID:SCR_001820 | Structure analysis, figure preparation, animation |
| Software, algorithm | PROPKA | https://github.com/jensengroup/propka-3.1 | pKa prediction | |
| Software, algorithm | Modeller 9 v 20 | https://salilab.org/modeller/download_installation.html | RRID:SCR_008395 | Protein structure modelling |
| Software, algorithm | CHARMM GUI | http://www.charmm-gui.org/ | Constructing systems for simulation |
Additional files
Download links
A two-part list of links to download the article, or parts of the article, in various formats.
Downloads (link to download the article as PDF)
Open citations (links to open the citations from this article in various online reference manager services)
Cite this article (links to download the citations from this article in formats compatible with various reference manager tools)
β11-12 linker isomerization governs acid-sensing ion channel desensitization and recovery
eLife 9:e51111.
https://doi.org/10.7554/eLife.51111


