Presynaptic GABAB receptors functionally uncouple somatostatin interneurons from the active hippocampal network
- Institute for Integrative Neuroanatomy, Charité - Universitätsmedizin Berlin, Germany
- Centre for Discovery Brain Sciences, University of Edinburgh, United Kingdom
- Institute for Physiology II, Faculty of Medicine, University of Freiburg, Germany
- Institute for Physiology I, Faculty of Medicine, University of Freiburg, Germany
- BIOSS Centre for Biological Signalling Studies, University of Freiburg, Germany
Figures
Figure 1 with 1 supplement
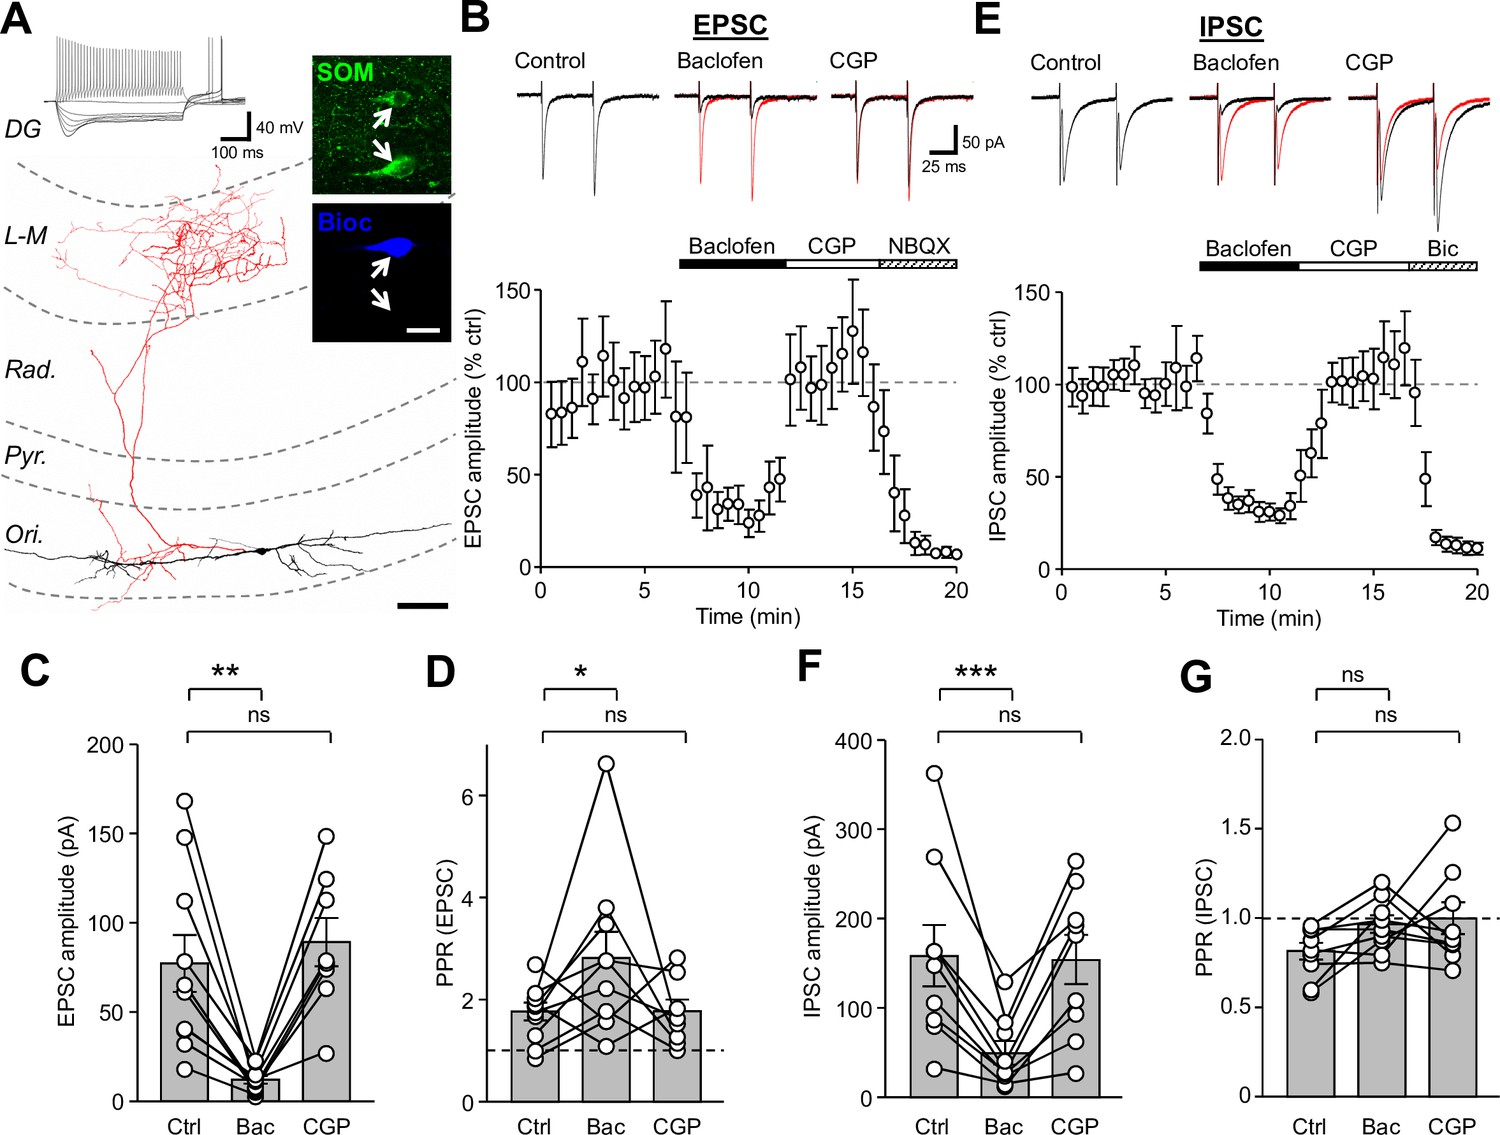
Synaptic inputs onto SOM-INs are strongly inhibited by presynaptic GABABR activation.
(A) A reconstruction of a SOM-IN showing soma and dendrites (black) and axon (red) with respect to the layers of the CA1 area. Inset (top left), intrinsic physiological response to current injections (500 ms duration; −250 pA to 250 pA). Inset (right), immunoreactivity for SOM (green) in the same biocytin-filled cell (bioc, blue). The arrows indicate SOM immunoreactivity in somata of the biocytin-filled (upper) and non-filled (lower) INs. Scale bar: 20 µm. (B, upper) EPSCs elicited in a SOM-IN by alveus stimulation in the presence of 10 µM bicuculline, during control (left), baclofen (10 µM, middle, control traces are overlain in red) and CGP-55,845 (CGP, 5 µM, right) bath application. (B, lower) Time-course plot of the mean EPSC amplitude in 10 SOM-INs during control, and sequential bath application of baclofen, CGP and NBQX (10 µM). (C,D) Summary bar graphs of EPSC amplitudes and PPRs under control conditions (Ctrl) and during baclofen and subsequent CGP application from 9 SOM-INs. (E) Monosynaptic IPSCs evoked by stimulation of str. oriens in the presence of NBQX and APV (50 µM, top) and time-course plot of the mean IPSC amplitude from 9 SOM-INs (bottom) during control, and sequential bath application of baclofen, CGP and bicuculline (Bic, 10 µM). (F,G) Summary bar graphs of IPSC amplitudes and PPR from 9 SOM-INs. Connected circles correspond to data obtained from a single SOM-IN in the different conditions. Statistics shown: ns – p>0.05, * – p<0.05, ** – p<0.01, *** - p<0.001; all from repeated measures ANOVA with Holm-Sidak post-tests. Abbreviations: Ori - str. oriens, Pyr - str. pyramidale, Rad - str. radiatum, L-M - str. lacunosum-moleculare, DG – dentate gyrus.
Figure 1—figure supplement 1
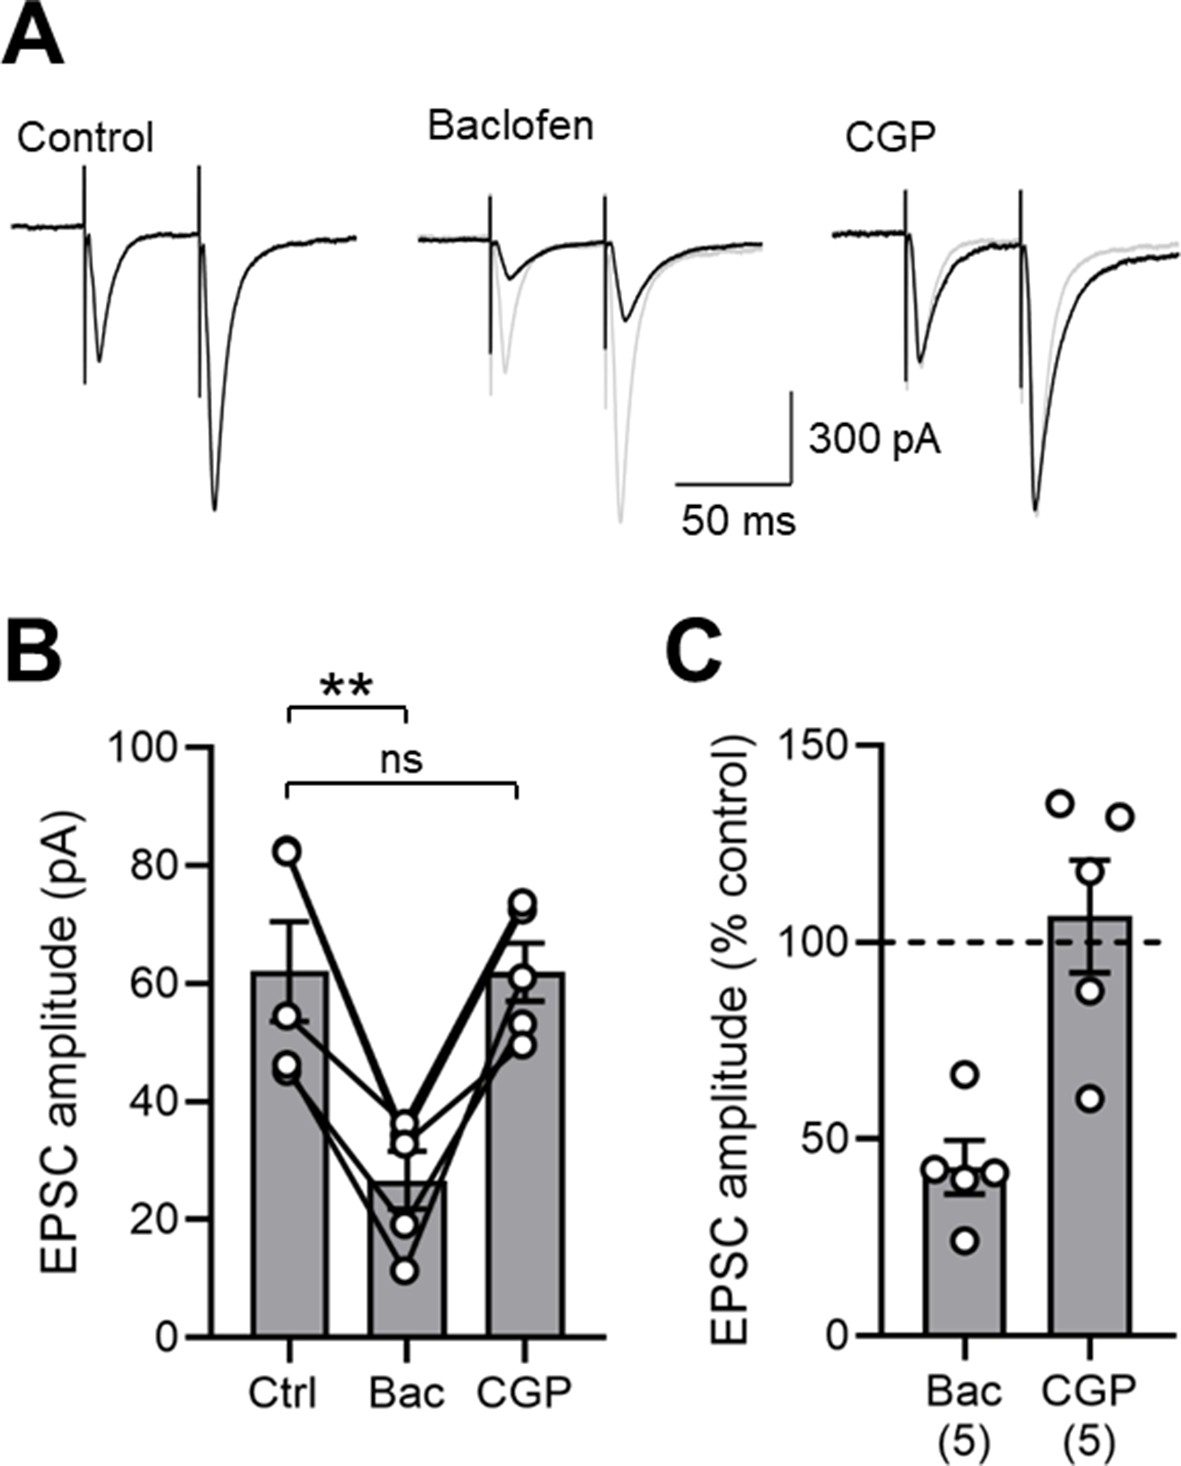
GABABR-mediated inhibition of EPSCs in SOM-INs in the mouse hippocampus.
(A) Representative EPSCs evoked in the presence of 10 µM bicuculline under control conditions, and following sequential baclofen (2 µM) and CGP (5 µM) bath application. (B) Summary bar chart of EPSC amplitudes in 5 mouse SOM-INs under the same pharmacological epochs as in A. Data from individual cells are superimposed as open circles and connected with solid lines. Note the strong and consistent inhibition of EPSC amplitude with baclofen application. (C) Normalized EPSC amplitudes in the presence of baclofen and CGP illustrate the strong inhibition by presynaptic GABABRs. Statistics shown: ns – p>0.05, ** - p<0.01, derived from repeated-measures ANOVA with Holm-Sidak tests.
Figure 2
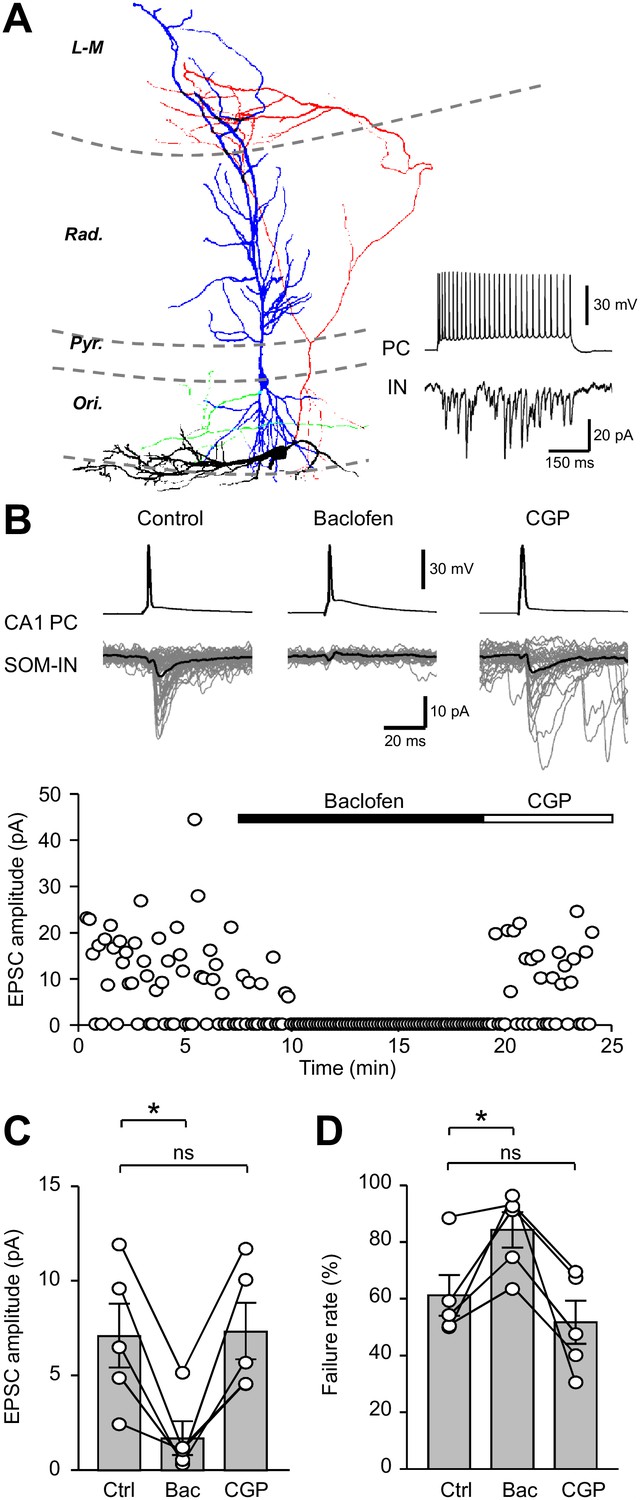
Unitary EPSCs from PCs onto SOM-INs are strongly inhibited by presynaptic GABABRs.
(A) Reconstruction of a synaptically coupled CA1 PC (soma/dendrites in blue, axon in green) and SOM-IN pair (soma/dendrites in black, axon in red). Inset (bottom right) shows a train of APs (upper trace) evoked by a depolarizing current applied to the CA1 PC (500 pA, 500 ms) eliciting a shower of EPSCs in the voltage-clamped SOM-IN (lower trace). (B) Unitary EPSCs in the SOM-IN (average trace: black line; individual traces: gray lines) produced by single APs evoked by short depolarizing current pulses (1 ms, 1–2 nA) in the CA1 PC. Time course of the unitary EPSC amplitude from the same recording under control conditions and during baclofen (2 µM) and CGP (5 µM) application. (C) Summary bar chart of mean EPSC amplitude in 5 CA1 PC/SOM-IN pairs during control conditions (Ctrl), baclofen (Bac) and CGP steady states. (D) Summary data for EPSC failure rate recorded under the same conditions. Connected circles correspond to data obtained from a single PC - SOM-IN pair in the different conditions. Statistics shown: ns – p>0.05, * – p<0.05, ** – p<0.01, *** - p<0.001; all from repeated measures ANOVA with Holm-Sidak post-tests.
Figure 3 with 3 supplements

Localization of the GABAB1 subunit to axon terminals contacting SOM-IN dendrites in str. oriens.
(A) Electron micrograph showing the localization of GABAB1 (6 nm particles) to synaptic membranes, identified by immunoreactivity for CaV2.1 (12 nm), and extrasynaptic membrane of axon terminals of putative excitatory (b1) and inhibitory (b2, b3) neurons making synapses onto a dendrite (DenSOM) of a mouse ChR2-YFP-expressing (18 nm) SOM-IN. (B,C) High magnification views of the boxed areas of the SOM-IN dendrite in (A). Note that there are three other presumed excitatory boutons (b4-6) contacting dendrite of the IN. Abbreviations: P-face, protoplasmic face; E-face, exoplasmic face; cf, cross-fractured face. Scale bars: 200 nm.
Figure 3—figure supplement 1

Subcellular distribution of the GABAB1 subunit in boutons contacting dendritic shafts of oriens-alveus INs in the rat hippocampus as revealed by the SDS-FRL method.
(A) Low-power electron micrograph showing an mGluR1α-immunoreactive dendritic shaft (15 nm immunogold particles on the protoplasmic face/P-face/of the plasma membrane) of a putative SOM-expressing IN (DenSOM; inset in B) which is targeted by boutons (b1, b2; inset in C) immunolabelled for GABAB1 (10 nm). (B,C) High resolution electron micrographs of the boxed P-face (B) and E-face areas (C) of the SOM-IN dendrite in A. (D, E) Double immunolabeling for VGluT1 (12 nm) and GABAB1 (6 nm) revealed that majority of VGluT1+ excitatory (D), bVGluT1+) as well as VGluT1- putative inhibitory (E), bVGluT1-) terminals onto SOM dendrites showed immunoreactivity for GABAB1 (highlighted in red) with higher density in GABAergic boutons. Abbreviations: SyE, postsynaptic density on the E-face of the plasma membrane. Scale bars: 400 nm (A), 200 nm (B–E).
Figure 3—figure supplement 2
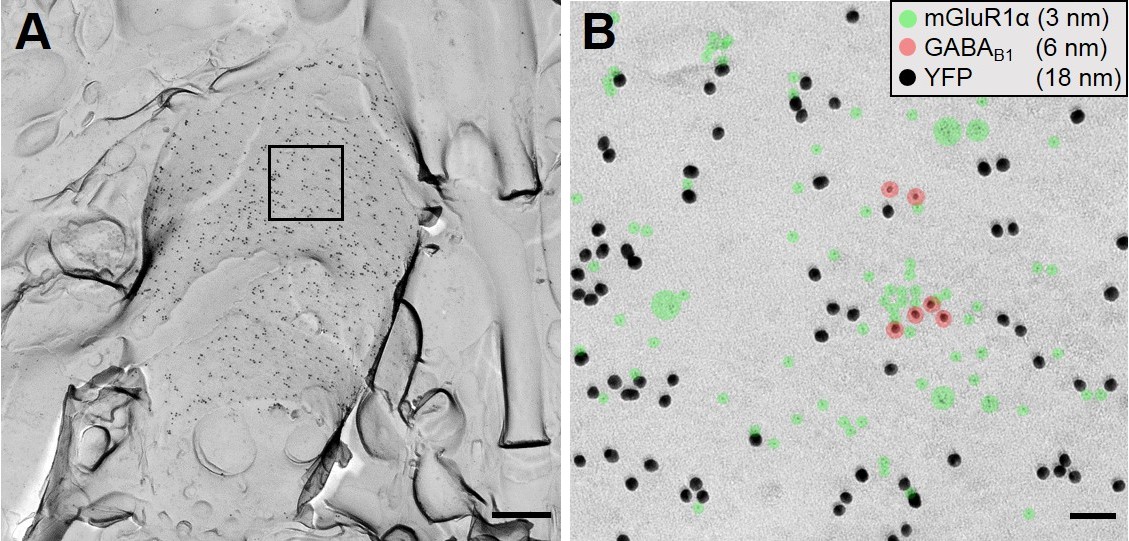
Colocalization of genetically encoded ChR2-YFP with mGluR1α on putative SOM-IN dendrites.
(A) A representative overview image of str. oriens in a SOM-ChR2-YFP mouse, which is densely labelled for YFP (18 nm immunogold). A region of interest on the P-face is indicated by solid lines. (B) The region of interest indicated in A is expanded at high magnification to show colocalization of YFP (18 nm immunogold), with mGluR1α (3 nm, green highlight), and GABAB1 (6 nm, red highlight). Scale bars: 500 nm (A) and 50 nm (B).
Figure 3—figure supplement 3
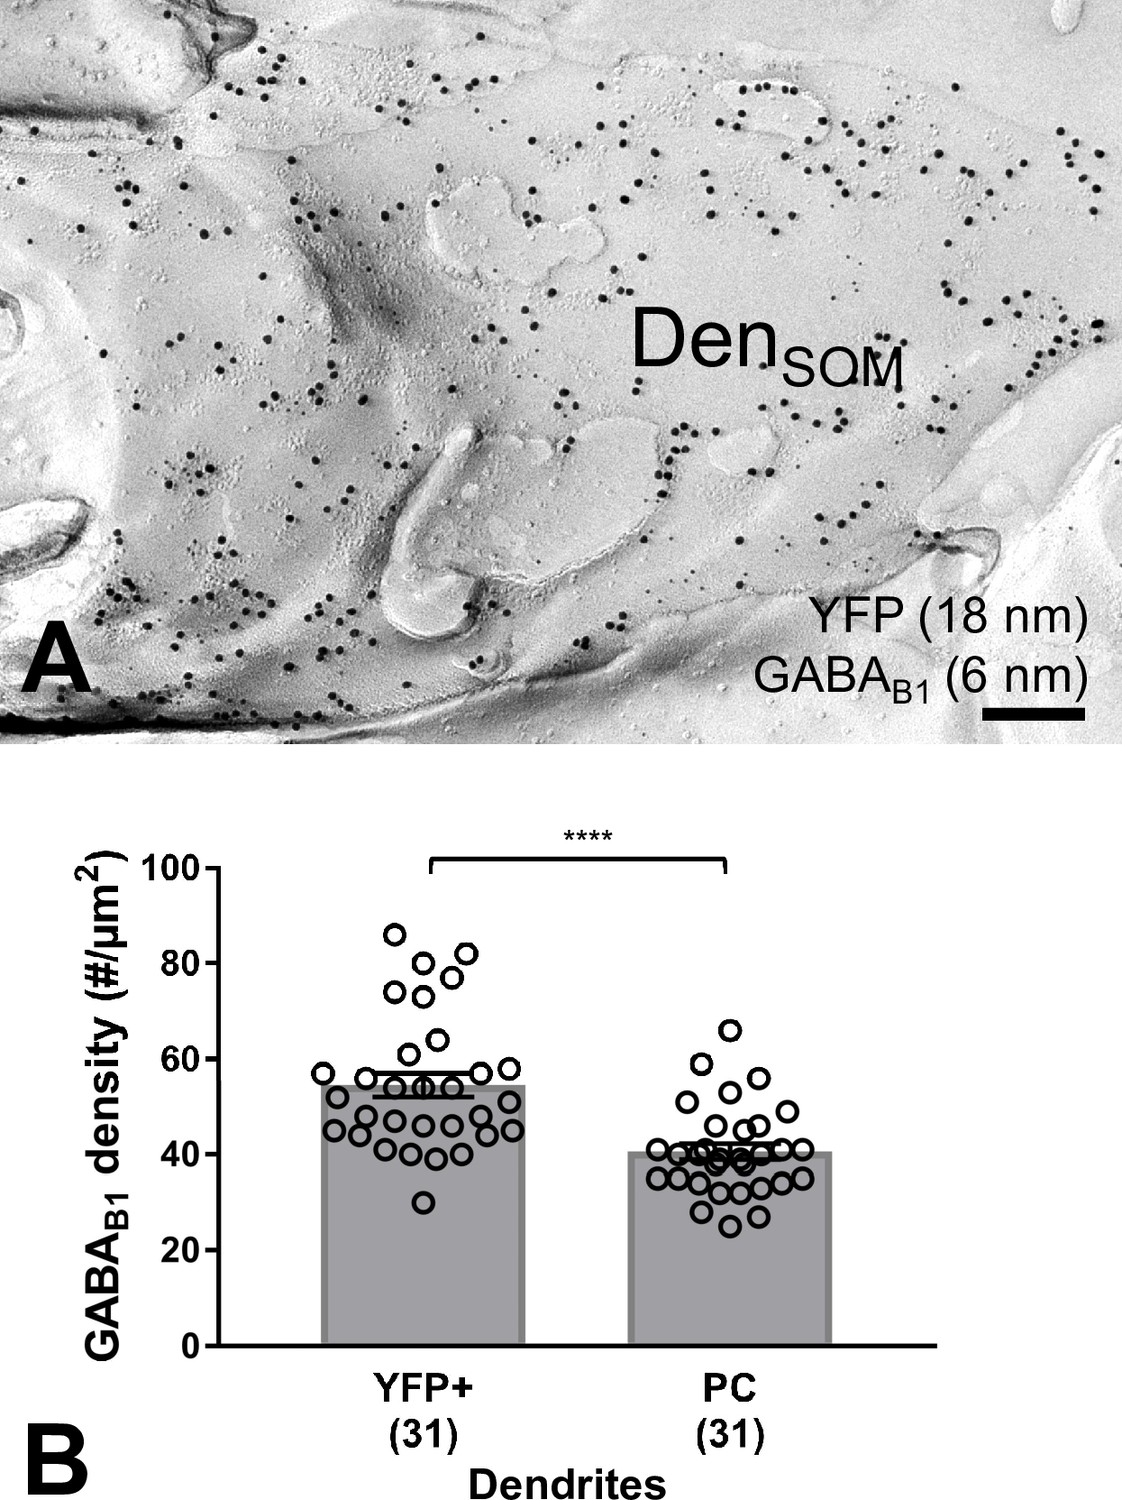
High GABAB1 subunit surface density on YFP-positive dendritic shafts located in str. oriens from SOM-ChR2-YFP mice as revealed by the SDS-FRL method.
(A) Electron micrograph showing a SOM-ChR2-YFP-immunoreactive dendritic shaft (DenSOM), which is immunolabelled for YFP (18 nm immunogold particles) and GABAB1 (6 nm). (B) Summary bar chart demonstrating that the density of GABAB1 is significantly higher on YFP+ dendritic shafts of SOM-INs compared to PC dendrites (****p=0.0001, Mann-Whitney test). Data from individual compartment are shown (open circles) with number of analyzed dendrites in parentheses. Scale bar: 200 nm.
Figure 4
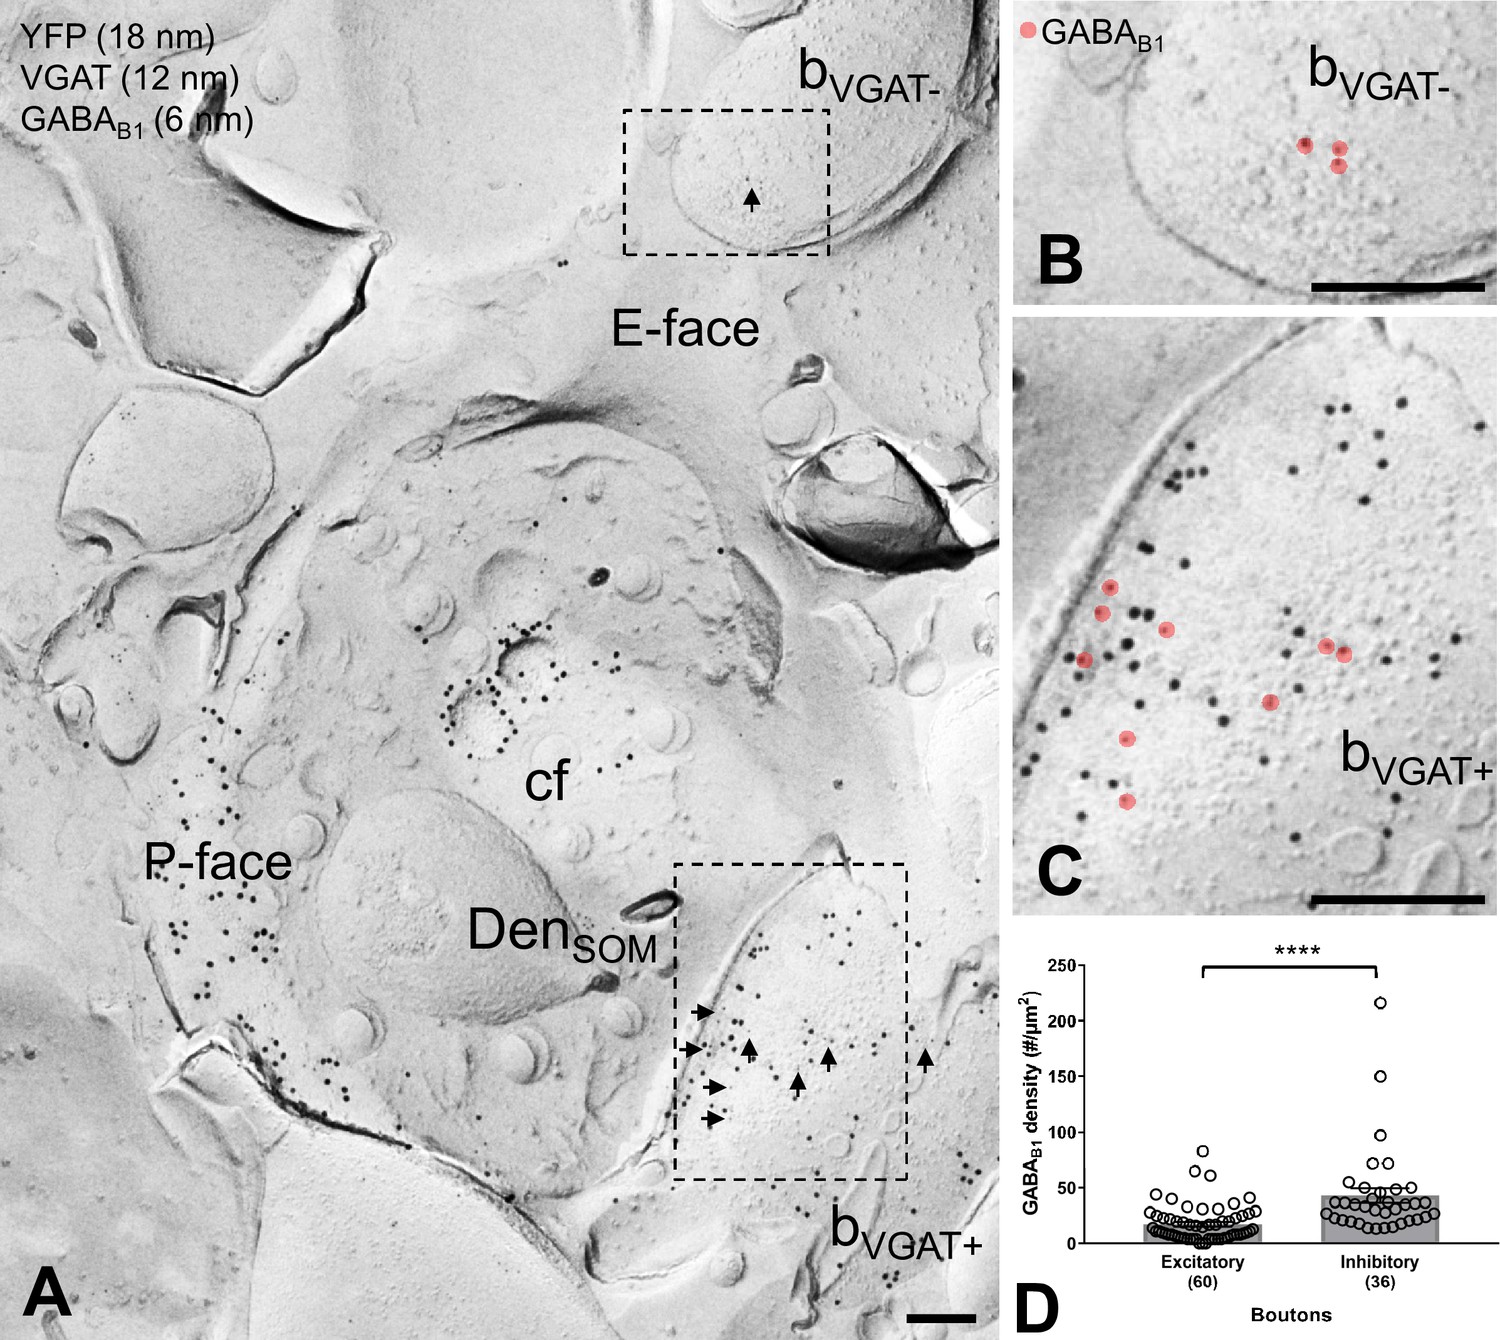
GABAB1 expression on inhibitory and excitatory axon terminals forming synapses onto SOM-IN dendrites.
(A) Electron micrographs showing immunogold labeling for GABAB1 (6 nm, arrows) on VGAT-immunonegative (bVGAT-) and VGAT-immunopositive (bVGAT+;12 nm) axon terminals contacting a ChR2-YFP-immunopositive (18 nm) dendritic shaft of a SOM-IN (DenSOM). (B) Expanded view of the VGAT-immunonegative terminal identified in (A), with GABAB1 labeling highlighted (red overlay). (C) Expanded view of the VGAT-immunopositive terminal identified in (A), with GABAB1 highlighted. (D) Summary bar graph of GABAB1 labeling density on excitatory (VGAT- and VGluT1+) and inhibitory (VGAT+ and VGluT1-) axon terminals. Data from individual compartment are shown as open circles with numbers of analyzed terminals in parentheses. Density of GABAB1 is significantly higher in inhibitory boutons compared to excitatory terminals (****p<0.0001, Mann-Whitney test). Abbreviations: E-face, exoplasmic face; P-face, protoplasmic face; cf, cross-fractured face. Scale bars: 200 nm.
Figure 5 with 1 supplement
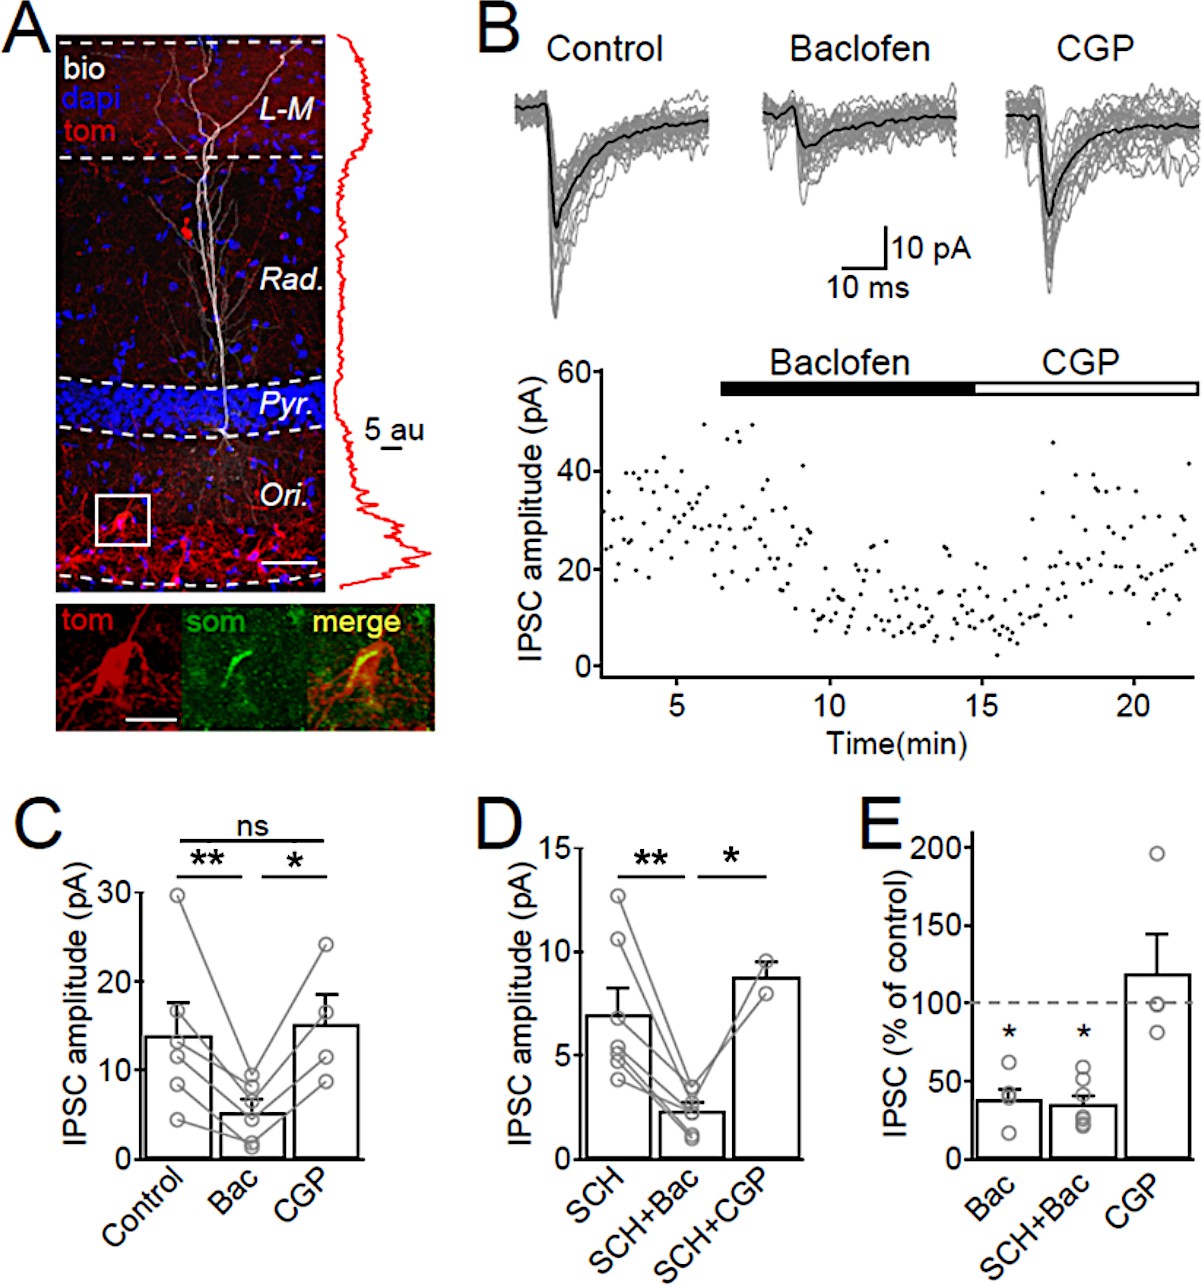
SOM-IN output synapses are inhibited by GABABRs.
(A) Confocal image stack of a recorded and biocytin-filled CA1 PC (white pseudocolor) in a slice from SOM-Cre transgenic mouse transfected with ChR2-tdTomato (tom, red). The slice was counterstained with DAPI (blue) to reveal hippocampal layering, including the cell body layer (Pyr). Inset (right), plot of the fluorescence intensity in the red channel for the ChR2-tdTomato fusion protein across CA1 layers. Inset (bottom), co-localization of tdTomato (tom, red) with SOM immunofluorescence (green). Scale bars: 50 µm (main) and 20 µm (inset). (B, upper) IPSCs recorded in a CA1 PC following photo stimulation of SOM-IN axons in the CA1. Individual sweeps (gray) are overlaid with the averaged traces (in black) for control, baclofen (10 µM) and CGP (5 µM) conditions. (B, lower) Time-course plot of IPSC amplitudes obtained from the CA1 PC during control and sequential bath application of baclofen and CGP. (C) Summary bar chart of mean IPSC amplitudes from 6 CA1 PCs in control, baclofen and CGP conditions. (D) Summary bar chart of IPSC amplitudes from 7 CA1 PCs with the same pharmacological tests, but in the continuous presence of SCH-23,390 (SCH, 10 µM) to block Kir3 channels. (E) Mean IPSC amplitudes normalized to control in the presence of baclofen (6 cells), SCH and baclofen (7 cells), and CGP alone (4 cells). Connected circles correspond to data obtained from single PCs under the different conditions. Statistics shown: ns – p>0.05, *p<0.05, **p<0.01 from Holm-Sidak tests.
Figure 5—figure supplement 1
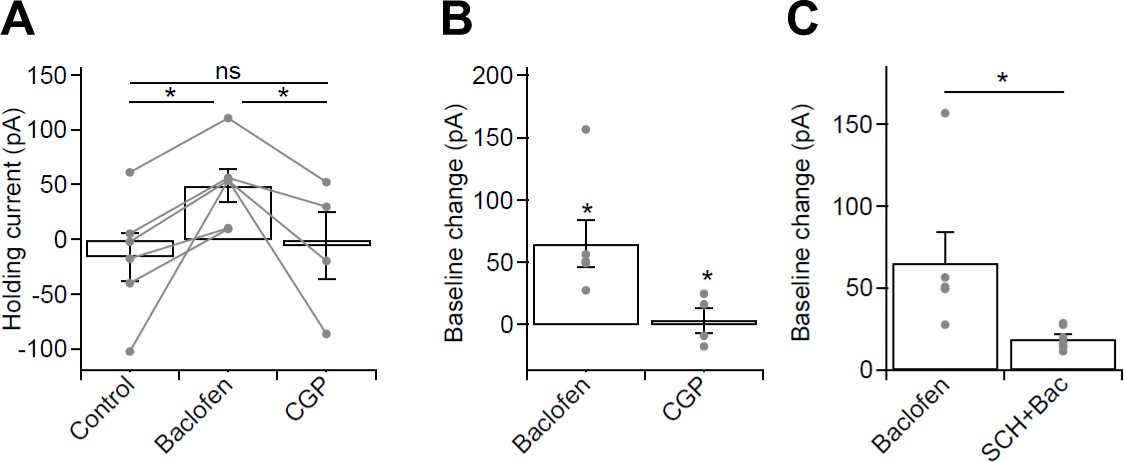
Whole-cell baclofen-mediated currents in optogenetic experiments from CA1 PCs of the mouse hippocampus.
(A) Summary bar chart of holding currents in voltage-clamped CA1 PCs (held at −65 mV) recorded for optogenetic stimulation experiments in control conditions, in 10 µM baclofen and in 5 µM CGP. (B) Subtraction of control baseline allowed measurement of the whole-cell current induced by baclofen and CGP. Note the large baclofen induced GABABR-mediated current and the absence of a current in CGP, suggesting the lack of tonic GABABR activation. (C) Summary bar chart of baclofen-induced currents in the absence and presence of 10 µM SCH-23,390, a Kir3 channel blocker. Note the large reduction in baclofen induced whole-cell current in the presence of SCH. Statistics shown: ns – p>0.05, * - p<0.01, derived from repeated-measures ANOVA with Holm-Sidak test (A) and from Mann-Whitney Tests (B,C).
Figure 6
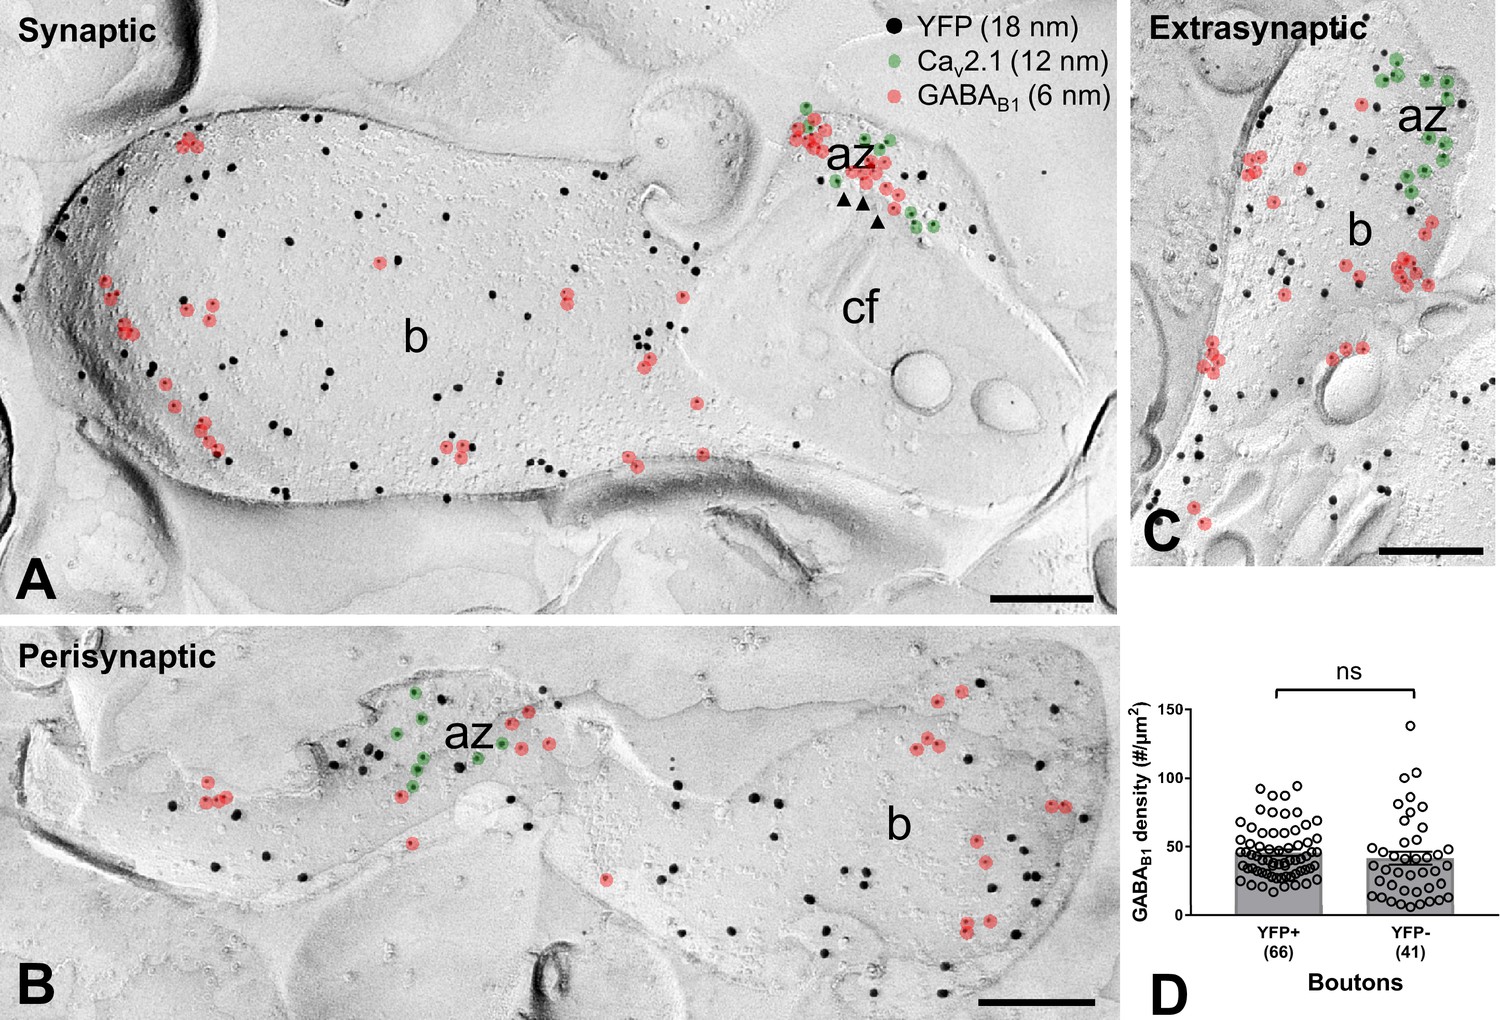
GABAB1 subunit expression and localization on SOM-IN axon terminals.
(A–C) Electron micrographs showing GABAB1 (6 nm particles, red overlay) localized to the active zone (az) (A), identified by immunolabeling for Cav2.1 (12 nm, green overlay), to the perisynaptic membrane (B) and to the extrasynaptic domain (A–C) of YFP+ (18 nm) boutons (b) of SOM-INs. Note that extrasynaptic Cav2.1 channels were not highlighted in (A) and (B). Arrowheads indicate docked and predocked vesicles on cross-fractured face (cf) of a bouton in (A). (D) Summary bar chart of the average GABAB1 density on YFP+ boutons, compared to nearby YFP- boutons. Data from individual compartment are shown (open circles) with number of analyzed terminals in parentheses. ns – p>0.05. Mann-Whitney test. Scale bars: 200 nm.
Figure 7 with 2 supplements
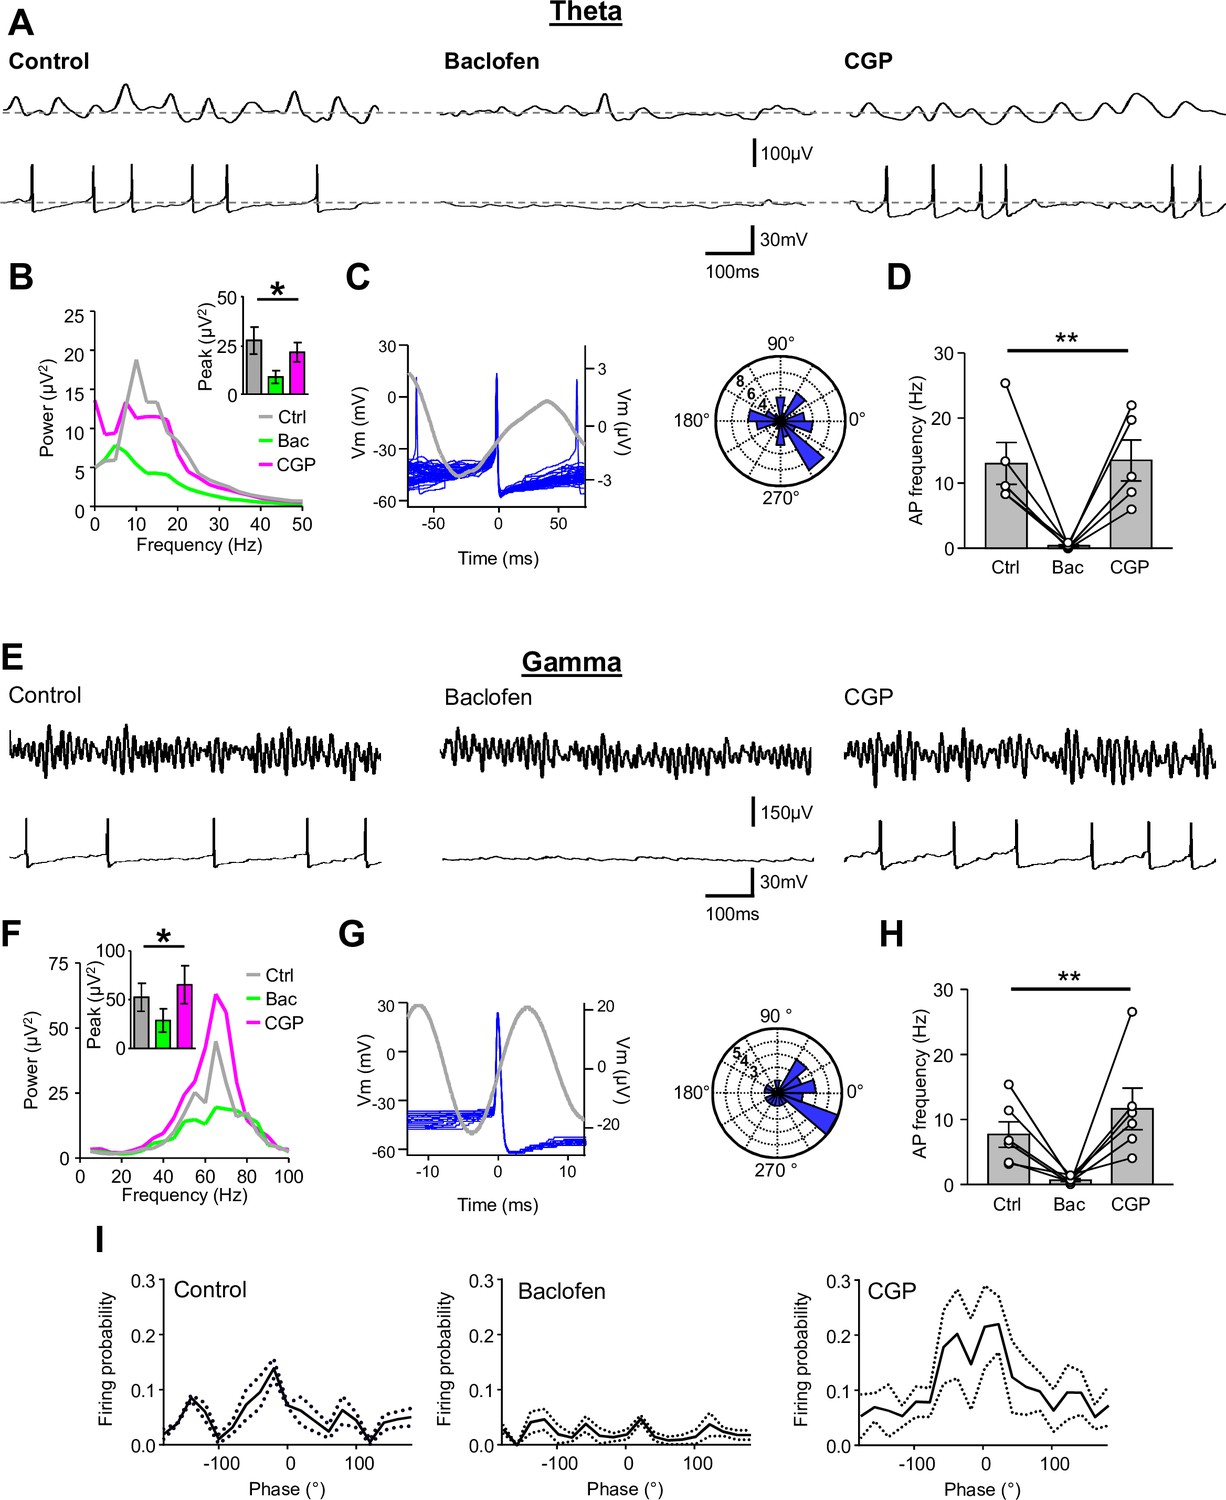
Presynaptic GABABR-mediated inhibition functionally uncouples SOM-INs from the local network.
(A) Dual extracellular field (upper) and whole-cell (lower) recordings from a CA1 SOM-IN in longitudinal acute hippocampal slice during theta frequency oscillations induced by bath application of 50 µM carbachol. Representative traces are shown in control conditions (left), and during application of baclofen (2 µM, middle), or subsequent application of CGP (5 µM, right). (B) Spectral analysis of the field oscillations under control conditions (grayscale), during baclofen (Bac, green) and subsequent CGP (magenta) application (7 slices). Inset, bar chart of the average peak power for the three pharmacological conditions. (C) Spike triggered average of the field potential (gray trace)± 75 ms from the AP in a SOM-IN (blue, superimposed; left) illustrating the firing preference at the rising phase of the oscillations. Inset (right), polar plot of the phase preference of SOM-IN discharge with respect to the oscillatory cycle. (D) Summary bar chart of the average discharge frequency of SOM-INs (7 cells) during theta frequency activity in control conditions and in the presence of baclofen or CGP. (E–H) Corresponding data for gamma activity induced by 2 mM kainate puff application to str. radiatum of CA1 in horizontal hippocampal slices. (I) Mean discharge probability of SOM-INs plotted as a function of the phase of gamma under control conditions (left), in the presence of baclofen (middle, with a bias current applied to hold the membrane potential of the SOM-IN close to firing threshold), and in the presence of CGP (right, without bias current). Statistics shown: ns – p>0.05, ** - p<0.01, derived from repeated-measures ANOVA.
Figure 7—figure supplement 1
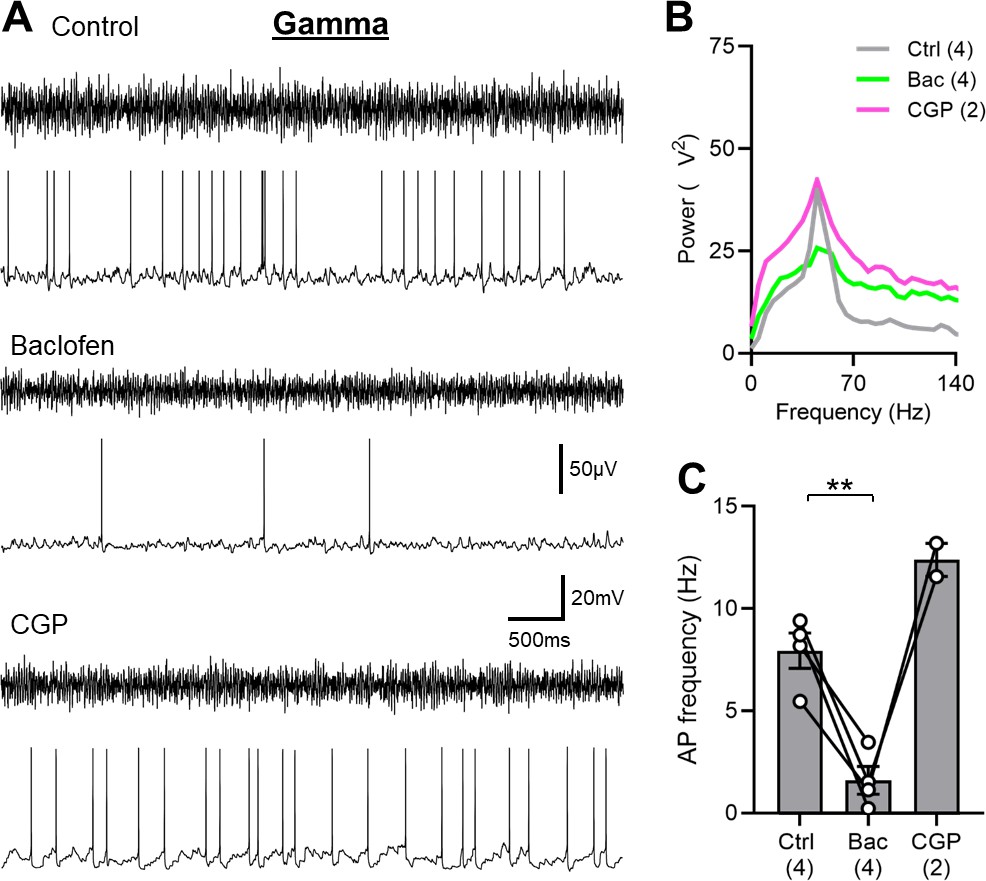
SOM-IN spiking is abolished by GABABR activation in the mouse hippocampus.
(A) Representative traces during 2 mM kainate puff application to the str. radiatum, showing the extracellular field oscillations (upper traces) and the discharge of a whole-cell recorded SOM-IN (lower traces) in control conditions (top) and during bath application of either 2 µM baclofen (middle) or 5 µM CGP (bottom). (B) Average power spectra measured from extracellular field recordings during control conditions, baclofen or CGP bath application. (C) Summary bar chart of the discharge frequency of SOM-INs measured over the 10 s period following kainate puff application for control, baclofen, and CGP conditions. Data from individual cells are superimposed as connected open circles; numbers of recorded cells are indicated below the bars. Statistics shown: ** - p<0.01, derived from repeated-measures ANOVA with Holm-Sidak tests.
Figure 7—figure supplement 2

Abolished SOM-IN spiking is due to GABABRs activation in CA1 str. oriens of the mouse hippocampus.
(A) Representative trace during 2 mM kainate puff application to the str. radiatum, showing the extracellular field oscillations (upper traces) and the discharge of a whole-cell recorded SOM-IN (lower traces) in control conditions (top) and during puff application of 2 mM baclofen to proximal str. oriens in the absence (middle) or presence of 5 µM bath-applied CGP (bottom). (B) Average power spectra measured from extracellular field recordings during control conditions and following baclofen puff ± CGP bath application. (C) Summary bar chart of the discharge frequency of SOM-INs measured over the 10 s period following combined baclofen and kainate puff for control, baclofen puff alone, and baclofen puff with the bath applied CGP. Data from individual cells are superimposed as connected open circles; numbers of cells are indicated below the bars. Statistics shown: ns- p>0.05 ** - p<0.01, derived from repeated-measures ANOVA with Holm-Sidak tests.
Author response image 1
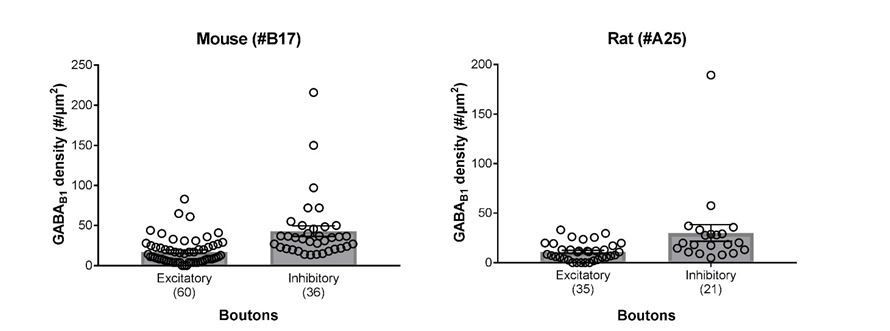
Summary bar charts of the surface densities of immunogold particles for GABAB1 subunit in excitatory and inhibitory axon terminals forming synapses onto SOM-IN dendrites in the mouse (left) and the rat hippocampus (right) detected using the B17 and A25 primary antibodies, respectively (see Materials and methods for further detail).
Superimposed open circles represent density values from individual boutons.
Author response image 2
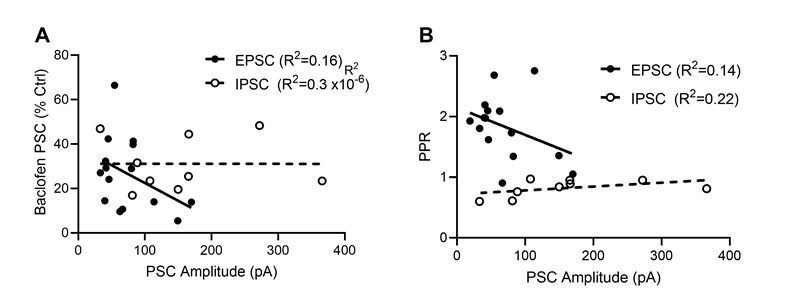
Dependence of baclofen mediated presynaptic inhibition and paired-pulse ratio on the EPSC and IPSC ampli-tudes.
(A) Baclofen-induced presynaptic inhibition of EPSCs (filled circles) and IPSCs (open circles) plotted as a function of PSC amplitude. Based on a linear regression analysis, neither EPSCs (F(d.f. 1,13) = 2.5, p = 0.14, F-test, solid line) nor IPSC s(F(d.f. 1,7) = 0.00002, p = 0.99, F-test, dashed line) displayed a dependence of the bac-lofen response on the PSC amplitudes. (B) EPSC and IPSC amplitude effect on the degree of paired pulse ratio observed. Based on a linear regression analysis, neither EPSCs (F(d.f. 1,13) = 2.1, p = 0.17, F-test) nor IPSC s(F(d.f. 1,7) = 2.0, p = 0.20, F-test) displayed a strong interaction of PPR and synaptic strength.
Tables
Key resources table
| Reagent type (species) or resource | Designation | Source or reference | Identifiers | Additional information |
|---|---|---|---|---|
| Genetic reagent (R. norvegicus) | Wild-type rat | Charles River | Crl:WI | Rats used for immunoelectron microscopy |
| Genetic reagent (R. norvegicus) | vGAT-YFP rat | PMID: 17517679 | Rats used for acute slice experiments | |
| Genetic reagent (M. musculus) | Wild-type mouse | Charles River | C57/Bl6J CRL | Mice used for acute slice experiments |
| Genetic reagent (M. musculus) | Som-Cre mouse | Jackson Laboratory; 013044 | Ssttm2.1(cre)Zjh/J | |
| Genetic reagent (M. musculus) | Ai32 mouse | Jackson Laboratory; 024109 | RCL-ChR2(H134R)/EYFP | |
| Antibody | Anti-GFP | Aves labs, USA | Aves labs:GFP-1010 | chicken polyclonal (1:25000) |
| Antibody | Anti- Cav2.1 | Frontier Institute, JAPAN | Frontier Institute:VDCCa1A-GP-Af810; RRID:AB_2571851 | guinea pig polyclonal (1:50) |
| Antibody | Anti- VGAT | Frontier Institute, JAPAN | Frontier Institute. VGAT-GP-Af1000; RRID:AB_2571624 | guinea pig polyclonal (1:44) |
| Antibody | Anti-VGLUT1 | Frontier Institute, JAPAN | Frontier Institute: VGluT1-Go-Af310; RRID:AB_2571617 | goat polyclonal (1:400) |
| Antibody | Anti-mGluR1α | Frontier Institute, JAPAN | Frontier Institute: mGluR1a-GP-Af660; RRID:AB_2571801 | guinea pig polyclonal (1:500) |
| Antibody | Anti-Somatostatin | Peninsula Laboratories, USA | Peninsula Laboratories:T-4103.0050 | rabbit polyclonal (1:2000) |
| Antibody | Anti-GABAB1(B17) | PMID: 11849296 | Rabbit polyclonal; against aa 901–960; (1:50) | |
| Antibody | Anti-GABAB1(A25) | PMID: 16427742 | Rabbit polyclonal; against aa 857–960; (1:200) | |
| Antibody | 6 nm anti-Rabbit IgG (secondary) | Jackson ImmunoResearch Europe, UK | Jackson ImmunoResearch E:711-195-152 | (1:30) |
| Antibody | 12 nm anti-Guinea pig (secondary) | Jackson ImmunoResearch Europe, UK | Jackson ImmunoResearch E:706-205-148 | (1:30) |
| Antibody | 12 nm anti-Goat (secondary) | Jackson ImmunoResearch Europe, UK | Jackson ImmunoResearch E:705-205-147 | (1:30) |
| Antibody | 18 nm anti-Chicken (secondary) | Jackson ImmunoResearch Europe, UK | Jackson ImmunoResearch E:703-215-155 | (1:30) |
| Antibody | 3 nm anti-Guinea pig (secondary) | Nanopartz, USA | Nanopartz:CA11-3-FCDAGG-DIH-50–1 | (1:800) |
| Antibody | Alexa Fluor 405,488,546 Anti-Rabbit (secondaries) | Invitrogen, UK | (1:500) | |
| Other | Alexa Fluor 647 Streptavidin | Invitrogen, UK | Invitrogen:S21374 | (1:500) |
| Chemical compound, drug | NBQX | Abcam Biochemicals, UK | ab120046 | |
| Chemical compound, drug | DL-AP5 | Abcam Biochemicals, UK | ab120271 | |
| Chemical compound, drug | Bicuculline | Abcam Biochemicals, UK | ab120108 | |
| Chemical compound, drug | Gabazine | Abcam Biochemicals, UK | ab120042 | |
| Chemical compound, drug | R-Baclofen | Abcam Biochemicals, UK | ab120325 | |
| Chemical compound, drug | CGP-55845 | Abcam Biochemicals, UK | ab120337 | |
| Chemical compound, drug | SCH23,390 | Tocris, UK | 0925/10 | |
| Chemical compound, drug | Kainate | Tocris, UK | 0222/1 | |
| Chemical compound, drug | Carbcahol | Abcam Biochemicals, UK | ab141354 | |
| Software, algorithm | GraphPad Prism | GraphPad Software, USA | ||
| Software, algorithm | WinWCP | University of Strathclyde, UK | http://spider.science.strath.ac.uk/sipbs/software_ses.htm | |
| Software, algorithm | pClamp | Axon Instruments, USA | ||
| Software, algorithm | MATLAB | Mathworks, USA | ||
| Software, algorithm | StimFit | PMID: 24600389 | ||
| Software, algorithm | Fiji | http://fiji.sc |
Additional files
Download links
A two-part list of links to download the article, or parts of the article, in various formats.
Downloads (link to download the article as PDF)
Open citations (links to open the citations from this article in various online reference manager services)
Cite this article (links to download the citations from this article in formats compatible with various reference manager tools)
Presynaptic GABAB receptors functionally uncouple somatostatin interneurons from the active hippocampal network
eLife 9:e51156.
https://doi.org/10.7554/eLife.51156


