TTBK2 and primary cilia are essential for the connectivity and survival of cerebellar Purkinje neurons
- Duke University, United States
Figures
Figure 1 with 4 supplements
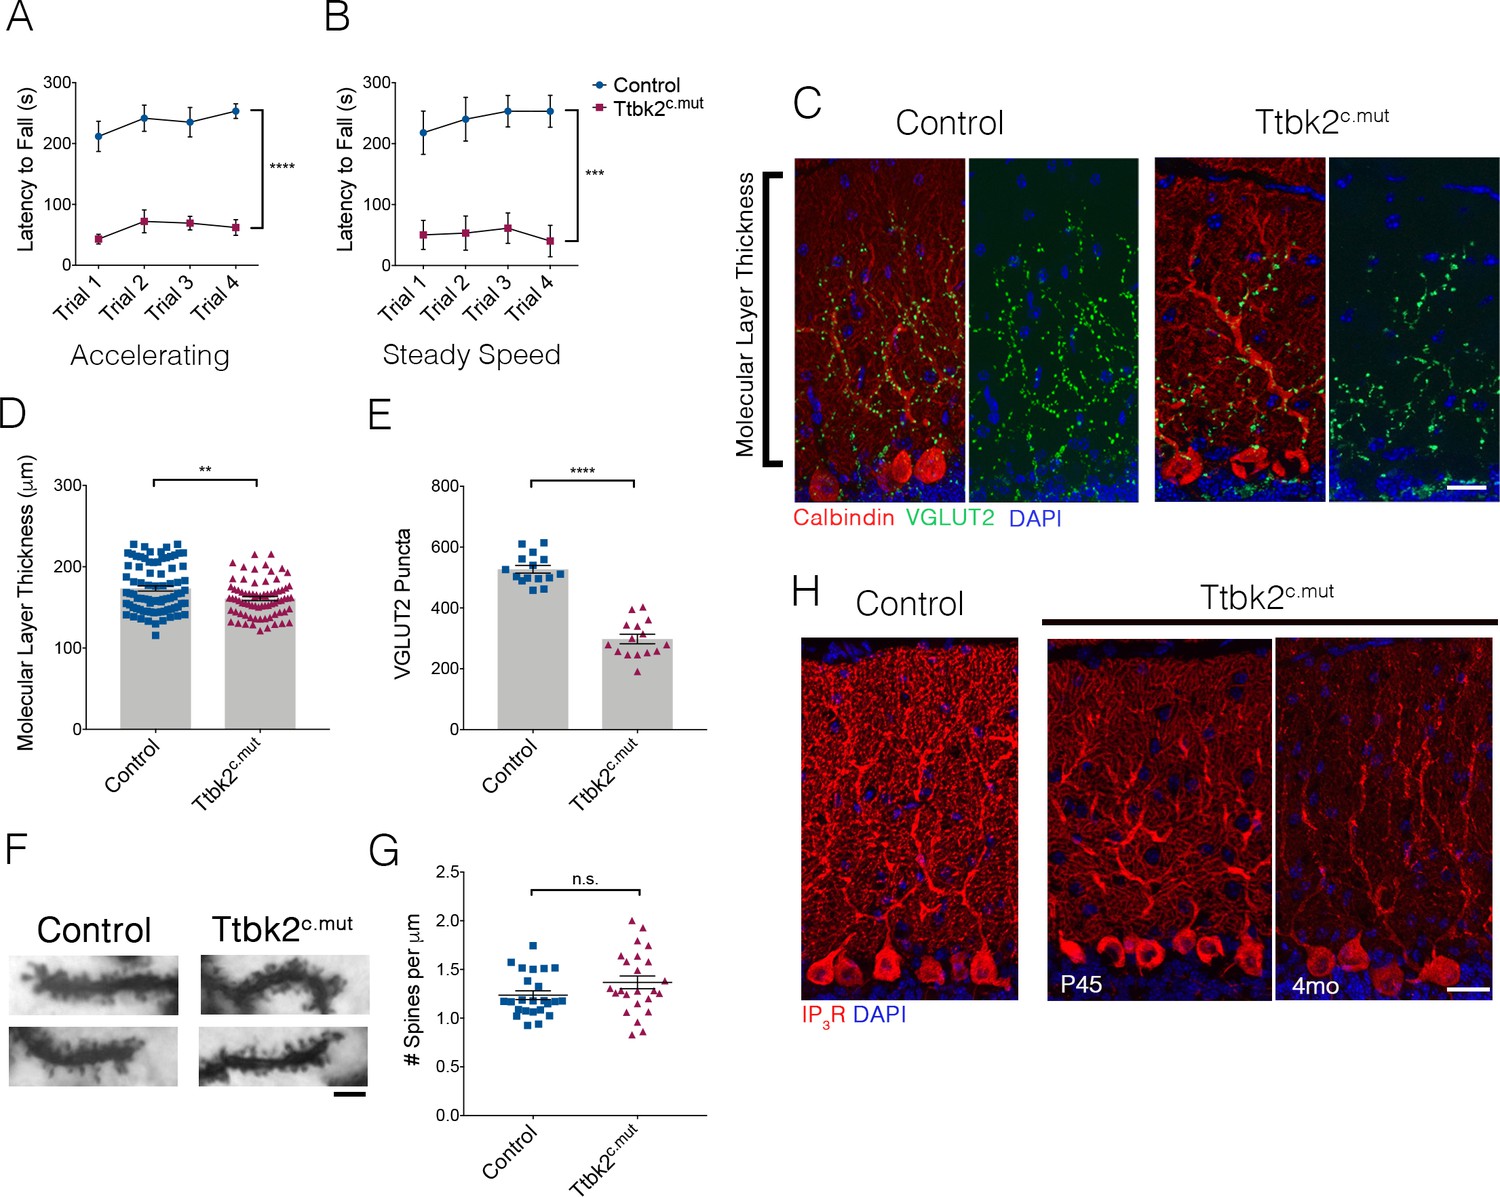
Loss of Ttbk2 causes SCA-like phenotypes.
(A, B) Accelerating and steady speed rotarod performance test between Ttbk2c.mut and littermate Controls. Ttbk2c.mut animals have a shorter latency to fall time in both tests, indicative of impaired motor ability (a two-way ANOVA with Bonferroni’s multiple comparison test was used for calculating significance. p<0.0001 for accelerating rotarod test, and p=0.0001 for steady speed. n = 9 animals for Control, n = 8 animals for Ttbk2c.mut). (C) Cerebellar tissue from Control and Ttbk2c.mut mice at 3 months after loss of Ttbk2, immunostained for Calbindin to label Purkinje cells (red) and VGLUT2 to show climbing fiber synapses (green). Ttbk2c.mut animals show a reduction in VGLUT2 positive synapses throughout the cerebellum 3 months after loss of TTBK2. Scale bar = 50 μm. (D) Quantification of molecular layer length in Ttbk2c.mut cerebellar tissue (each point represents one measurement, 75 measurements overall. n = 3 animals. p=0.0011 by student’s unpaired t-test, error bars indicate SEM). (E) Quantification of VGLUT2+ puncta throughout PC dendrites. Ttbk2c.mut animals show a significant reduction in these VGLUT2+ synapse terminals (each point represents one measurement, 15 measurements per genotype, n = 3 animals. p<0.0001 by student’s unpaired t-test, error bars indicate SEM). (F) Golgi stain showing spines on proximal dendrites of PCs in Control and Ttbk2c.mut animals. Scale bar = 2 μm. (G) Quantification of number of spines per micron of dendrite. Ttbk2c.mut PCs do not lose spine density on proximal dendrites at 4 months of age. Each point represents a measurement taken from a singular dendrite, n = 3 animals. (H) Immunostaining for IP3R (red) and nuclei (blue). Loss of IP3R expression is seen as early as P45 in Ttbk2c.mut cerebellum. By 3 months after TMX injection, IP3R expression is no longer localized to secondary dendrites throughout the dendritic tree of PCs in Ttbk2c.mut animals. Scale bar = 50 μm.
Figure 1—figure supplement 1
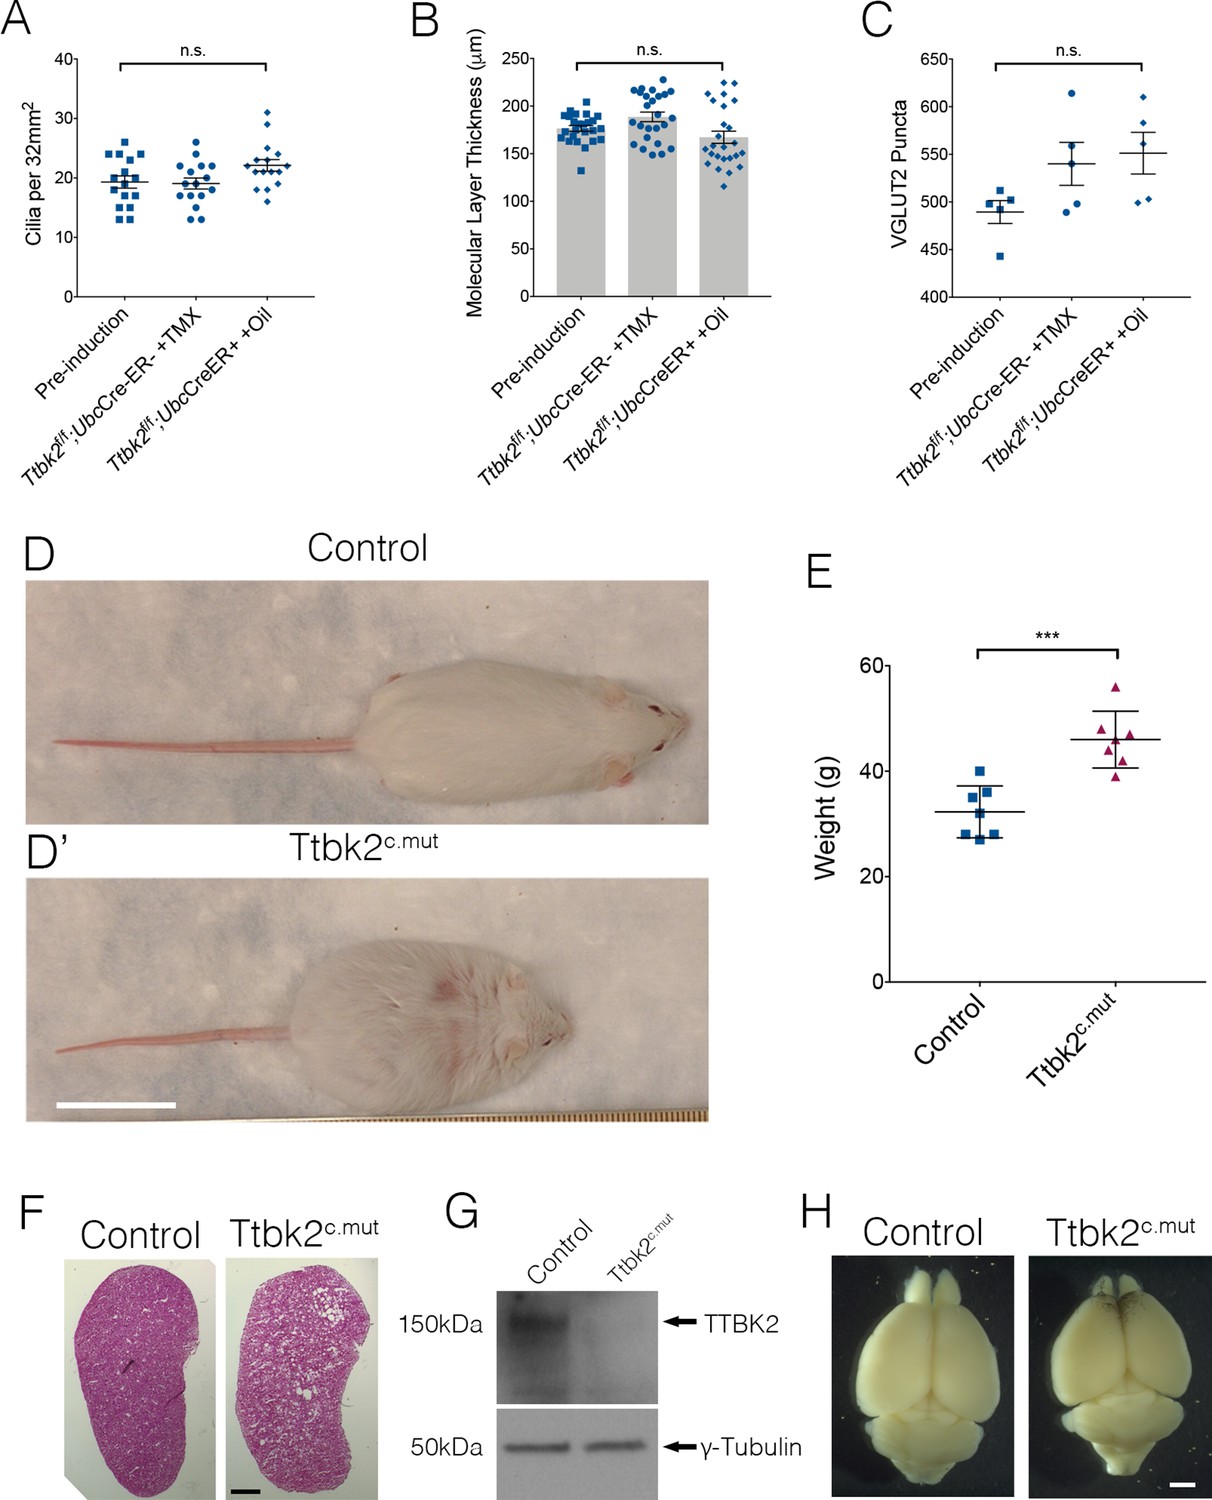
Ttbk2c.mut animals have phenotypes shared with other ciliopathy models.
(A–C) Quantification of cilia abundance (A), molecular layer thickness (B), and VGLUT2 puncta (C) across various Controls. There is no significant difference between Control genotypes compared to each other for any of these metrics using a one-way ANOVA with Tukey’s correction In (A), each point represents a field counted, 16 fields were counted in total. In (B), each point represents a singular measurement, three distinct primary fissures were included per group, 25 measurements were counted per animal. In (C), each point represents puncta quantified from a 10 μm z-stack on the caudal side of the primary fissure. n = 1 animal per genotype for (A–C), error bars indicate SEM. (D–D’) Representative images of Control (D) and Ttbk2c.mut (D’) mice. Scale bar = 2.5 cm. (E) Quantification of weight gain in Ttbk2c.mut mice compared to Controls. (n = 7 animals, p=0.0003). (F) H and E staining of kidneys from Control and Ttbk2c.mut mice. Ttbk2c.mut mice have polycystic kidneys. Scale bar = 100 μm. (G) Western blot analysis of cerebellum lysate from Ttbk2c.mut animals showing no TTBK2 expressed 3 months after tamoxifen injection. (H) Representative images of Control and Ttbk2c.mut brains 3 months after tamoxifen treatment. Scale bar = 1 mm.
Figure 1—figure supplement 2
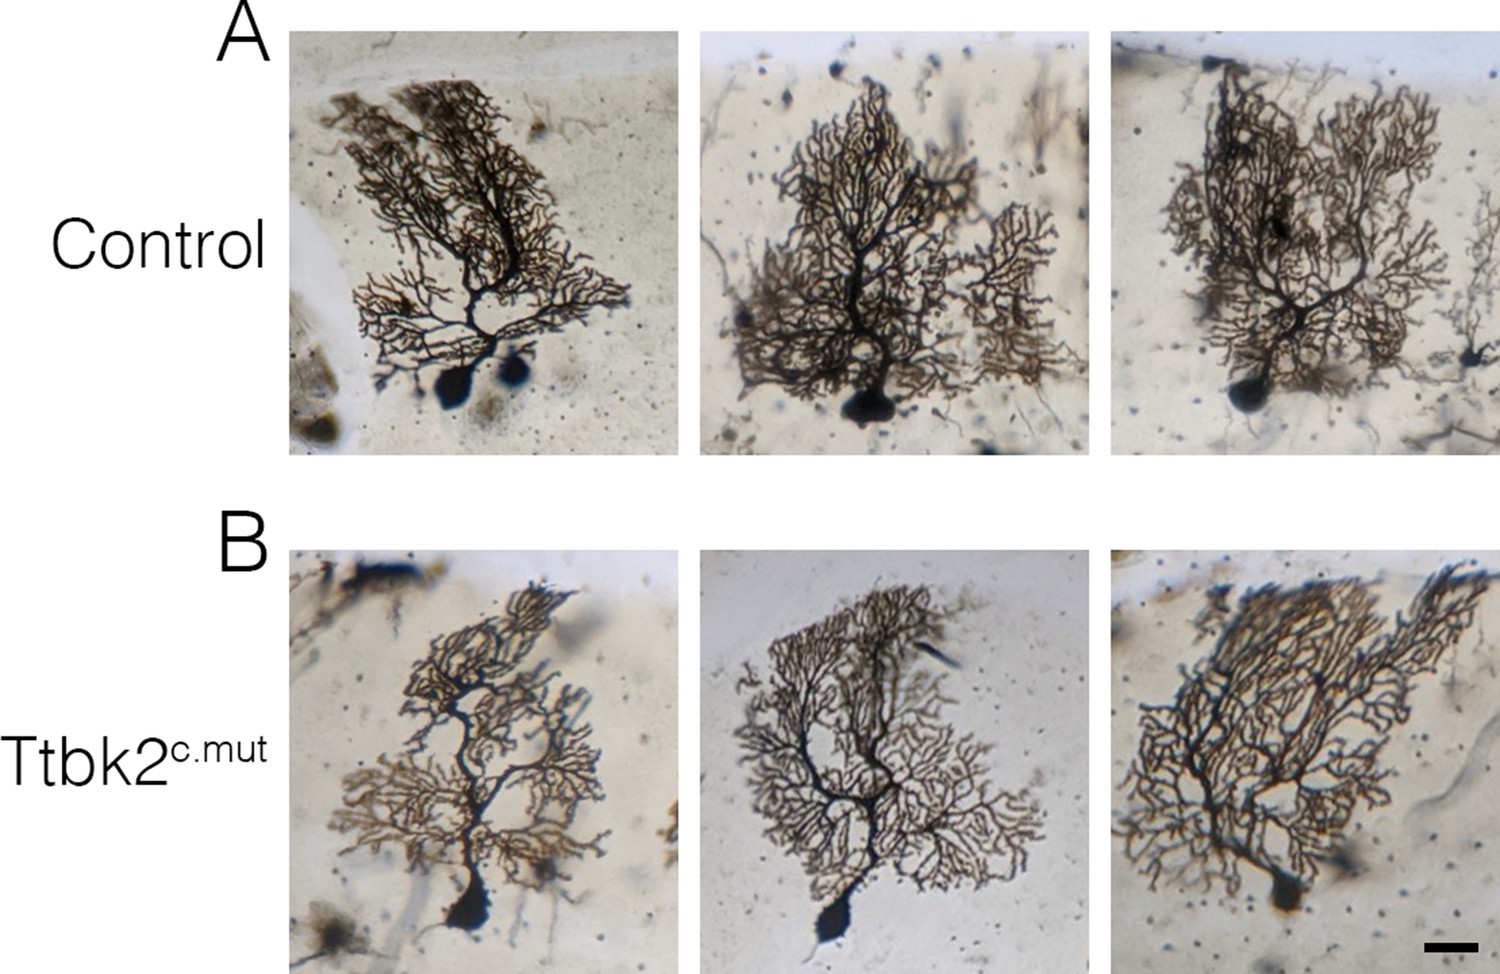
Dendritic trees of Ttbk2c.mut PCs do not exhibit gross morphological changes.
Representative images of Golgi stained PCs throughout the cerebellum of Control (A) and Ttbk2c.mut (B) mice. Dendritic trees are nearly indistinguishable between Controls and Ttbk2c.mut mice.
Figure 1—figure supplement 3

Loss of Ttbk2 starting at P45 results in loss of VGLUT2 synapses.
(A) Representative images of 4-month-old Control and Ttbk2c.mut cerebella injected at P45 showing VGLUT2+ synapses in green. Scale bar = 30 μm. (B) Quantification of the loss of VGLUT2 puncta in P45-injected, 4-month-old Ttbk2c.mut compared to Control. Each point represents one measurement. n = 3 animals, p<0.0001 by unpaired student’s t-test, error bars represent SEM.
Figure 1—video 1
Ttbk2c.mut mice have apparent motor coordination deficiencies.
Video showing the gait of age P45 Control animal versus the gait of a Ttbk2c.mut animal treated with TMX at P21.
Figure 2 with 1 supplement
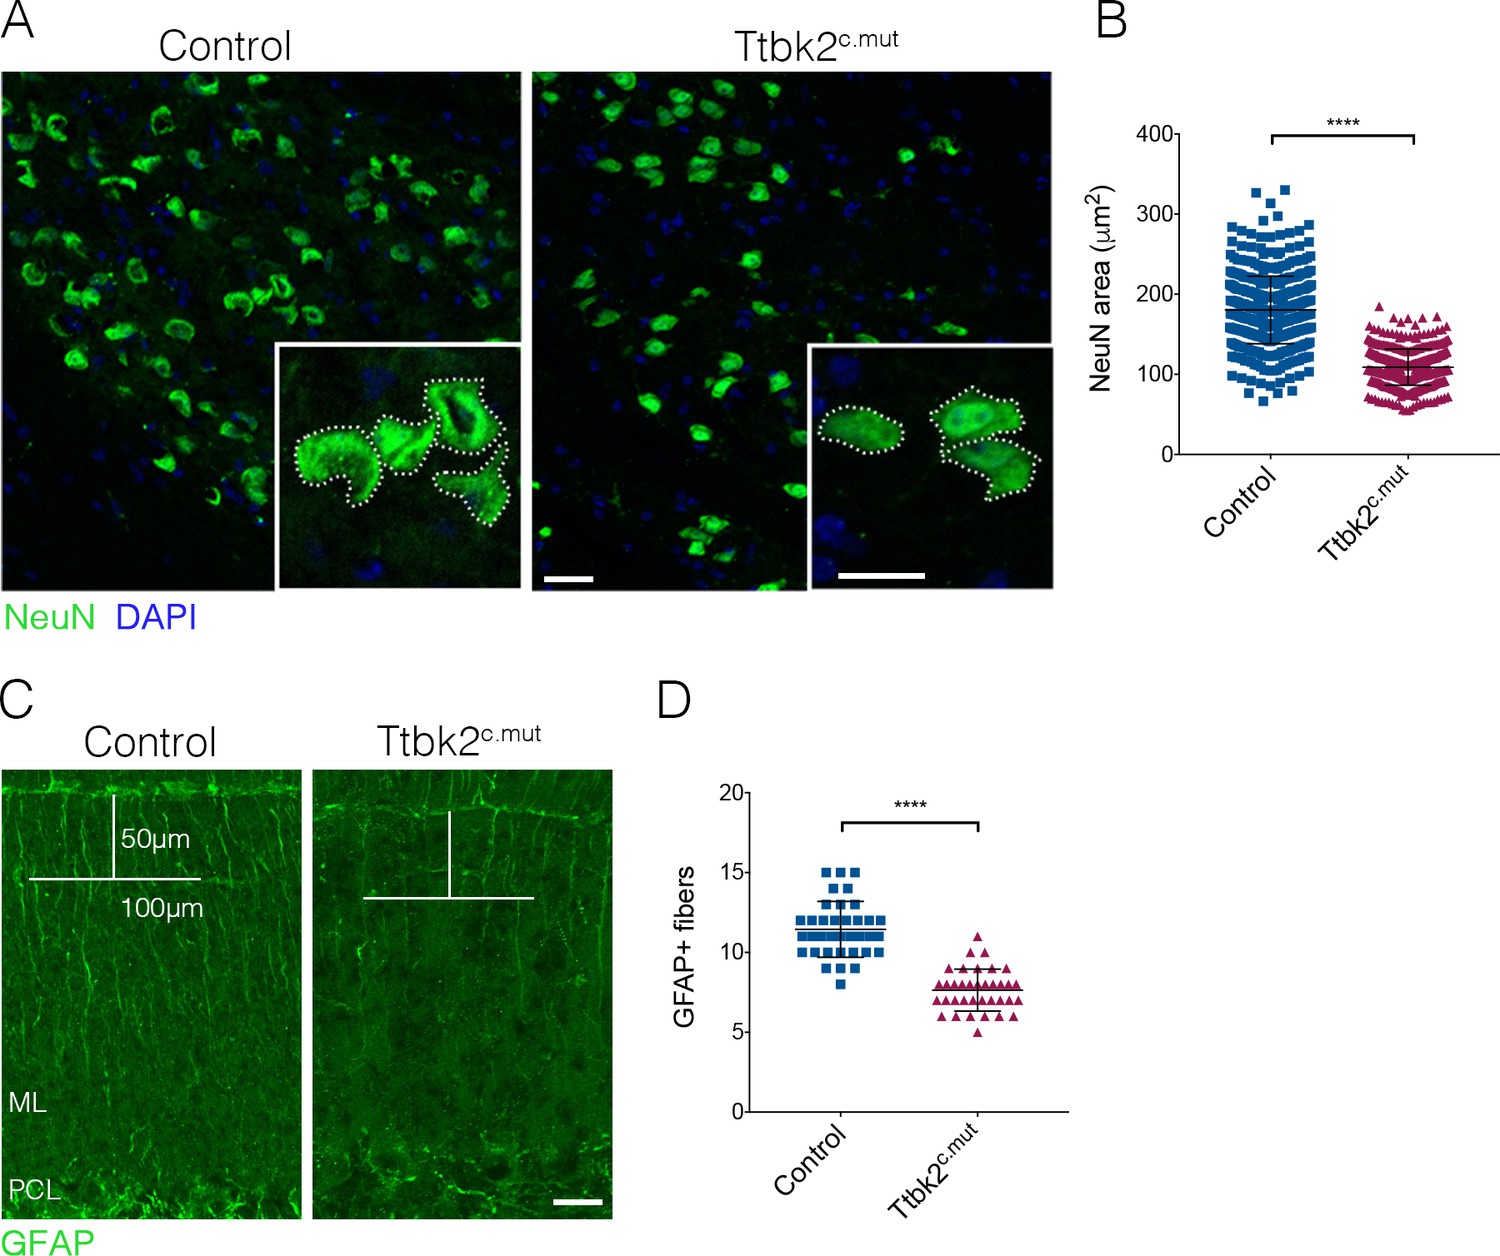
ION and glial cells are affected by loss of Ttbk2.
(A) Representative images of neurons in the inferior olivary nucleus (ION) located in the medulla. Neural somata are immunostained with NeuN (green). Insets show how the area was measured. Scale bar = 50 μm (20 μm inset). (B) Quantification of NeuN area. ION neurons have reduced area in Ttbk2c.mut animals compared to Control (each point represents a single cell measurement of which > 150 measurements were made per animal. n = 3 animals, p<0.0001 by unpaired student’s t-test, error bars indicate SEM). (C) Glial fibrillary acidic protein (GFAP) staining showing BG fibers throughout the molecular layer. In Ttbk2c.mut animals, density of these fibers is reduced. Quantification was made as previously described (Furrer et al., 2011), in which a 50 μm line was drawn from the pial surface of the folia, and a 100 μm line across. Glial fibers that fully crossed the 100 μm line were scored. Scale bar = 20 μm. (D) Quantification of GFAP+ glial fibers that crossed the 100 μm line (each point represents an image quantified, 36 images quantified per genotype across n = 3 animals. p<0.0001 by unpaired student’s t-test, error bars indicate SEM).
Figure 2—figure supplement 1
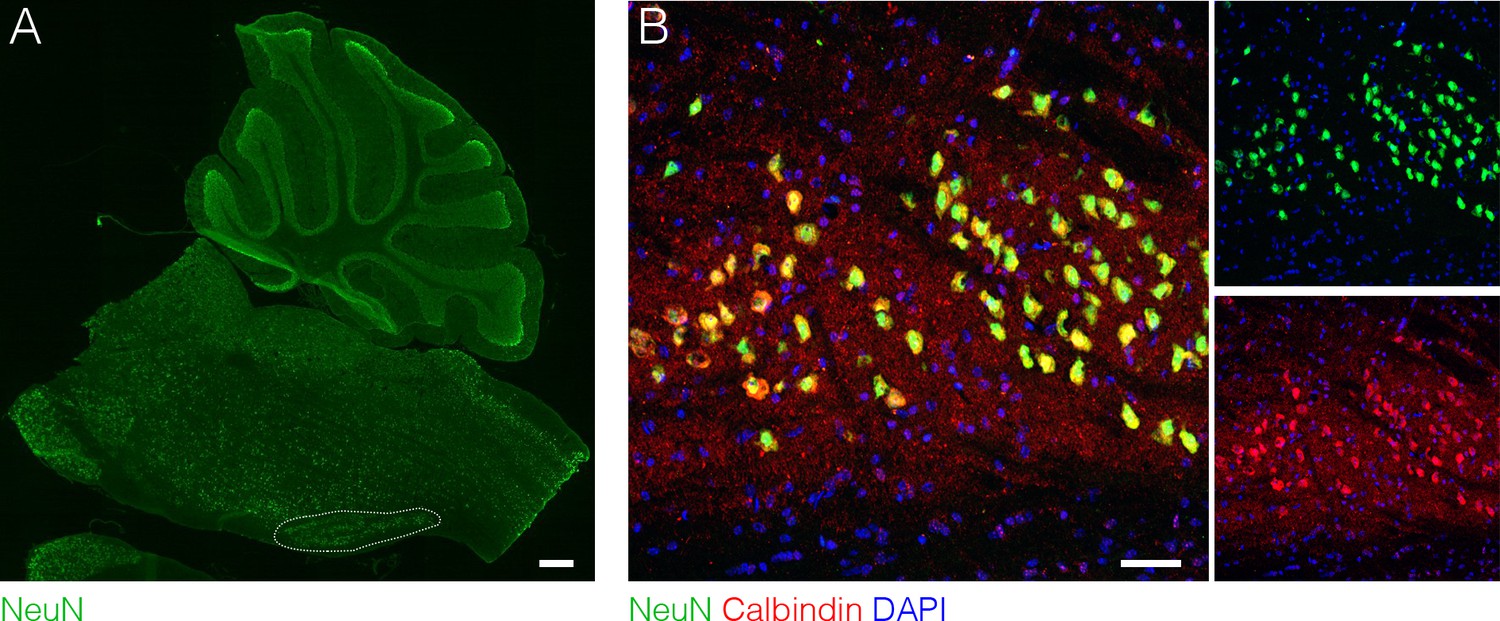
Identification of ION neurons within the medulla.
(A) The location of the mouse inferior olivary nucleus (ION, dotted outline) within the medulla oblongata of the brain stem. Scale bar = 10 mm. (B) Neurons within the ION are stained for Calbindin (red), NeuN (green), and 4′,6-diamidino-2-phenylindole (DAPI) (blue) with separate channels shown (right panel). The ION is found at the medial ventral part of the medulla oblongata, below the superior olivary nucleus. Scale bar = 100 μm.
Figure 3 with 1 supplement
Cell autonomous requirements for Ttbk2 in the cerebellum.
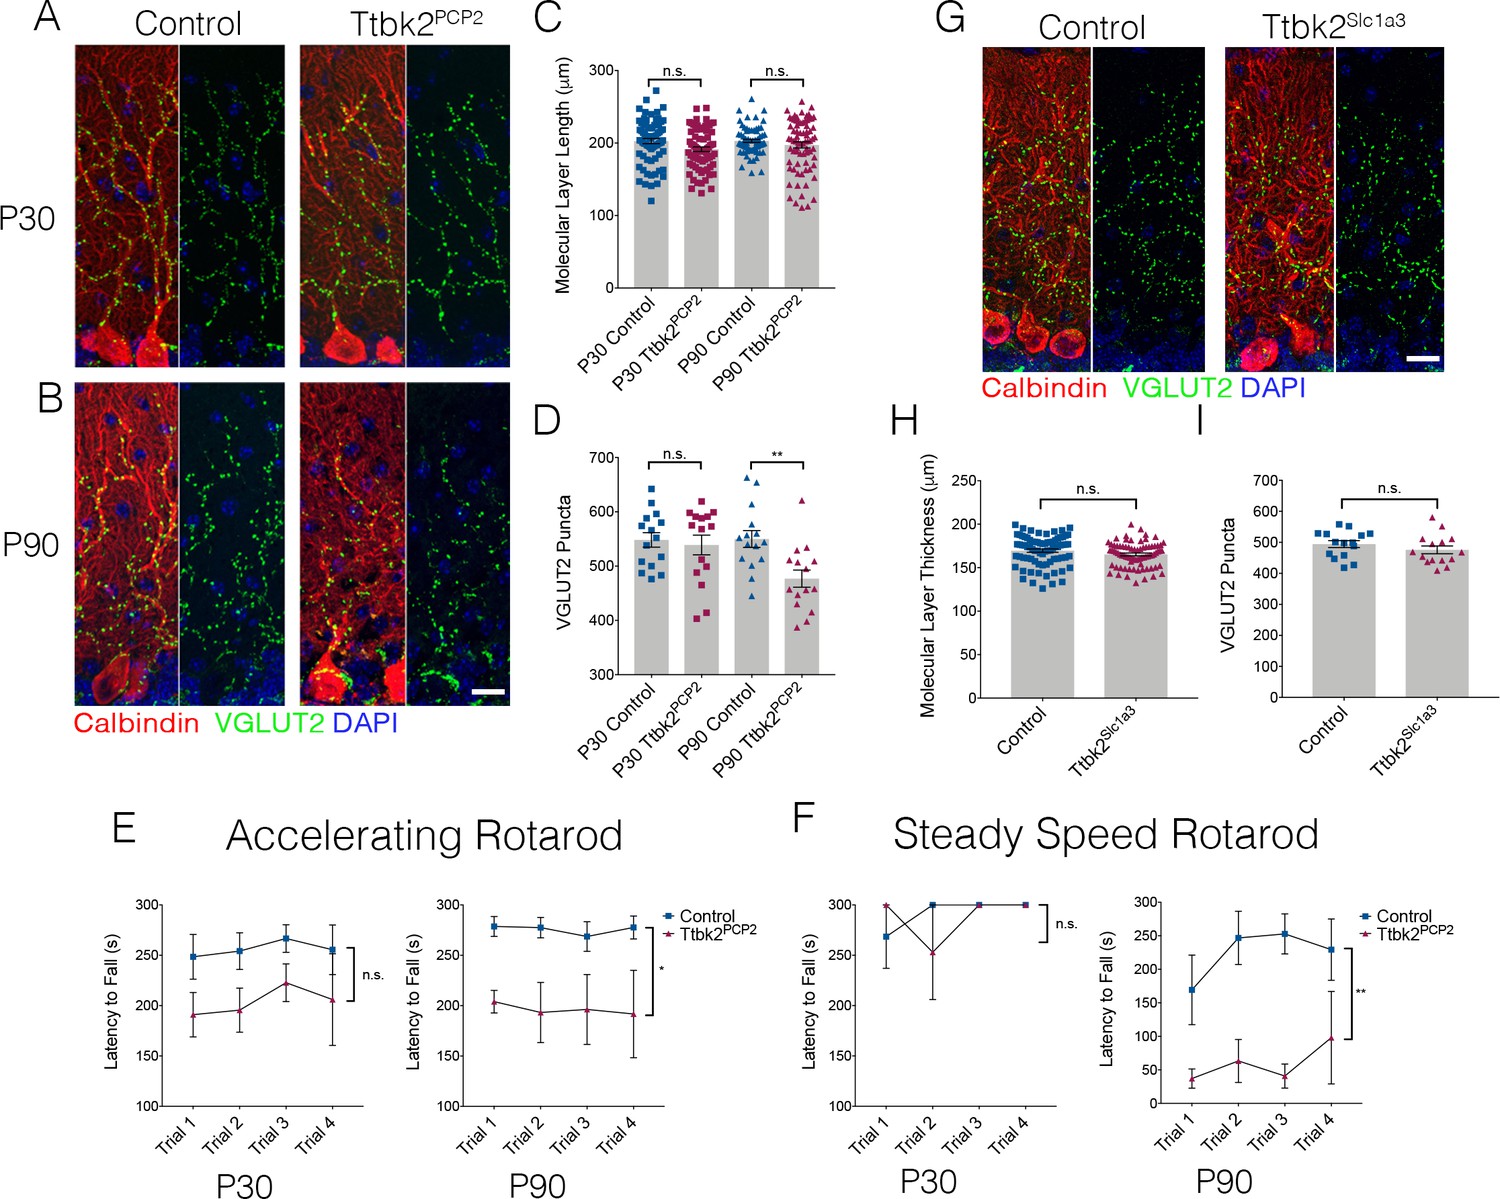
(A,B) Representative images of Control and Ttbk2f/f;Pcp2Cre+ (Ttbk2Pcp2) animals at age P30 (A) and P90 (B), immunostained for Calbindin to label PCs (red), VGLUT2 to label synapses (green), and nuclei (blue). VGLUT2 terminals are reduced in P90 Ttbk2Pcp2 animals compared to P30 Ttbk2Pcp2 animals. Scale bar = 20 μm. (C) Quantification of molecular layer thickness in P30 and P90 Ttbk2Pcp2 and Control animals (each point represents one measurement, 75 measurements per genotype. n = 3 animals. No significant difference reported by one-way ANOVA with Tukey correction, error bars indicate SEM. (D) Quantification of VGLUT2+ puncta analysis in P30 and P90 Ttbk2Pcp2 and Control animals. There are no differences in the number of puncta at P30; however these are significantly reduced by P90 (each point represents one field analyzed, five fields analyzed per animal, n = 3 animals. p=0.0098 by one-way ANOVA with Tukey correction, error bars indicate SEM). (E) Accelerating rotarod performance test of Ttbk2Pcp2and littermate Controls from P30 to P90. Ttbk2Pcp2 animals have a significantly shorter latency to fall time at P90 compared to P30 (a two-way ANOVA with Bonferroni’s multiple comparison test was used for calculating significance. p=0.1051 for P30 accelerating rotarod test, and p=0.0161 for P90 accelerating rotarod test). (F) Steady speed rotarod performance test of Ttbk2Pcp2 and littermate Controls aging from P30 to P90. At P30 Ttbk2Pcp2 animals do not have a shorter latency to fall time compared to Controls on the steady speed rotarod. However, by P90 there is a drastic reduction in latency to fall time for Ttbk2Pcp2 animals compared to Controls, indicative of impaired motor ability with age (a two-way ANOVA with Bonferroni’s multiple comparison test was used for calculating significance. p=0.7819 for P30 steady speed rotarod test, and p=0.0023 for P90 steady speed rotarod test. n = 6 animals for Control, n = 4 animals for Ttbk2Pcp2). (G) Representative images of Control and Ttbk2fl/fl;Slc1a3-CreER (Ttbk2Slc1a3) animals at 4 months of age (3 months post TMX) treatment, immunostained for Calbindin to label PCs (red), VGLUT2 to label synapses (green) and nuclei (blue). Unlike Ttbk2c.mut and Ttbk2Pcp2 mice, there is no loss of VGLUT2 synapses throughout the PC dendrites of Ttbk2Slc1a3 mice relative to Controls. (H) Quantification of molecular layer length in Ttbk2Slc1a3 and Control animals (each point represents one measurement, 75 measurements per genotype. n = 3 animals. No significance reported by student’s unpaired t-test, error bars indicate SEM). (I) Quantification of VGLUT2+ puncta analysis in Ttbk2Slc1a3 and Control animals. There is no difference in the numbers of puncta between these conditions (each point represents a field analyzed, five images analyzed per animal, n = 3 animals. No significance reported by student’s unpaired t-test, error bars indicate SEM).
Figure 3—figure supplement 1
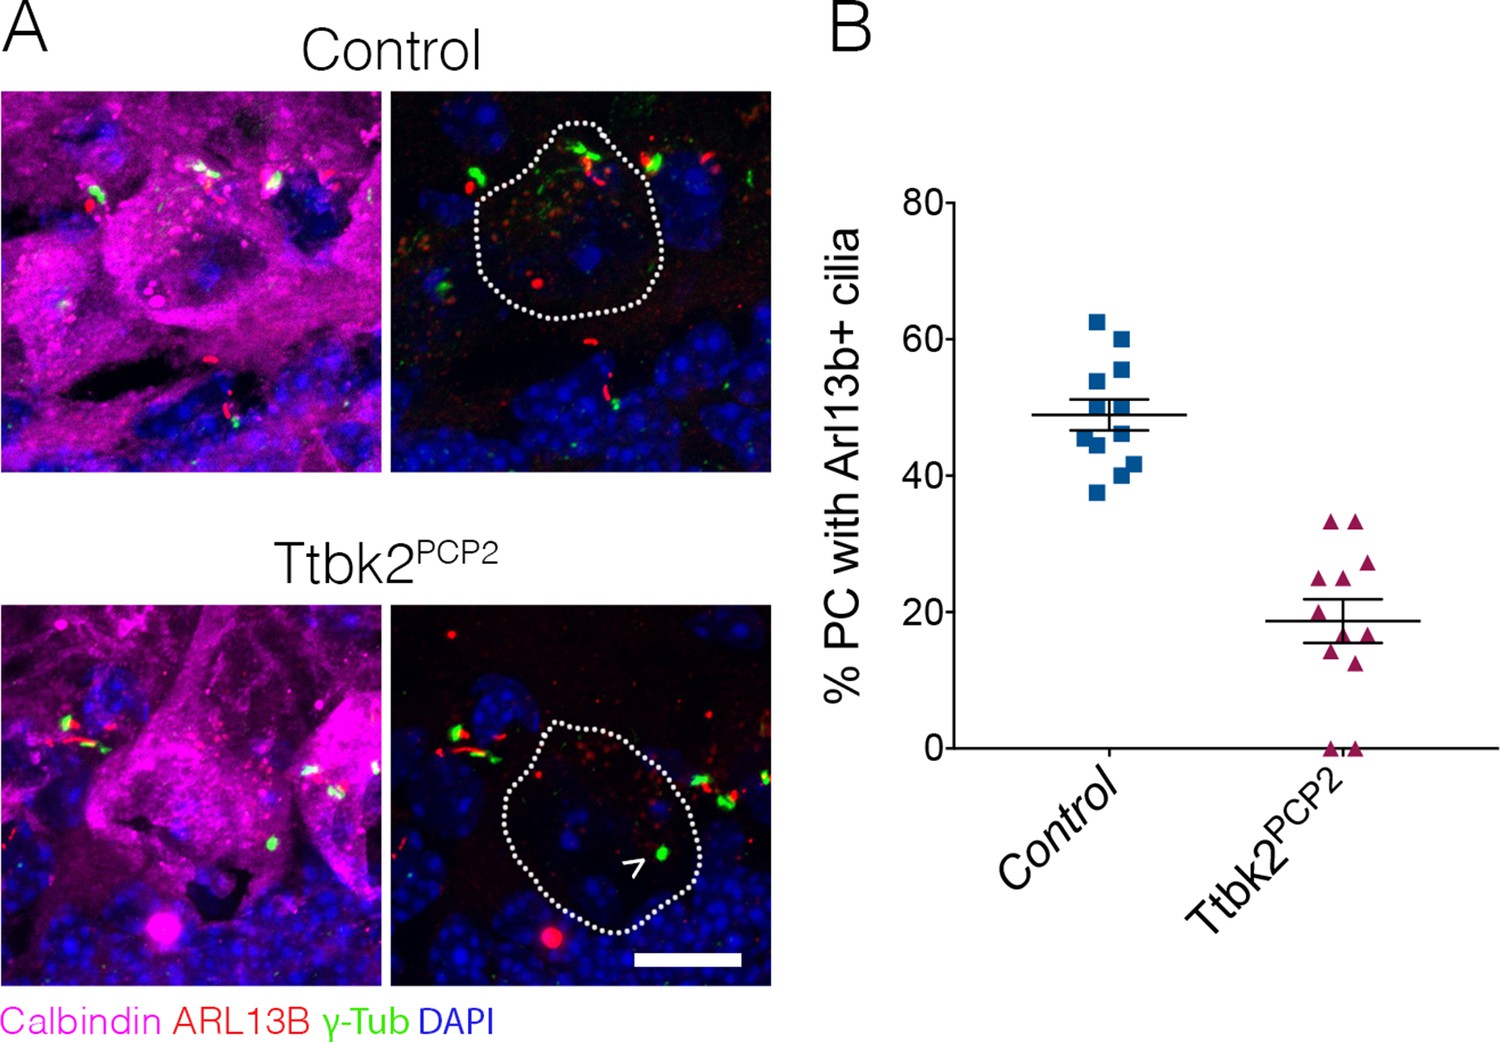
Cilia are lost from PCs in Ttbk2Pcp2 cerebellum.
(A) Images showing cilia localized to PCs soma in Control, and a centrosome lacking a primary cilium (arrowhead) in Ttbk2Pcp2 PCs. PCs are stained for Calbindin (magenta), cilia are stained for ARL13B (red), and centrosomes are stained for γ-tubulin (green). Scale bar = 15 μm. (B) Quantification of cilia loss on PCs. Each point represents a 10 μm z-stack image of Purkinje cell layer (PCL )counted using a 63x objective. Control = 120 PCs counted, Ttbk2Pcp2 = 84 PCs counted. n = 3 animals. p<0.0001 by unpaired student’s t-test, error bars represent SEM.
Figure 4 with 2 supplements
Aged Ttbk2c.mut animals lose Purkinje cells.
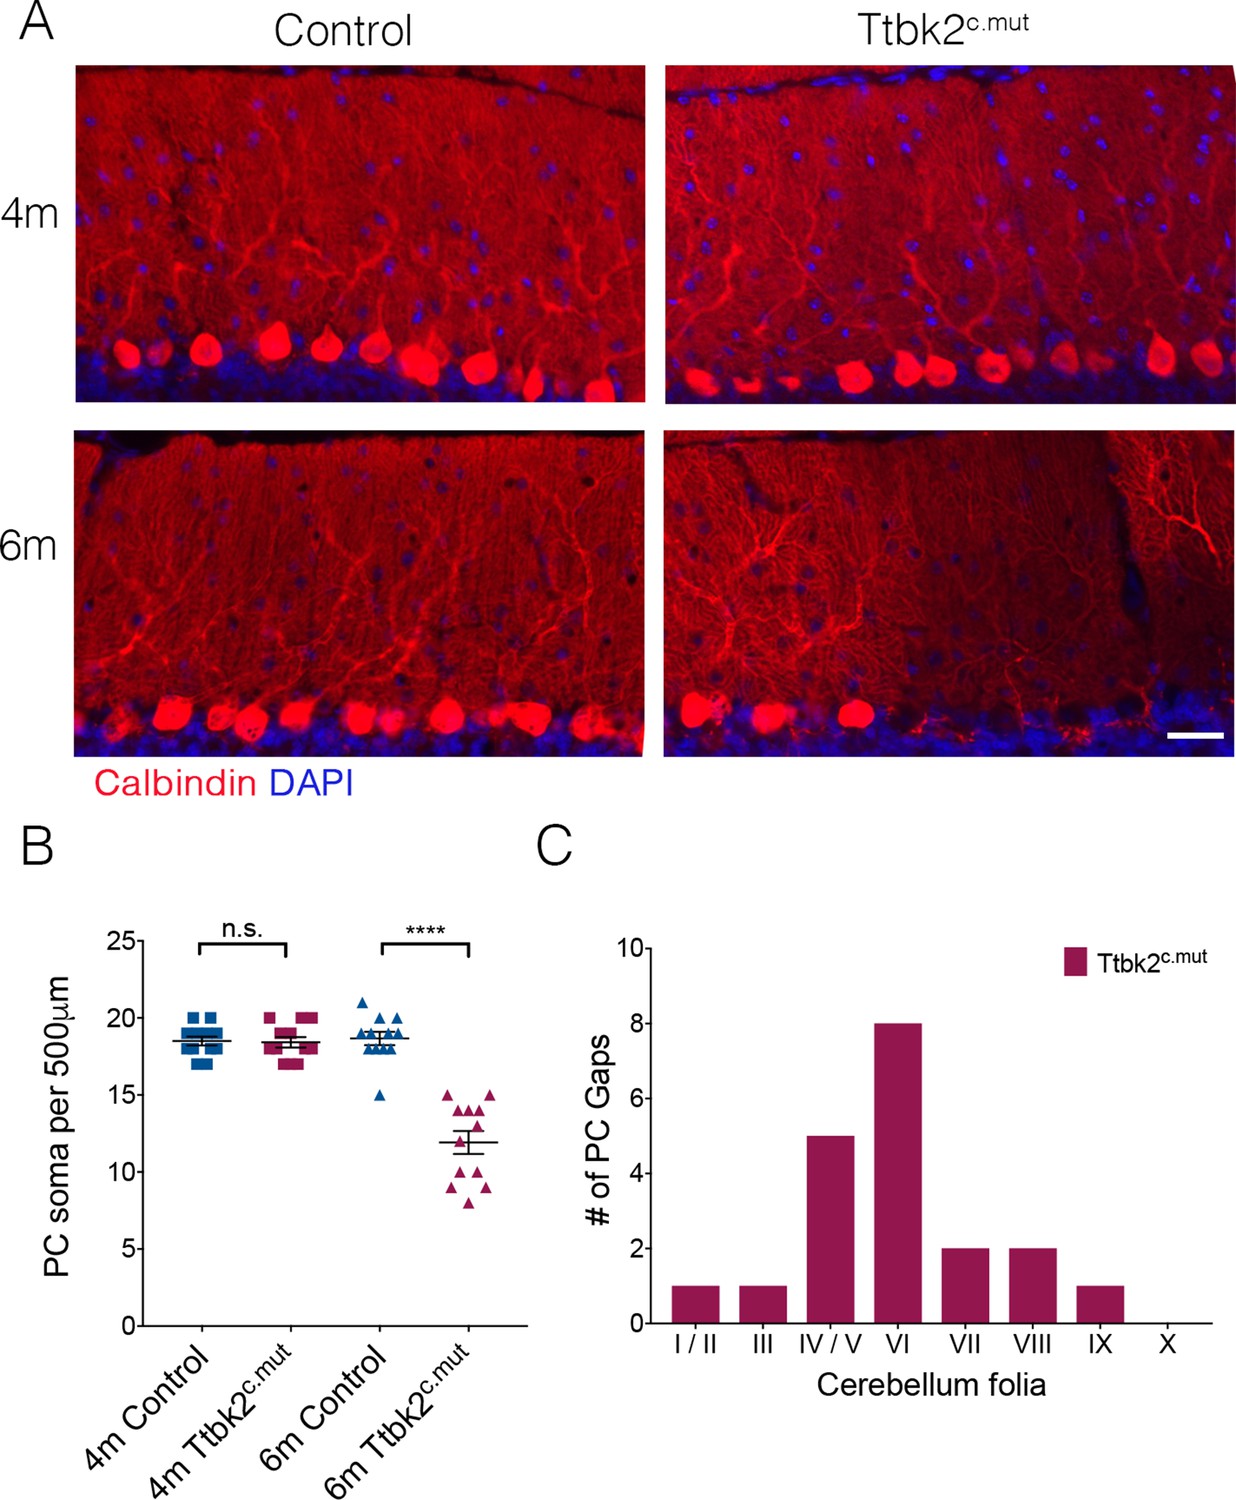
(A) Representative images showing folia of 4-month-old Ttbk2c.mut (top) and 6-month-old Ttbk2c.mut animals (bottom) with respective littermate Controls. Cerebellum tissue is stained for Calbindin to show PC. 6-month-old Ttbk2c.mut have large stretches of folia missing Calbindin+ PC soma compared to 4-month-old Ttbk2c.mut. Scale bar 50 μm. (B) Quantification of the loss of PC soma along 500 μm stretch of the primary fissure (n = 36 measurements across three animals. p<0.0001 by student’s unpaired t-test, error bars indicate SEM). (C) Quantification of location of PC gaps in Ttbk2c.mut animals. PC gaps are present throughout folia I-IX in Ttbk2c.mut animals but are not seen in Controls. A threshhold of more than two cell spaces was used to define a PC gap. 10 cerebellar slices were quantified, n = 3 animals.
Figure 4—figure supplement 1
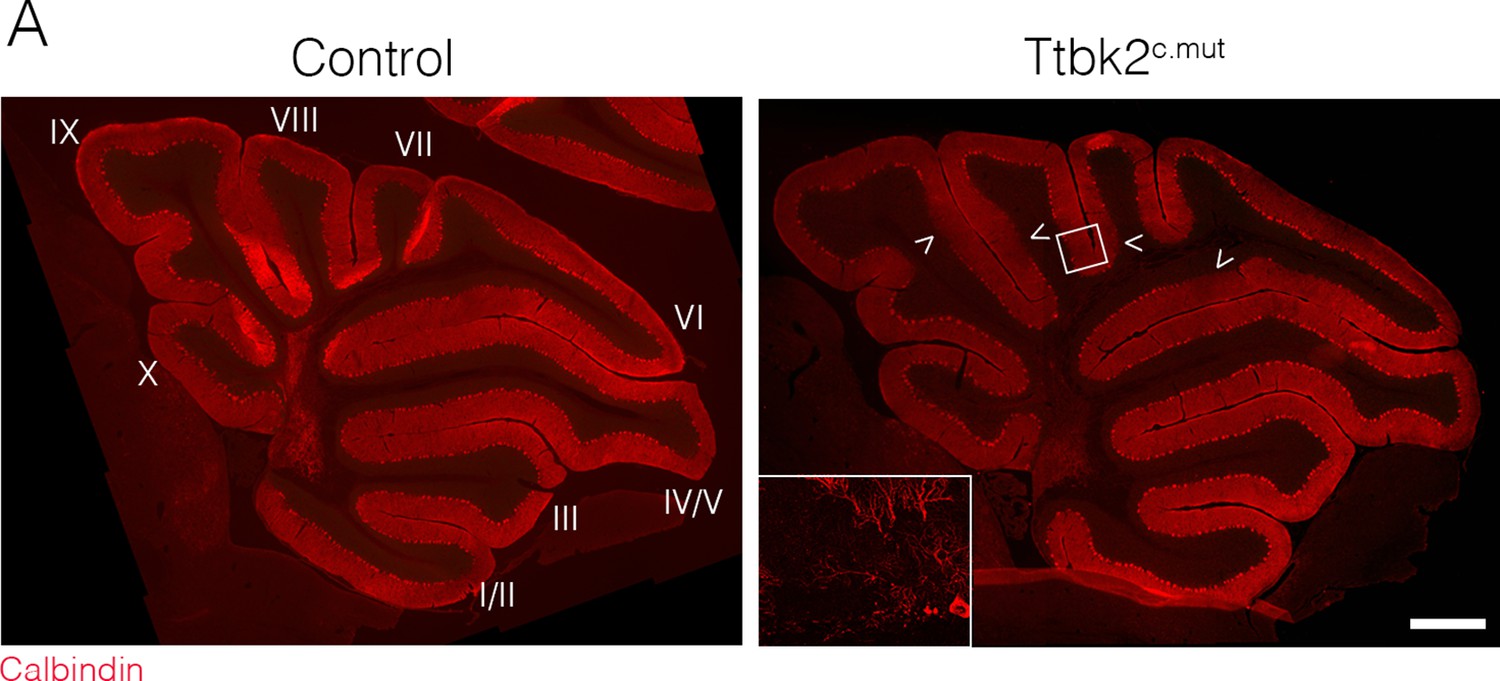
PC gaps are present throughout most cerebellar folia in 6-month -old Ttbk2c.mut animals.
(A) Representative images of Calbindin staining (red) throughout the cerebellum of 6-month-old Control and Ttbk2c.mut animals. Arrowheads denote gaps in folia present in Ttbk2c.mut animals. Scale bar = 200 μm. Inset shows typical PC gap at higher magnification.
Figure 4—figure supplement 2
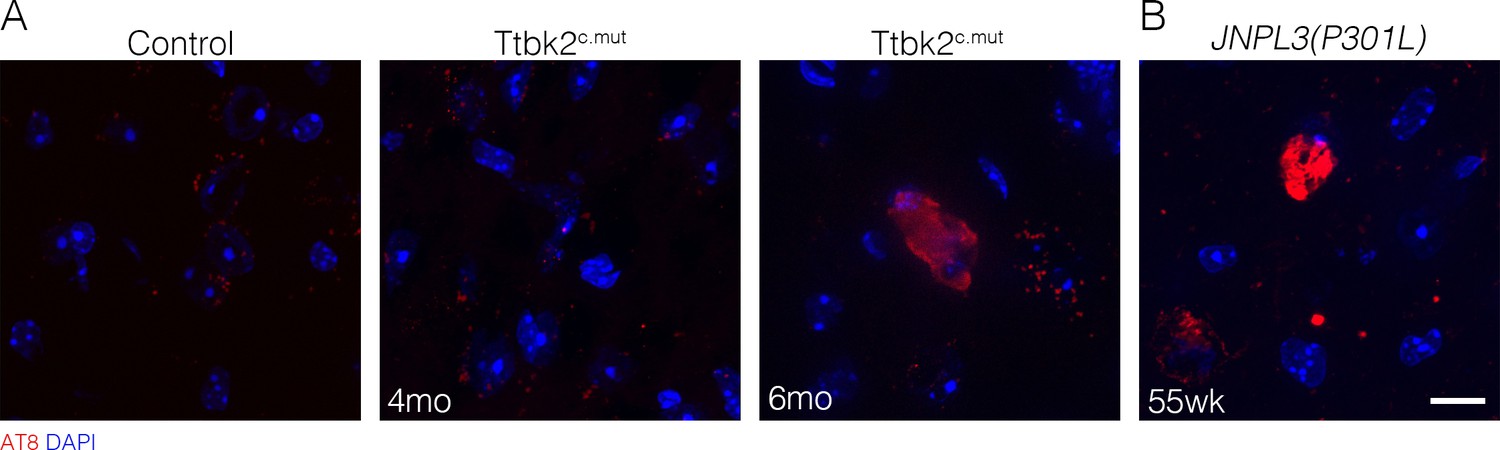
Neurons in the cortex of 6-month-old Ttbk2c.mut animals have some Tau accumulation.
(A) Representative images of neurons in the cortex of 6-month-old Control, 4-month-old Ttbk2c.mut, 6-month-old Ttbk2c.mut and 55-week-old JNPL3(P301L) (B) animals showing AT8 phosphorylated Tau in red. JNPL3(P301L) mice express mutated Tau and were used as a positive Control for Tau accumulation. We did not detect any phosphorylated Tau in 4-month-old Ttbk2c.mut animals; however, some neurons in the cortex of 6-month-old Ttbk2c.mut have mild accumulation of phosphorylated Tau. Scale bar = 10 μm.
Figure 5 with 1 supplement
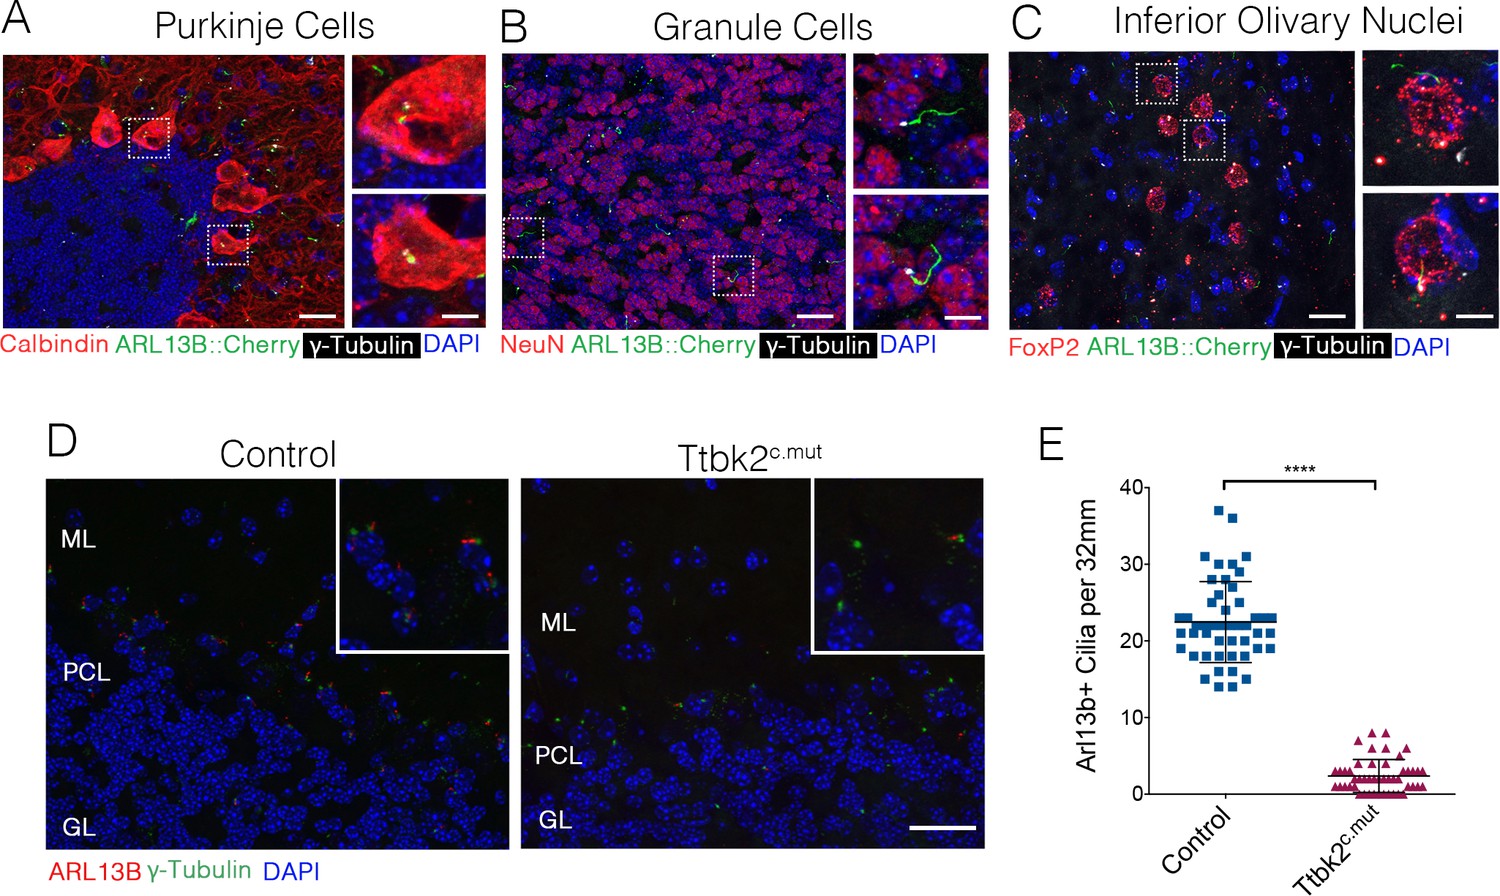
Ttbk2 is critical for primary cilia stability on neurons.
(A–C) Representative images of cilia on indicated cell types throughout parts of the cerebellum and medulla. Sections from a mouse expressing an ARL13B-mCherry transgene (green) (Bangs et al., 2015) immunostained for γ-Tubulin to label centrosomes (white), and various cell specific markers such as Calbindin to label Purkinje cells (A), NeuN to label granule neurons (B), and FoxP2 to label neurons within the inferior olivary nucleus (C). Insets show boxed areas. Scale bar = 50 μm, 10 μm for insets. (D) Representative images illustrating cilia loss in the cerebellum 20 days after TMX treatment. Sections were immunostained for ARL13B to label cilia (red) and γ-Tubulin to label centrosomes (green). For quantification purposes images were taken at the nexus between the molecular layer (ML) and granule layer (GL) with the r PCL in the middle of the imaging field where there is an abundance of cilia. Scale bar = 50 μm. (E) Quantification of cilia loss after TMX treatment (n = 36 images counted, three animals, p<0.0001 student’s unpaired t-test, error bars indicate SEM).
Figure 5—figure supplement 1
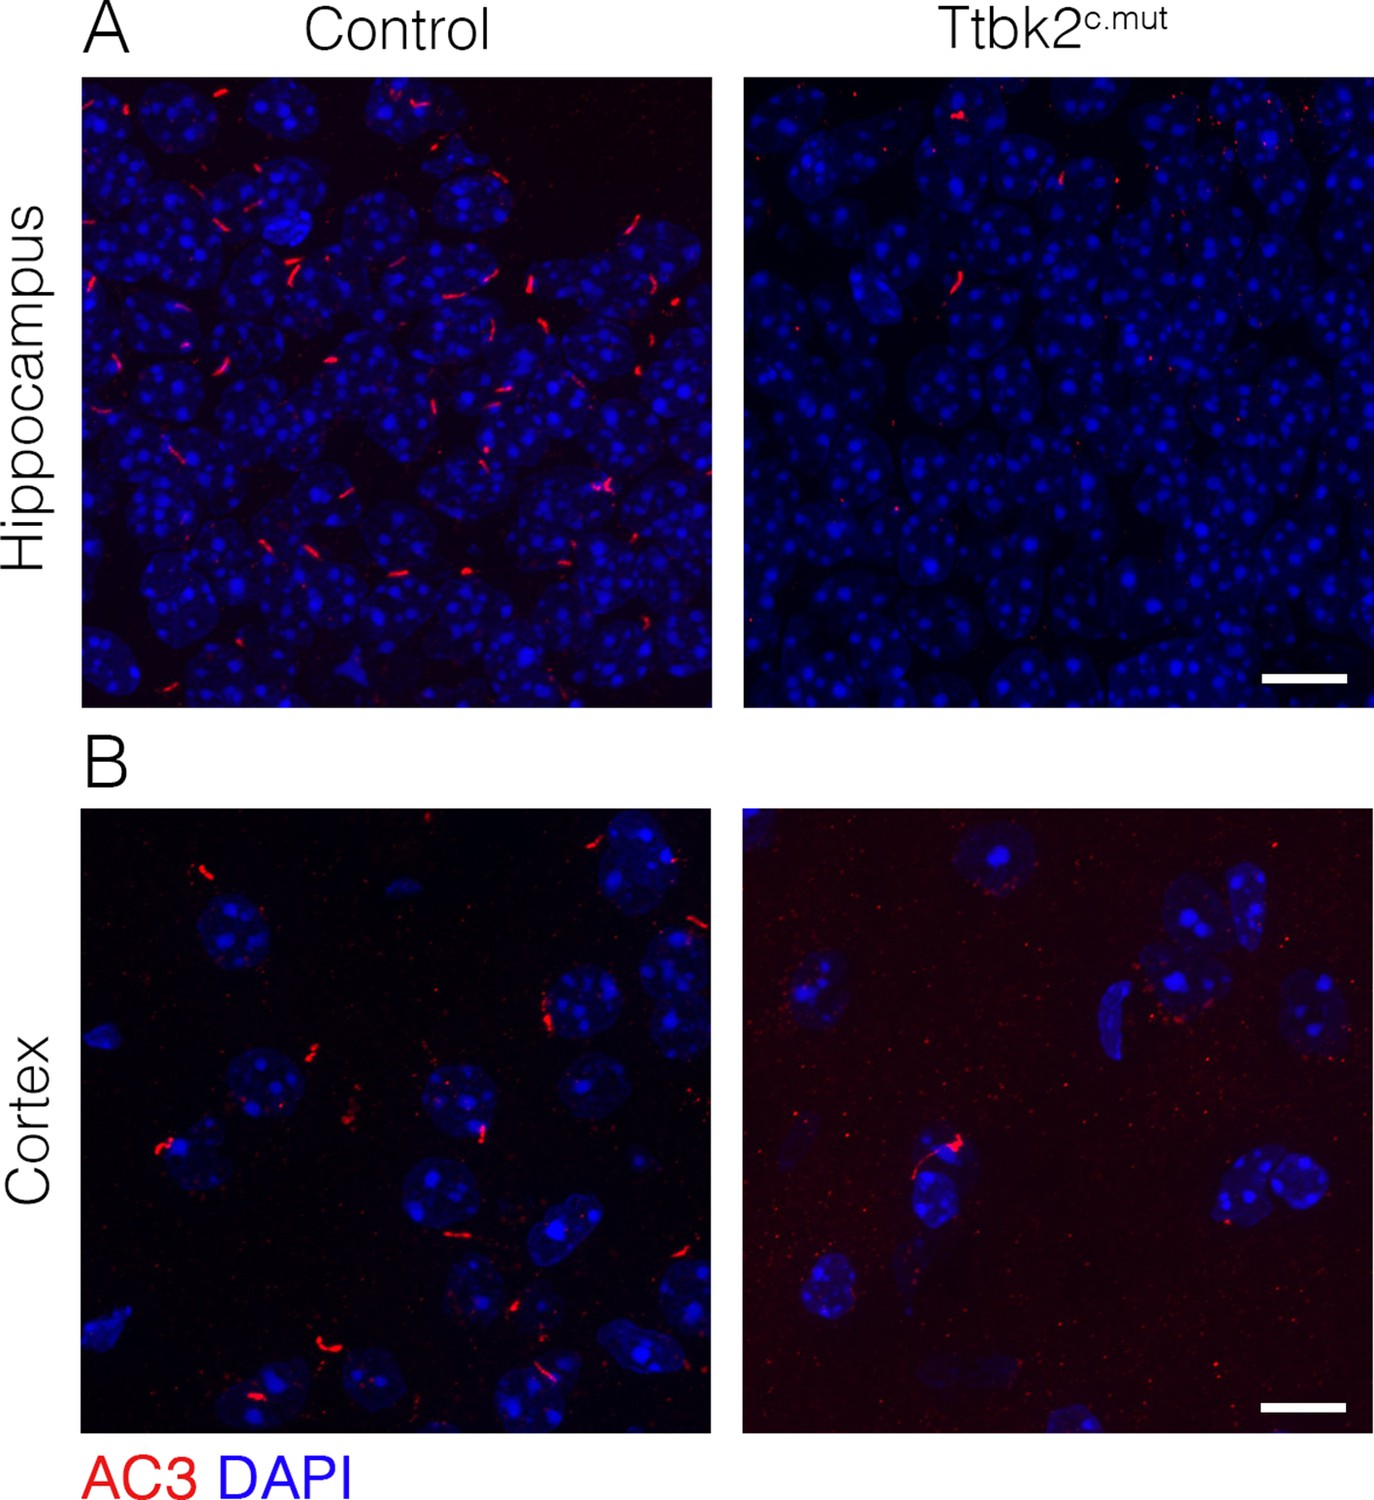
Cilia are lost throughout the brain of Ttbk2c.mut animals.
(A,B) Sagittal sections of Ttbk2c.mut brains stained for AC3 to label cilia (red) and DAPI for nuclei. Neurons in the hippocampus (A) and the cortex (B) have lost cilia 3 months after tamoxifen injections in Ttbk2c.mut animals. Scale bar = 20 μm.
Figure 6
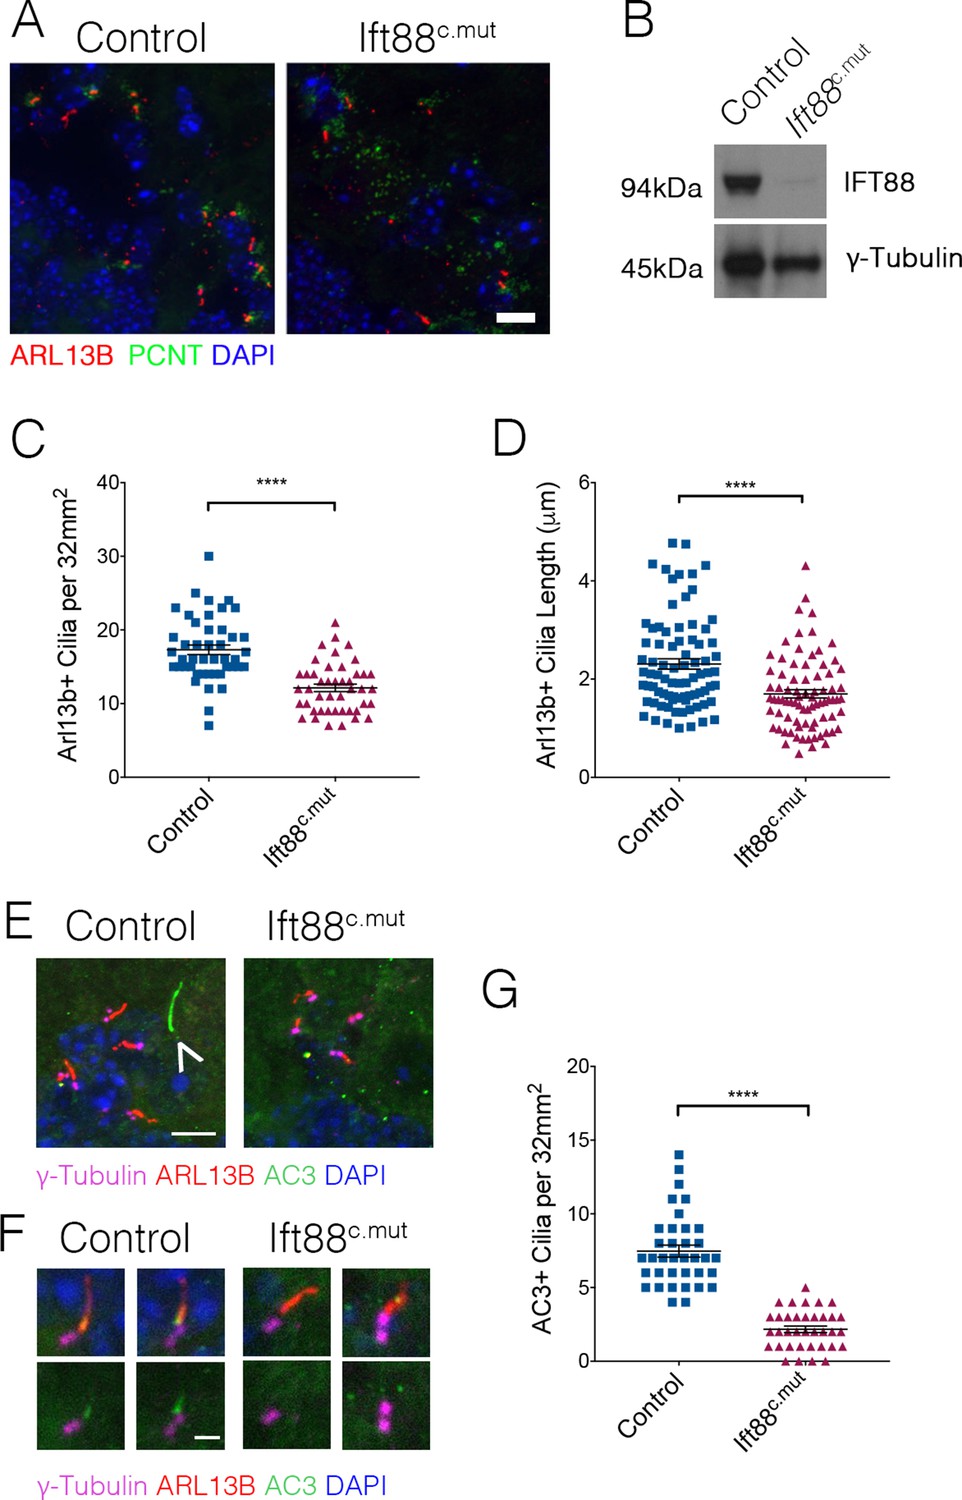
Ift88c.mut have fewer, shorter cilia throughout the cerebellum and mislocalization of ciliary membrane markers.
(A) Representative images illustrating cilia loss in the cerebellum of Ift88c.mut animals, immunostained for ARL13B to label cilia (red), Pericentrin (PCNT) to label centrosomes (green) and nuclei (blue) Scale bar = 20 μm. (B) Western blot analysis of IFT88 in cerebellum lysate 3 months after TMX injections in Ift88c.mut animals. (C) Quantification of cilia loss. Compared to Ttbk2c.mut mice, cilia loss is less dramatic in the cerebellum of Ift88c.mut animals (each point represents a field scored, 45 fields scored per genotype. n = 3 animals. p<0.0001 by student's unpaired t-test, error bars indicate SEM). (D) Quantification of cilia length between Control and Ift88c.mut. Cilia in Ift88c.mut cerebellum are shorter (each point represents a single cilium, 80 cilia were measured for each genotype. n = 3 animals, p<0.0001 by student’s unpaired t-test, error bars indicate SEM). (E,F) Cilia from 6-month-old Control and Ift88c.mut stained for γ-Tubulin to label centrosomes (magenta), ARL13B to label cilia membrane (red), AC3 to label cilia membrane (green) and DAPI (blue). Ift88c.mut lose AC3+ cilia. (E) The arrow indicates a cilium that is AC3+/ARL13B-. Scale bar = 5 μm (E) and 1 μm (F). (G) Quantification of AC3+ cilia throughout the cerebellum. Ift88c.mut animals have a strong reduction in AC3+ cilia localization (each point represents a field scored, 36 field scored per genotype. n = 3 animals. p<0.0001 by student’s unpaired t-test, error bars indicate SEM).
Figure 7
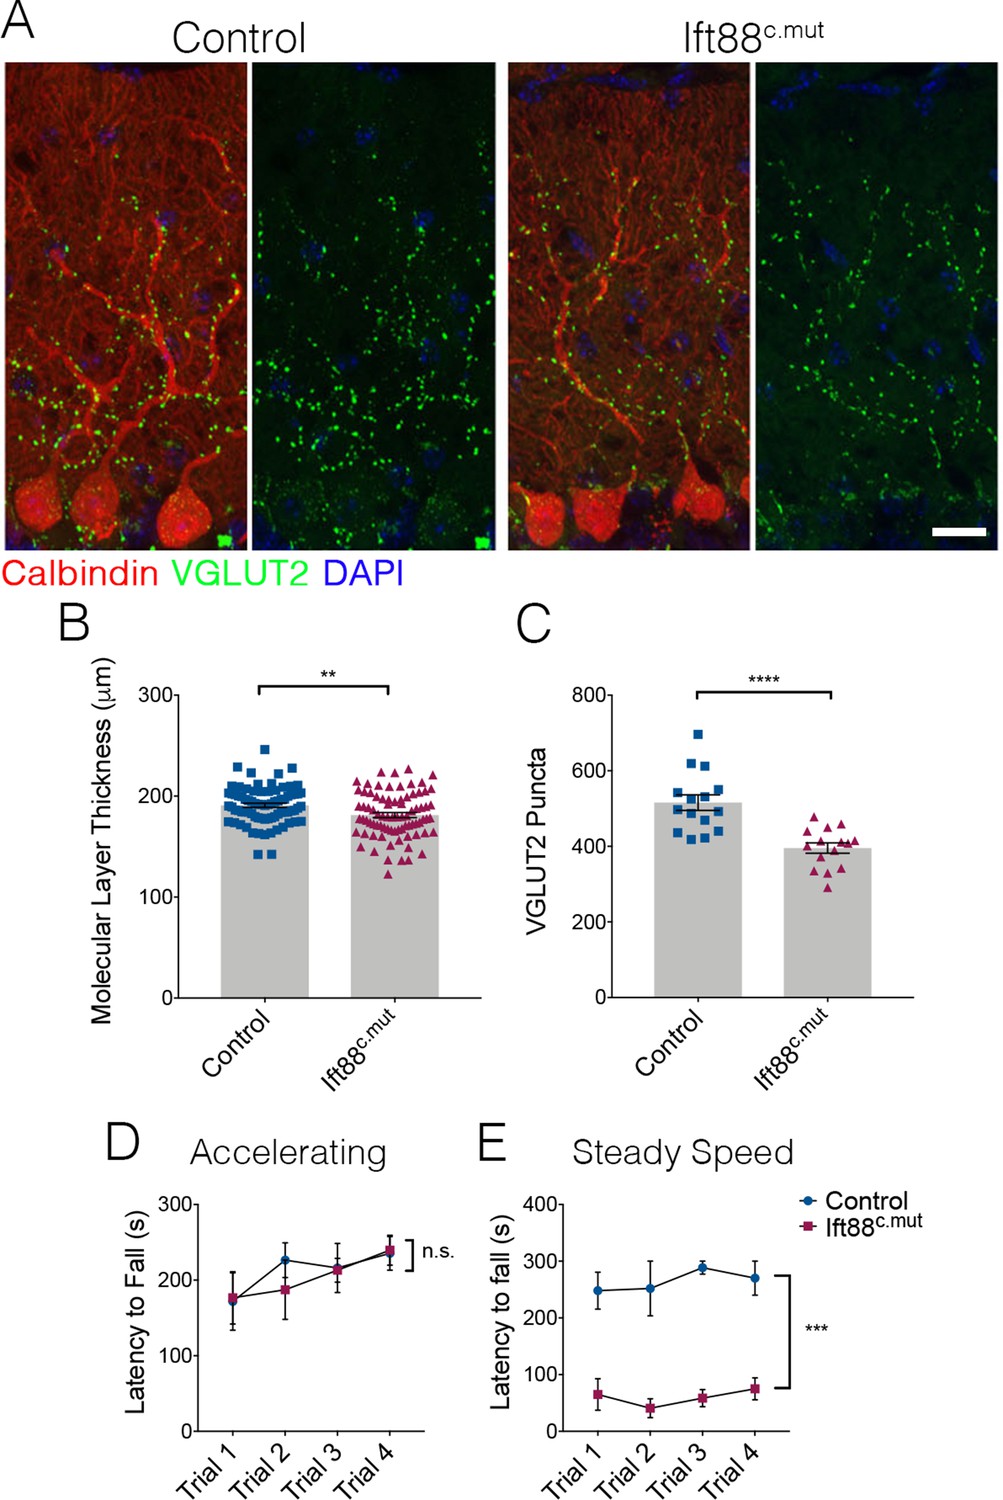
Loss of IFT88 recapitulates neurodegenerative phenotypes of Ttbk2c.mut animals.
(A) Cerebellar tissue from Control and Ift88c.mut mice at 3 months after loss of Ift88, immunostained for Calbindin to label Purkinje cells (red) and VGLUT2 to show climbing fiber synapses (green). Ift88c.mut animals show a reduction in VGLUT2 positive synapses throughout the cerebellum 3 months after loss of IFT88. Scale bar = 50 μm. (B) Molecular layer length quantification of Ift88c.mut animals compared to littermate Controls. Each point represents one measurement, >75 measurements taken per genotype. n = 3 animals. p=0.0037 by unpaired student’s t-test, error bars indicate SEM. (C) Quantification of loss of VGLUT2 synapses along PC dendrites in Ift88c.mut animals. Each point represents a field analyzed, with five images analyzed per animal, n = 3 animals. p<0.0001 by unpaired student’s t-test, error bars indicate SEM. (D, E) Accelerating and steady speed rotarod performance test between Ift88c.mut and littermate Controls. Ift88c.mut animals do not have a significance difference in latency to fall time on the accelerating rotarod; however, the steady speed rotarod test showed a significantly shorter latency to fall time compared to Controls (a two-way ANOVA with Bonferroni’s multiple comparison test was used for calculating significance. p=0.8343 for accelerating rotarod test, and p=0.0005 for steady speed. n = 6 animals for Control, n = 4 animals for Ift88c.mut).
Figure 8
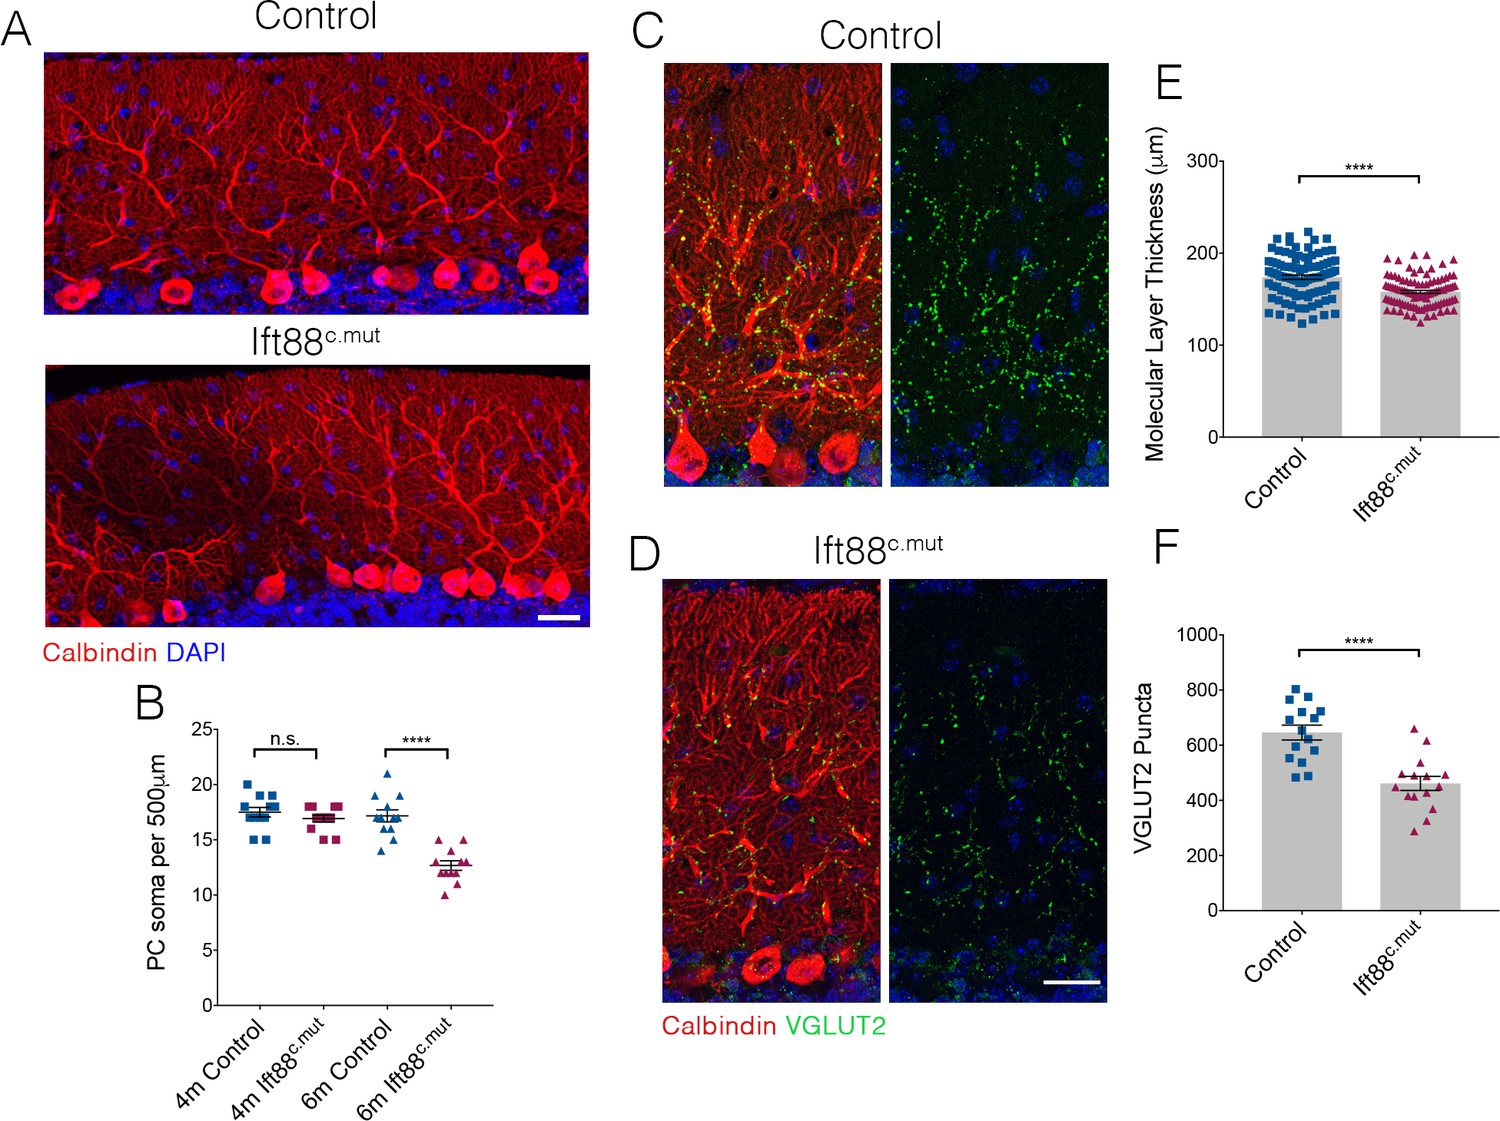
Loss of PCs occurs in Ift88c.mut mice by 6 months of age.
(A) Cerebellar folia from Control and Ift88c.mut at 6 months of age, 5 months after loss of Ift88, stained for Calbindin (red) and DAPI (blue). 6-month-old Ift88c.mut mice begin to show PC gaps throughout cerebellar folia indicating loss of PC. Scale bar = 50 μm. (B) Quantification of number of PC soma per 500 μm stretch of folia on the primary fissure between Control and Ift88c.mut at 4 months and 6 months of age. 6-month-old Ift88c.mut show a reduced number of PC soma throughout the cerebellum (each point represents one measurement, 12 measurements were made per condition. n = 3 animals per condition. p<0.0001 by one-way ANOVA between all conditions, error bars indicate SEM). (C, D) 6-month-old cerebellar tissue from Control and Ift88c.mut mice immunostained for Calbindin to label PC (red) and VGLUT2 to show climbing fiber synapses (green) and DAPI (blue). Ift88c.mut animals show a reduction in VGLUT2 positive synapses throughout the cerebellum. Scale bar = 50 μm. (E) Quantification of molecular layer thickness between 6-month-old Control and Ift88c.mut animals. Ift88c.mut have shorter folia compared to littermate Controls (each point represents one measurement, >75 measurements taken per genotype. n = 3 animals. p<0.0001 by unpaired student’s t-test, error bars indicate SEM). (F) Quantification of loss of VGLUT2 synapses along PC dendrites in 6-month-old Ift88c.mut animals. Ift88c.mutshow a loss similar to the loss seen in 4-month-old Ift88c.mut animals (each point represents a field analyzed, with 5 images analyzed per animal, n = 3 animals. p<0.0001 by unpaired student’s t-test, error bars indicate SEM).
Tables
Key resources table
| Reagent type (species) or resource | Designation | Source or reference | Identifiers | Additional information |
|---|---|---|---|---|
| Genetic reagent (M. musculus) | Ttbk2tm1a(EUCOMM)Hmgu | International Mouse Strain Resource | ||
| Genetic reagent (M. musculus) | Actb:FLPe | The Jackson Laboratory | #003800 | |
| Genetic reagent (M. musculus) | Ift88flox | The Jackson Laboratory | #022409 | |
| Genetic reagent (M. musculus) | Ubc-CreER | The Jackson Laboratory | #007001 | |
| Genetic reagent (M. musculus) | Slc1a3-CreER | The Jackson Laboratory | #012586 | |
| Genetic reagent (M. musculus) | Pcp2-Cre | The Jackson Laboratory | #010536 | |
| Chemical compound, drug | Tamoxifen | Sigma | T5648 | Working concentration: 20 mg/mL |
| Antibody | Mouse anti-ARL13B (monoclonal) | NeuroMabs | N295B/66 | 1:500 |
| Antibody | Rabbit anti-ARL13B (polyclonal) | Proteintech | 17711–1-AP | 1:500 |
| Antibody | Mouse anti-gamma-tubulin (monoclonal) | Sigma | T6557 | 1:1000 |
| Antibody | Rabbit anti- Calbindin D28K (monoclonal) | Cell signalling technologies | 13176S | 1:250 |
| Antibody | Guinea pig anti-VGLUT2 (polyclonal) | EMD Millipore | AB2251 | 1:2500 |
| Antibody | Rabbit anti-NeuN (monoclonal) | Abcam | Ab177487 | 1:1000 |
| Antibody | Rabbit anti-AC3 (polyclonal) | Santa Cruz | SC-588 | 1:10, discontinued |
| Antibody | Rabbit anti-AC3 (polyclonal) | Abeomics | 34–1003 | 1:100 |
| Antibody | Chicken anti-GFAP (polyclonal) | EMD Millipore | AB5541 | 1:500 |
| Antibody | Rabbit anti-IP3 (monoclonal) | Abcam | AB108517 | 1:200 |
| Antibody | Rabbit anti-FoxP2 (polyclonal) | Abcam | AB16046 | 1:400 |
| Antibody | Mouse anti-AT8 (monoclonal) | Thermo | MN1020 | 1:100 |
| Software | ImageJ | ImageJ: https://imagej.nih.gov/ij/ | ||
| Software | GraphPad Prism | GraphPad Prism: https://www.graphpad.com/scientific-software/prism/ | ||
| Commercial assay or kit | FD Rapid Golgistain Kit | FD Neurotechnologies | ||
| Commercial assay or kit | BSA Protein Assay Kit | Thermo | #23227 |
Additional files
Download links
A two-part list of links to download the article, or parts of the article, in various formats.
Downloads (link to download the article as PDF)
Open citations (links to open the citations from this article in various online reference manager services)
Cite this article (links to download the citations from this article in formats compatible with various reference manager tools)
TTBK2 and primary cilia are essential for the connectivity and survival of cerebellar Purkinje neurons
eLife 9:e51166.
https://doi.org/10.7554/eLife.51166


