Causal links between parietal alpha activity and spatial auditory attention
- Boston University, United States
- University of Iowa, United States
- Carnegie Mellon University, United States
Figures
Figure 1
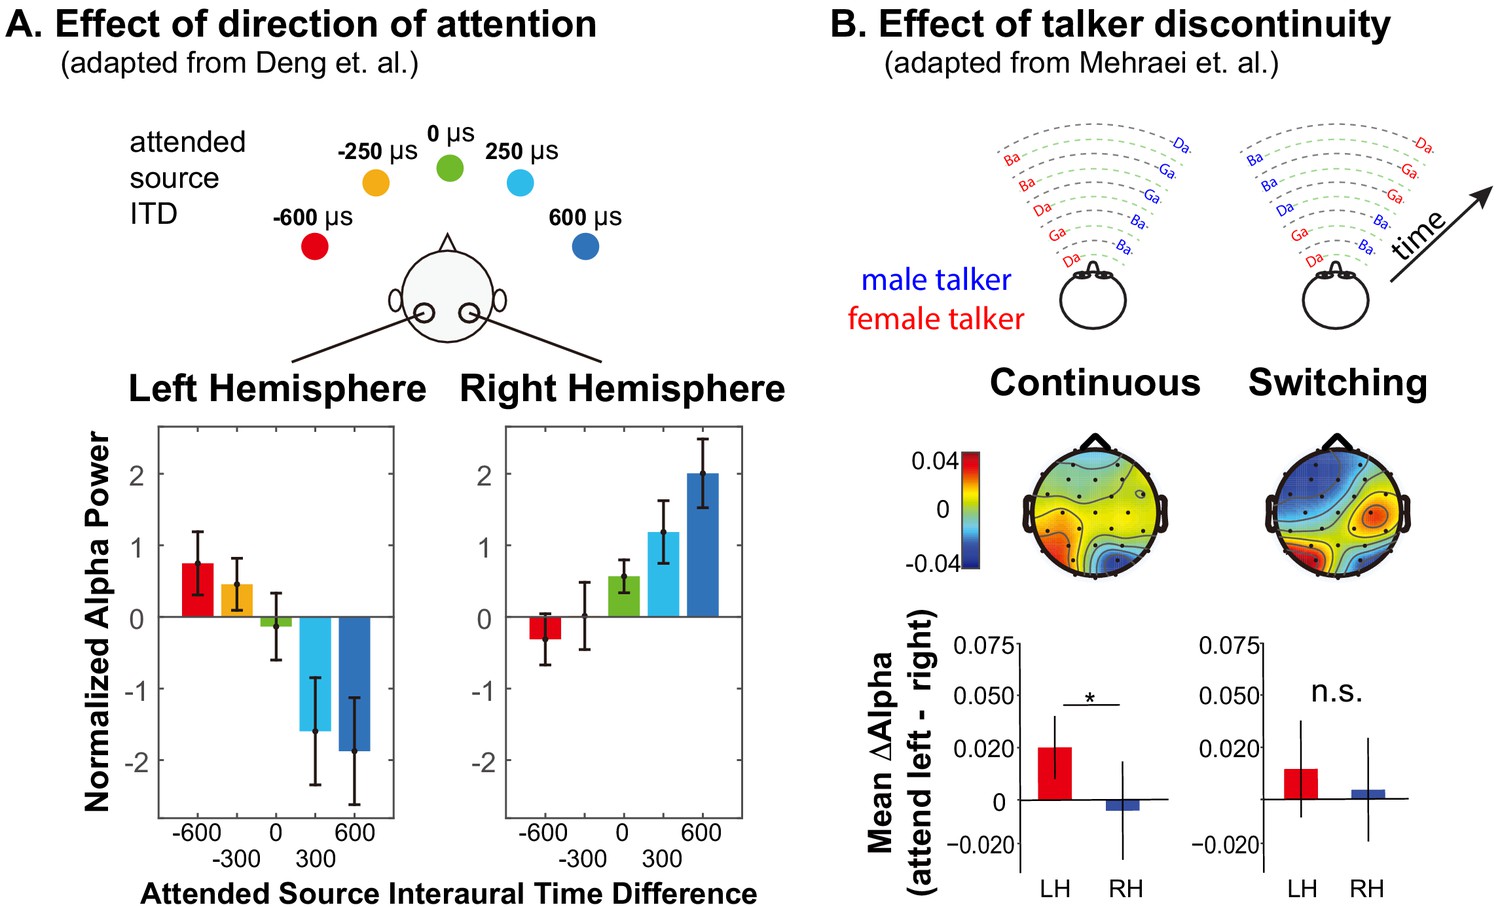
Summary of previous results exploring lateralization of alpha power during auditory spatial attention processing.
(A) Adapted with permission from Deng et al. (2020). Average normalized alpha activity (relative to global field power of alpha, calculated over N = 26 subjects) in left and right parietal EEG sensors measured in an auditory spatial attention task. Spatial attention was covertly directed to one of five different lateral positions (see top of the panel), controlled by changing the interaural time difference (ITD) of the target stimulus. The average of alpha power during a preparatory period (after an auditory cue indicating the target position, but prior to the start of the sound presentation) is shown separately for left and right parietal sensors in the left and right bottom panels, respectively. (B) Adapted with permission from Mehraei et al. (2018). Alpha lateralization goes away when a discontinuity in the target talker disrupts spatial auditory attention. Example stimuli are shown at the top for trials in which the nonspatial (talker) features of two competing speech streams are continuous (left) and when they switch, which, if it occurred, always was after the first two target syllables (right). Topographies show the normalized difference in alpha power when listeners focus attention to the left minus when they focus attention to the right (relative to the sum of the alpha power for attend-left plus attend-right), computed separately at each sensor on the scalp. Averages are computed from the moment of the potential talker switch to the end of the trial. The bottom bar graphs show the average normalized alpha change over the posterior left and posterior right channels computed from the scalp distributions. For switching trials, parietal alpha lateralization is weak after the talker change.
Figure 2

Task paradigm.
(A) Trial timeline. Subjects were instructed to foveate on a fixation dot appearing at the start of the trial. A visual cue then appeared, instructing them how to focus attention in the upcoming trial: left or right (a spatial trial) or male or female talker (a nonspatial trial). The target and distractor streams then began to play. Subjects were instructed to count the number of /ga/ syllables in the 5-syllable target stream. After the auditory stimulus, they were asked to report this count as quickly as possible. Following their response, a circle appeared around the fixation dot indicating whether they were correct or incorrect. (B) Diagrams of example stimuli for the different trial types. The first syllable always was a distractor. Syllables were temporally interdigitated, alternating between distractor and target, in a temporally regular pattern. In continuous trials, the talker from each direction was fixed throughout the trial. In switching trials, the talker from one direction alternated from syllable to syllable. (C) Session timeline. Following a brief training session, subjects performed three 20-min-long blocks of trials: pre-stimulation baseline, ‘stimulation,’ and post-stimulation. In Sham sessions, HD-tACS was ramped on and off at the start and end of the ‘stimulation’ block to blind subjects as to the condition. In Stimulation sessions, HD-tACS ramped up at the start and down at the end of the ‘stimulation’ block.
Figure 3

Hypothesized alpha power in left and right parietal hemispheres, relative to baseline, during spatial attention trials.
The top row shows the expected patterns in Sham sessions, while the bottom row shows the hypothesized effects of HD-tACS alpha stimulation of rIPS. Information is asymmetrical represented; information from the left is represented only in the right (contralateral) parietal hemisphere, while information from the right is represented most strongly in the left (contralateral) hemisphere, but also weakly in the right hemisphere. In the absence of any stimulation (top row), top-down attention should lead to a decrease in alpha power in the hemisphere contralateral to the direction of attention (allowing the dominant representation of the attended location to be processed) and an increase in the ipsilateral hemisphere (suppressing the dominant representation of the ignored location). We hypothesized that applying alpha HD-tACS to rIPS should suppress the representation of leftward space, interfering with processing of left targets (bottom left). However, alpha stimulation of rIPS should either have little effect, or perhaps enhance processing of rightward targets, as rightward top-down attention already produces strong alpha in rIPS (bottom right).
Figure 4

Behavioral performance averaged across baseline blocks in which there was no stimulation.
Talker switching significantly disrupts spatial attention, but not nonspatial attention. (A) Results from the main experiment. The left plot shows results for spatial attention, comparing continuous and switching trials; the right plot shows results for nonspatial attention. Error bars represent the across-subject standard error of the means. Double asterisks indicate statistical differences with p<0.001. (B) Results from the control experiment, laid out as in (A).
Figure 5
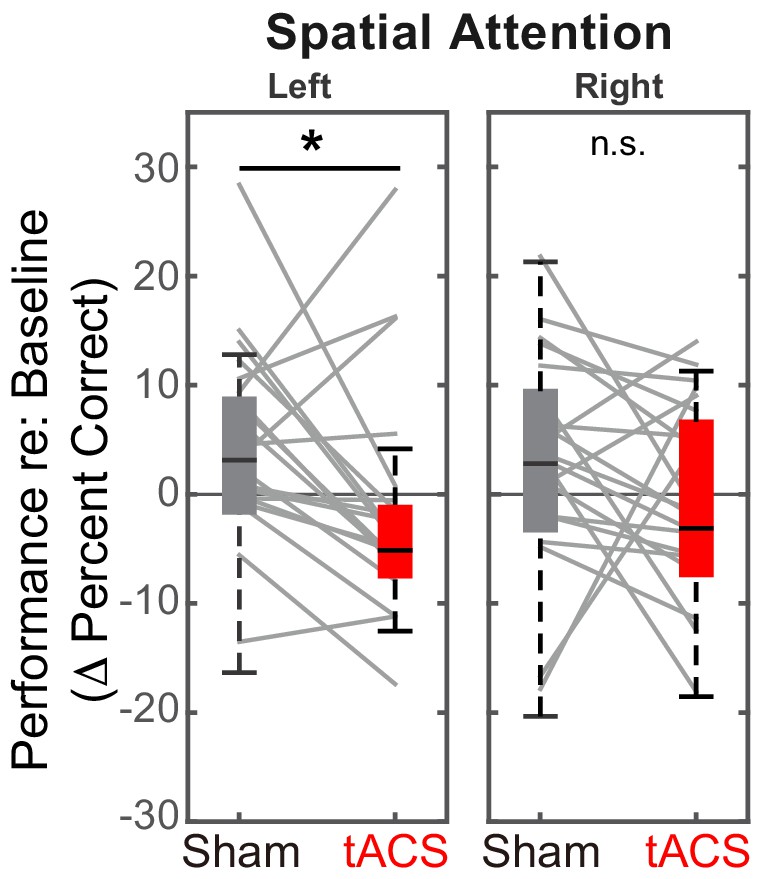
Baseline-corrected performance for spatial attention trials in the ‘stimulation’ blocks, comparing Sham and Stimulation sessions.
Parietal HD-tACS stimulation shows spatially specific and frequency-specific effects. Compared to Sham stimulation, rIPS alpha HD-tACS stimulation significantly impaired performance on attend-left trials, but had no effect on attend-right trials.
Figure 6
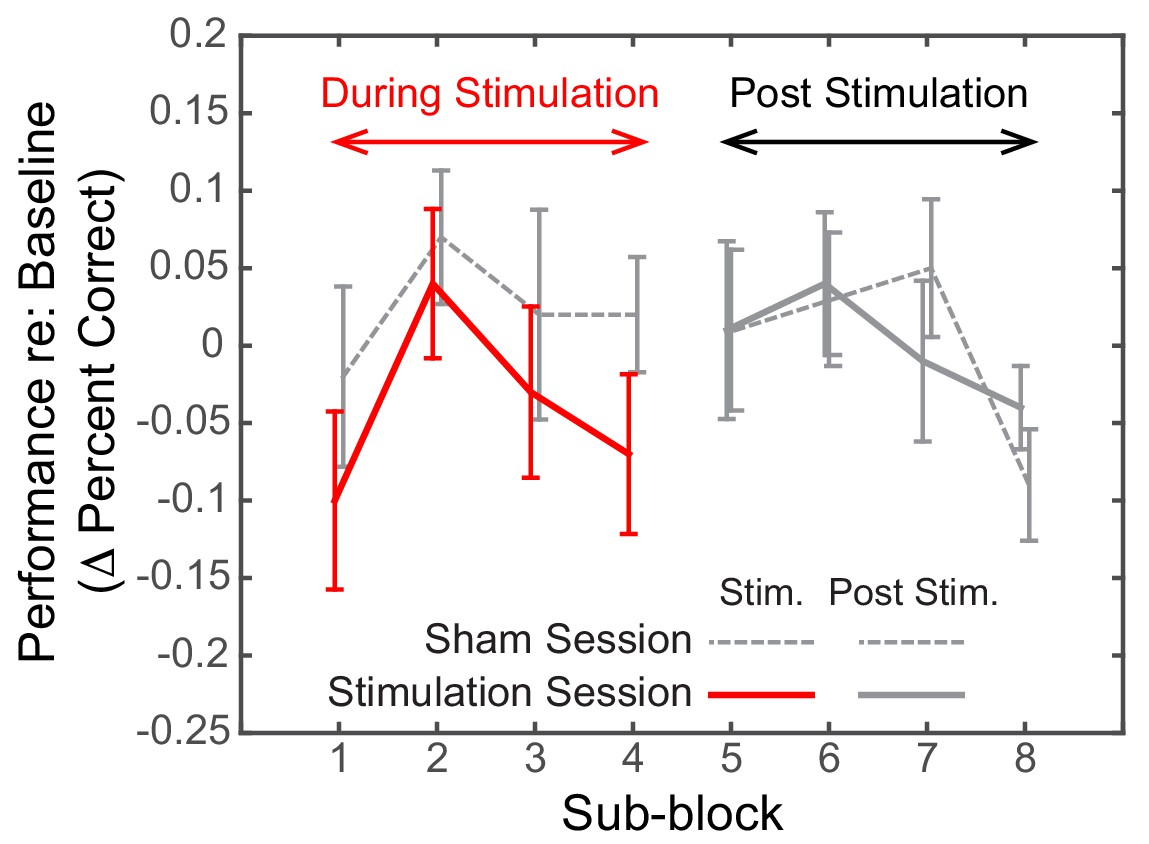
Dynamics of the effect of rIPS alpha HD-tACS stimulation on spatial, attend-left trials, comparing Sham and Stimulation sessions.
Performance is consistently poorer for alpha stimulation than for sham stimulation throughout the course of stimulation; however, performance in the sessions is indistinguishable once stimulation ends. Trials within both the ‘stimulation’ block and post-stimulation block were divided into four sub-blocks each. Baseline-corrected performance and the standard error of the mean across subjects are shown for the Sham and the Stimulation sessions (dashed and solid lines, respectively). Data from the ‘true’ stimulation sub-blocks are shown in red (the first four sub-blocks of the Stimulation session); no-stimulation sub-blocks are shown in gray (all sub-blocks of the Sham session, as well as the final four sub-blocks of the Stimulation session).
Figure 7
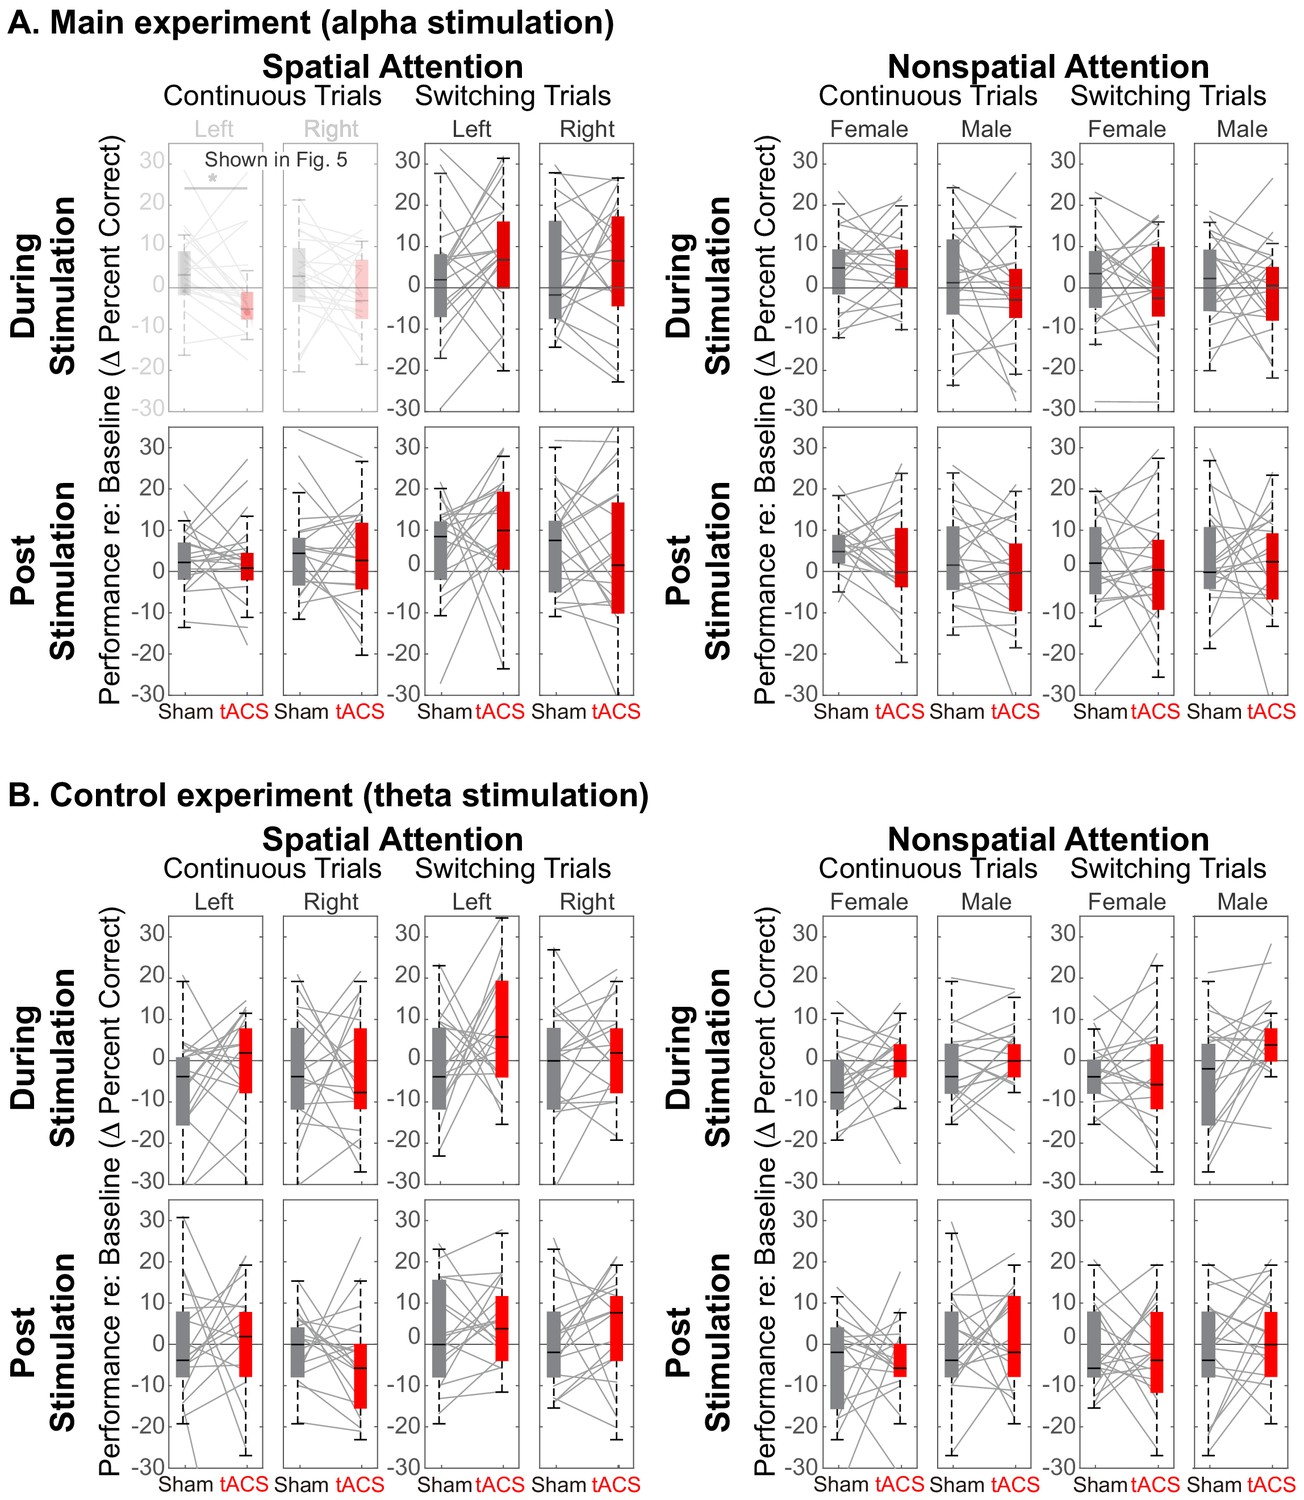
Comparison of Sham and Stimulation session results.
There is no significant effect of stimulation in any of the control conditions. (Note that the top left panels in (A) are repeated from Figure 5). (A) Results from the main experiment, using alpha HD-tACS. Results for spatial attention are shown on the left, and for nonspatial attention shown on the right. For each form of attention, results are broken down into continuous and switching trials (two leftmost and two rightmost panels, respectively). For spatial attention, results are shown for both attend-left and attend-right trials; for nonspatial attention, results are shown for attend-female and attend-male trials. Finally, results from trials during the ‘stimulation’ block are shown in the top row and from the subsequent post-stimulation block in the bottom row. (B) Results from the control experiment, using theta stimulation, laid out as in (A).
Figure 8
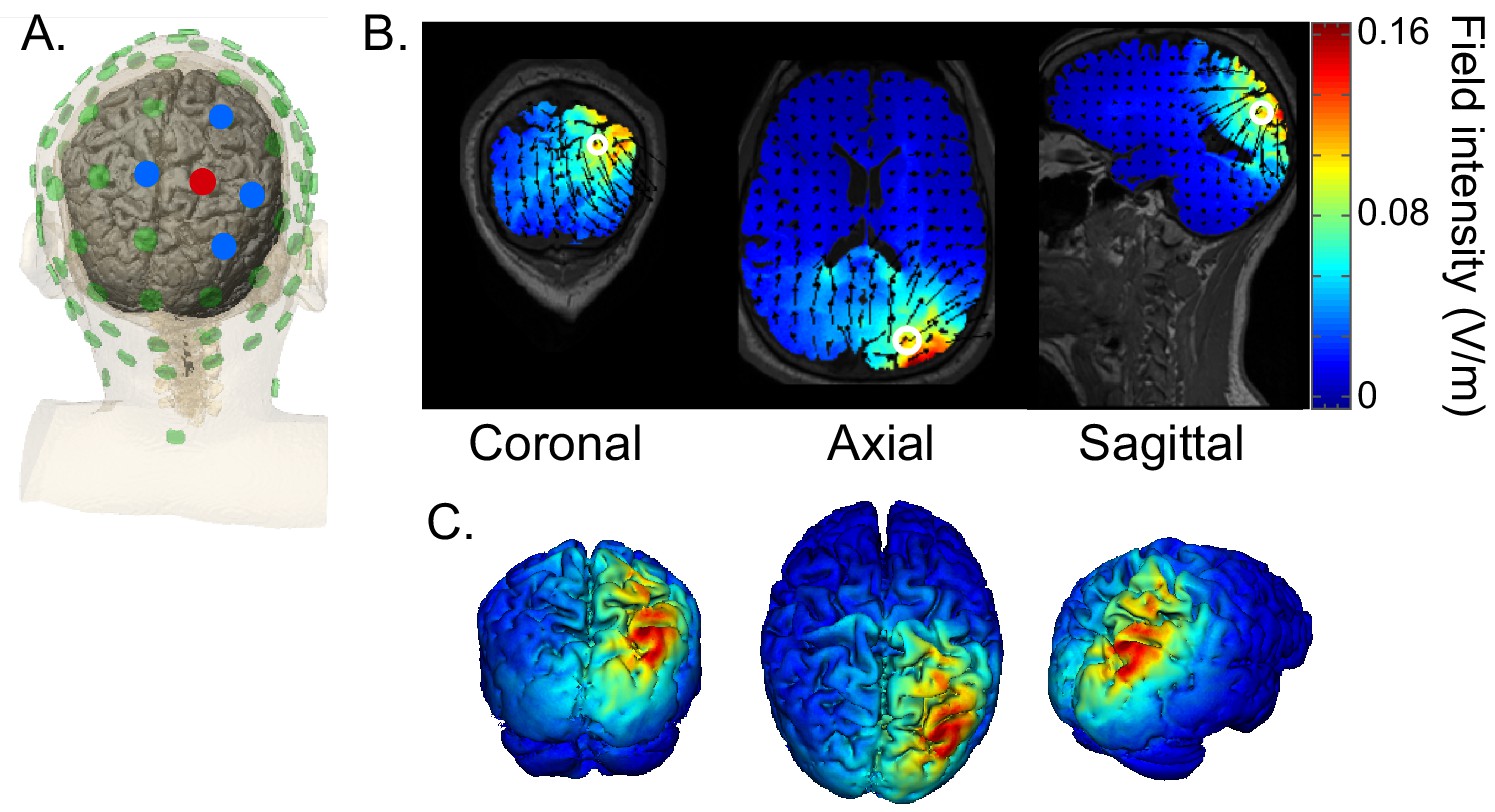
HD-tACS model, targeting rIPS.
(A) Diagram of the electrode montage. Five parietal channels (CP2, P2, P4, Pz, POz) were selected from a standard 64-channel EEG cap. The blue and red dots, indicating opposite polarities, show the chosen stimulation polarity distribution. This distribution produces a current sink targeting right intraparietal sulcus (IPS). (B) The current flow model based on the selected montage, showing 2D coronal, axial and sagittal views of the stimulation reaching each position in the brain. The open white circle indicates the targeted Montreal Neurological Institute coordinate (24, -70, 41), based on a previous fMRI study that mapped the location of human IPS (Swisher et al., 2007). (C) Three views of the 3D model simulation.
Tables
Table 1
Statistical tests comparing baseline-corrected performance in Sham and Stimulation sessions for the various types of control trials in the main experiment, laid out as in Figure 7A.
Each cell represents results of a Wilcoxon rank test with 19 degrees of freedom. Note that the primary comparisons of interest (left vs. right spatial attention for continuous stimuli during rIPS alpha stimulation; results shown in light gray) were already discussed in Section 2.3. For these conditions, results are corrected for multiple comparisons. Uncorrected statistics are reported for the remaining control conditions.
| Main experiment, using alpha stimulation | ||||||||
|---|---|---|---|---|---|---|---|---|
| Spatial attention | Nonspatial attention | |||||||
| Continuous | Switching | Continuous | Switching | |||||
| Left | Right | Left | Right | Female | Male | Female | Male | |
| During Stimulation | Z = 2.10 Padj = 0.036 | Z = 1.27 Padj = 1 | Z = 1.21 p=0.23 | Z = 0.58 p=0.56 | Z = 0.11 p=0.91 | Z = 1.08 p=0.28 | Z = 0.69 p=0.49 | Z = 0.71 p=0.48 |
| Post Stimulation | Z = 0.87 p=0.39 | Z = 0.23 p=0.82 | Z = 1.03 p=0.30 | Z = 0.66 p=0.51 | Z = 1.02 p=0.31 | Z = 0.98 p=0.33 | Z = 0.33 p=0.74 | Z = 0.10 p=0.92 |
Additional files
Download links
A two-part list of links to download the article, or parts of the article, in various formats.
Downloads (link to download the article as PDF)
Open citations (links to open the citations from this article in various online reference manager services)
Cite this article (links to download the citations from this article in formats compatible with various reference manager tools)
Causal links between parietal alpha activity and spatial auditory attention
eLife 8:e51184.
https://doi.org/10.7554/eLife.51184


