Divergent Cl- and H+ pathways underlie transport coupling and gating in CLC exchangers and channels
- Department of Anesthesiology, Weill Cornell Medical College, United States
- SIB Swiss Institute of Bioinformatics, University of Basel, Switzerland
- Biozentrum, University of Basel, Switzerland
- Department of Physiology and Biophysics, Weill Cornell Medical College, United States
- Department of Molecular Physiology and Biophysics, University of Iowa Carver College of Medicine, United States
- Department of Biochemistry, Weill Cornell Medical College, United States
Figures
Figure 1
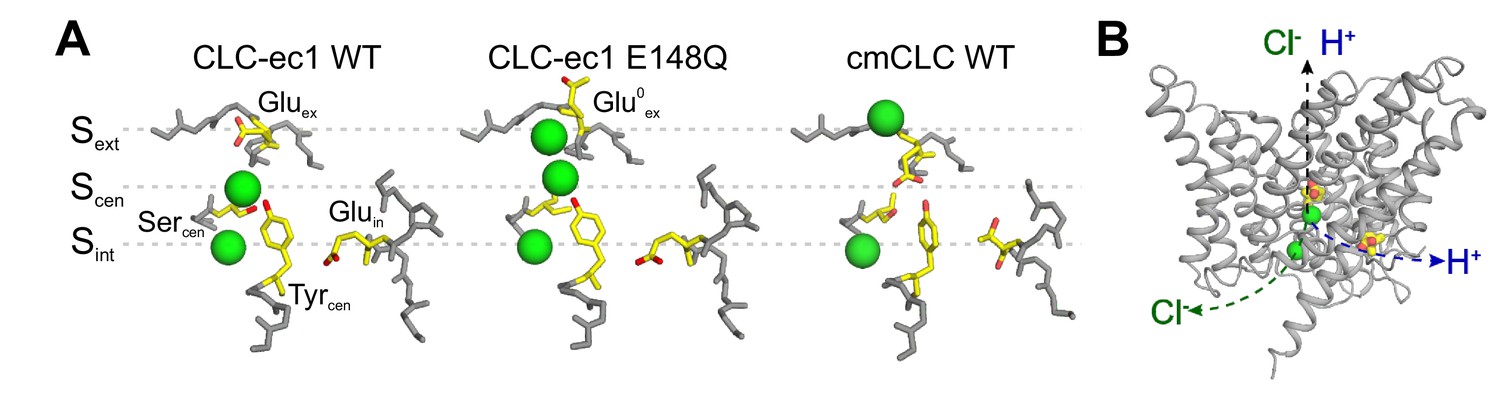
The anion pathway of the CLC Cl-/H+ exchangers.
(A) Close up view of the Cl- permeation pathway in three configurations: left, Gluex bound to Sext (CLC-ec1 WT; PDBID: 1OTS); center, protonated Gluex (mimicked by E148Q mutation) reaching out of the ion pathway (PDBID: 1OTU); right, Gluex bound to Scen (cmCLC WT, PDBID: 3ORG). Selected residues are shown as sticks and Cl- ions as green spheres. (B) The partially congruent Cl- and H+ pathways are shown in CLC-ec1 WT structure (Gluex and Gluin are shown in yellow, Cl- ions as green spheres).
Figure 2 with 2 supplements

Energetic landscapes of ion movement through the permeation pathway of CLC-ec1 reveal two rotameric states of F357 that correlate with ion occupancy.
(A) The PMF calculation describes the energetics of two Cl- along the permeation pathway, with the protonated Glu0ex positioned on the extracellular side of the pore (E148Q-like conformation). For both ions, the reaction coordinate consists in the position along the Z-axis (Z1, Z2). The position of the different binding sites along the Z-axis is indicated. The Z = 0 coordinate is an arbitrary point defined as the center of mass of backbone atoms around Scen. The asterisk indicates the position of the doubly occupied state Scen/Sext. Each color of the iso-contoured map represents a dG of 2 kCal mol−1, as indicated by the color scale. (B) The scheme illustrates the key ion occupancy states. Circles represent Cl- ions identified with numbers (1, 2) that correspond to the axis labels (Z1, Z2) of the PMF plots; the labels at the top (i, ii) refer to the transitions indicated in panel A. The doubly occupied state Scen/Sext (*) is essential for ion transport but is not observed as a stable state in the PMF calculation of panel A. (C–D) The PMF calculation was repeated with a harmonic restraint applied to the side chain of residue F357 to maintain χ1 around −70° ('down' conformer), (C) or −160° ('up' conformer), (D). Simultaneous Cl- binding to Sext and Scen becomes energetically favorable under the ‘up’ conformer. Color scale is equivalent to (A). (E) F357 side chain exists in an equilibrium between two rotameric states (‘up’, χ1=-160°; ‘down’, χ1=-70°).
Figure 2—figure supplement 1
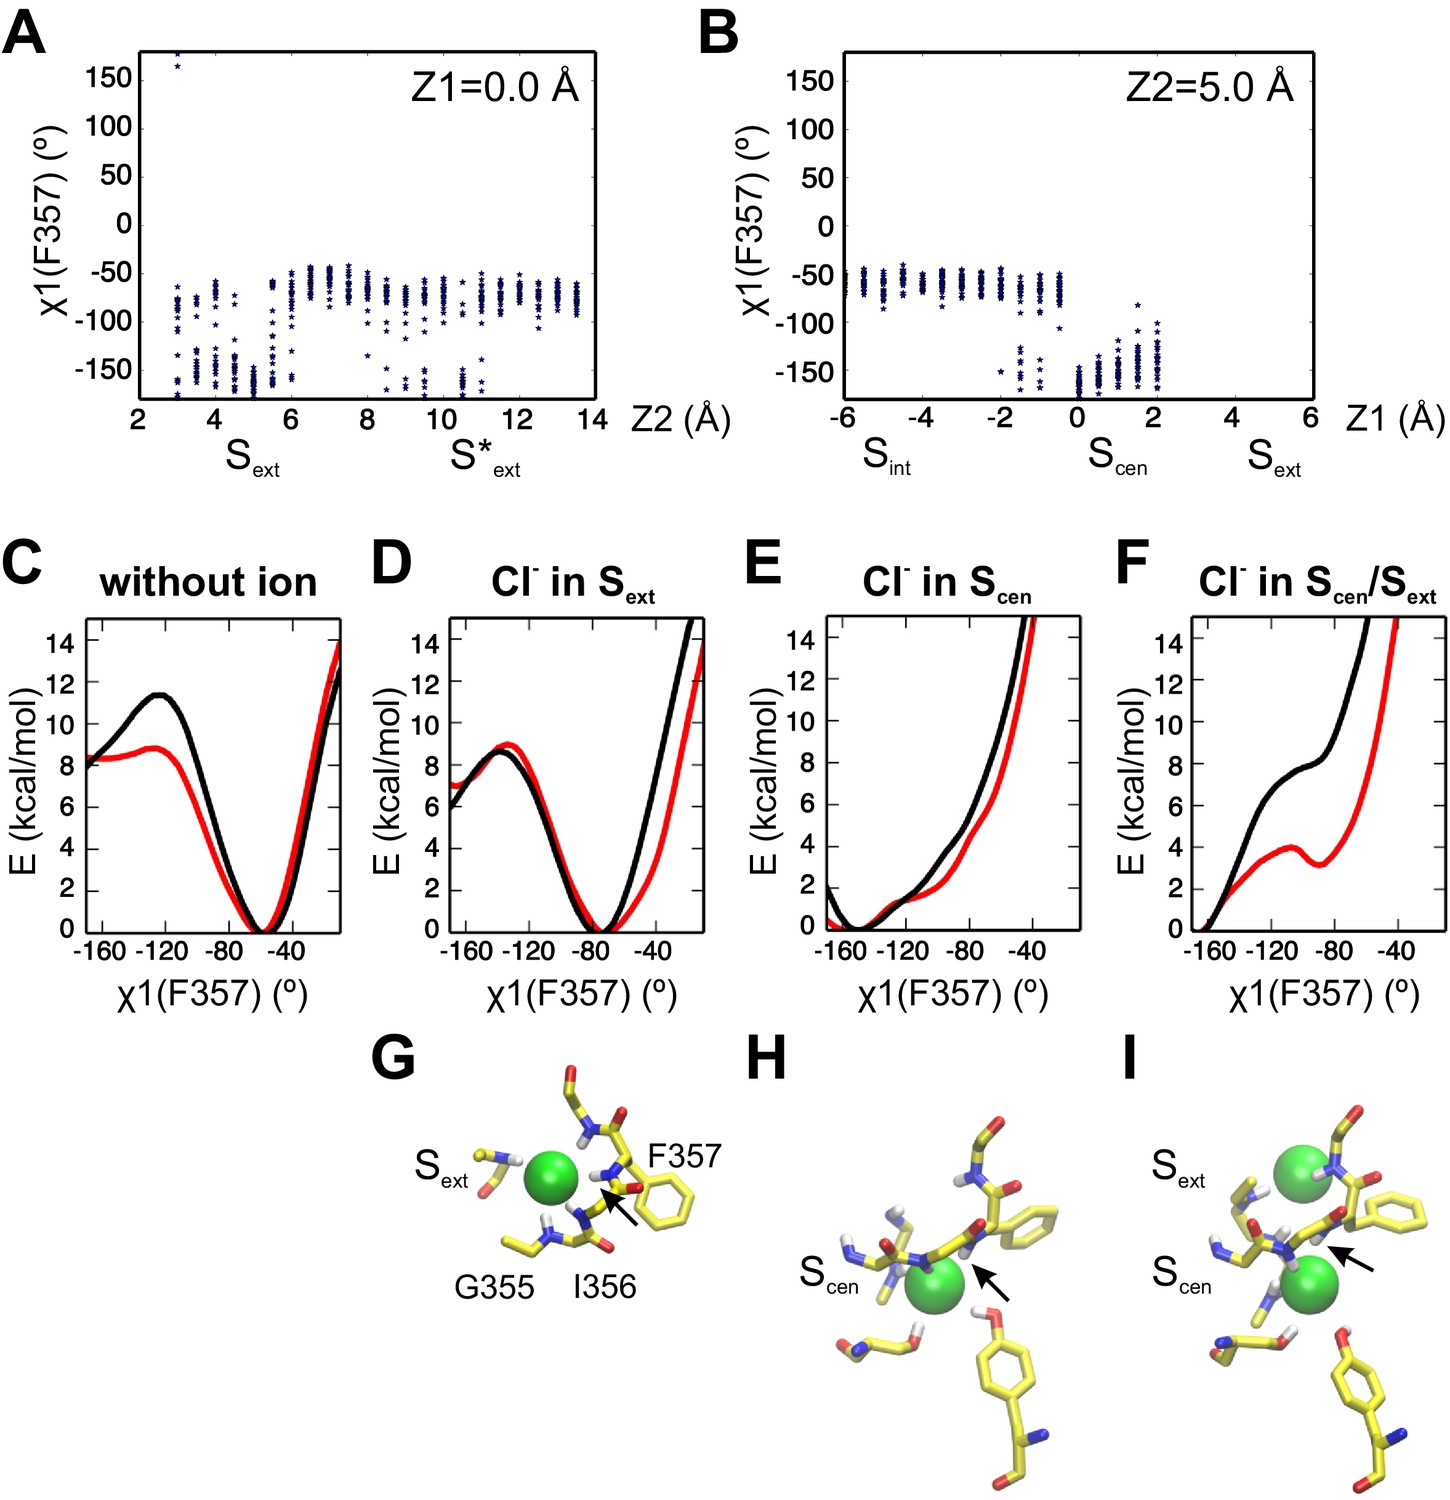
Ion binding influences the conformation of the F357 side chain.
(A, B) The conformational sampling underlying the PMF of Figure 2A reveals large fluctuations of F357 χ1 angle when a Cl- visits the Scen binding site. The Scen/Sext doubly occupied state correspond to the coordinate (Z1, Z2)=(0.0, 5.0). The distribution of F357 χ1 values is plotted for each simulation window along the axes Z1 = 0.0 Å (A) and Z2 = 5.0 Å (B). (C–F) The PMF along F357 χ1 angle is shown for different occupancy states: in absence of ions (C), with a Cl- in Sext (D) or Scen (E), and with Cl- in both Scen and Sext (F). The PMF calculations were initiated with the F357 side chain in the up state (χ1=-160°, black) or the down state (χ1=-70°, red). (G–I) Molecular representations of the coordination scheme for ions in Sext (G), Scen (H), and Scen/Sext (I). The structures correspond to the free energy minimum of the PMF in panel (D), (E) and (F), respectively. The backbone conformation of residues I356 and F357 responds to the ion occupancy state, impacting on the preferred conformer of the F357 side chain. The black arrow indicates the NH group of F357.
Figure 2—figure supplement 2
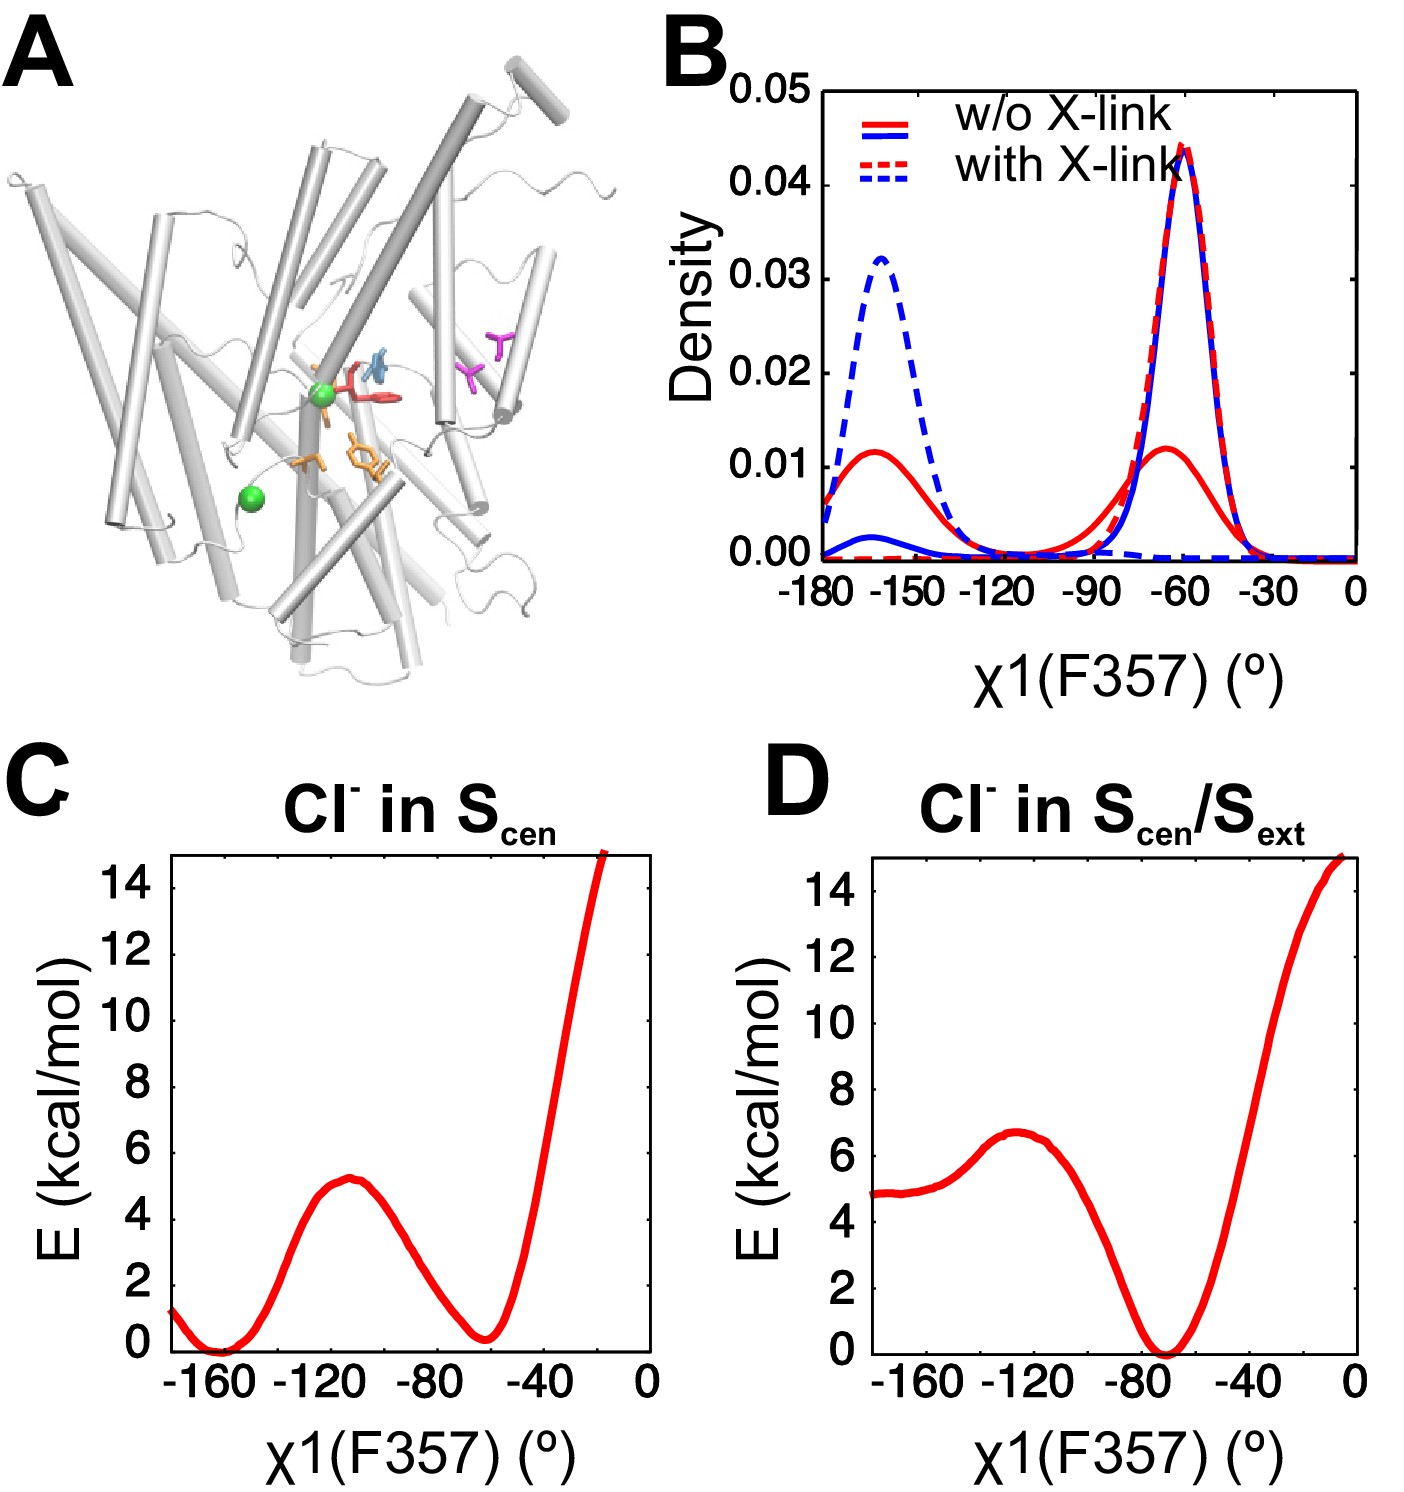
A crosslink known to reduce transport activity impedes the reorientation of the F357 side chain.
(A) Molecular graphic shows the position of the engineered crosslink within a CLC-ec1 monomer with the A399C-A432C crosslink in magenta sticks, the Cl- coordinating residues (S107, E148 and Y445) in orange sticks, Phecen (F357) and Phex (F190) respectively as red and blue sticks, and Cl- ions as green spheres. For clarity, residues 250 to 285 are not shown. (B) The distribution of F357 χ1 angle is shown for simulations in absence and presence of the engineered crosslink. Two independent simulations are shown for each case. In presence of the crosslink, no transition is observed between the two rotameric states of F357. (C, D) The PMFs along F357 χ1 angle shown in Figure 2—figure supplement 1E,F are repeated here in presence of the crosslink, with a Cl- in Scen (C) and Cl- in both Scen and Sext (D). The PMF calculations were initiated with the F357 side chain in the down state (χ1=-70°). The Cys bridge impedes the transition of F357 toward its up state (χ1=-160°).
Figure 3 with 1 supplement
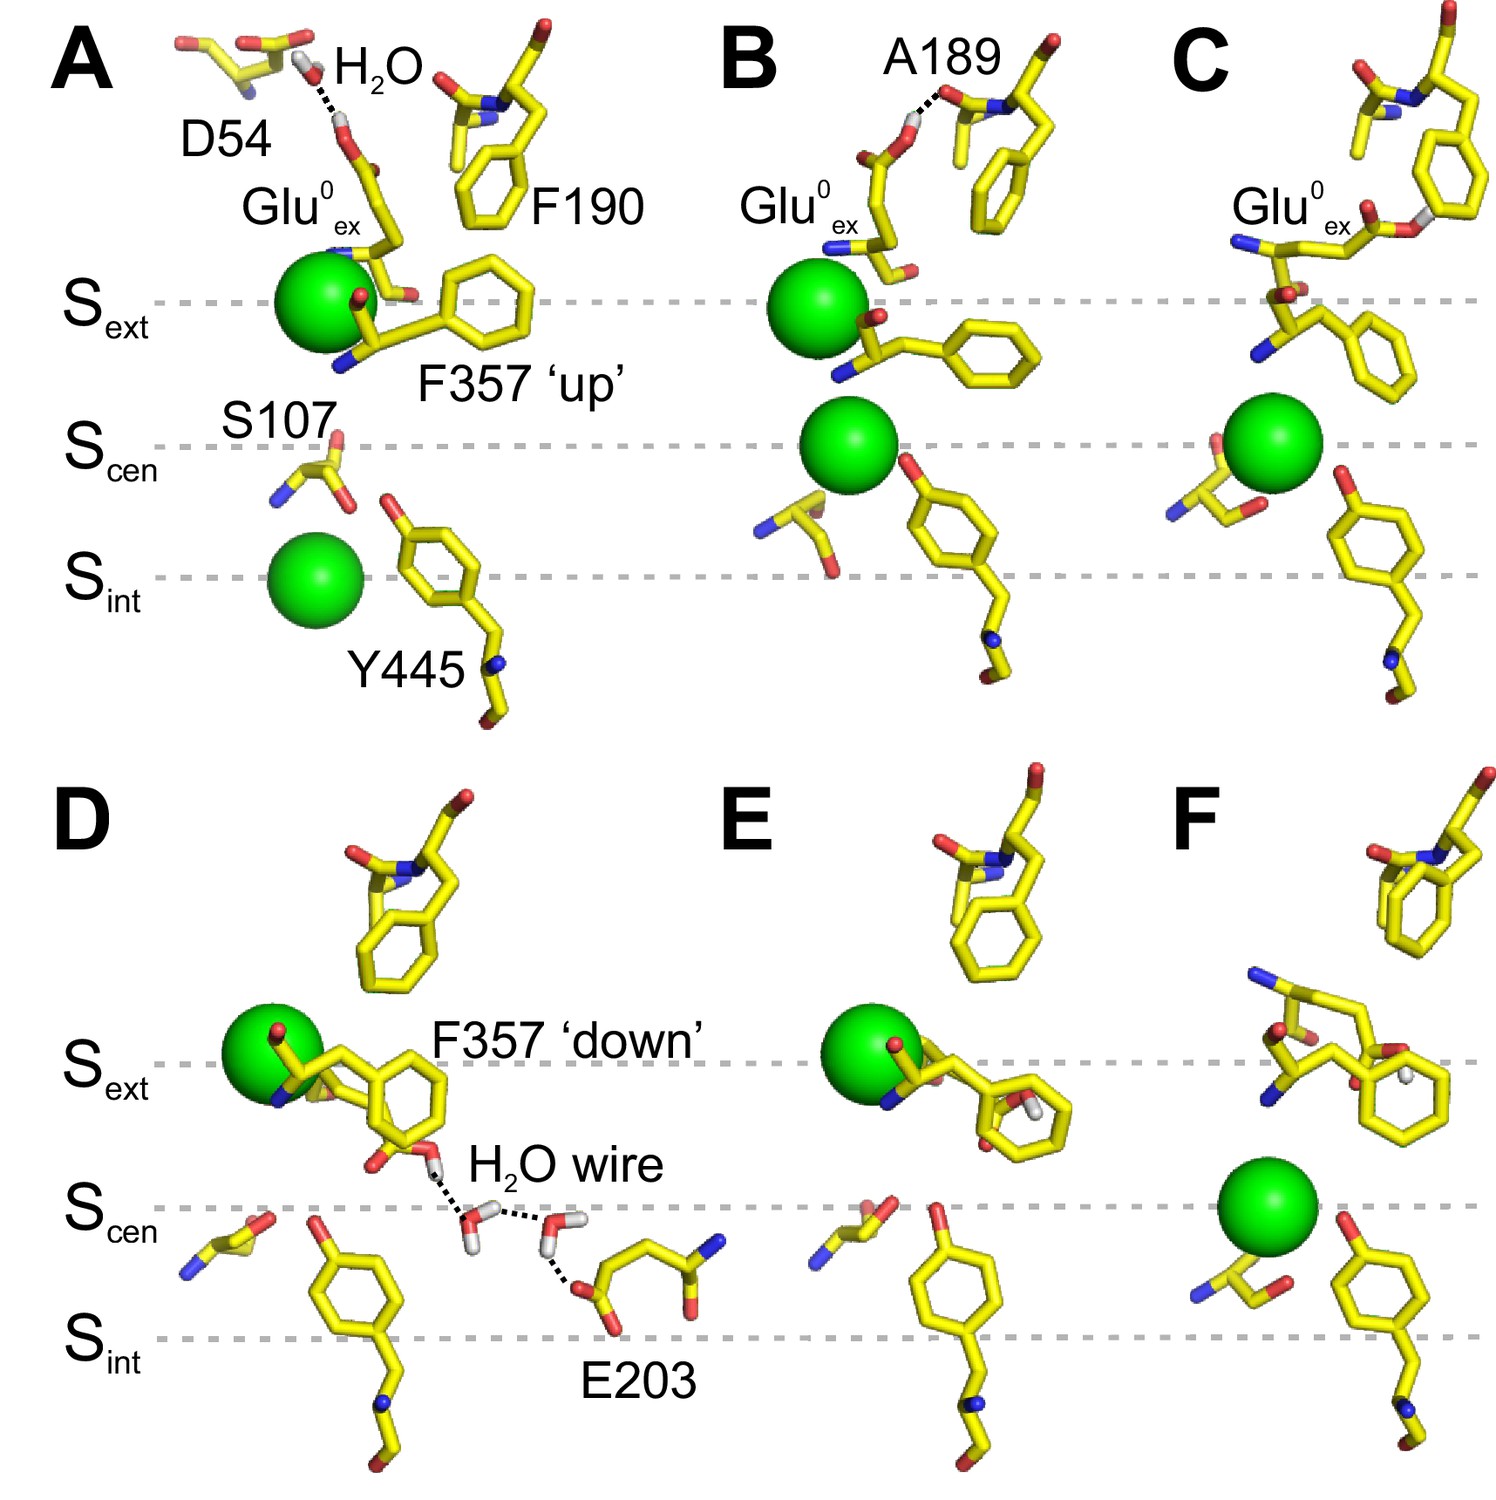
Interaction of Gluex with F190 and F357.
(A–C) Conformations of the pore extracted from the PMF calculation presented in Figure 2A, in which Glu0ex is initially placed on the extracellular side of the pore. Glu0ex is part of a hydrogen bond network involving D54 (A) or A189 (B). Glu0ex can also interact with the side chain of F190 (C). (D–F) Conformations of the pore extracted from a 1D PMF describing the binding of a Cl- to the pore when Glu0ex is initially bound to Scen (see Figure 3—figure supplement 1). A proton wire is spontaneously formed between Gluex (E148) and Gluin (E203), which are bridged by two water molecules (D). Glu0ex can form a dipole-π interaction with F357 aromatic side chain, leaving Scen empty (E). Cl- moves from Sext to Scen, while the side chain of Glu0ex is stabilized outside the ion pathway by its interaction with F357, and in proximity of F190 (F). The snapshots shown here appear spontaneously in PMF calculations in which the position of ions was restrained. The illustrated side chain and water wire conformations are observed in at least three sampling windows and remain stable for most of the 500 ps sampling time of a given window.
Figure 3—figure supplement 1
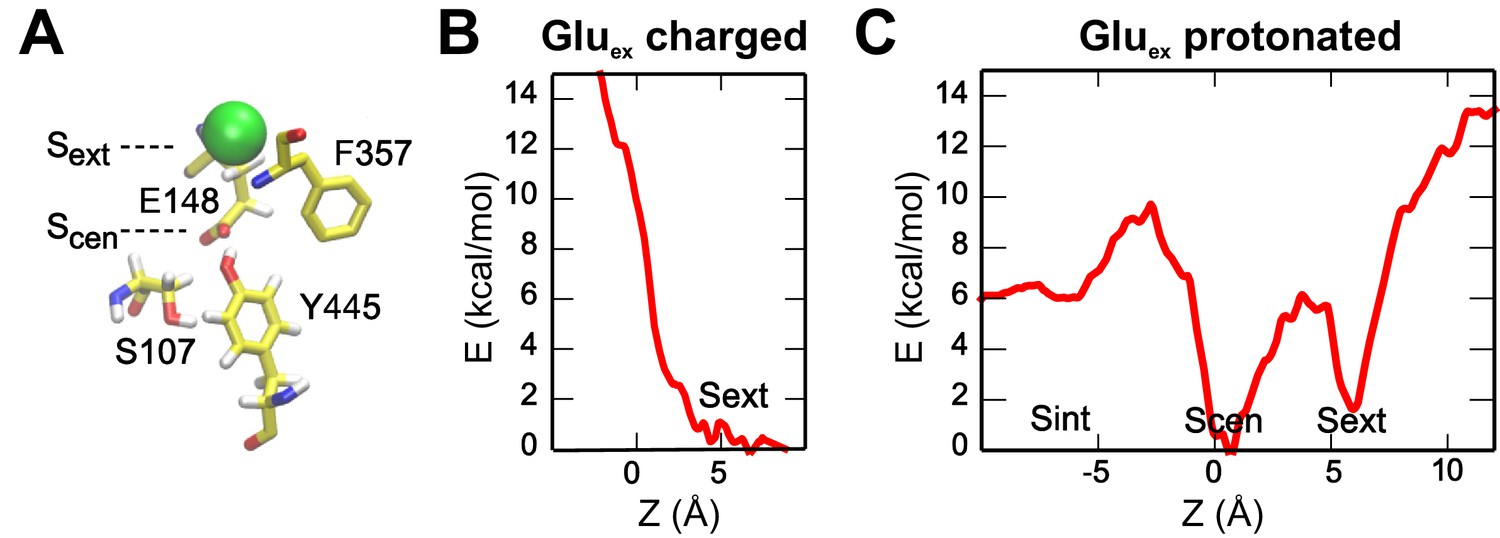
Binding of a Cl- to Sext and Scen with Gluex in the pore.
(A) The molecular representation shows the initial state used for the PMF calculations. (B, C) The PMFs describe the entry of a Cl- into the pore when Gluex is charged (non-protonated) (B) or neutral (protonated) (C). The reaction coordinate is defined as in Figure 2. Scen and Sext binding sites are accessible only when Gluex is protonated, in agreement with the idea that Cl- and H+ binding happens simultaneously. The PMFs also show that Sint presents a lower binding affinity than Scen and Sext.
Figure 4 with 2 supplements
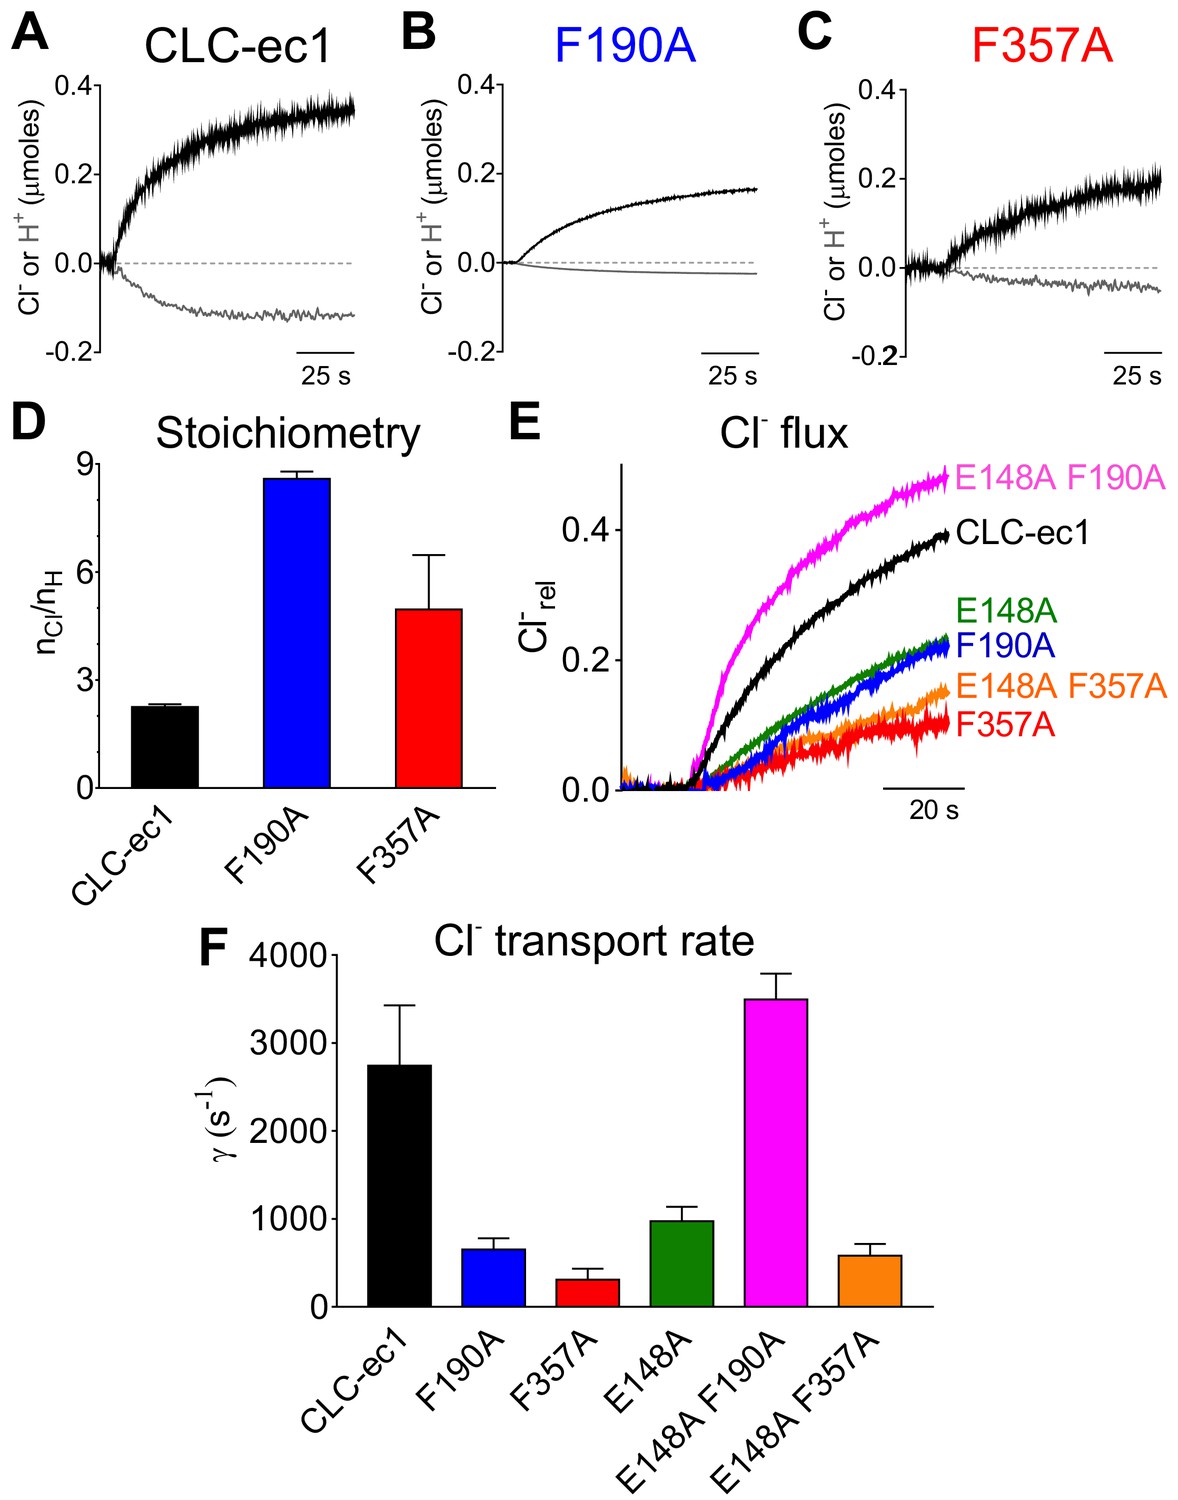
Phecen (F357) and Pheex (F190) determine the transport rate and Cl-/H+ coupling stoichiometry in CLC-ec1.
(A–C) Representative time course of Cl- (black) and H+ (gray) transport recordings of purified CLC-ec1 WT (A), F190A (B) and F357A (C) reconstituted into liposomes. (D) Average transport stoichiometry of CLC-ec1 WT (black), F190A (blue) and F357A (red). (E) Representative time course of Cl- efflux from proteoliposomes reconstituted with CLC-ec1 WT (black), E148A (green), F190A (blue), F357A (red), E148A F190A (pink) and E148A F357A (orange). (F) Average Cl- transport rate of WT and mutant CLC-ec1. All values are shown as mean ± S.E.M. and reported together with the number of repeats (N) in Figure 4—figure supplement 1C. The raw data for the traces shown is available in Figure 4—source data 1.
-
Figure 4—source data 1
Time course of the representative traces.
- https://cdn.elifesciences.org/articles/51224/elife-51224-fig4-data1-v2.xlsx
Figure 4—figure supplement 1
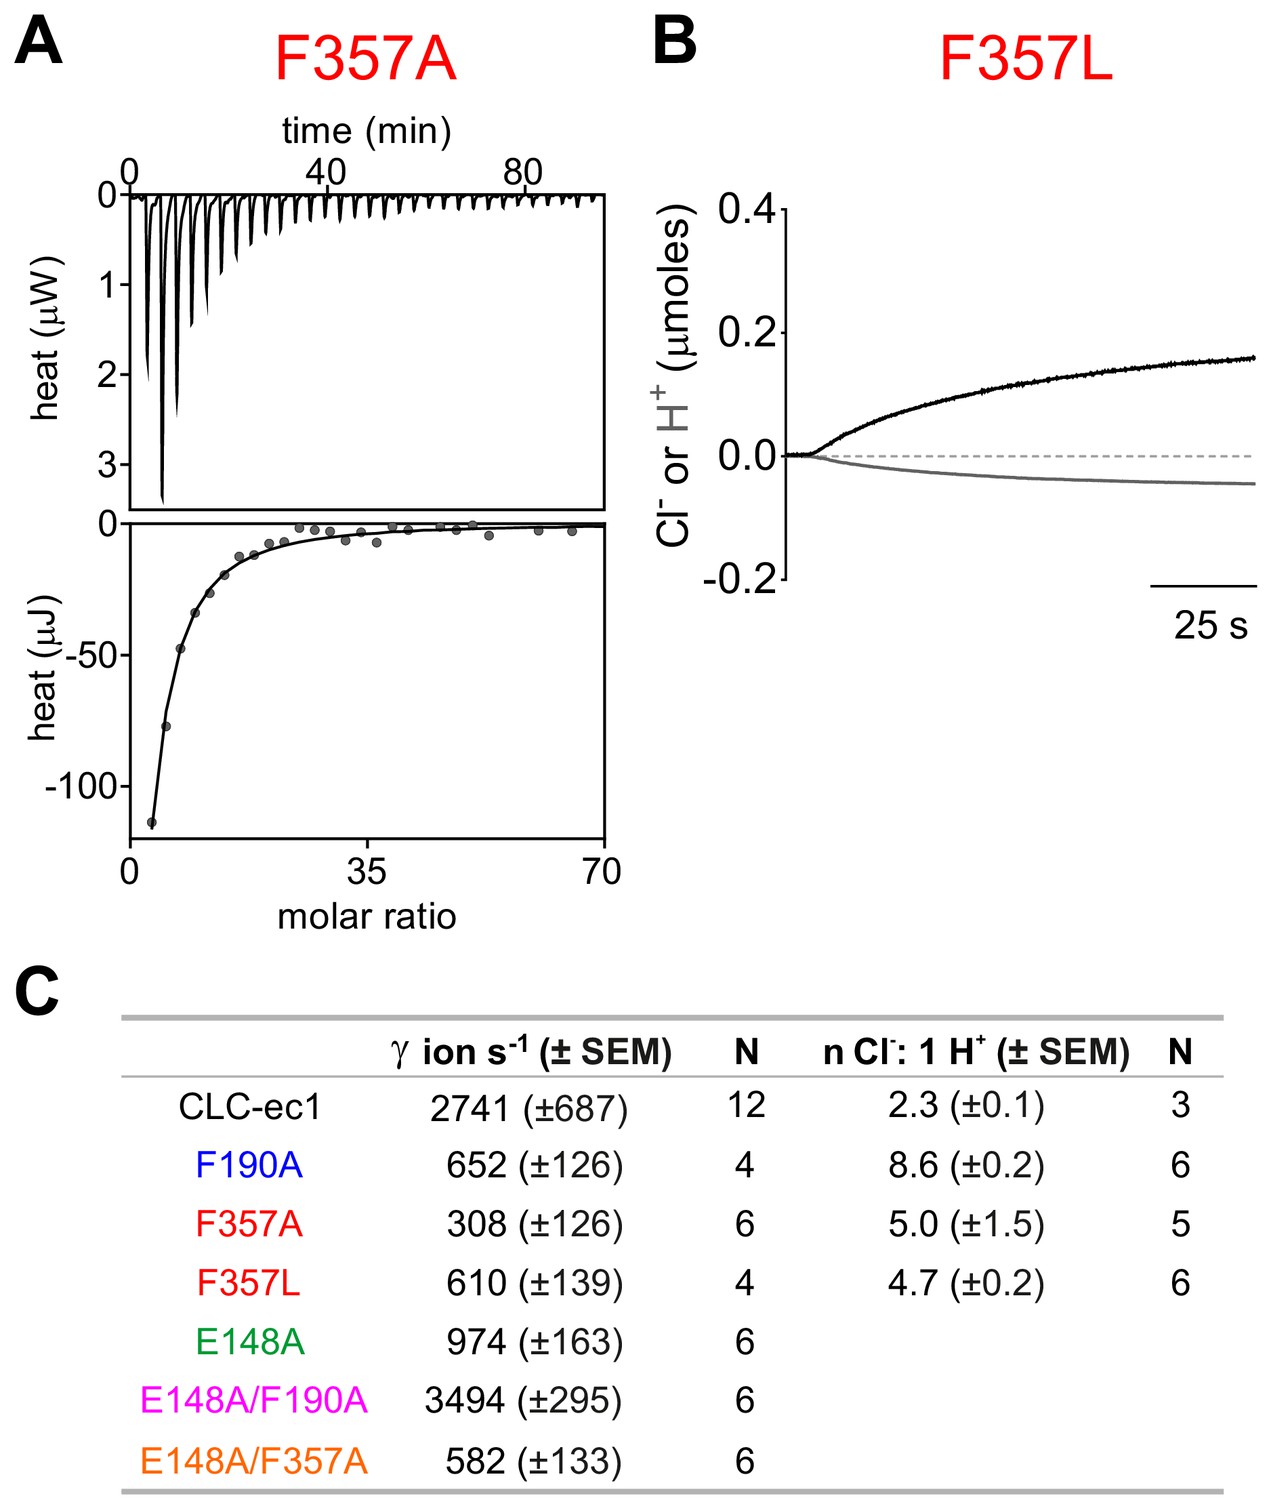
Effect of mutations on ion binding and transport in the CLC-ec1 exchanger.
(A) Representative thermogram of Cl− binding to CLC-ec1 F357A. Top graphs show the heats released upon ion binding. Bottom graphs show the integrated heats (circles), and the solid line is the fit to a single-site isotherm with KD = 0.67 ± 0.02 mM; ΔH = −5.1 ± 0.3 kcal Mol−1, TΔS = −0.8 ± 0.3 kcal Mol−1, and n = 1 binding site, N = 2 independent repeats. (B) Representative time course of Cl- (black) and H+ (gray) transport recordings of purified CLC-ec1 F357L reconstituted into liposomes. (C) Summary table of transport rate and coupling stoichiometry for WT and mutant CLC-ec1. Numbers (N) of independent repeats of the flux measurements from at least two independent protein purifications.
Figure 4—figure supplement 2
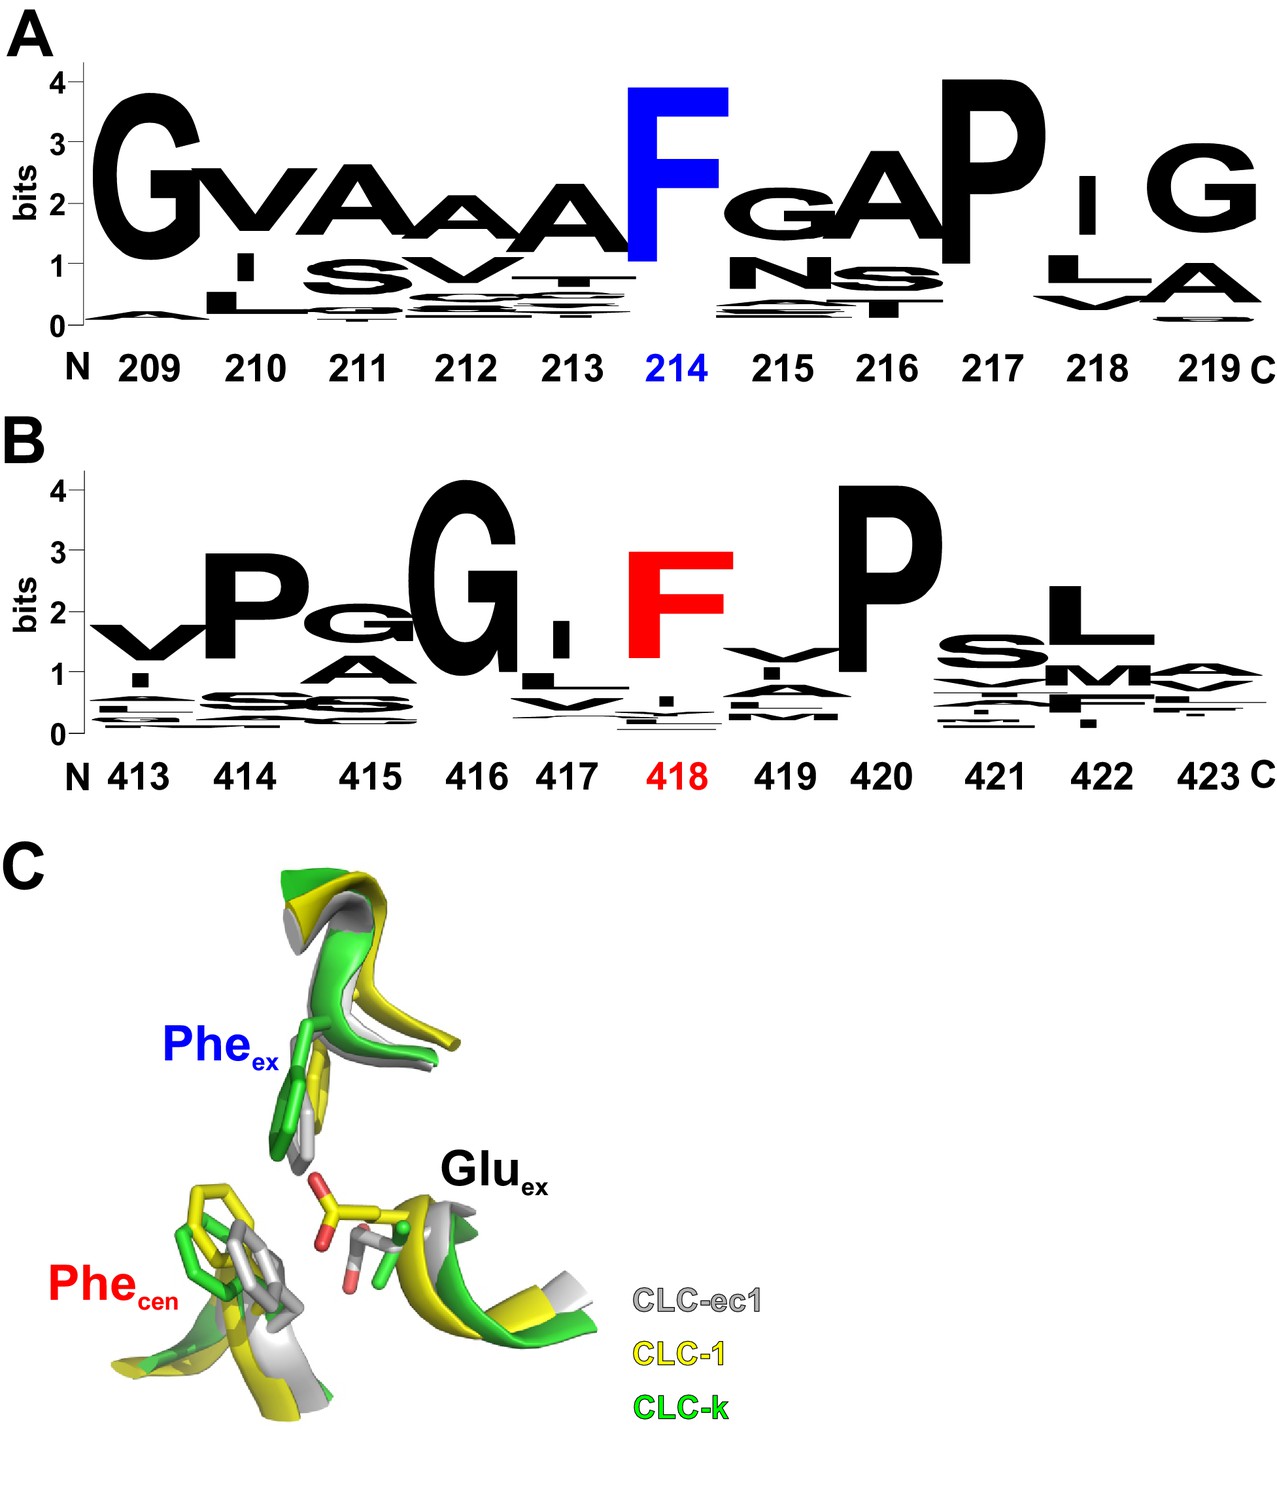
Conservation of Pheex and Phecen within the CLC family.
Pheex (A) and Phecen (B) show a high degree of conservation across the CLC family: 94% and 76%, respectively, as calculated from an alignment of 2,200 CLC sequences. Logos were created using the Weblogo server (https://weblogo.berkeley.edu/logo.cgi). (C) Superposition of the extracellular region of the Cl- and H+ pathways of the CLC-ec1 exchanger (grey; PDBID: 1OTS), the CLC-1 channel (yellow; PDBID: 6COY) and of the CLC-k channel (green; PDBID: 5TQQ). Pheex, Phecen and Gluex are shown as sticks with the oxygen atoms in red; parts of the backbone are shown as ribbons. Note that in the CLC-k channel Gluex is replaced by a valine.
Figure 5 with 2 supplements
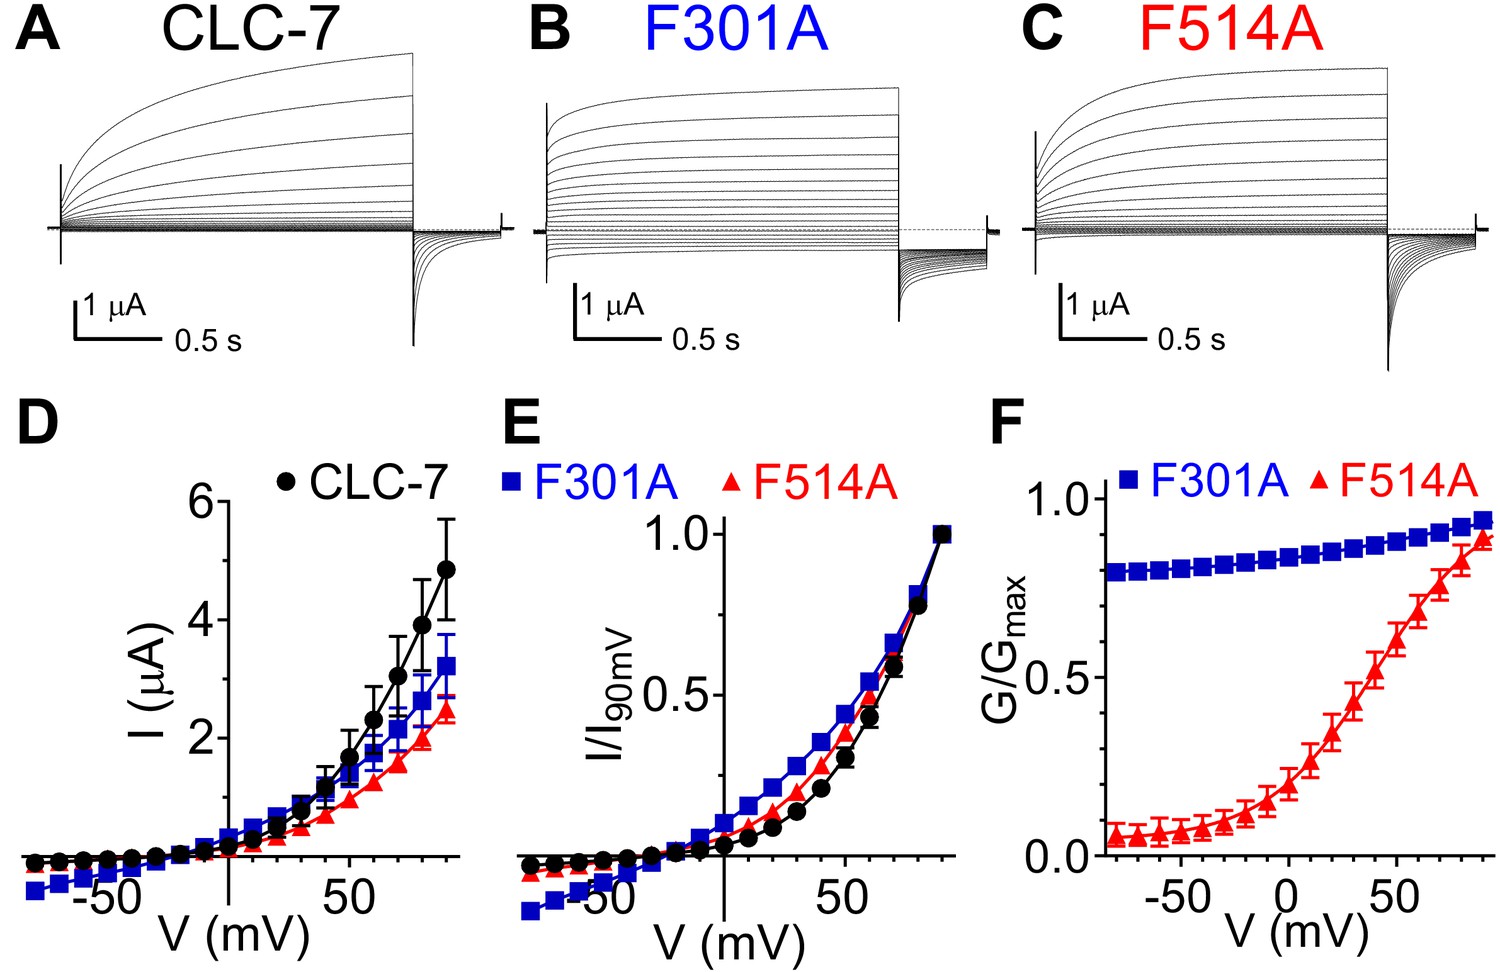
Role of Phecen (F514) and Pheex (F301) in the CLC-7 exchanger.
(A–C) Representative TEVC current recordings of CLC-7 WT (A), F301A (B) and F514A (C). For voltage clamp protocol see Methods section. (D) I-V relationships extracted from currents at the end of the test voltage for CLC-7 WT (black), F301A (blue) and F514A (red). Symbols represent the average of independent experiments (N(WT)=10; N(F301A)=18; N(F514A)=12 oocytes from 4 to 5 batches). Solid line holds no theoretical meaning. The mean current amplitudes at +90 mV are I(WT)=4.9 ± 0.9 μA; I(F301A)=3.2 ± 0.5 μA and I(F514)=2.5 ± 0.2 μA. (E) I-V relationships from (D) normalized to corresponding I at +90 mV present changes in voltage dependence of F301A and F514A compared to WT. (F) G-V relationships for mutant CLC-7 determined from the initial values of tail currents (see Methods). Symbols represent the average of 12–18 independent experiments (as in (D)). Solid line is a fit to a Boltzmann function with an offset. Values are reported as mean ± S.E.M, error bars are not shown where they are smaller than the symbol size. Values for the fit parameters and number of repeats are reported in Supplementary file 1. The raw data for the traces shown is available in Figure 5—source data 1.
-
Figure 5—source data 1
Individual raw data points.
- https://cdn.elifesciences.org/articles/51224/elife-51224-fig5-data1-v2.xlsx
Figure 5—figure supplement 1
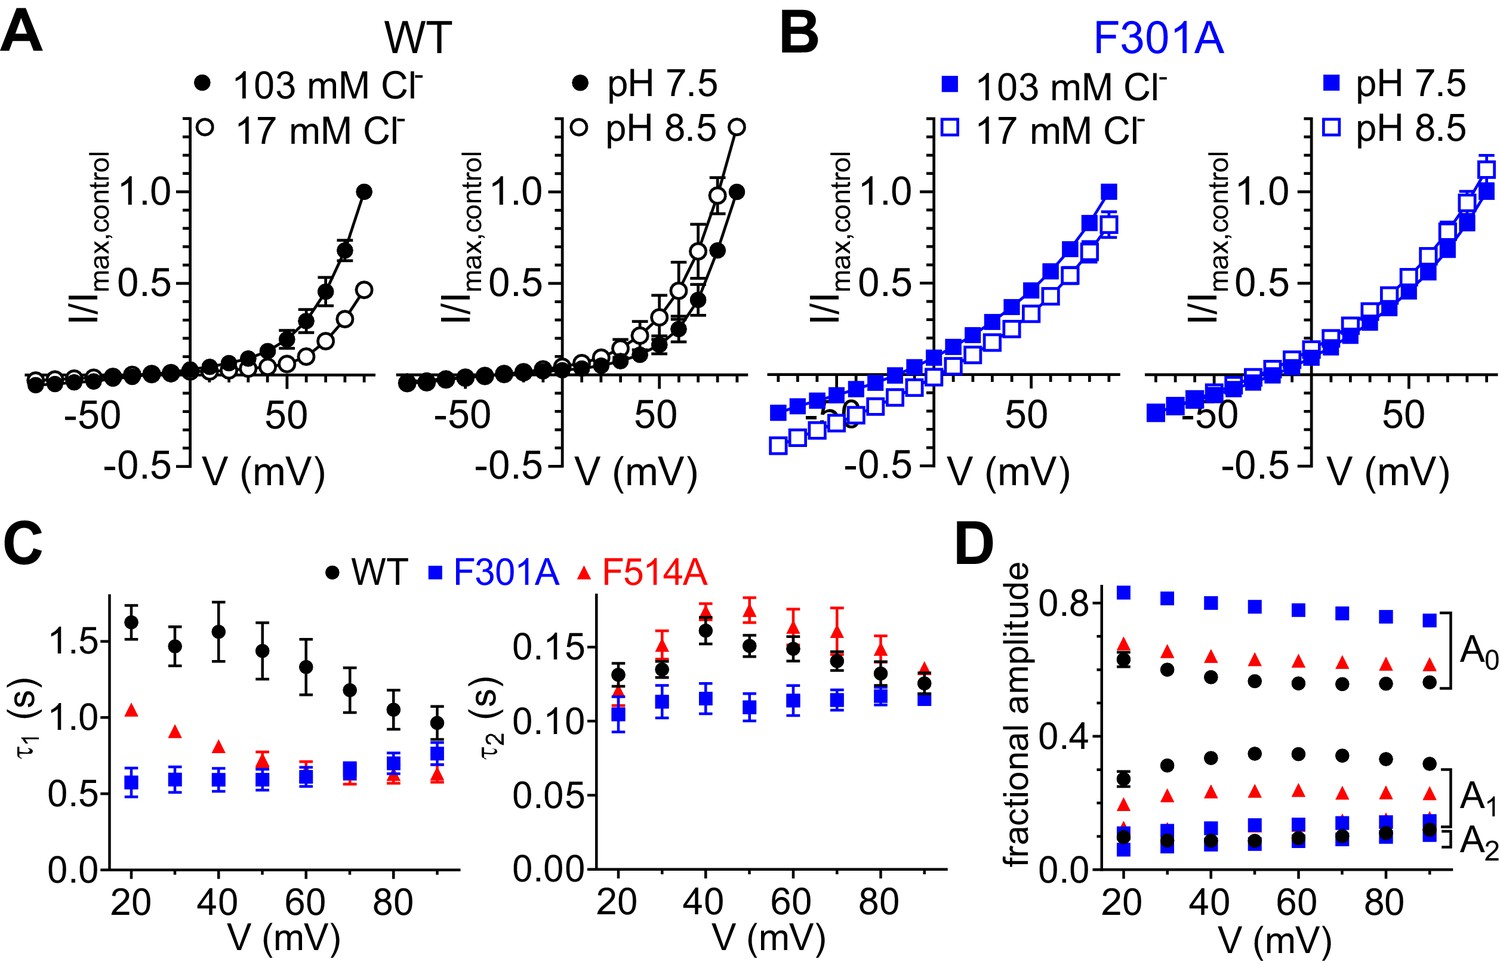
Impact of Phecen (F514) and Pheex (F301) mutagenesis on CLC-7 exchanger function.
(A) Normalized I-V relationships of CLC-7 WT showing dependence on extracellular [Cl-] (left; N = 2) and [H+] (right; N = 2). (B) Normalized I-V relationships of CLC-7 F301A showing dependence on extracellular [Cl-] (left; N = 5) and [H+] (right; N = 5). (C, D) The time courses of current activation of CLC-7 WT (N = 8), F301A (N = 8) and F514A (N = 8) at voltages between +20 and +90 mV were fit to a biexponential function (see Materials and methods, Equation 2). (C) The slow (τ1, left) and fast (τ2, right) time constants of CLC-7 WT (black circles), F301A (blue squares) and F514A (red triangles) are plotted as a function of voltage. F301A strongly diminishes voltage dependence of both activation time constants (τ1, τ2; at every tested voltage p<0.05). F514A accelerates the slow time component τ1 (at every tested voltage p<0.005). (D) The fractional amplitudes A0, A1 and A2 for CLC-7 WT (black circles), F301A (blue squares) and F514A (red triangles) are plotted as a function of voltage. F301A increases the time-independent fractional amplitude A0 and decreases the contribution of time-dependent fractional amplitude A1 (at every voltage tested p<0.005). F514A increases A0 and decreases A1 (at every voltage tested p<0.005). All values are reported as mean ± S.E.M, error bars are not shown where they are smaller than the symbol size. The raw data for the traces shown is available in Figure 5—figure supplement 1—source data 1.
-
Figure 5—figure supplement 1—source data 1
Individual raw data points.
- https://cdn.elifesciences.org/articles/51224/elife-51224-fig5-figsupp1-data1-v2.xlsx
Figure 5—figure supplement 2
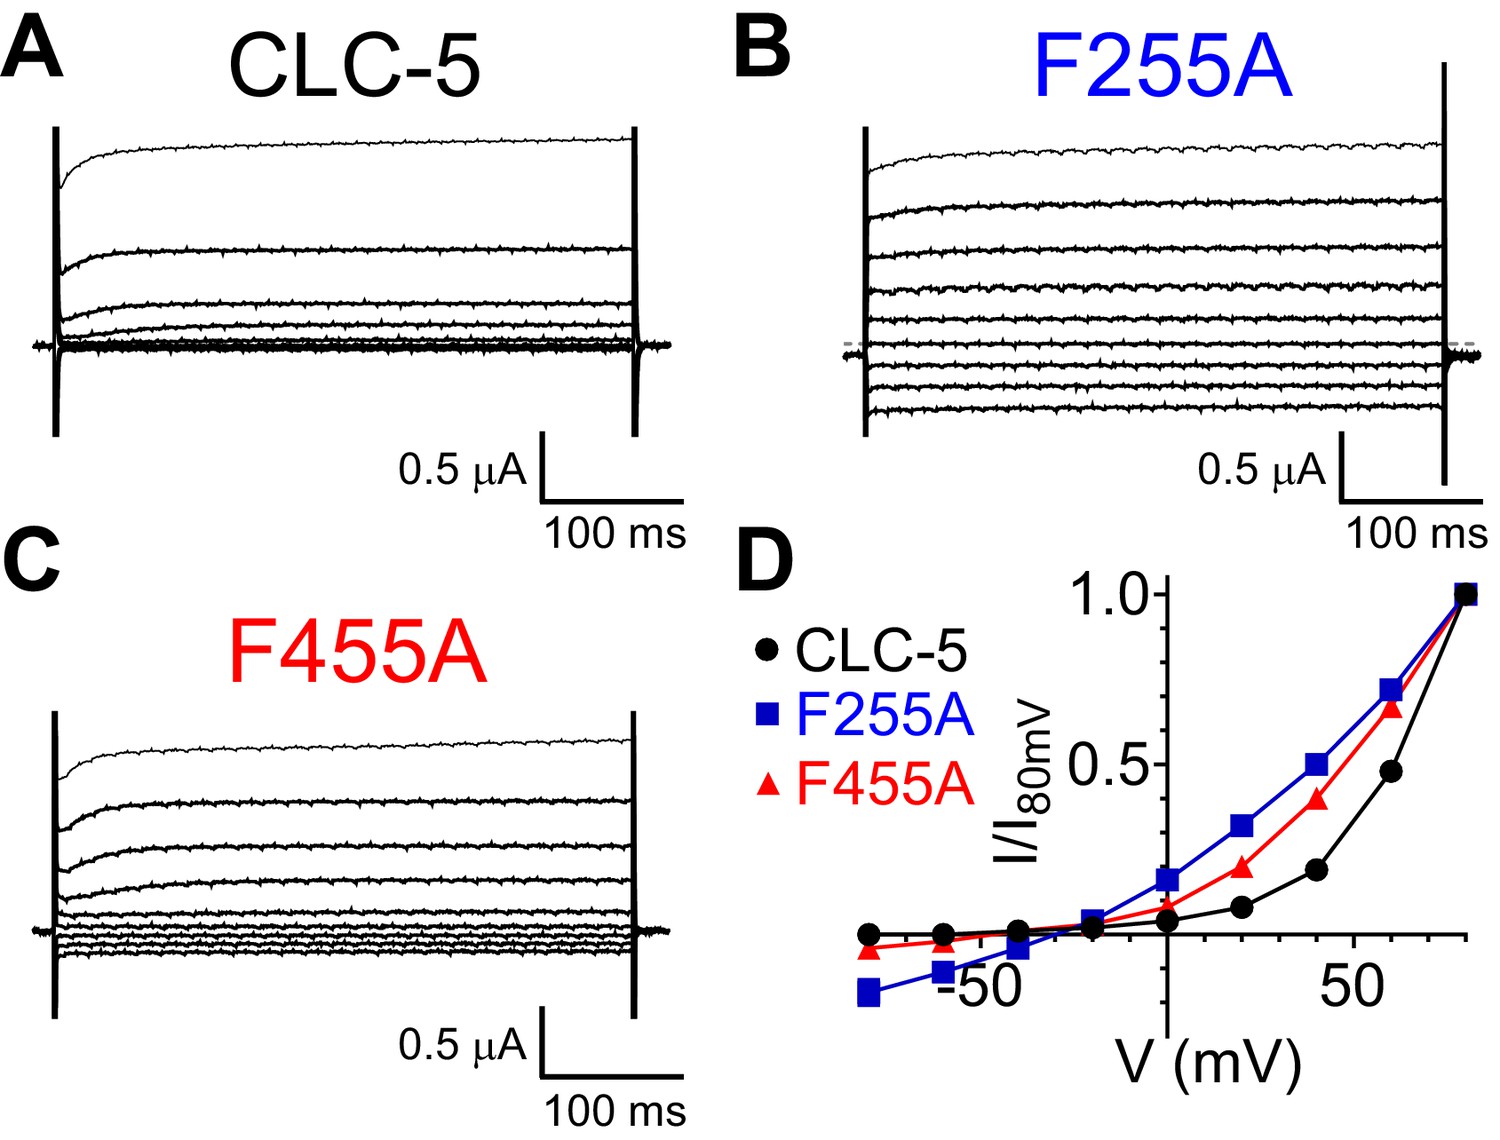
Phecen (F455) and Pheex (F255) regulate the voltage dependence of the CLC-5 exchanger.
(A–C) TEVC current recordings of CLC-5 WT (A), F255A (B) and F455A (C). For voltage clamp protocol see Methods section. (D) Normalized steady state I-V relationship for CLC-5 WT (black circles, N = 25), F255A (blue squares, N = 10) and F455A (red triangles, N = 22). Values are reported as mean ± S.E.M, error bars are not shown where they are smaller than the symbol size. The raw data for the traces shown is available in Figure 5—figure supplement 2—source data 1.
-
Figure 5—figure supplement 2—source data 1
Individual normalized data points.
- https://cdn.elifesciences.org/articles/51224/elife-51224-fig5-figsupp2-data1-v2.xlsx
Figure 6
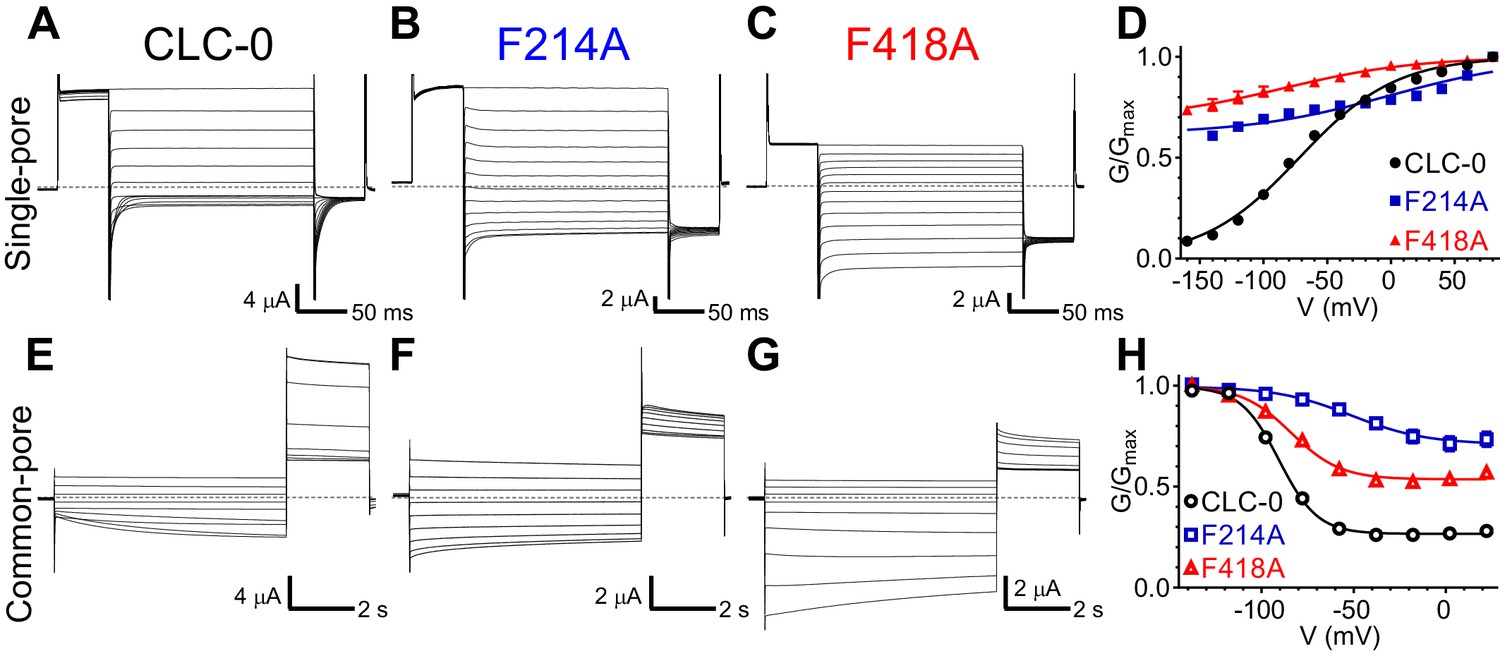
Phecen (F418) and Pheex (F214) contribute to voltage dependence of single- and common-pore gate of the CLC-0 channel.
(A–C, E–G) Representative Two Electrode Voltage Clamp (TEVC) current recordings of CLC-0 WT (A, E), F214A (B, F) and F418A (C, G) evoked by single-pore (A-C) or common-pore (E-G) gating protocols (see Methods). (D, H) Normalized G-V relationships of the single- (D, filled symbols) and common-pore (H, empty symbols) gating processes of CLC-0 WT (black circles), F214A (blue squares) and F418A (red triangles). Solid lines represent fits to a Boltzmann function (Equation 1). Values are reported as mean ± S.E.M, error bars are not shown where they are smaller than the symbol size. Values for fit parameters and number of repeats for all conditions are reported in Supplementary file 1. The raw data for the traces shown is available in Figure 6—source data 1.
-
Figure 6—source data 1
Individual data points.
- https://cdn.elifesciences.org/articles/51224/elife-51224-fig6-data1-v2.xlsx
Figure 7 with 3 supplements

Atomic scale mutagenesis confirms importance of π-electron distribution and rotational movement of Phecen for CLC-0 gating processes.
(A) Phenylalanine (Phe) and non-canonical Phe derivatives used in this study: Cha, Cyclohexylalanine; 2,6F2-Phe, 2,6Fluoro-Phenylalanine; 2,6diMeth-Phe, 2,6diMethyl-Phenylalanine. Right panel: stick representation of the amino acids, left panel: surface electrostatic potential of benzene and its derivatives with red and blue corresponding to −20 and +20 kCal mol−1, respectively (Mecozzi et al., 1996). The surface electrostatic potential of 2,6diMeth-Phe is assumed similar to Phe because methyl group substitutions do not withdraw electrons from the benzene ring. (B, C) Normalized G-V relationships of the single- (B, C) and common-pore (D, E) gating processes for CLC-0 with the following replacements at Pheex (B, D) and Phecen (C, E): Phe (black circles), Cha (green squares), 2,6F2-Phe (pink triangles) and 2,6diMeth-Phe (cyan diamonds). WT G-V curves (from Figure 6) are shown as gray dashed lines for reference. Solid lines represent fits to a Boltzmann function with an offset (see Materials and methods, Equation 1). Note that the G-V data for F418X+2,6diMeth-Phe was obtained on the background of the C212S mutant (2,6diMeth-Phe*) to isolate its effects on the single-pore gating process. The effects of F418X+2,6diMeth-Phe substitution on the WT background are shown in Figure 7—figure supplement 2. Values are reported as mean ± S.E.M, error bars are not shown where they are smaller than the symbol size. Values for the fit parameters and number of repeats are reported in Supplementary file 1. The raw data is available in Figure 7—source data 1.
-
Figure 7—source data 1
Individual data points.
- https://cdn.elifesciences.org/articles/51224/elife-51224-fig7-data1-v2.xlsx
Figure 7—figure supplement 1
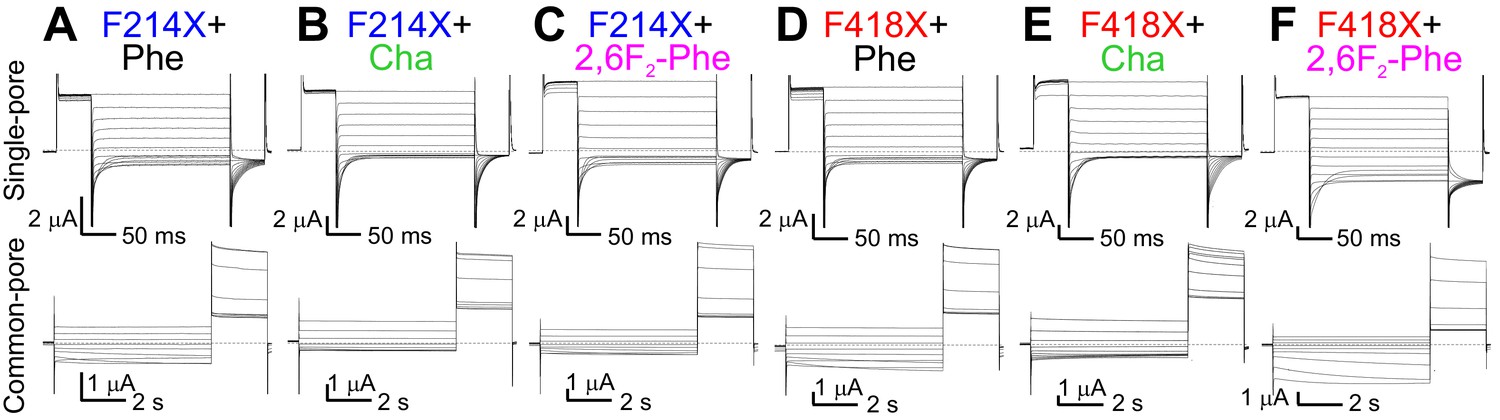
Effects of charge redistribution at Pheex and Phecen on the single- and common-pore gating processes of CLC-0.
(A–F) Representative TEVC currents evoked with single- (top) and common-pore (bottom) gating protocols of the following CLC-0 variants: Pheex (F214X) replacements with Phe (A), Cha (B) or 2,6F2-Phe (C); Phecen (F418X) substitutions with Phe (D), Cha (E) or 2,6F2-Phe (F).
Figure 7—figure supplement 2
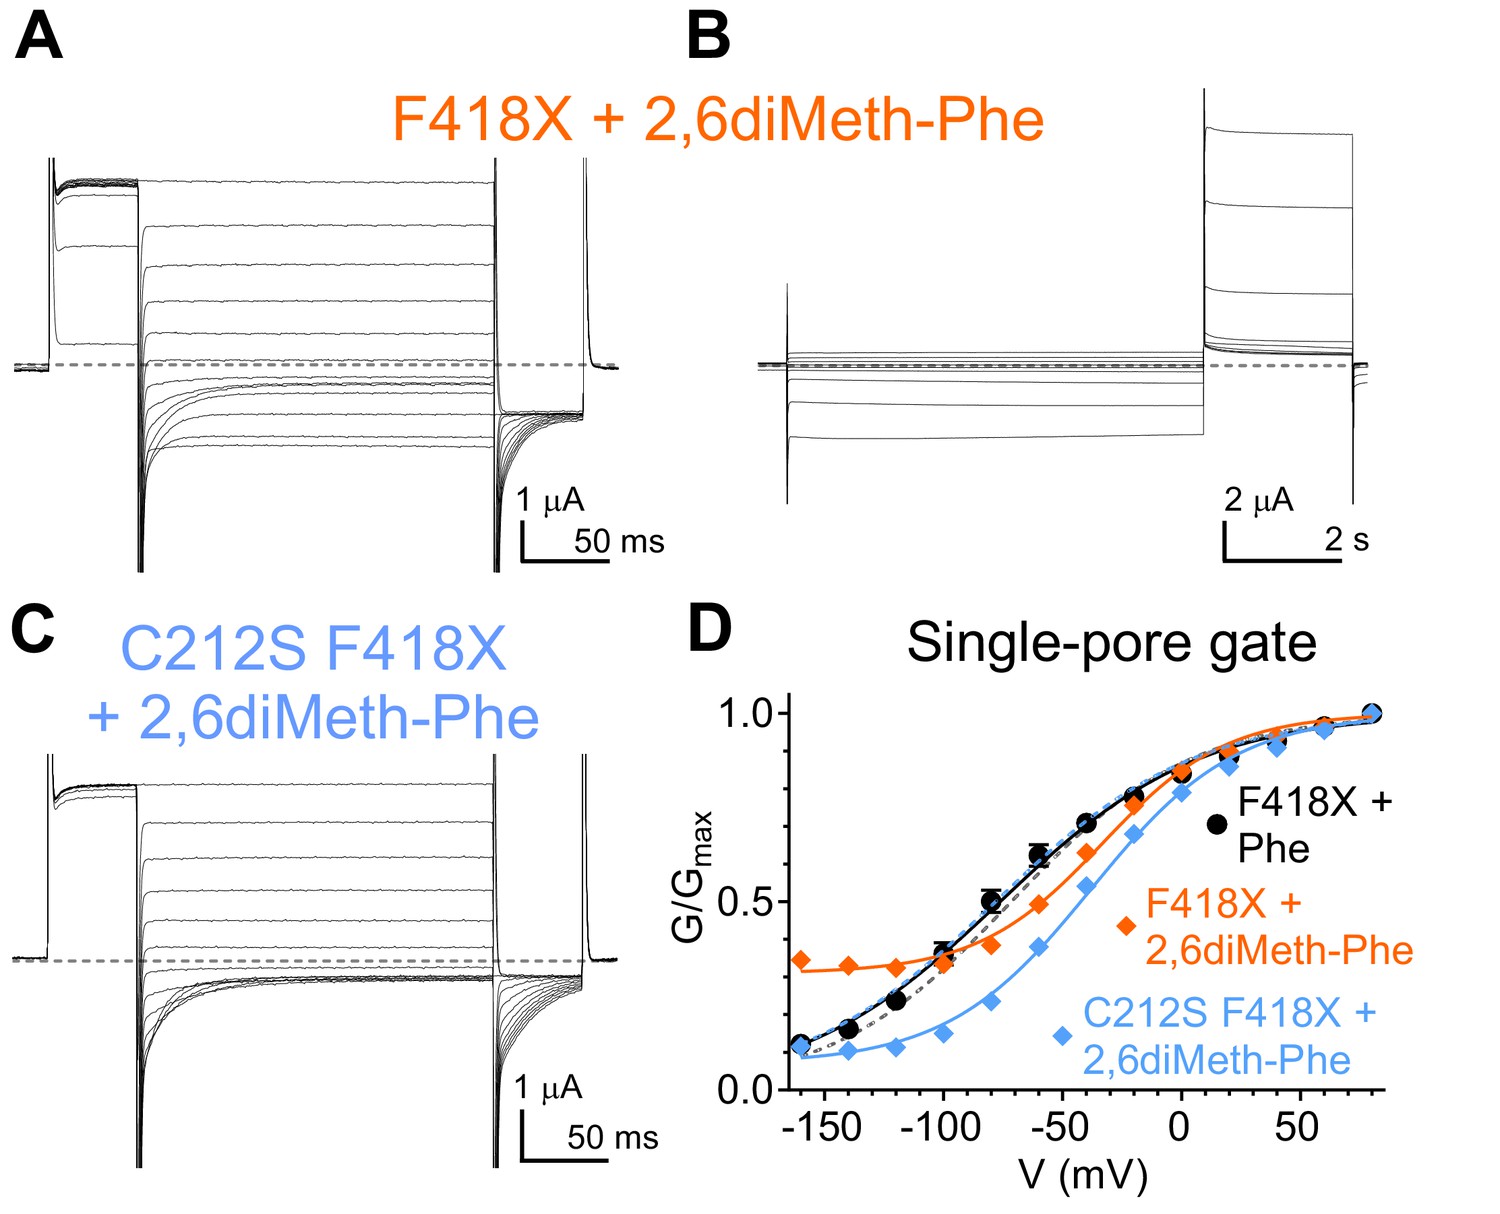
Effects of CLC-0 F418-2,6diMeth-Phe on single- and common-pore gating processes.
(A–B) Representative TEVC currents of F418X+2,6diMeth-Phe evoked with single- (A) and common-pore (B) gating protocols, respectively. (C) Representative TEVC currents of C212S F418X+2,6diMeth-Phe evoked with the single-pore gating protocol. (D) Normalized G-V relationships of the single-pore gating processes of F418X+Phe (black circles; from Figure 7), F418X+2,6diMeth-Phe (orange diamonds) and C212S F418X+2,6diMeth-Phe (cyan diamonds; from Figure 7). Solid lines represent fits to a Boltzmann function with an offset (see Materials and methods, Equation 1). WT G-V curves (from Figure 6) are shown as gray dashed line for reference and C212S F418X+Phe G-V as cyan dashed line. Values are reported as mean ± S.E.M, error bars are not shown where they are smaller than the symbol size. Values for the fit parameters and number of repeats are reported in Supplementary file 1. The raw data for the traces shown is available in Figure 7—figure supplement 2—source data 1.
-
Figure 7—figure supplement 2—source data 1
Individual data points.
- https://cdn.elifesciences.org/articles/51224/elife-51224-fig7-figsupp2-data1-v2.xlsx
Figure 7—figure supplement 3
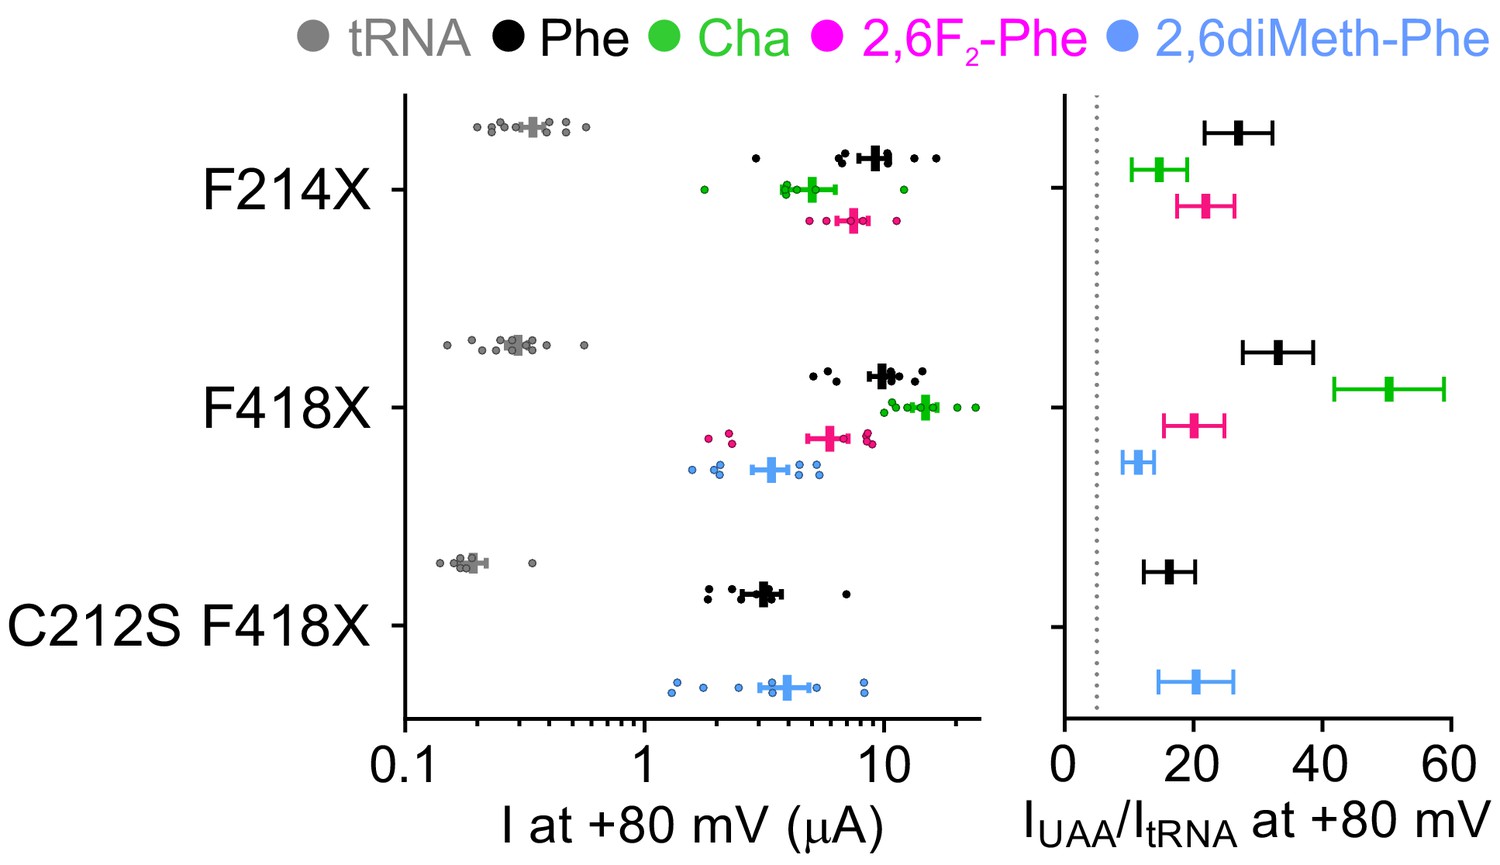
Site-specific incorporation of non-canonical amino acids into CLC-0 channels is efficient and yields robust currents.
(left panel) Mean current I at +80 mV in Xenopus laevis oocytes for F214X, F418X and C212S F418X CLC-0 co-injected with empty tRNA (gray) or tRNA misacylated with Phe (black), Cha (green), 2,6F2-Phe (pink) and 2,6diMeth-Phe (cyan). Individual data points are shown as circles and the mean ± S.E.M. is shown as a vertical bar with error bars. (right panel) For all constructs, IUAA/ItRNA was calculated from the means of IUAA and ItRNA at +80 mV as reported in the left panel. Errors were propagated. A threshold of IUAA/ItRNA >5 is imposed for specific incorporation efficiency (dashed line). The raw data is available in Figure 7—figure supplement 3—source data 1.
-
Figure 7—figure supplement 3—source data 1
Individual data points.
- https://cdn.elifesciences.org/articles/51224/elife-51224-fig7-figsupp3-data1-v2.xlsx
Figure 8
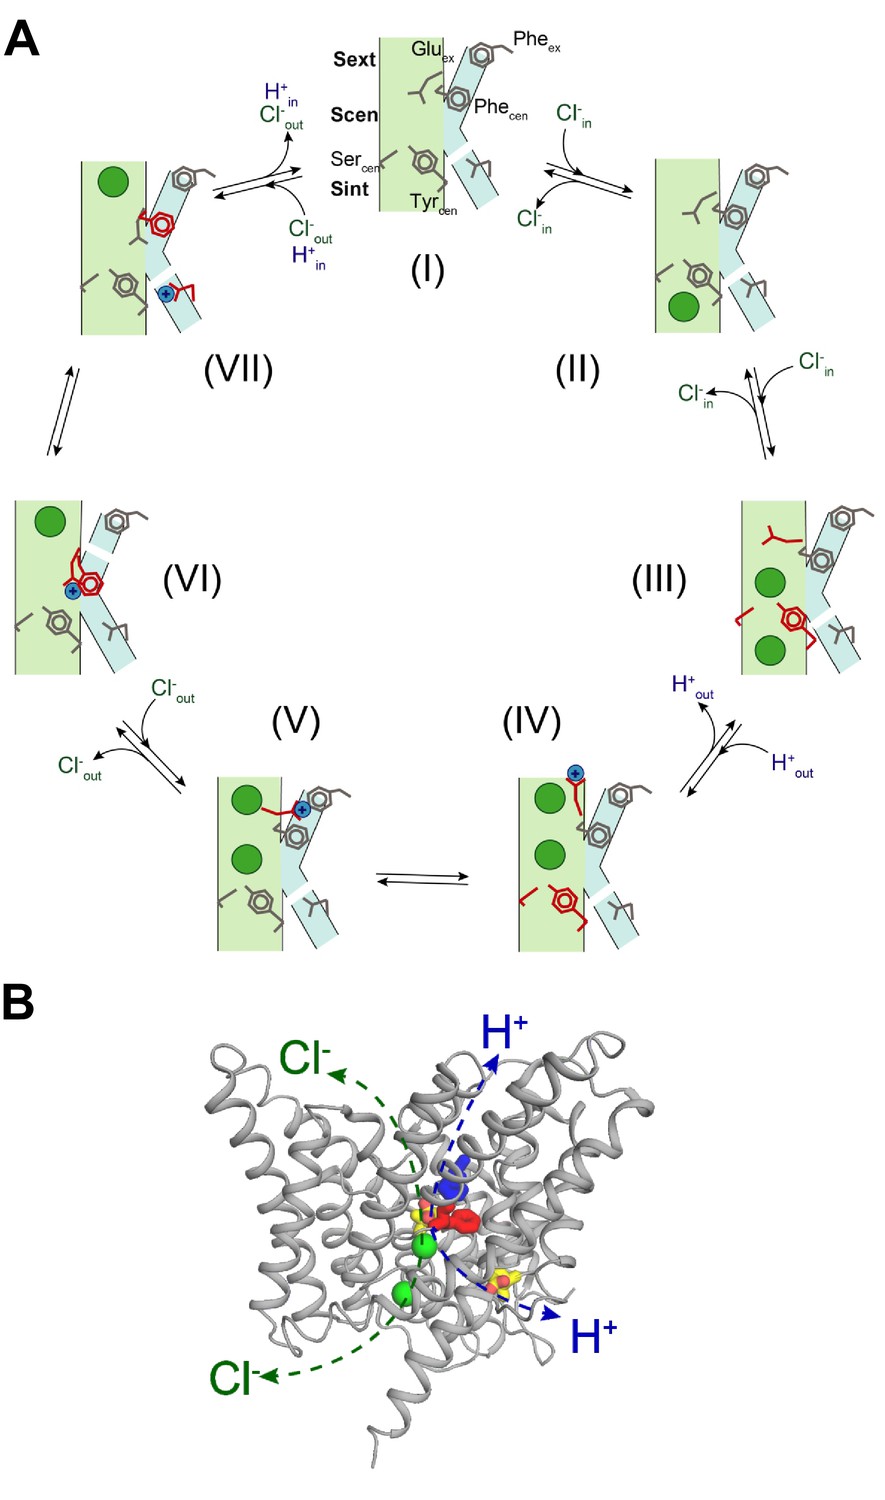
Proposed mechanism for the 2 Cl-: 1 H+ CLC exchangers.
(A) Schematic representation of the 2 Cl-: 1 H+ CLC exchange cycle. The Cl- ions are shown as green circles and H+ as blue circles. The Cl- and H+ pathways are shown in pale green and cyan respectively. For clarity, the residues that undergo conformational rearrangements in each step are highlighted in red. The H+ pathway is shown as discontinuous when it is in a non-conductive conformation. (I) Apo- and occluded-state of the transporter with Gluex in Scen and Phecen in the up rotamer. (II) An intracellular Cl- ion binds to Sint. (III) The inner gate opens, a second intracellular Cl- binds so that both Sint and Scen are occupied and Gluex moves to Sext. (IV) The Cl- ions move to Scen and Sext, the inner gate closes, Gluex moves out of the pathway and becomes protonated. (V) Glu0ex interacts with Pheex. (VI) Glu0ex interacts with Phecen which rotates to the down conformation enabling the formation of a water wire connecting Glu0ex and Gluin; one Cl- ion is released from Sext and the other one moves from Scen to Sext. (VII) The H+ is transferred to Gluin favoring movement of Gluex into Scen and the Cl- ion in Sext is released to the extracellular solution, returning to the initial state (I). (B) Physically distinct Cl- and H+ pathways are indicated in CLC-ec1 WT structure (Gluex and Gluin are shown in yellow, Pheex in blue, Phecen in red, Cl- ions as green spheres). Both pathways converge at Gluex.
Author response image 1
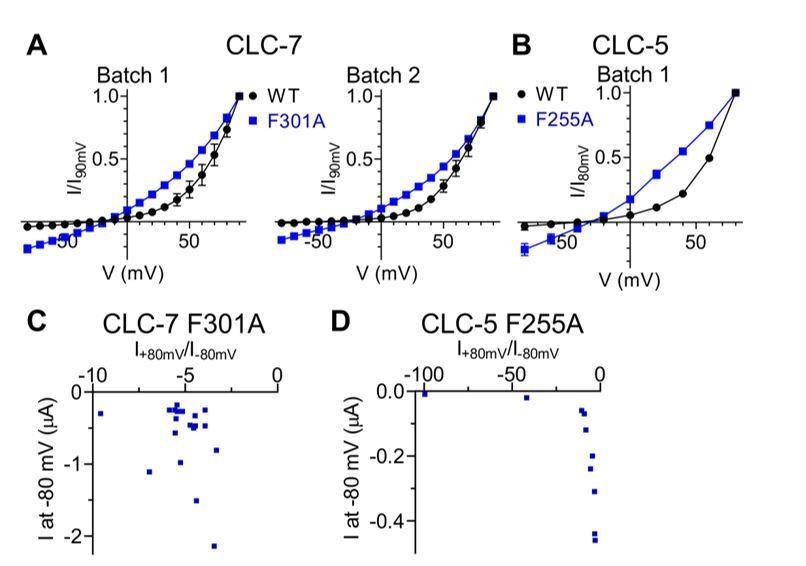
Inward currents elicited by CLC-7 and CLC-5 Pheex mutants are not due to conductances endogenous to the expression system.
Comparison of normalized I-V relationships of CLC-7 WT and F301A (A) as well as of CLC-5 WT and F255A (B) are shown for individual, independent batches of X. laevis oocytes. Endogenous conductances are assumed to be constant between WT and mutant injected oocytes within the same batch. No prominent inward currents were present in WT expressing oocytes, indicating that the inward currents are likely to be specific to Pheex mutants (CLC-7: N(WT, Batch 1)=5, N(F301A, Batch 1)=3, N(WT, Batch 2)=2, N(F301A, Batch 2)=2; CLC-5: N(WT)=2, N(F255A)=5). N refers to the number of individual oocytes. All values are reported as mean ± S.E.M, error bars are not shown where they are smaller than the symbol size. (C, D) For CLC-7 F301A (C; N=19) and CLC-5 F255A (D; N=10) no correlation was observed between the rectification index R=I+80mV/I-80mV and the current measured at -80 mV.
Author response image 2
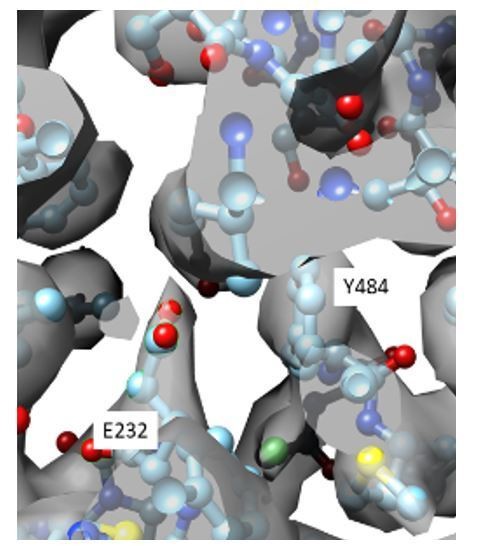
Close up view of the density map (gray) in the CLC-1 pore allows placement of the E232 side chain (cyan, ball and stick).
Additional files
-
Supplementary file 1
Summary of the Boltzmann fitting parameters.
The following parameters from Boltzmann fits for CLC-7 and CLC-0 constructs used in Figures 5–7 are reported as mean ± S.E.M.: pmin, minimal open probability; V0.5, voltage of half maximal activation; z, gating charge; N, number of oocytes; n, number of independent oocyte batches. * indicates values of the fit parameters that were not well constrained during fitting, as such they should be considered as estimates of the parameters.
- https://cdn.elifesciences.org/articles/51224/elife-51224-supp1-v2.docx
-
Transparent reporting form
- https://cdn.elifesciences.org/articles/51224/elife-51224-transrepform-v2.docx
Download links
A two-part list of links to download the article, or parts of the article, in various formats.
Downloads (link to download the article as PDF)
Open citations (links to open the citations from this article in various online reference manager services)
Cite this article (links to download the citations from this article in formats compatible with various reference manager tools)
Divergent Cl- and H+ pathways underlie transport coupling and gating in CLC exchangers and channels
eLife 9:e51224.
https://doi.org/10.7554/eLife.51224


