Anatomical and single-cell transcriptional profiling of the murine habenular complex
- Howard Hughes Medical Institute, Harvard Medical School, United States
Figures
Figure 1 with 2 supplements
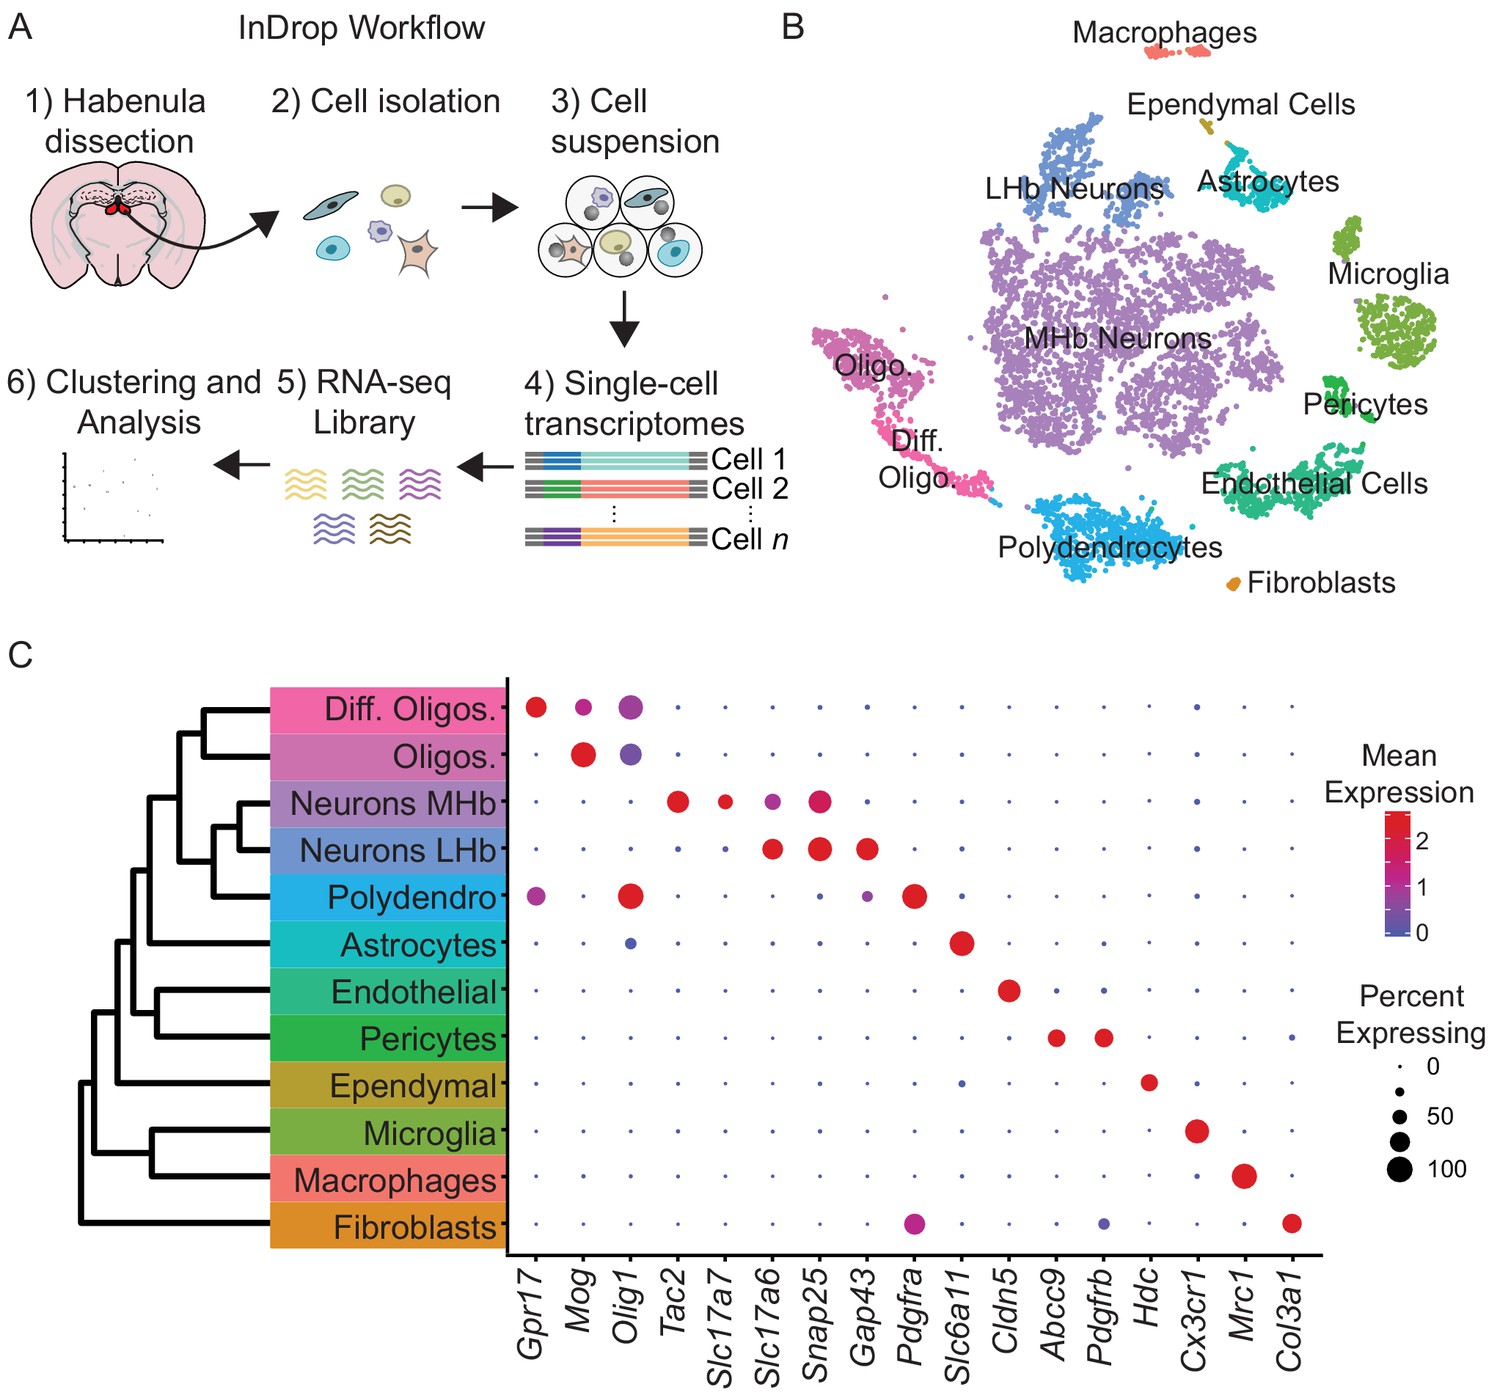
High-throughput single-cell transcriptomic profiling of the habenula.
(A) Schematic for scRNA-seq using the inDrop platform. Tissue containing the habenula was microdissected from acute coronal brain slices prepared from adult mice (1). Tissue chunks were digested in a cocktail of proteases and followed by trituration and filtration to obtain a cell suspension (2). Single cells were encapsulated using a droplet-based microfluidic device (3) for cell barcoding and mRNA capture (4). RNA sequencing (5) and bioinformatics analysis followed (6). (B) t-SNE plot of the processed dataset containing 7,506 cells from six animals. Cells are color-coded according to the cluster labels shown in (C). (C) Left: Dendrogram with cell class labels corresponding to clusters shown in (B). Right: Dot plot displaying expression of example enriched genes used to identify each major cell class. The color of each dot (blue to red) indicates the relative log-scaled expression of each gene, whereas the dot size indicates the fraction of cells expressing the gene.
Figure 1—figure supplement 1
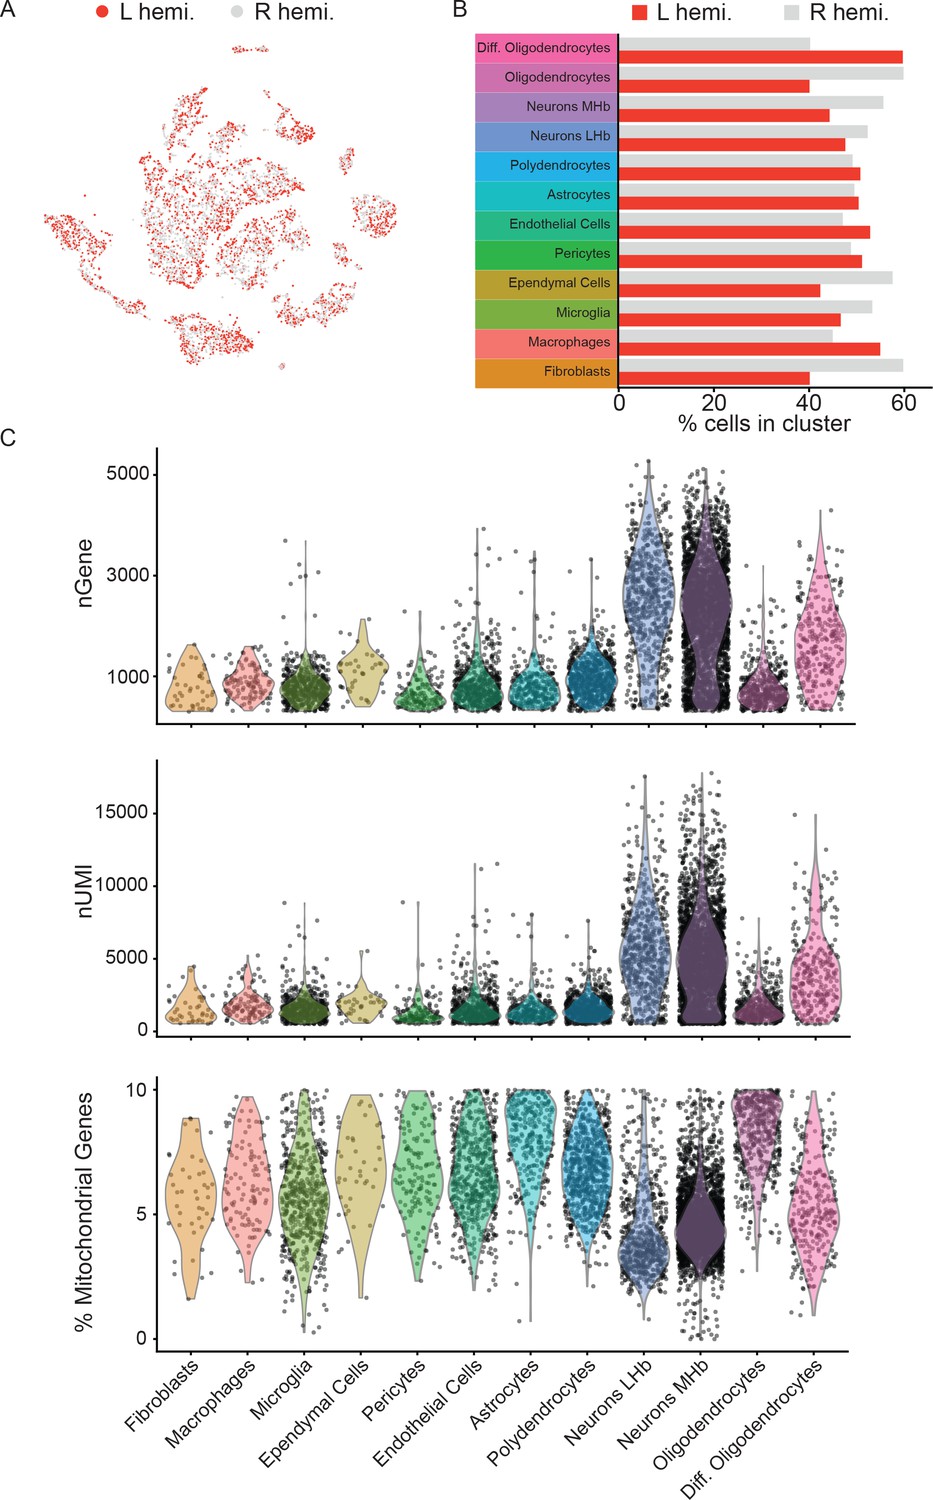
Comparison of cell-type composition across hemispheres and gene diversity, mitochondrial genes, and UMIs across cell types.
(A) t-SNE plot of the dataset with cells color-coded by the hemisphere from which the sample was acquired. (B) Bar plots showing the percentage of cells in each hemisphere that are categorized into each of the 12 major cell types. (C) Violin plots of the number of genes (top), unique molecular identifiers (UMIs, middle), and percentage of mitochondrial genes per cell (bottom) for each of the 12 cell types. Each point represents a single cell and filled area is a probability distribution of all the cells in that category.
Figure 1—figure supplement 2

Expression of genes known to be important for habenular microglial and astrocytic function.
Violin plots of gene expression (scaled and log normalized) for Tnf (A), Tnfrsf1a (TNF-receptor) (B), and Kcnj10 (Kir4.1) (C). Each point represents a single cell and the filled area is a probability distribution of all the cells in that category.
Figure 2 with 11 supplements
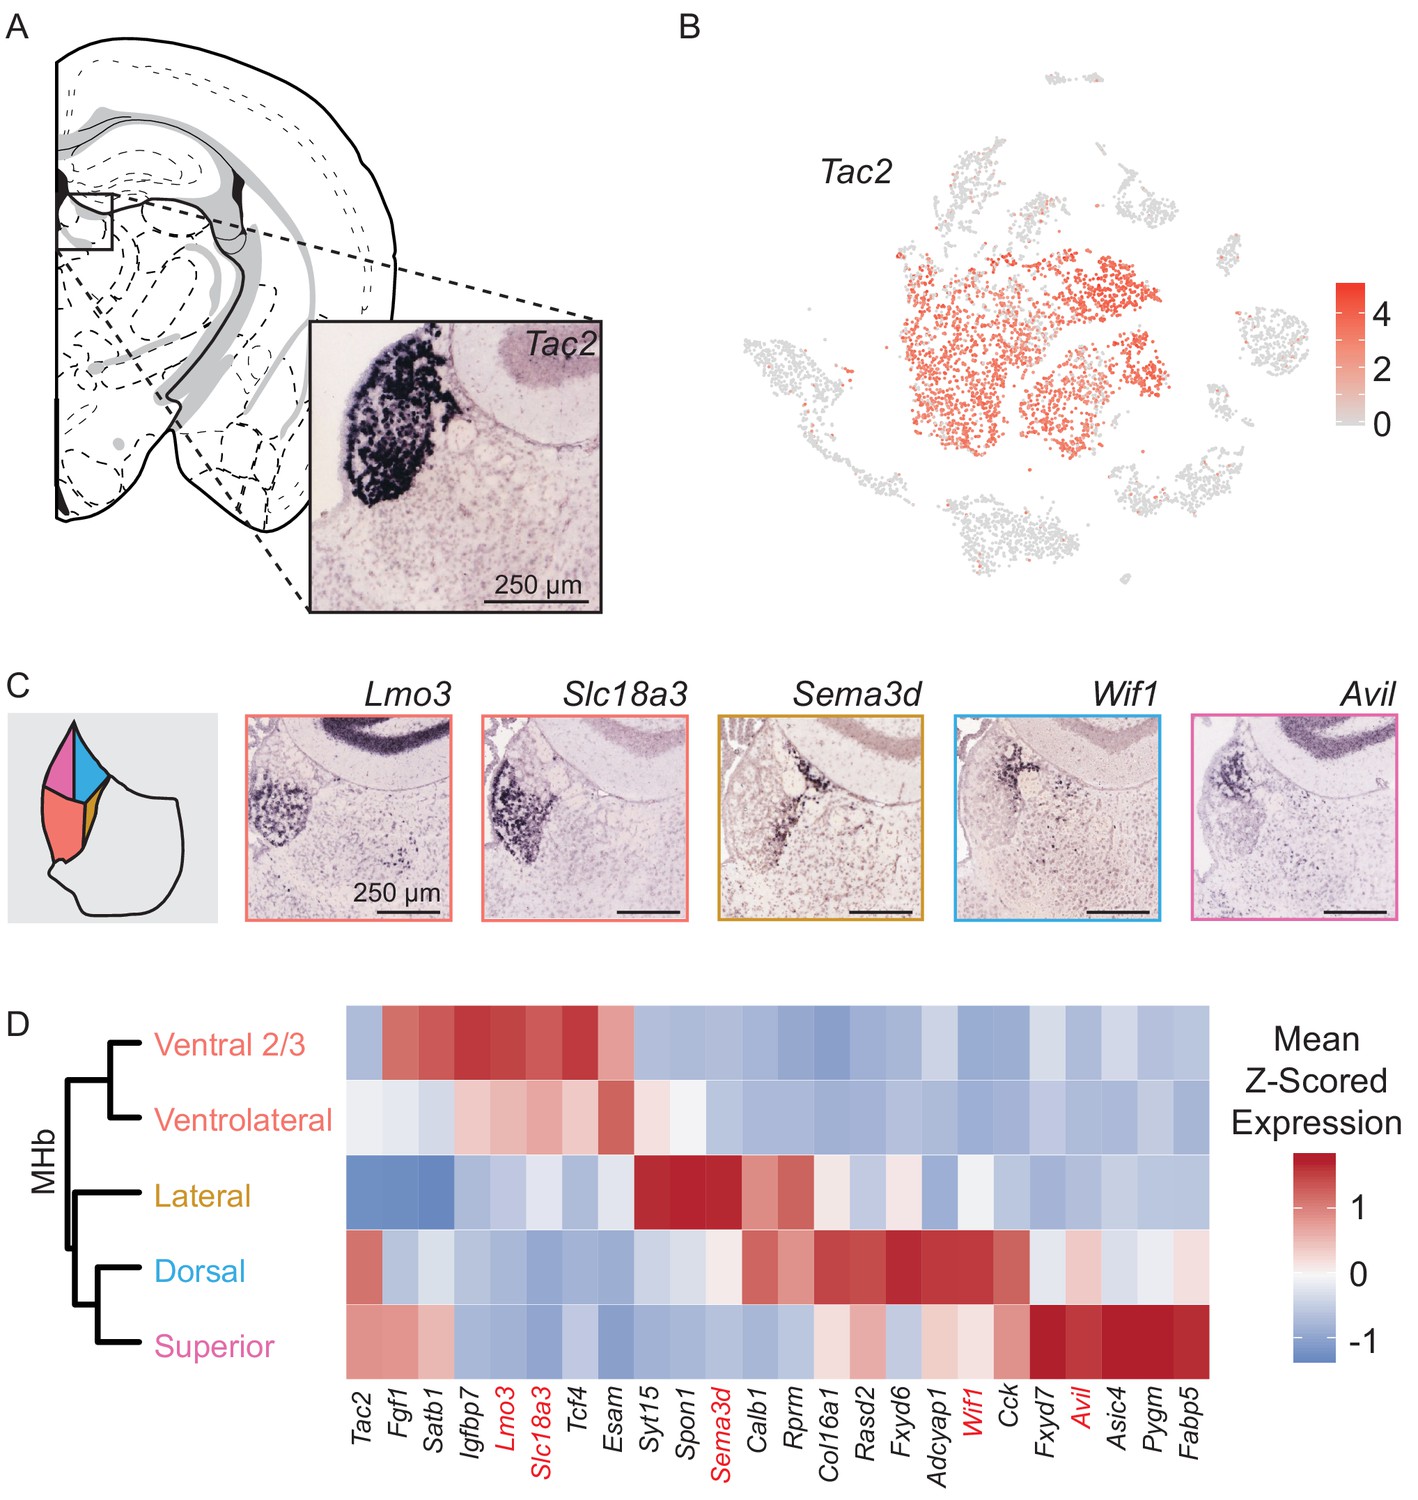
MHb neuron subtypes can be distinguished transcriptionally.
(A) Location of MHb and ISH of Tac2 expression from the Allen Institute Database. Tac2 expression is restricted to cells in the MHb in this region. (B) Tac2 serves as an excellent marker for MHb neurons in the dataset of SCTs (Scale on right shows normalized (log) gene expression.) (C) Left: Illustration showing patterns of gene expression observed for DEGs using the Allen Institute Database. Right: Sample ISH images from the Allen Institute Database showing selected differentially expressed genes for distinct transcriptionally defined neuronal subtypes in MHb. (D) Left: Dendrogram with MHb subtype labels corresponding to clusters shown in (Figure 2—figure supplement 1C). Right: Heatmap showing the relative expression (mean z- scored) of selected genes that are enriched in each MHb neuron subtype. Spatial distributions of enriched genes highlighted in (C) are labeled in red.
Figure 2—figure supplement 1
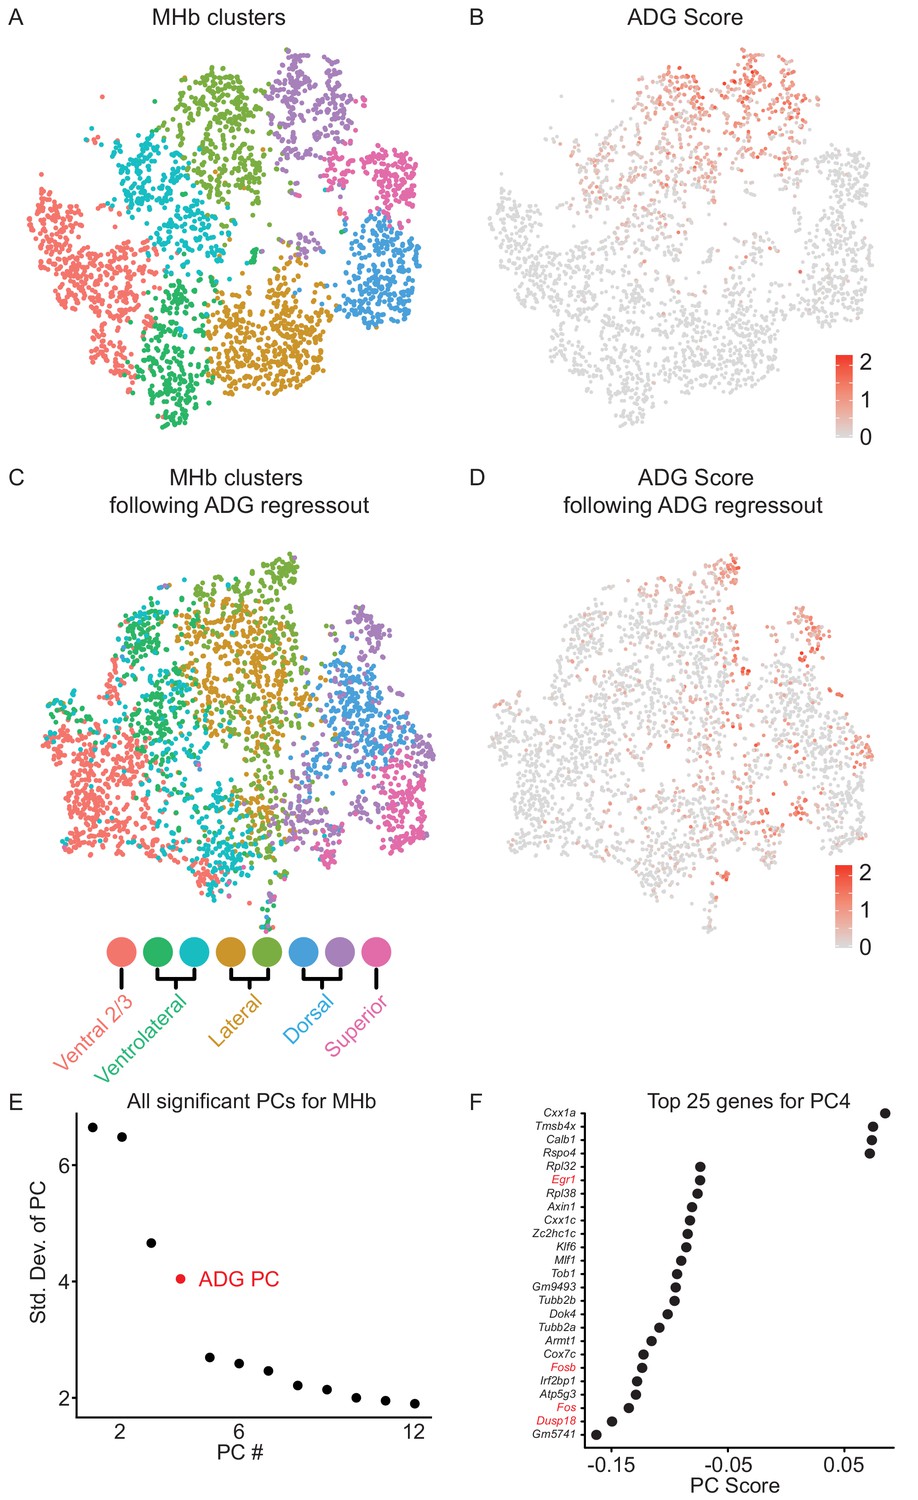
Subclustering of MHb neurons before and after subtraction of heterogeneity introduced by elevated expression of activity-dependent genes (ADGs).
(A) t-SNE plot of subclustered MHb neurons extracted from cells in Figure 1B. (B) t-SNE plot showing three clusters of cells (top) that expressed elevated levels of several ADGs (Fos, Fosb, Egr1, Junb, Dusp18, etc.). (C) t-SNE plot after regressing out the principle component (PC) that included many of the ADGs shown in (B). Cells from clusters that were high in ADG expression were now intermingled with clusters that we defined by the spatial location of their DEGs (See also Figure 2C and D). (D) t-SNE plot showing ADG score following regressing out of the PC containing ADGs. (E) All 12 statistically significant PCs for the MHb neuron clusters shown above. PC number 4 (red) contained several ADGs. (F) The top 25 genes associated with PC4 (the ADG PC) contained several known ADGs highlighted in red.
Figure 2—figure supplement 2
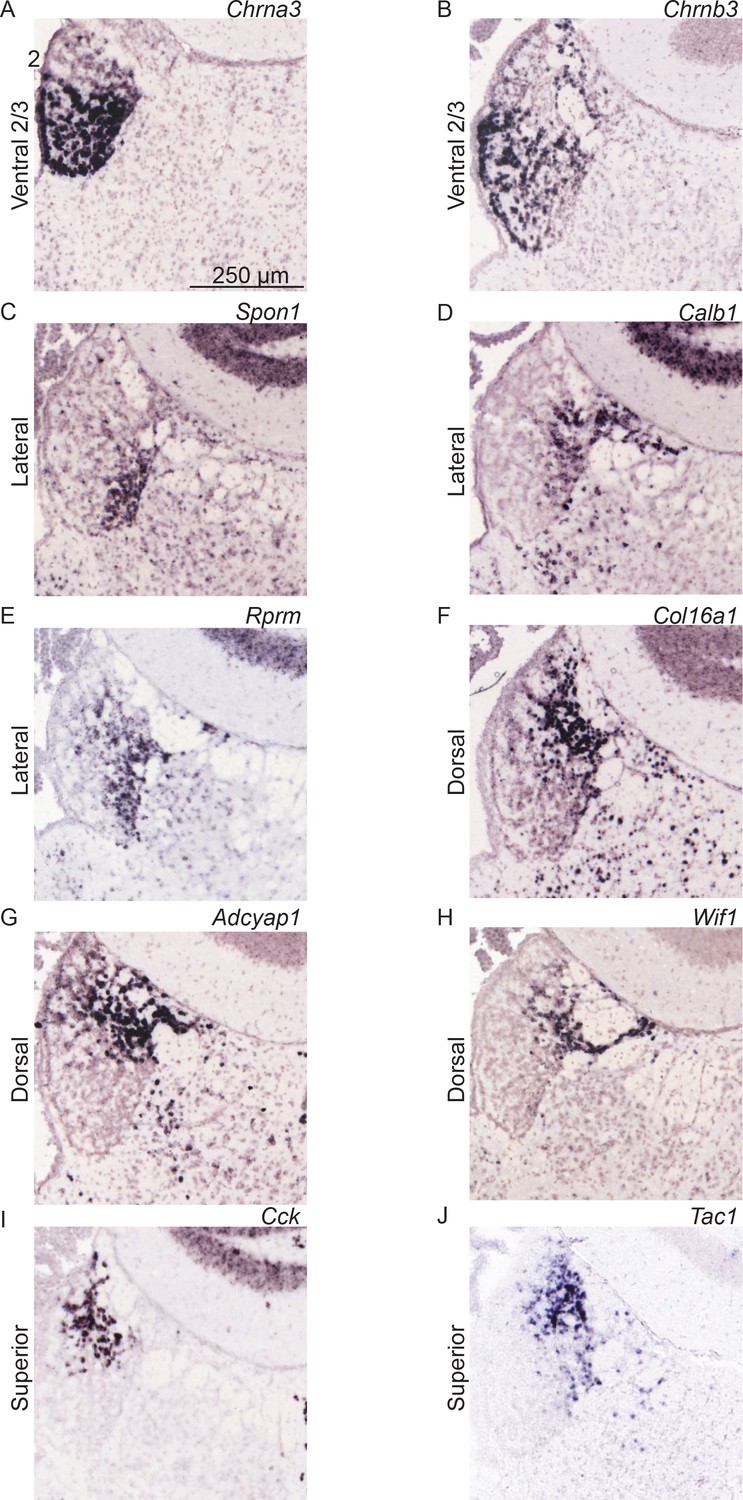
Sample ISH images showing spatial distribution of selected differentially expressed genes in MHb.
(A–J) Sample ISH images from the Allen Institute Database showing selected differentially expressed genes for distinct transcriptionally defined neuronal subtypes in MHb. Gene name is in the upper right of each image and subregion where gene is enriched is on the left. Scale bar = 250 μm.
Figure 2—figure supplement 3
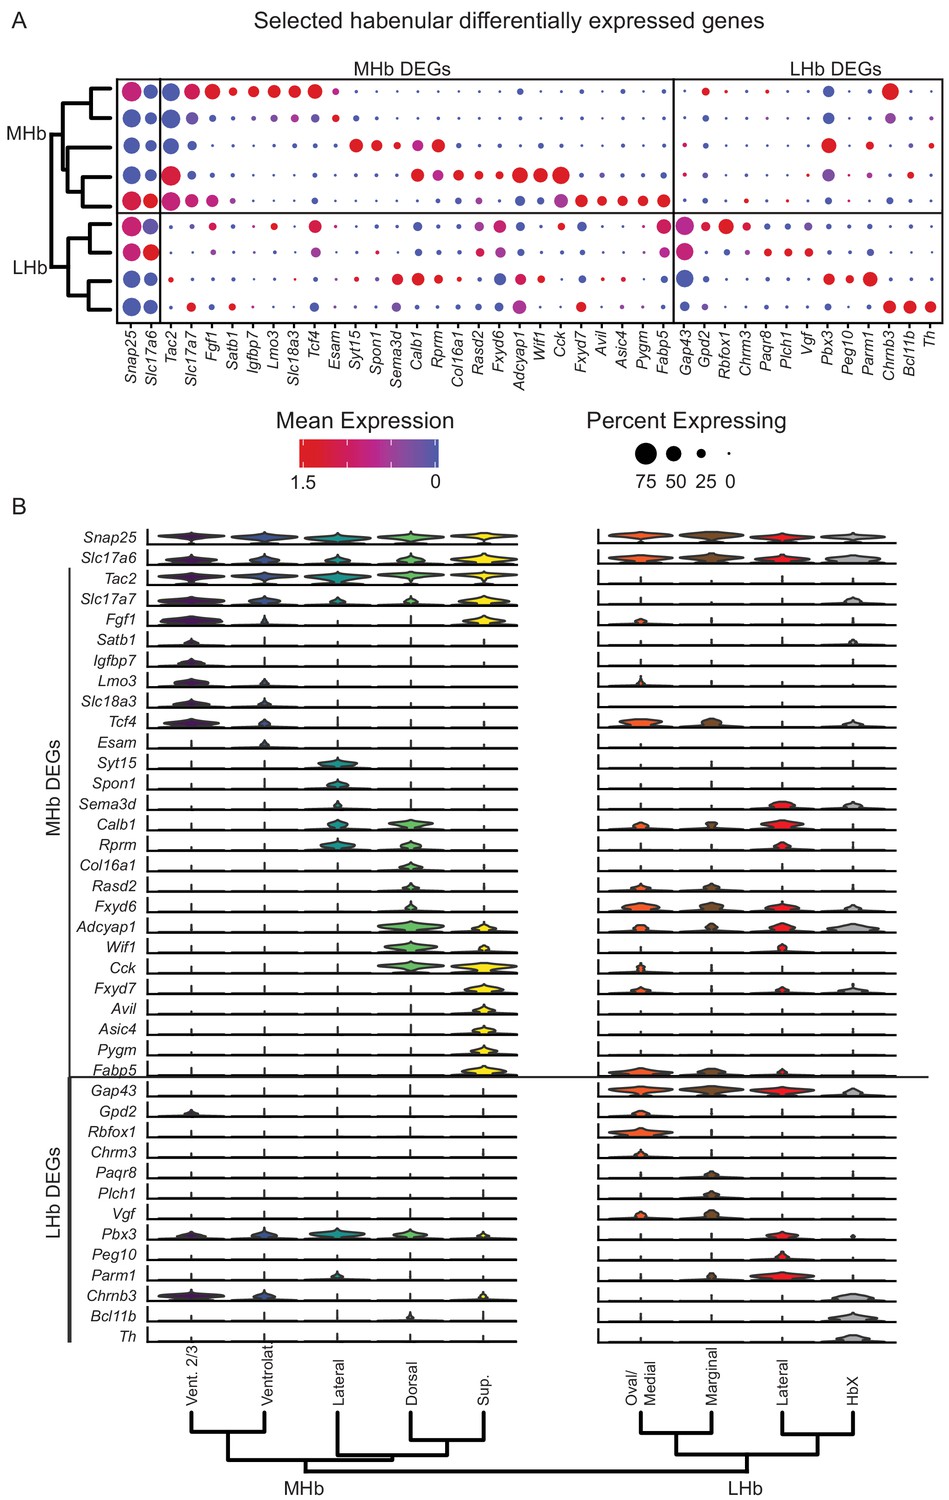
Differentially expressed genes define distinct habenular subtypes.
(A) Left: Dendrogram for subclustering of all neurons shown in Figures 2 and 3. Right: Dot plot displaying expression of example differentially expressed genes used to identify each subtype of habenula neuron. The color of each dot (blue to red) indicates the relative expression of each gene, whereas the dot size indicates the fraction of cells expressing the gene. (B) Violin plots of expression level for select MHb and LHb DEGs. The Y-axis maximum for all plots is 5 (log2 transformed and scaled) and minimum is 1. Colored region of the plot shows the probability distribution of all neurons in the labeled cluster. Only representative genes are shown – for entire list of DEGs see Supplementary file 3 and 5.
Figure 2—figure supplement 4
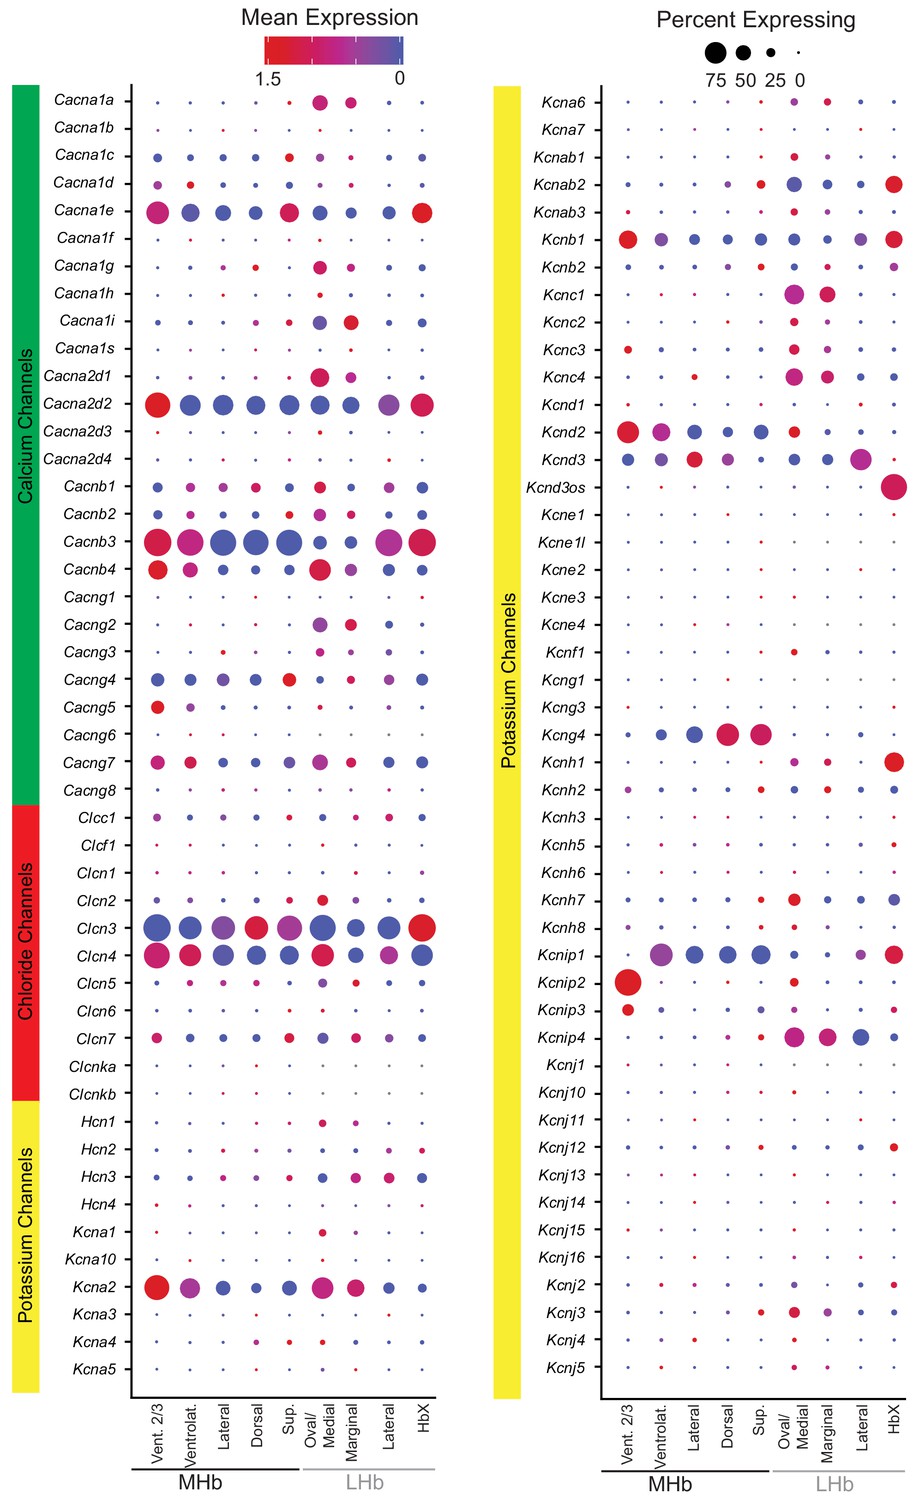
Ion channel diversity in MHb and LHb neuronal subtypes.
Dot plot displaying the expression of all ion channels detected in MHb and LHb neurons. The color of each dot (blue to red) indicates the relative expression of each gene, whereas the dot size indicates the fraction of cells expressing the gene.
Figure 2—figure supplement 5
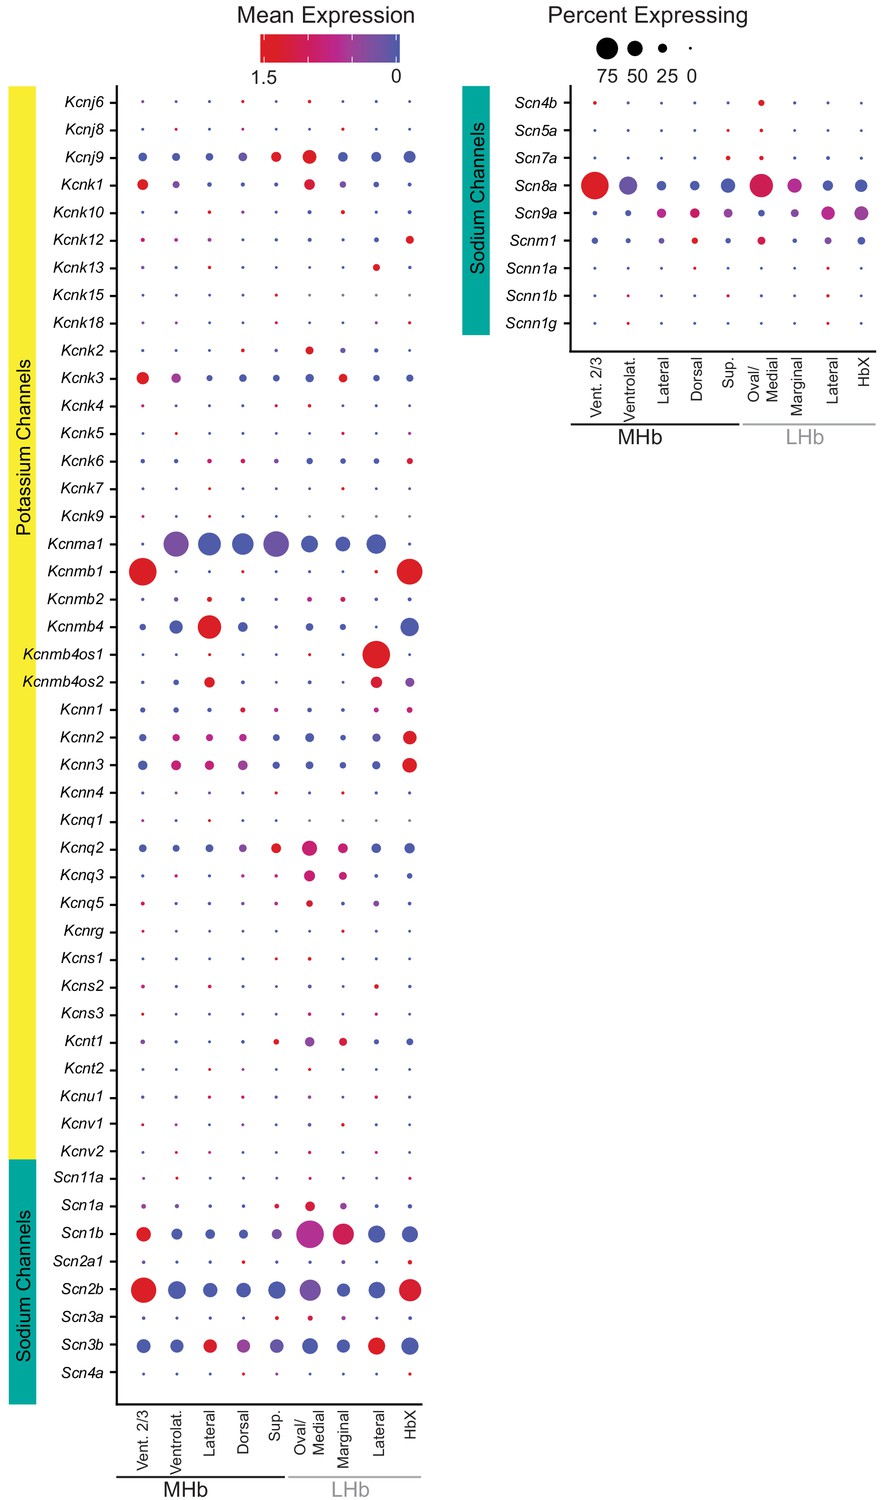
Ion channel diversity in MHb and LHb neuronal subtypes (part 2).
Dot plot displaying the expression of all ion channels detected in MHb and LHb neurons. The color of each dot (blue to red) indicates the relative expression of each gene, whereas the dot size indicates the fraction of cells expressing the gene.
Figure 2—figure supplement 6
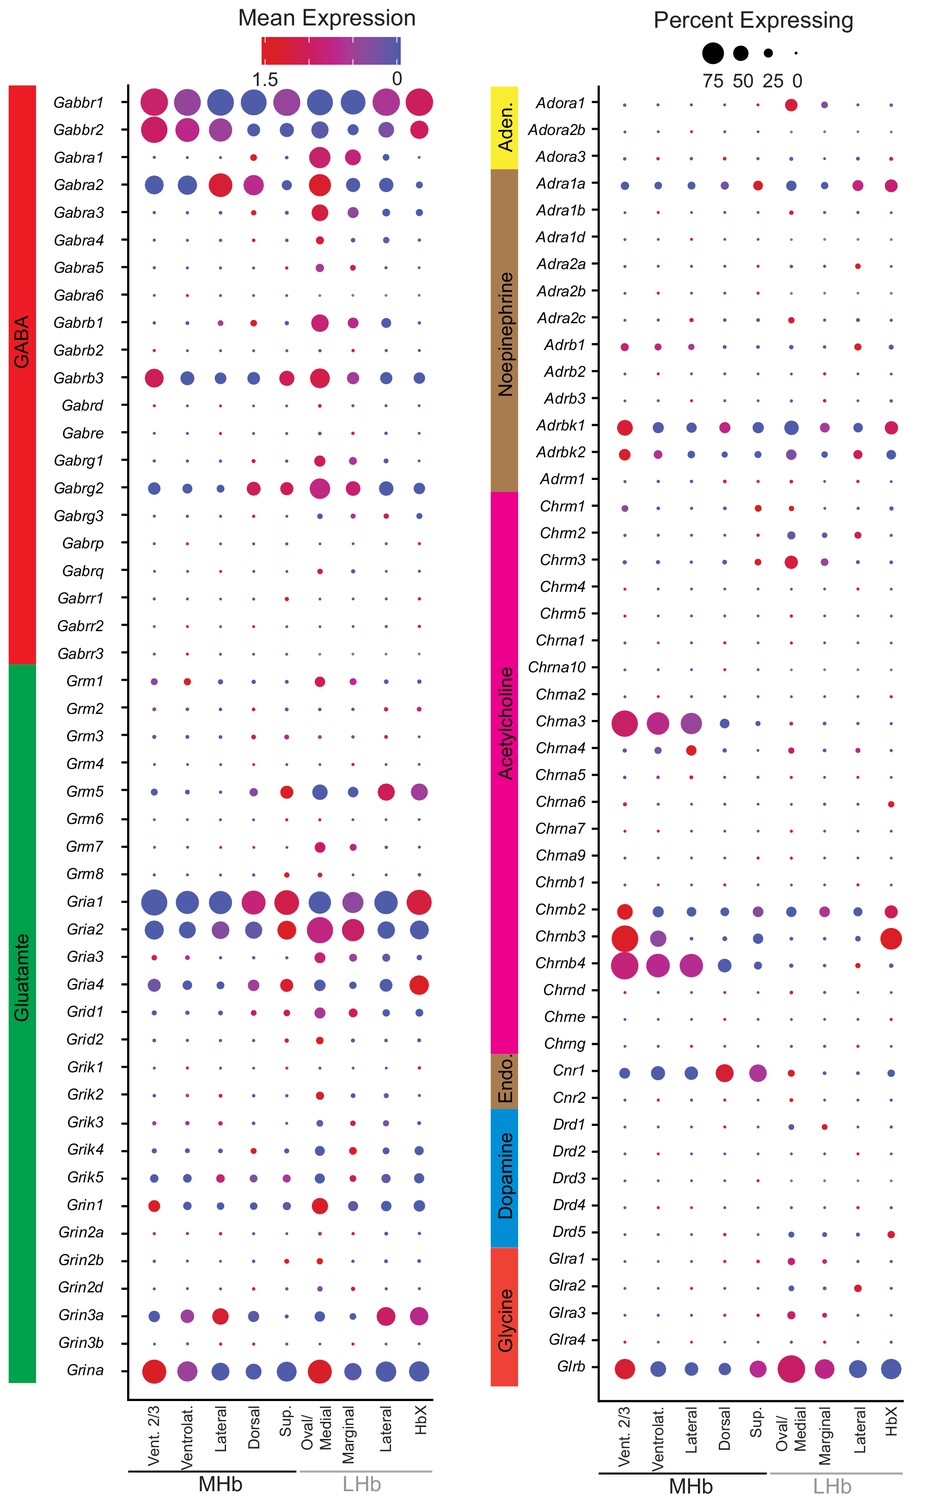
Neurotransmitter receptor diversity in MHb and LHb neuronal subtypes.
Dot plot displaying gene expression of all small molecule neurotransmitter receptors detected in MHb and LHb neurons. The color of each dot (blue to red) indicates the relative expression of each gene, whereas the dot size indicates the fraction of cells expressing the gene.
Figure 2—figure supplement 7
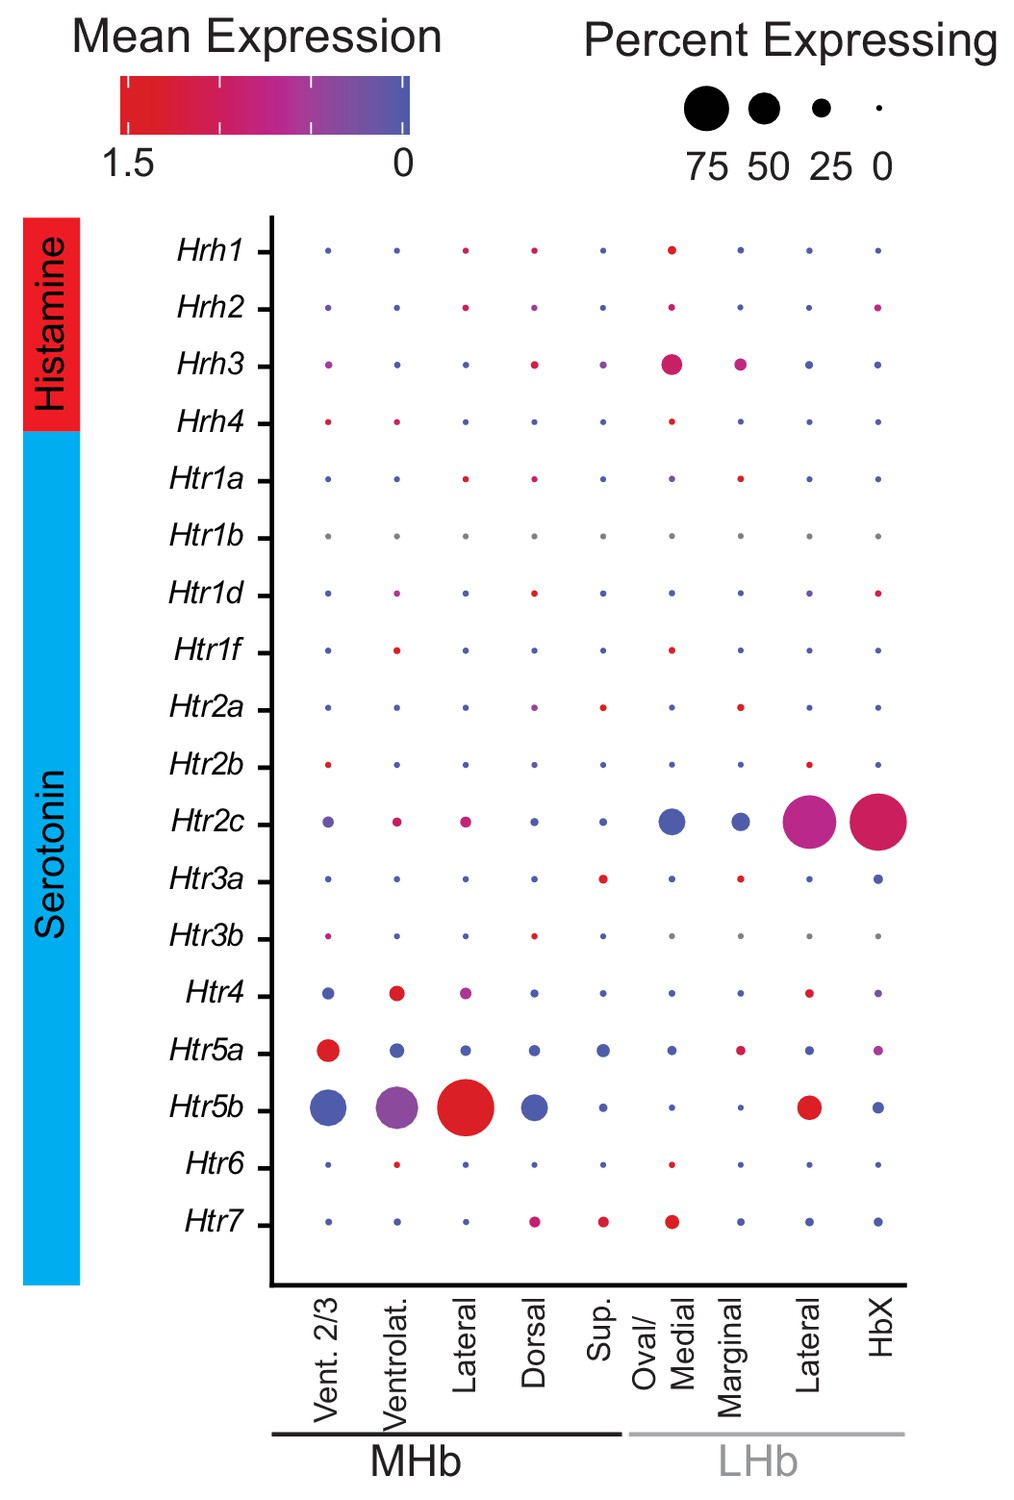
Neurotransmitter receptor diversity in MHb and LHb neuronal subtypes (part 2).
Dot plot displaying gene expression of all small molecule neurotransmitter receptors detected in MHb and LHb neurons. The color of each dot (blue to red) indicates the relative expression of each gene, whereas the dot size indicates the fraction of cells expressing the gene.
Figure 2—figure supplement 8
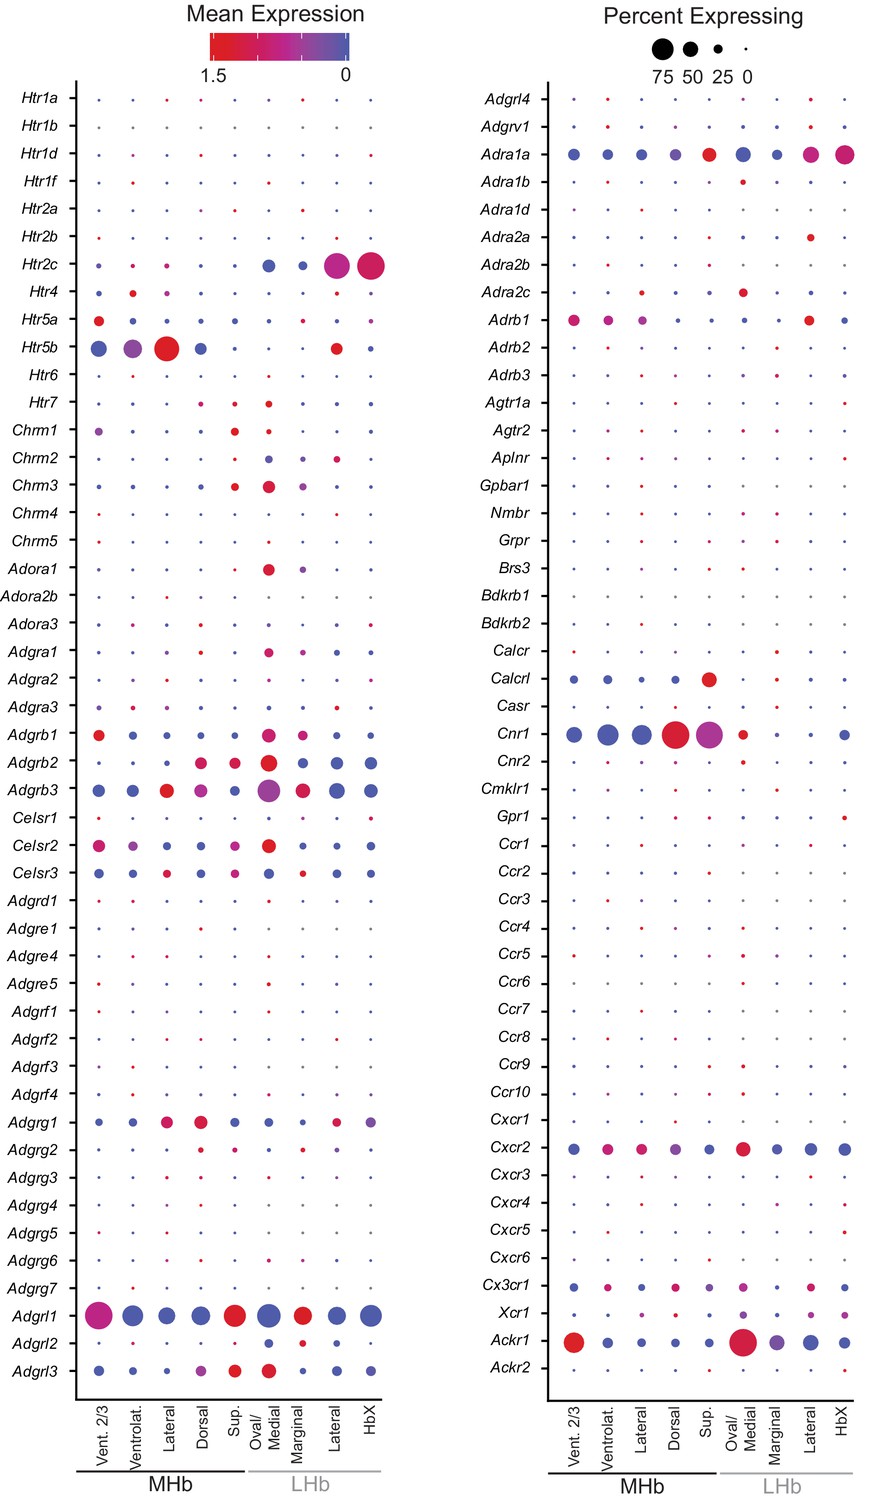
GPCR diversity in MHb and LHb neuronal subtypes.
Dot plot displaying gene expression of all GPCRs detected in MHb and LHb neurons (Harding et al., 2018; Regard et al., 2008). Genes are grouped and listed alphabetically by receptor family name (Adenosine Receptors, Somatostatin Receptors, etc.). The color of each dot (blue to red) indicates the relative expression of each gene whereas the dot size indicates the fraction of cells expressing the gene.
Figure 2—figure supplement 9

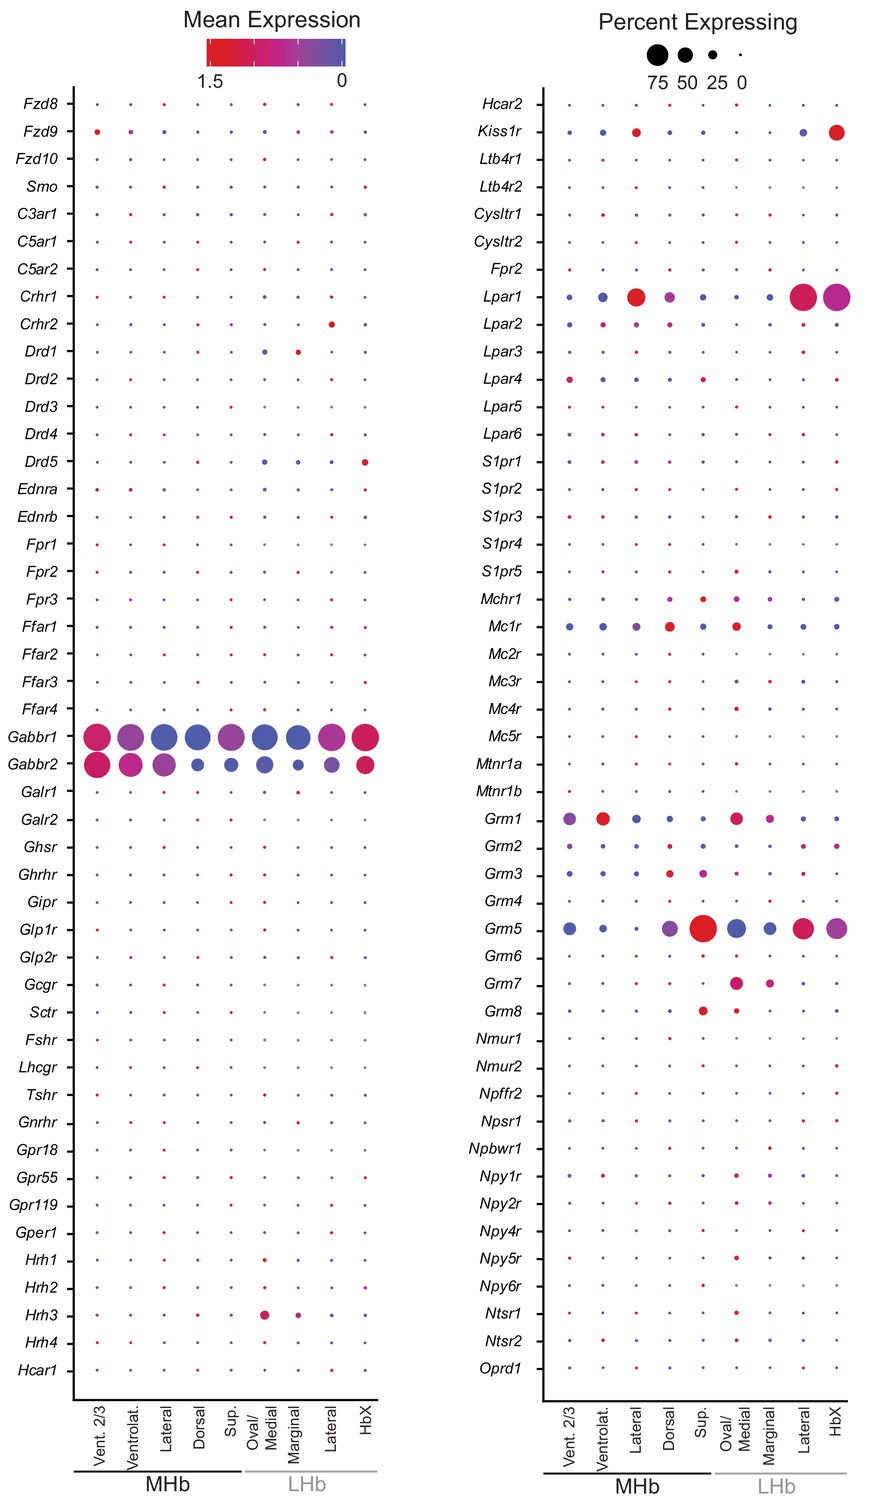
GPCR diversity in MHb and LHb neuronal subtypes (part 2).
Dot plot displaying gene expression of all GPCRs detected in MHb and LHb neurons (Harding et al., 2018; Regard et al., 2008). Genes are grouped and listed alphabetically by receptor family name (Adenosine Receptors, Somatostatin Receptors, etc.). The color of each dot (blue to red) indicates the relative expression of each gene whereas the dot size indicates the fraction of cells expressing the gene.
Figure 2—figure supplement 10
GPCR diversity in MHb and LHb neuronal subtypes (part 3).
Dot plot displaying gene expression of all GPCRs detected in MHb and LHb neurons (Harding et al., 2018; Regard et al., 2008). Genes are grouped and listed alphabetically by receptor family name (Adenosine Receptors, Somatostatin Receptors, etc.). The color of each dot (blue to red) indicates the relative expression of each gene whereas the dot size indicates the fraction of cells expressing the gene.
Figure 2—figure supplement 11
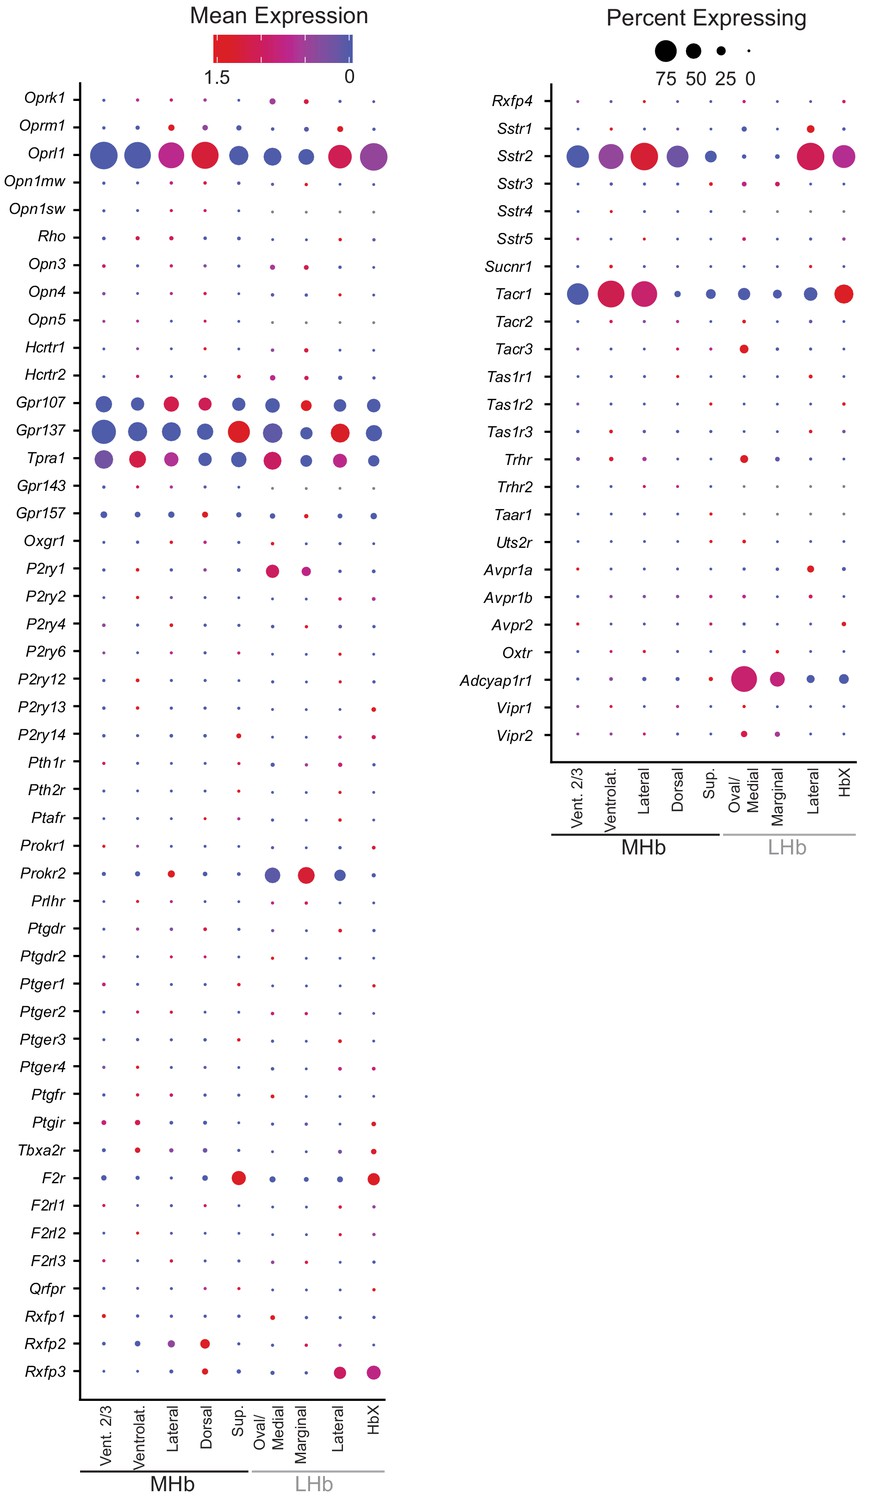
GPCR diversity in MHb and LHb neuronal subtypes (part 4).
Dot plot displaying gene expression of all GPCRs detected in MHb and LHb neurons (Harding et al., 2018; Regard et al., 2008). Genes are grouped and listed alphabetically by receptor family name (Adenosine Receptors, Somatostatin Receptors, etc.). The color of each dot (blue to red) indicates the relative expression of each gene whereas the dot size indicates the fraction of cells expressing the gene.
Figure 3
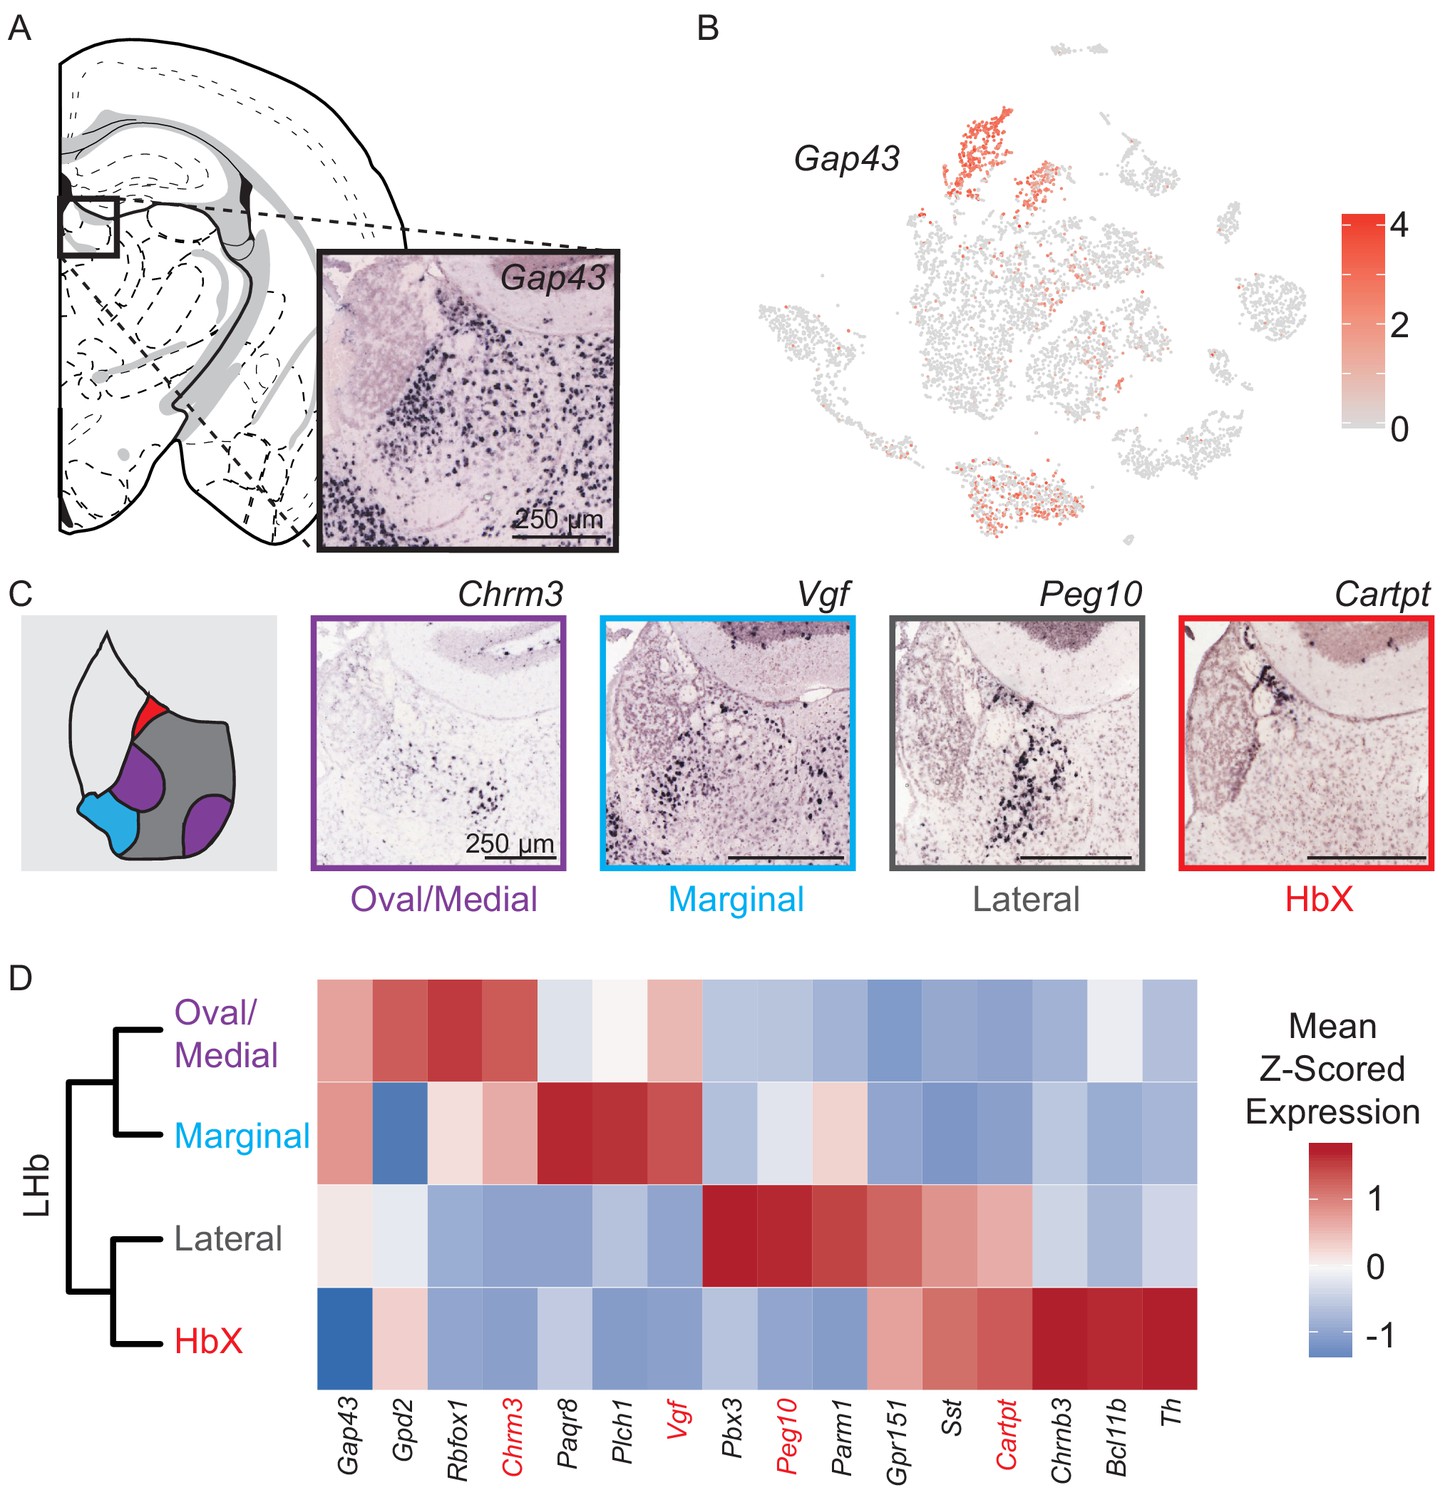
Characterization of genes differentially expressed between LHb neuron subtypes.
(A) Location of LHb clusters and ISH Gap43 expression from the Allen Institute Database. Gap43 is highly expressed in neurons of the LHb and surrounding thalamus in this region, but excluded from MHb neurons. (B) Gap43 serves as an excellent marker for LHb neurons in the dataset of single-cell transcriptomes (Scale on right shows normalized (log) gene expression.) (C) Left: Illustration showing patterns of gene expression observed for DEGs. Right: Sample ISH images from the Allen Institute Database showing selected differentially expressed genes for distinct transcriptionally defined neuronal subtypes in LHb. (D) Left: Dendrogram with LHb neuron labels corresponding spatial locations of differentially expressed genes within the LHb. Right: Heatmap showing the relative expression of selected genes that are enriched in each LHb neuron subtype. Spatial distributions of enriched genes highlighted in (C) are labeled in red.
Figure 4 with 3 supplements

FISH confirms that differentially expressed genes from LHb subclusters are nonoverlapping and confined to specific spatial locations of LHb.
(A) Left: Sample FISH of two differentially expressed LHb genes (Vgf (yellow) and Chrm3 (magenta)), with distinct spatial profiles (LHb outlined with gray dashed line). Right: Quantification of fluorescence coverage of single cells for FISH of Vgf and Chrm3 in LHb neurons (n = 444 cells, three mice). (B) Left: Sample FISH of two differentially expressed LHb genes (Sst (yellow) and Chrm3 (magenta)), with distinct spatial profiles. Right: Quantification of fluorescence coverage of single cells for FISH of Sst and Chrm3 in LHb neurons (n = 252 cells, three mice). (C) Left: Sample FISH of two differentially expressed LHb genes (Gpr151 (yellow) and Chrm3 (magenta)), with distinct spatial profiles (illustrated in upper right inset), LHb outlined in gray dashed line. Right: Quantification of fluorescence coverage of single cells for FISH of Gpr151 and Chrm3 in LHb neurons (n = 240 cells, three mice). (D) Left: Sample FISH of two differentially expressed LHb genes (Sst (yellow) and Gpr151 (magenta)), with similar spatial profiles (both expressed in HbX region). Inset of overlapping Sst and Gpr151 expression in HbX. Right: Quantification of fluorescence coverage of single cells for FISH of Sst and Gpr151 in LHb neurons (n = 112 cells, three mice).
Figure 4—figure supplement 1

A map of habenula subregions based on single-cell transcriptomic profiling.
(A) Habenular subregions are outlined in black, MHb subregions are green and LHb subregions are magenta. The location of borders is a rough estimate of a boundary between transcriptionally defined neuronal subtypes that have been confirmed with FISH and previous literature. Importantly, this map depicts the region of habenula that is located in the middle of the anterior/posterior axis of the nucleus and does not apply to the anterior and posterior poles where subregions are less well defined.
Figure 4—figure supplement 2
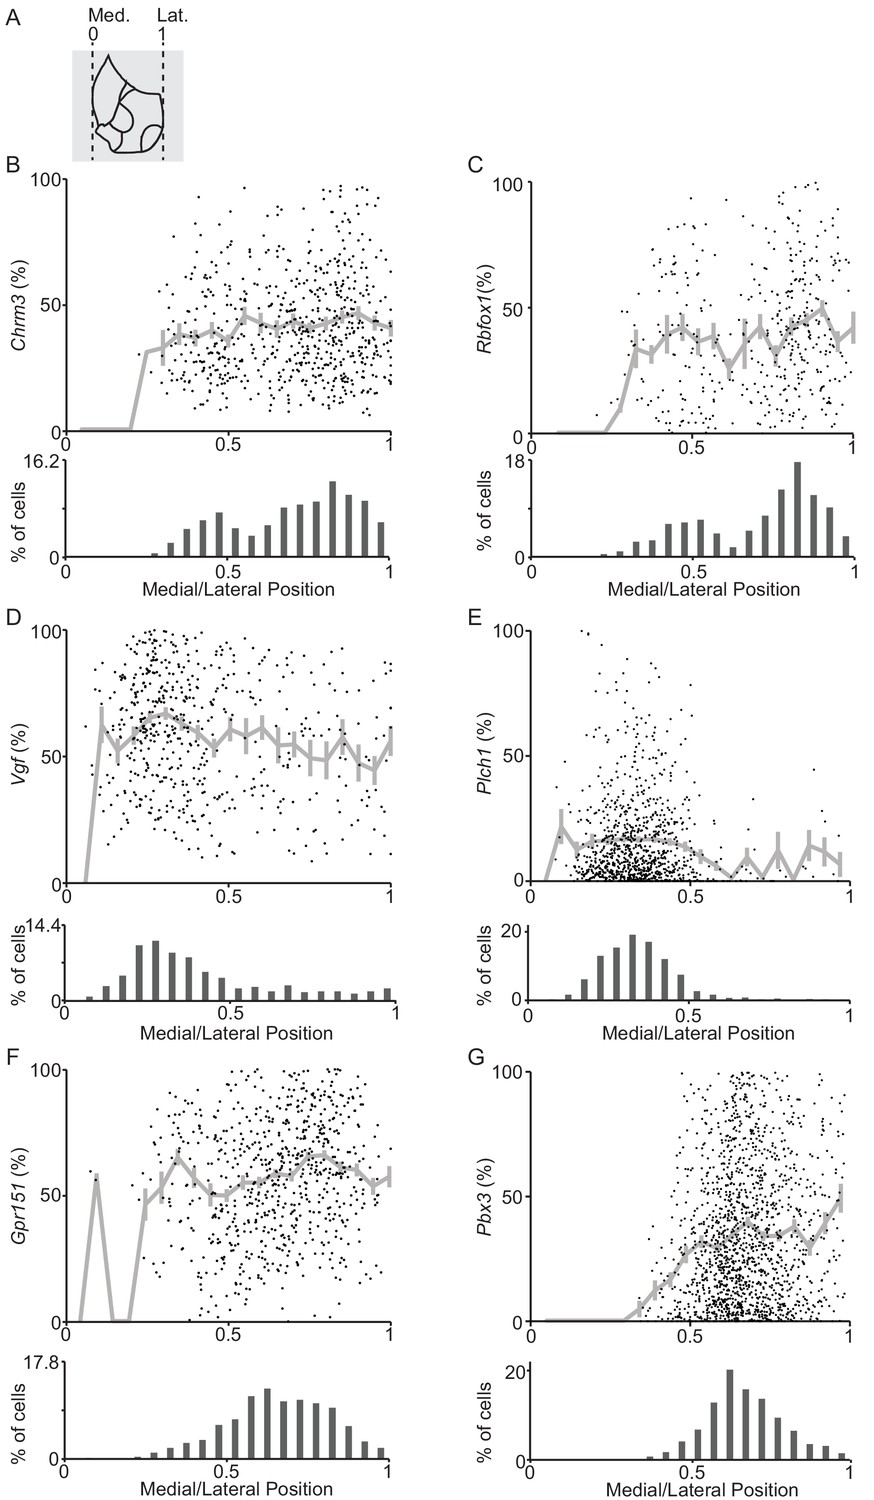
Spatial distribution of gene expression patterns along the medial/lateral axis for selected LHb DEGs.
(A) Illustration of LHb subregions depicting the medial (0) and lateral (1) edges of the habenula used to describe the spatial distribution of gene expression. (B,C) (Top) Expression levels of Chrm3 (B) or Rbfox1 (C) in individual LHb neurons along the medial/lateral axis. Gray line is the mean expression level and vertical bars are the SEM for each bin (bin size 0.05). (Bottom) Histogram showing the distribution of the density of Chrm3+ (B) or Rbfox1+ (C) neurons along the medial lateral axis of LHb (Chrm3: n = 616 cells/3 mice, Rbfox1: n = 392 cells/3 mice). (D,E) (Top) Expression levels of Vgf (D) or Plch1 (E) in individual LHb neurons along the medial/lateral axis. Gray line is the mean expression level and vertical bars are the SEM for each bin (bin size 0.05). (Bottom) Histogram showing the distribution of the density of Vgf+ (D) or Plch1+ (E) neurons along the medial lateral axis of LHb (Vgf: n = 535 cells/3 mice, Plch1: n = 961 cells/3 mice). (F,G) (Top) Expression levels of Gpr151 (F) or Pbx3 (G) in individual LHb neurons along the medial/lateral axis. Gray line is the mean expression level and vertical bars are the SEM for each bin (bin size 0.05). (Bottom) Histogram showing the distribution of the density of Gpr151+ (F) or Pbx3+ (G) neurons along the medial lateral axis of LHb (Gpr151: n = 1122 cells/3 mice, Pbx3: n = 1507 cells/3 mice).
Figure 4—figure supplement 3

FISH confirms that differentially expressed genes from the same LHb subcluster are overlapping and confined to similar spatial locations of LHb.
(A) Left: Sample FISH of two differentially expressed LHb genes (Chrm3 (yellow) and Rbfox1 (magenta)), from the same cluster (Oval/Medial) (LHb outlined with gray dashed line). Right: Quantification of fluorescence coverage of single cells for FISH of Chrm3 and Rbfox1 in LHb neurons (n = 392 cells, three mice). (B) Left: Sample FISH of two differentially expressed LHb genes (Vgf (yellow) and Plch1 (magenta)), from the same cluster (Marginal) (LHb outlined with gray dashed line). Right: Quantification of fluorescence coverage of single cells for FISH of Vgf and Plch1 in LHb neurons (n = 561 cells, three mice). (C) Left: Sample FISH of two differentially expressed LHb genes (Gpr151 (yellow) and Pbx3 (magenta)), from the same cluster (Lateral) (LHb outlined with gray dashed line). Right: Quantification of fluorescence coverage of single cells for FISH of Gpr151 and Pbx3 in LHb neurons (n = 546 cells, three mice).
Figure 5 with 3 supplements
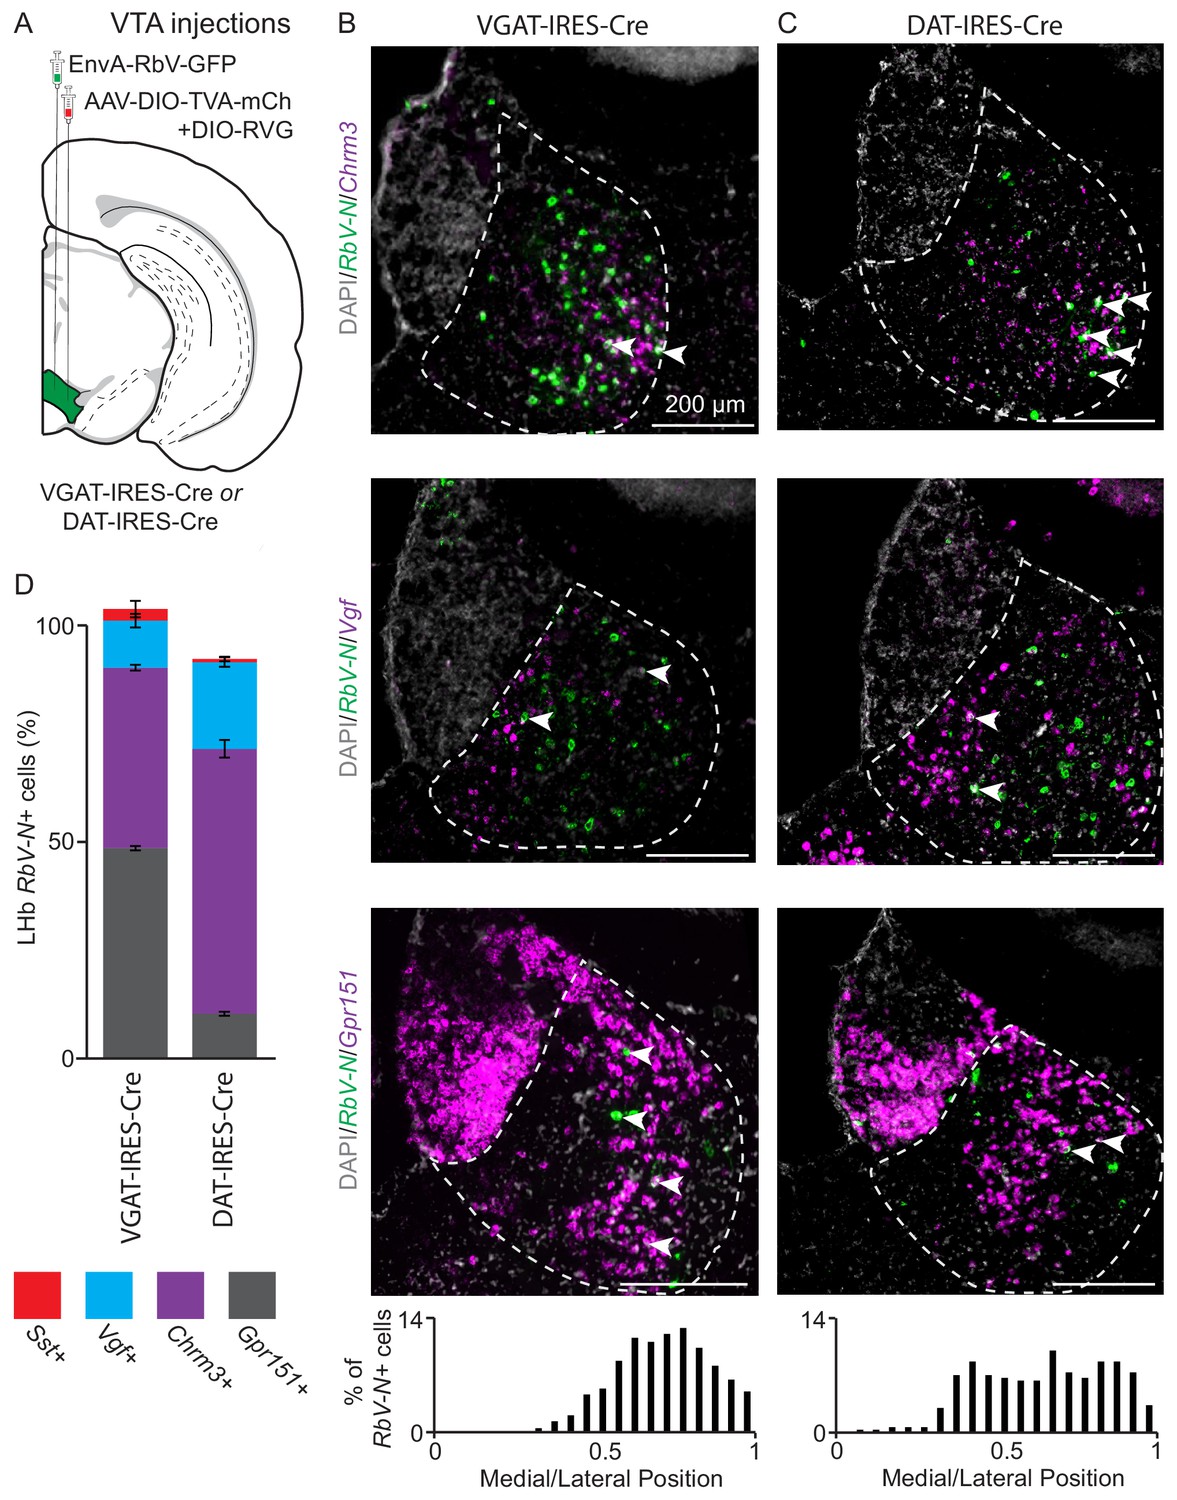
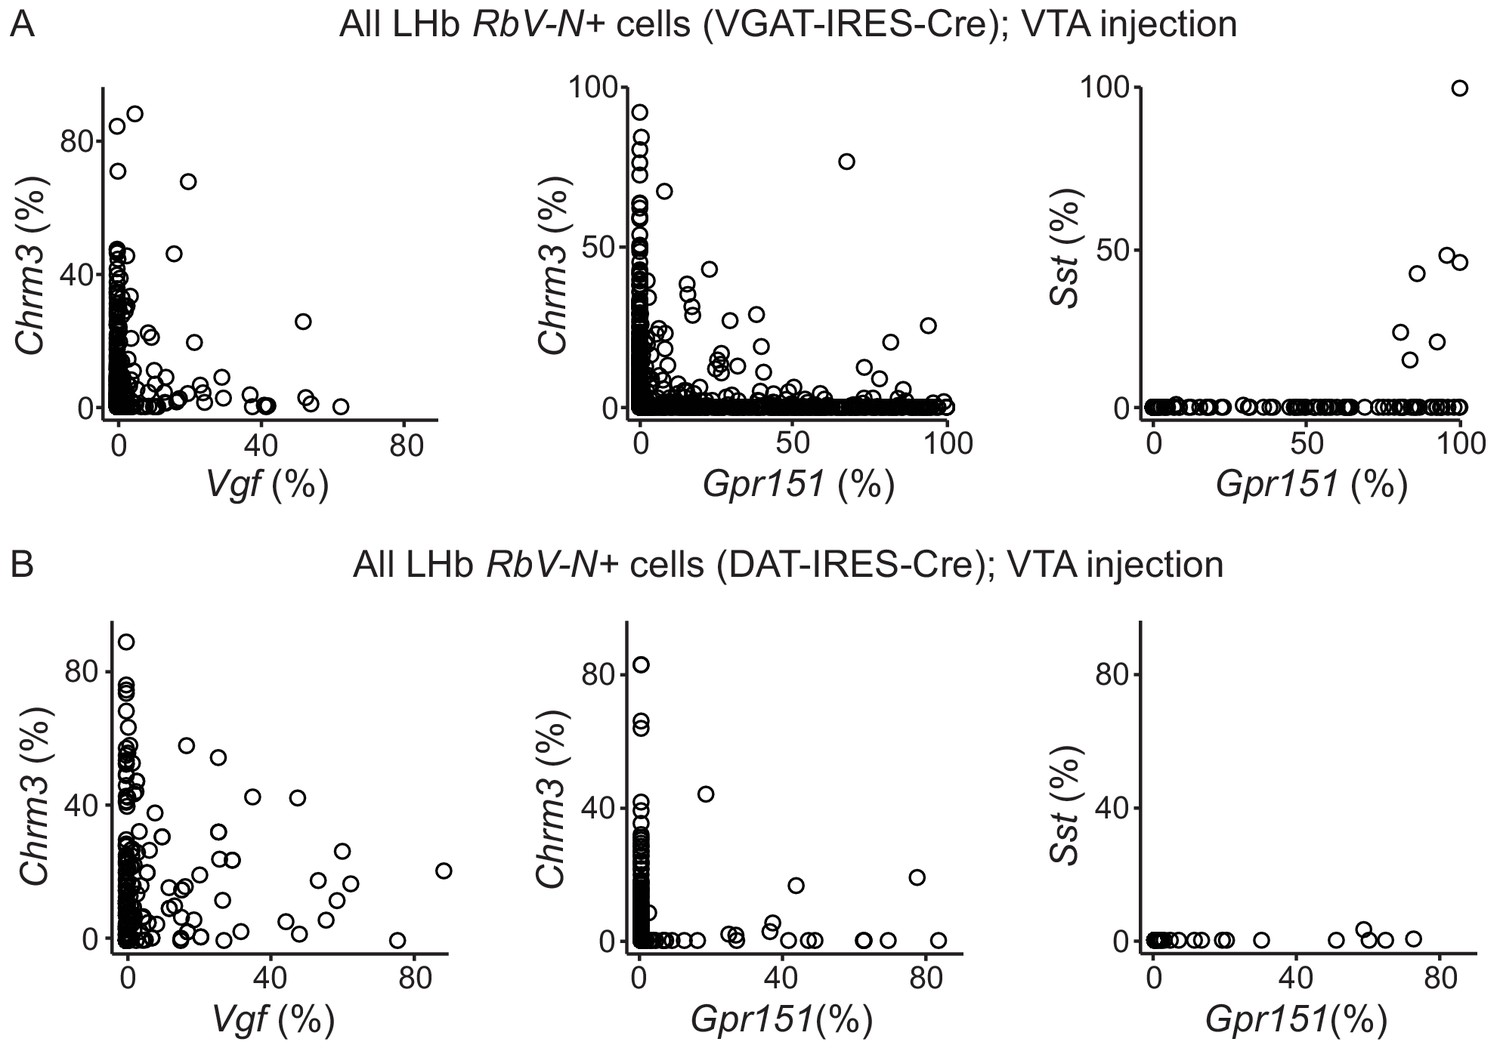
Distinct LHb neuron subtypes prefer different downstream targets, but all subtypes target both the VTA.
(A) Location of site for AAV helper viruses (AAV-FLEX-TVA-mCh and AAV-FLEX-RVG) and pseudotyped rabies virus (EnvA-RbV-GFP) injection into VTA. (B) Sample habenula FISH images for RbV-N and Chrm3 (top), Vgf (middle), or Gpr151 (bottom) following viral injection into the VTA of a VGAT-IRES-Cre mouse. Arrow heads show RbV-N+ cells coexpressing the DEG in each image. Histogram at bottom shows the distribution of the density of RbV-N+ neurons along the medial lateral axis of LHb (n = 822 cells/4 animals). (C) Sample habenula FISH images for RbV-N and Chrm3 (top), Vgf (middle), or Gpr151 (bottom) following viral injection into the VTA of a DAT-IRES-Cre mouse. Arrow heads show RbV-N+ cells coexpressing the DEG in each image. Histogram at bottom shows the distribution of the density of RbV-N+ neurons along the medial lateral axis of LHb (n = 299 cells/3 animals). (D) Quantification of the proportion of RbV-N labeled neurons that overlapped with the enriched genes for distinct LHb neuron subtypes (VGAT-IRES-Cre n = 1430 cells/ four mice and DAT-IRES-Cre n = 549/3 mice). Filled rectangles are the mean and error bars are ± SEM, see Supplementary file 6 for statistical comparisons.
Figure 5—figure supplement 1
Cells from all four LHb subtypes project to both VGAT-IRES-Cre+ and DAT-IRES-Cre+ cells in the VTA.
(A) Quantification of fluorescence coverage of single cells for FISH of selected enriched genes in LHb neurons that were positive for RbV-N following monosynaptic retrograde tracing from VGAT-IRES-Cre+ neurons in the VTA (left: n = 521 cells, four mice; center: n = 742 cells, four mice; right: n = 167 cells, two mice). (B) Quantification of fluorescence coverage of single cells for FISH of selected enriched genes in LHb neurons that were positive for RbV-N following monosynaptic retrograde tracing from DAT-IRES-Cre+ neurons in the VTA (left: n = 233 cells, three mice; center: n = 233 cells, three mice; right: n = 103 cells, three mice).
Figure 5—figure supplement 2

Quantification and genetic characterization of VTA starter cells from monosynaptic retrograde tracing and controls for rabies virus.
(A) Left: Coronal section of injection site into VTA and starter cells location for Cre-dependent monosynaptic retrograde-tracing experiments. Right: FISH for RbV-N to demonstrate the location of rabies infected cells in the VTA. (B) Negative control for EnvA pseudotyping of the rabies virus (EnvA-RbV-GFP) showing a coronal section following injection of EnvA-RbV-GFP into the VTA without prior infection by AAV-TVA-mCh. Without co injecting AAV-DIO-TVA-mCh, EnvA-RbV-GFP cannot infect neurons, thus no GFP expression. (C) Controls for specificity of starter cell populations. EnvA-RbV-GFP was injected into the VTA of VGAT-IRES-Cre (left) and DAT-IRES-Cre (right) mice following injection of AAV-DIO-TVA-mCh, but not AAV-DIO-RVG. Therefore, rabies virus could not spread from initially infected neurons. Left: Quantification of fluorescence coverage of RbV-N+ cells in VGAT-IRES-Cre mice, almost all (99%) infected cells expressed detectable levels of Cre demonstrating specificity of the AAV-DIO-TVA virus (n = 319 cells, two mice). Right: Quantification of fluorescence coverage of RbV-N+ cells in DAT-IRES-Cre mice, almost all infected cells (95%) expressed detectable levels of Cre demonstrating specificity of the AAV-DIO-TVA virus (n = 522 cells, two mice). (D) Sample VTA FISH image of starter cell location for monosynaptic retrograde tracing experiments performed in VGAT-IRES-Cre mice. Inset depicts two putative starter cells (arrowheads) that express RbV-N (green) and Cre (red). VTA is outlined by white dashed line. (E) Sample VTA FISH image of starter cell location for monosynaptic retrograde tracing experiments performed in DAT-IRES-Cre mice. Inset depicts three putative starter cells (arrowheads) that express RbV-N (green) and Cre (red). VTA is outlined by white dashed line. (F) Left: Quantification of fluorescence coverage of single putative starter cells (Cre+ and RbV-N+) for FISH of Cre and Slc17a6 in VTA neurons of the VGAT-IRES-Cre animals (n = 567 cells, four mice). Right: The proportion of putative starter cells that expressed Slc17a6. There is a subset of VGAT-IRES-Cre+ neurons in the VTA that co-express Slc17a6 (Root et al., 2014). (G) Left: Quantification of fluorescence coverage of single putative starter cells (Slc6a3+ and RbV-N+) for FISH of Slc6a3 and Slc32a1 in VTA neurons of the DAT-IRES-Cre animals (n = 566 cells, three mice). Right: The proportion of putative starter cells that expressed Slc32a1. Note: Approximately 12% (451/3754 cells/4 mice) of Slc32a1+ VTA neurons were starter cells in VGAT-IRES-Cre retrograde labeling experiments. In DAT-IRES-Cre experiments, approximately 18% (468/2598 cells/3 mice) of Slc6a3+ VTA neurons were starter cells. Filled rectangles represent the mean and error bars are ± SEM, Abbreviations: IPN - interpeduncular nucleus, SNr – substantia nigra reticulata.
Figure 5—figure supplement 3
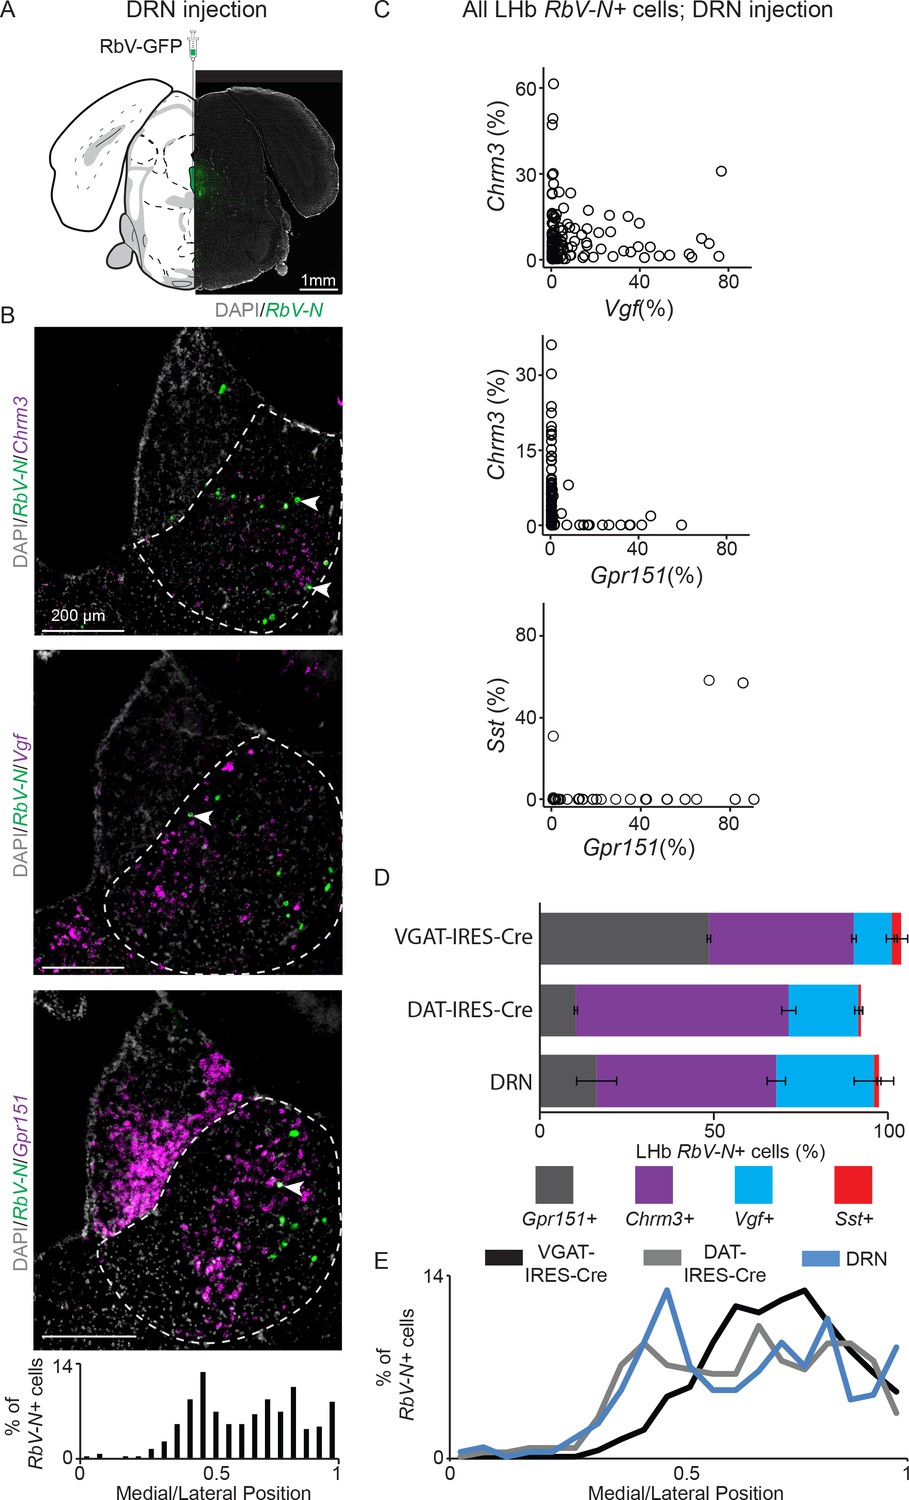
Quantification and genetic characterization of LHb cells that project to the DRN using a nonpseudotyped (G-deleted) rabies virus.
(A) Location of site for nonpseudotyped (G-deleted) rabies virus (RbV-GFP) injection into DRN. (B) Sample habenula FISH images for RbV-N and Chrm3 (top), Vgf (middle), or Gpr151 (bottom) following viral injection into the DRN. Arrow heads show RbV-N+ cells coexpressing the DEG in each image. Histogram shows the distribution of the density of RbV-N+ neurons along the medial lateral axis of LHb (n = 274 cells/4 animals). (C) Quantification of fluorescence coverage of single cells for FISH of selected enriched genes in LHb neurons that were positive for RbV-N following injection of RbV-GFP into the DRN (top: n = 163 cells, 3 mice; middle: n = 133 cells, 3 mice; bottom: n = 169 cells, 3 mice). (D) Quantification of the proportion of RbV-N-labeled neurons that overlapped with the enriched genes for distinct LHb neuron subtypes (VGAT-IRES-Cre n = 1430 cells/4 mice, DAT-IRES-Cre n = 549/3 mice, and DRN n = 465/3 mice). Filled rectangles are the mean and error bars are ± SEM, see Supplementary file 6 for statistical comparisons. (E) Histogram showing the medial lateral distribution of RbV-N+ cells labeled in all three retrograde labeling experiments for comparison (bin size = 0.05).
Tables
Key resources table
| Reagent type (species) or resource | Designation | Source or reference | Identifiers | Additional information |
|---|---|---|---|---|
| Strain (Mus musculus) | C57Bl/6J | The Jackson Laboratory | Cat# JAX:000664 RRID: IMSR_JAX:000664 | |
| Genetic reagent (Mus musculus) | VGAT-IRES-Cre | The Jackson Laboratory | Cat# JAX: 016962 RRID: IMSR_JAX:016962 | |
| Genetic reagent (Mus musculus) | DAT-IRES-Cre | The Jackson Laboratory | Cat# JAX: 006660 RRID: IMSR_JAX:006660 | |
| Genetic reagent (non-pseudotyped G-deleted rabies virus) | B19-SADdG- EGFP, RbV-GFP | Other | N/A | Generated in-house (see Materials and methods) 109 IU/mL |
| Genetic reagent (pseudotyped G-deleted rabies virus) | EnvA-RbV-GFP | Janelia Viral Tools facility | Addgene# 52487 RRID: Addgene_52487 | 108 IU/mL |
| Commercial assay, kit | RNAscope V1 fluorescent multiplex detection assay reagents | ACDBio | Cat#320851 | |
| Commerical assay, kit | RNAscope V1 fluorescent multiplex detection assay probes | ACDBio | Cat# 456781 Cat# 317321 Cat# 404631 Cat# 556241 Cat# 436381 Cat# 519911 Cat# 437701 Cat# 517421 Cat# 423321 Cat# 319171 Cat# 319191 Cat# 315441 | V-RABV-gp1 Gpr151 Sst Plch1 Pbx3 Rbfox1 Chrm3 Vgf Cre Slc17a6 Slc32a1 Slc6a3 |
| Software, algorithm | inDrops pipeline (Python) | PMID: 26000487 | N/A | https://github.com/indrops/indrops |
| Software, algorithm | R 3.4.4 | R project for statistical computing | RRID:SCR_001905 | https://cran.r-project.org/ |
| Software, algorithm | Seurat 2.3.4 | PMID: 29608179 | RRID:SCR_016341 | https://satijalab.org/seurat/ |
| Software, algorithm | MAST 1.4.1 | PMID: 26653891 | RRID:SCR_016340 | https://bioconductor.org/packages/release/bioc/html/MAST.html |
| Software, algorithm | MATLAB (R2015a) | MathWorks | RRID:SCR_001622 | |
| Software, algorithm | Fiji | PMID: 22743772 | RRID:SCR_002285 | https://imagej.net/Fiji |
Additional files
-
Supplementary file 1
Average expression of all genes in all clusters.
- https://cdn.elifesciences.org/articles/51271/elife-51271-supp1-v1.csv
-
Supplementary file 2
Differentially expressed genes from all clusters using MAST, dendrogram included for reference.
- https://cdn.elifesciences.org/articles/51271/elife-51271-supp2-v1.xlsx
-
Supplementary file 3
Differentially expressed genes from MHb subclusters using MAST, dendrogram included for reference.
- https://cdn.elifesciences.org/articles/51271/elife-51271-supp3-v1.xlsx
-
Supplementary file 4
Average expression of all genes from MHb and LHb subclusters.
- https://cdn.elifesciences.org/articles/51271/elife-51271-supp4-v1.csv
-
Supplementary file 5
Differentially expressed genes from LHb subclusters using MAST, dendrogram included for reference.
- https://cdn.elifesciences.org/articles/51271/elife-51271-supp5-v1.xlsx
-
Supplementary file 6
Statistical comparisons for retrograde labeling experiments shown in Figure 5 and Figure 5—figure supplement 3.
- https://cdn.elifesciences.org/articles/51271/elife-51271-supp6-v1.xlsx
-
Transparent reporting form
- https://cdn.elifesciences.org/articles/51271/elife-51271-transrepform-v1.docx
Download links
A two-part list of links to download the article, or parts of the article, in various formats.
Downloads (link to download the article as PDF)
Open citations (links to open the citations from this article in various online reference manager services)
Cite this article (links to download the citations from this article in formats compatible with various reference manager tools)
Anatomical and single-cell transcriptional profiling of the murine habenular complex
eLife 9:e51271.
https://doi.org/10.7554/eLife.51271


