A genome-wide view of the de-differentiation of central nervous system endothelial cells in culture
- Johns Hopkins University School of Medicine, United States
- Howard Hughes Medical Institute, Johns Hopkins University School of Medicine, United States
Figures
Figure 1 with 3 supplements
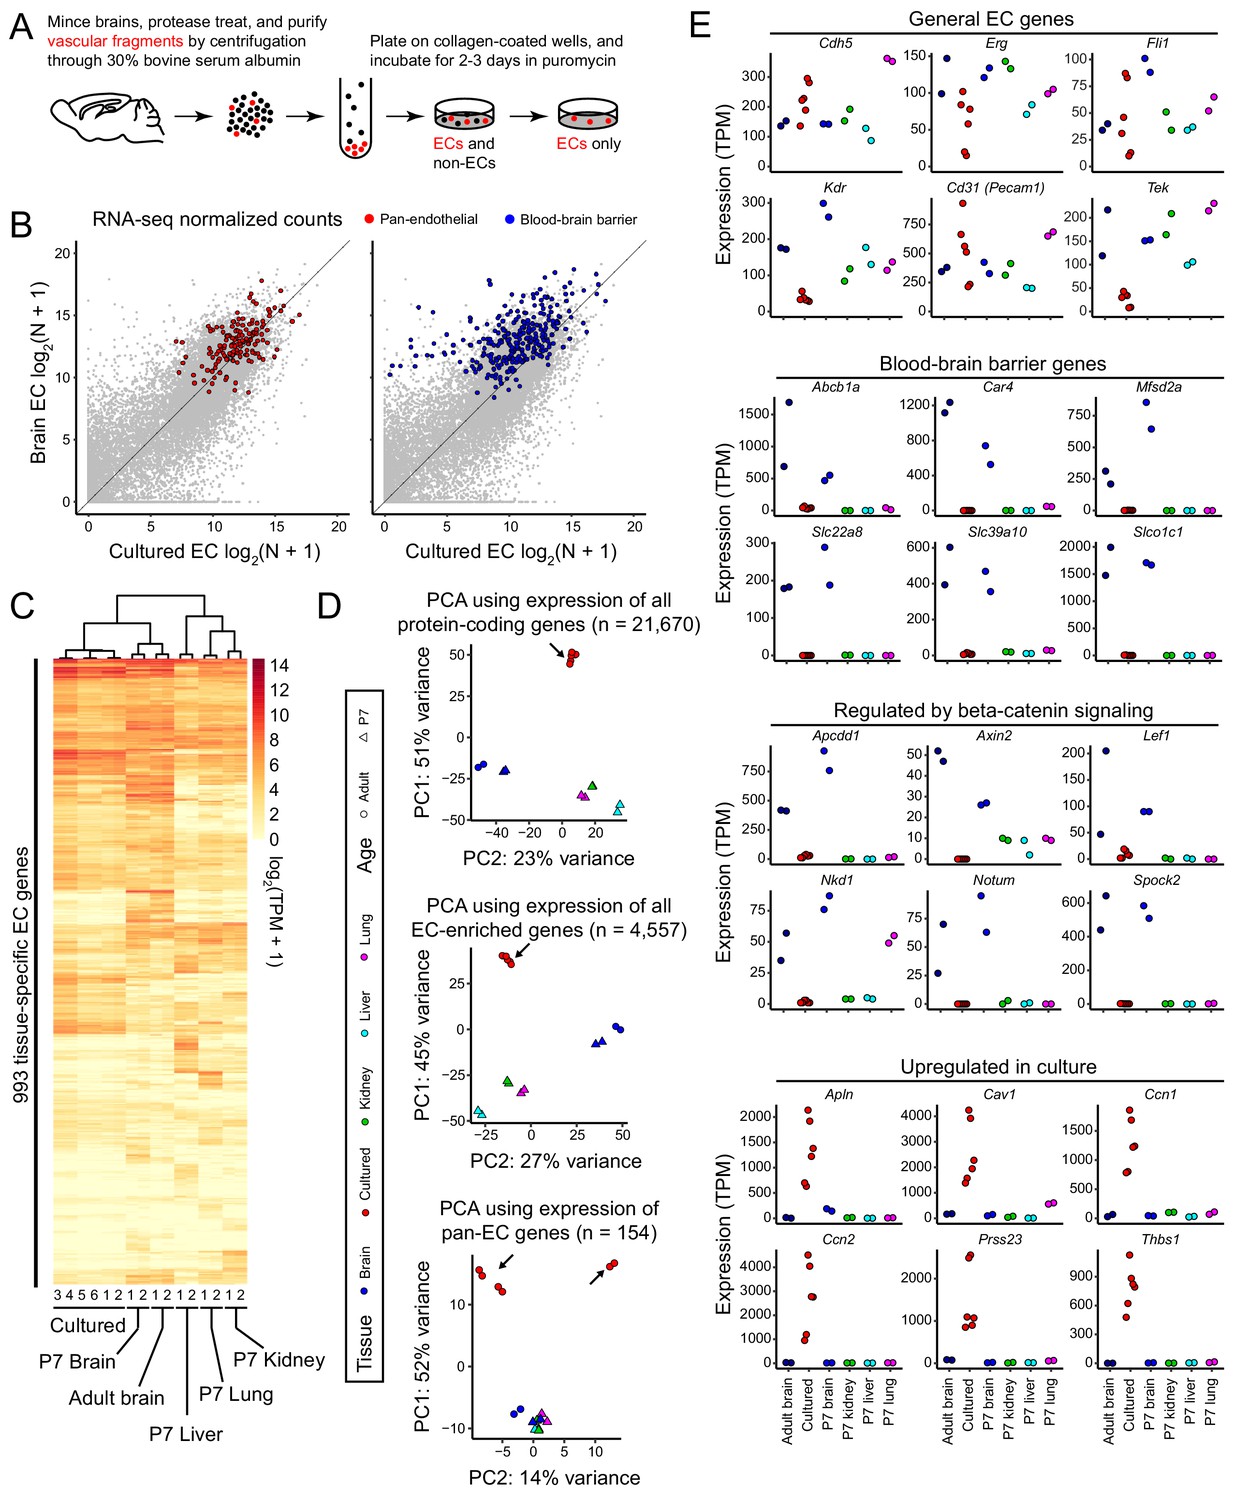
RNA-seq reveals a rapid loss of the brain EC transcriptional signature during in vitro cell culture.
(A) Schematic outline of the isolation, purification, and culture of brain ECs. (B) Scatter plots comparing cross-sample normalized RNA-seq read counts for all protein-coding genes (gray symbols) between acutely isolated adult brain ECs (y-axis; average of two independent samples) and primary brain ECs cultured for 8 days (x-axis; average of six independent samples). The left plot highlights (in red) EC-enriched genes that are expressed at similar levels in adult brain, P7 brain, P7 liver, P7 lung, and P7 kidney ECs. The right plot highlights (in blue) genes associated with the BBB (i.e., that are >2 fold enriched in brain ECs relative to liver, lung, and kidney ECs). The majority of BBB genes show reduced expression in culture. (C) Heatmap depicting log2 transformed transcript abundances from cultured brain ECs, and from acutely isolated P7 and adult brain ECs, and P7 liver, lung, and kidney ECs for 993 tissue-specific EC genes. (D) Principal component analysis (PCA) based on the abundances of all protein-coding transcripts (top), EC-enriched transcripts (center), and pan-EC transcripts (i.e. transcripts common to adult brain, P7 brain, P7 liver, P7 lung, and P7 kidney ECs; bottom). The symbols for each sample represent biological replicates. Arrows indicate cultured EC data points. In the PCA in the bottom panel, the two samples in the upper right were replicates isolated by Method B, and their RNA-seq libraries were generated and sequenced by a different facility compared to the other four samples, which were isolated by method A (see Materials and methods). (E) Transcript abundances for six genes from each of the four indicated categories of transcripts. Labels at the bottom of the figure apply to all panels above.
Figure 1—figure supplement 1
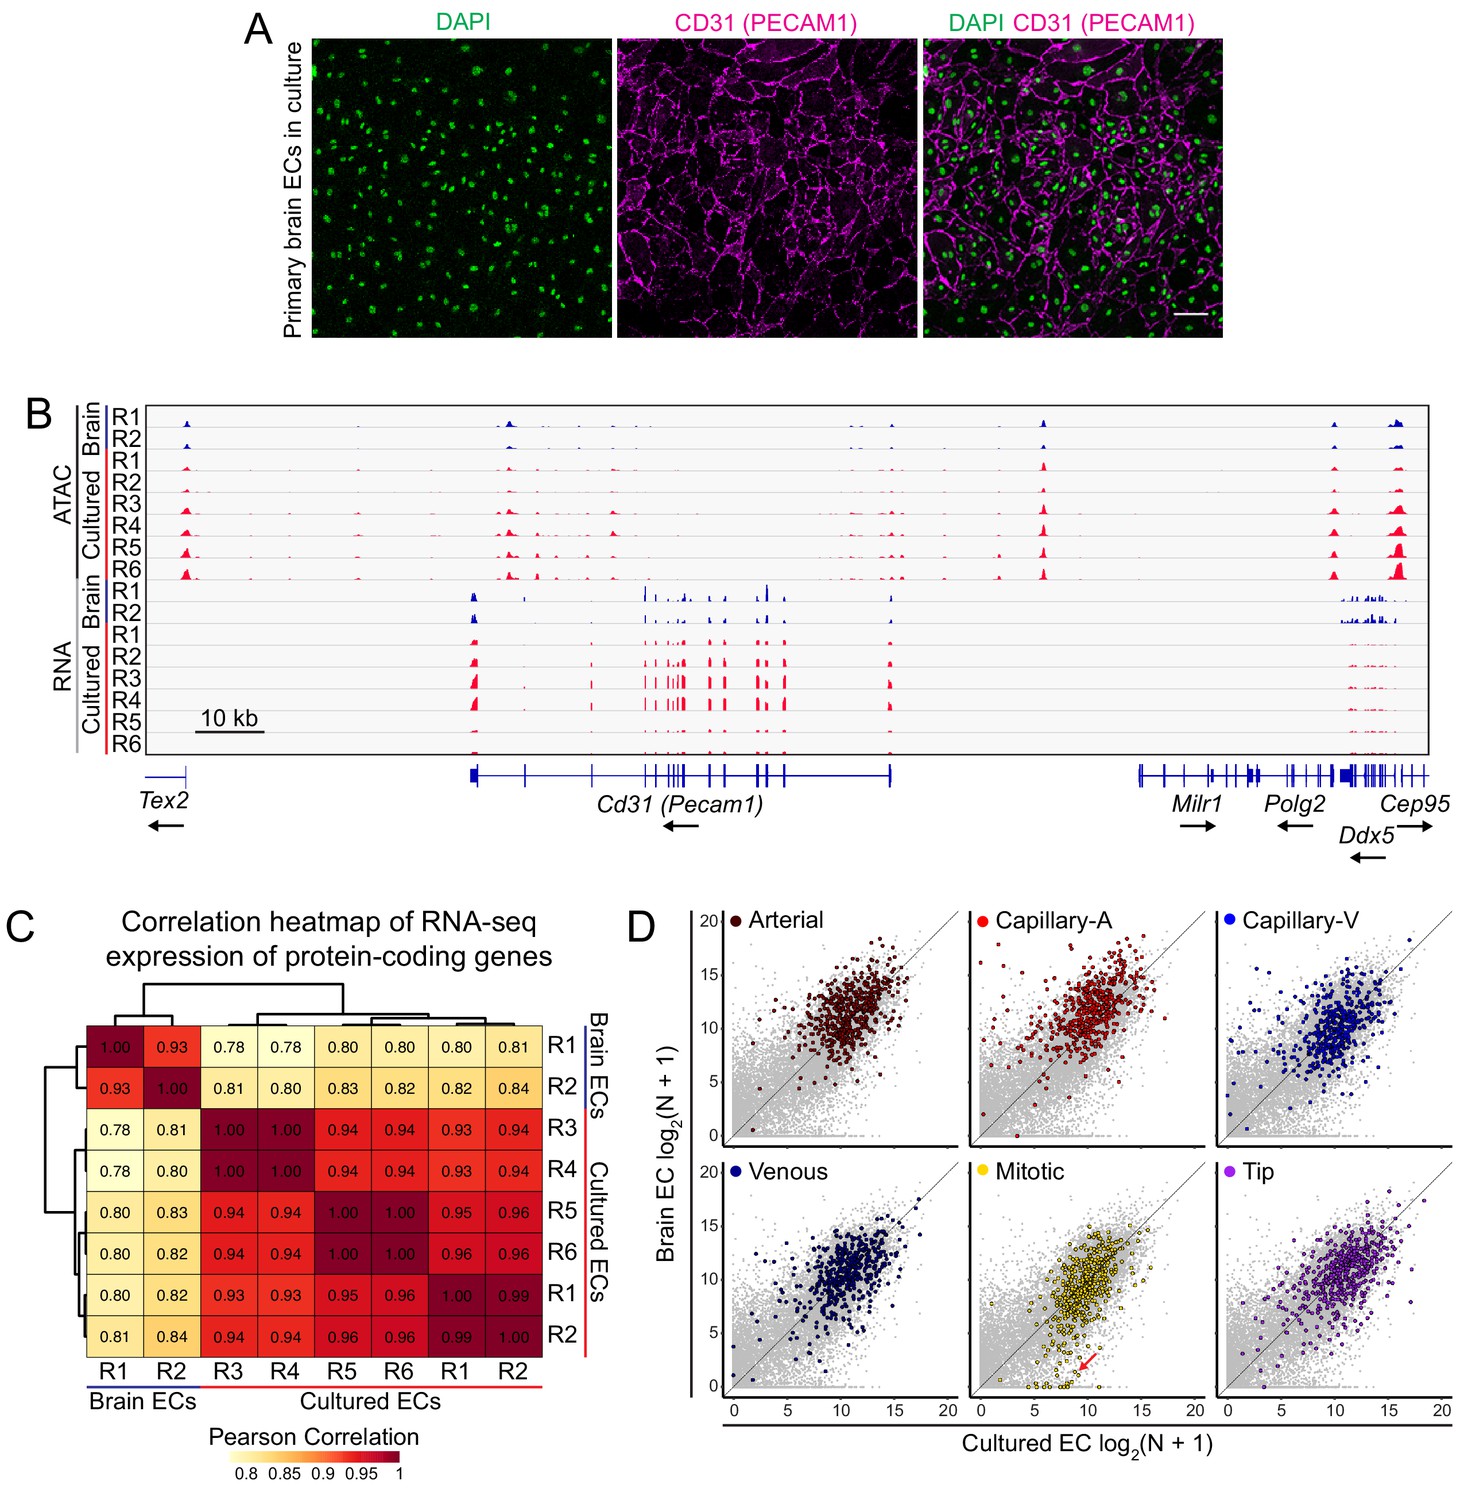
Characterization of primary brain EC cultures.
(A) Primary brain ECs in culture, immunostained for CD31 (a pan-EC marker) and counterstained with DAPI. Merged image is shown in the right column. Scale bar: 100 um. (B) Genome browser images showing accessible chromatin (ATAC-seq; top) and transcript abundances (RNA-seq; bottom) for the Cd31 (Pecam1) locus. Histograms show aligned read counts. Tracks in blue represent acutely isolated adult brain ECs and tracks in red represent cultured adult brain ECs. Each track represents an independent replicate (two replicates for acutely isolated adult brain ECs and six replicates for cultured adult brain ECs). All eight of the ATAC-seq histograms are at the same vertical scale and all eight of the RNA-seq histograms are at the same vertical scale. Bottom, intron-exon structure, with the arrow indicating the direction of transcription. (C) Heatmap showing pairwise Pearson correlations for RNA-seq TPM among acutely isolated adult brain ECs and cultured adult brain ECs for all protein-coding genes. Data are shown for the individual replicates, which were from four experiments, each with paired replicates: R1+R2 from brain ECs, and R1+R2, R3+R4, and R5+R6 from cultured ECs. (D) Scatter plots comparing cross-sample normalized RNA-seq read counts of all protein-coding genes between acutely isolated adult brain ECs and adult brain ECs cultured for 8 days. Each plot highlights the top 500 genes enriched in an identified cell type cluster from single-cell RNA-seq analysis of acutely isolated P7 brain ECs (Sabbagh et al., 2018). The red arrow in the lower center plot points to a subset of mitotic genes that show enhanced expression in cultured ECs.
Figure 1—figure supplement 2
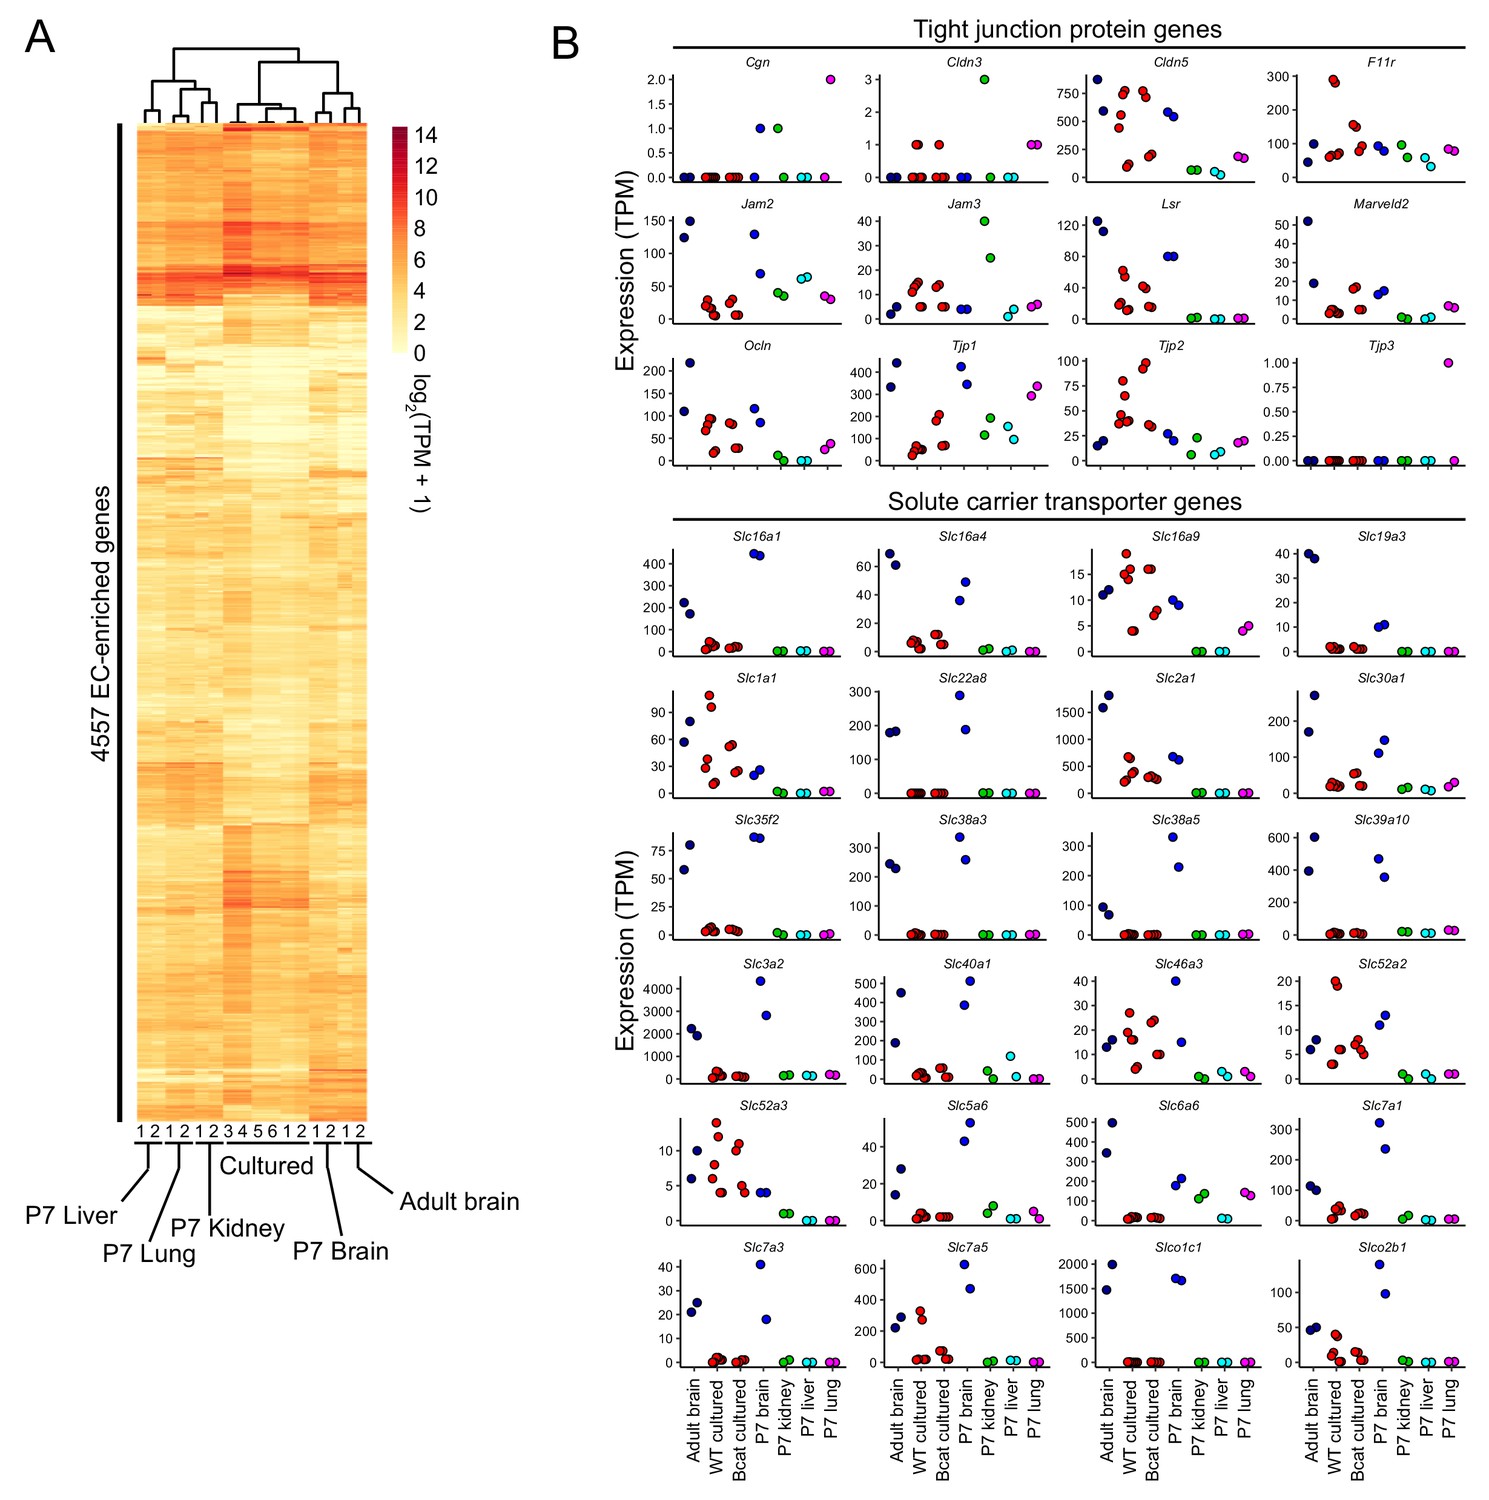
Further analysis of the brain EC transcriptional signature during in vitro cell culture.
(A) Heatmap depicting log2 transformed transcript abundances from cultured brain ECs, and from acutely isolated P7 and adult brain ECs, and P7 liver, lung, and kidney ECs for 4,557 EC-enriched genes. (B) Abundances are plotted for each replicate for transcripts coding for tight junction proteins and BBB-enriched members of the solute carrier family of transporters. Labels at the bottom of the figure apply to all panels above.
Figure 1—figure supplement 3
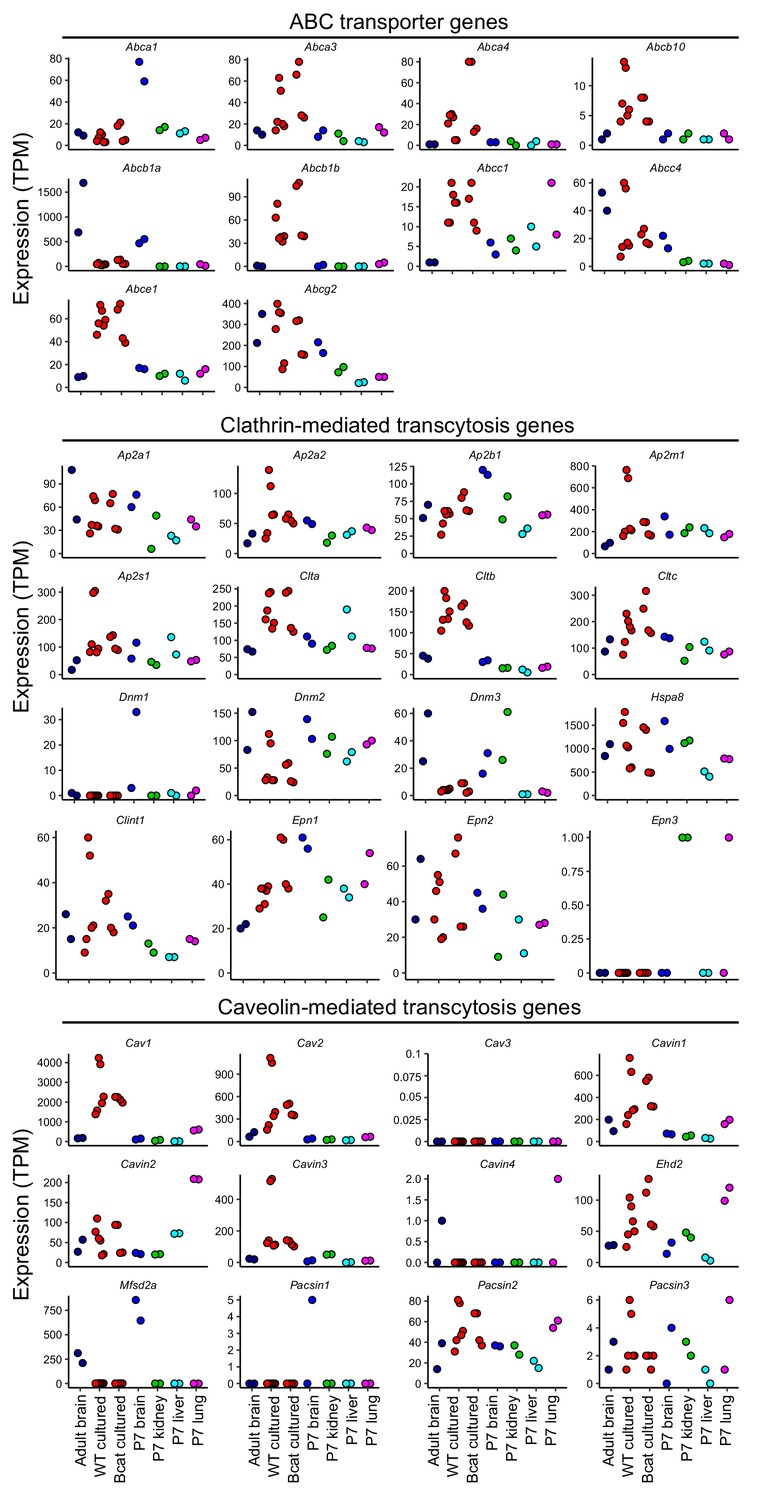
Analysis of transcripts coding for ABC transporters and proteins associated with Clathrin- or Caveolin-mediated transcytosis.
Abundances are plotted for each replicate for transcripts coding for the three indicated categories of proteins. Labels at the bottom of the figure apply to all panels above.
Figure 2
Changes in accessible chromatin, motif enrichment, and TF expression in primary brain ECs in culture.
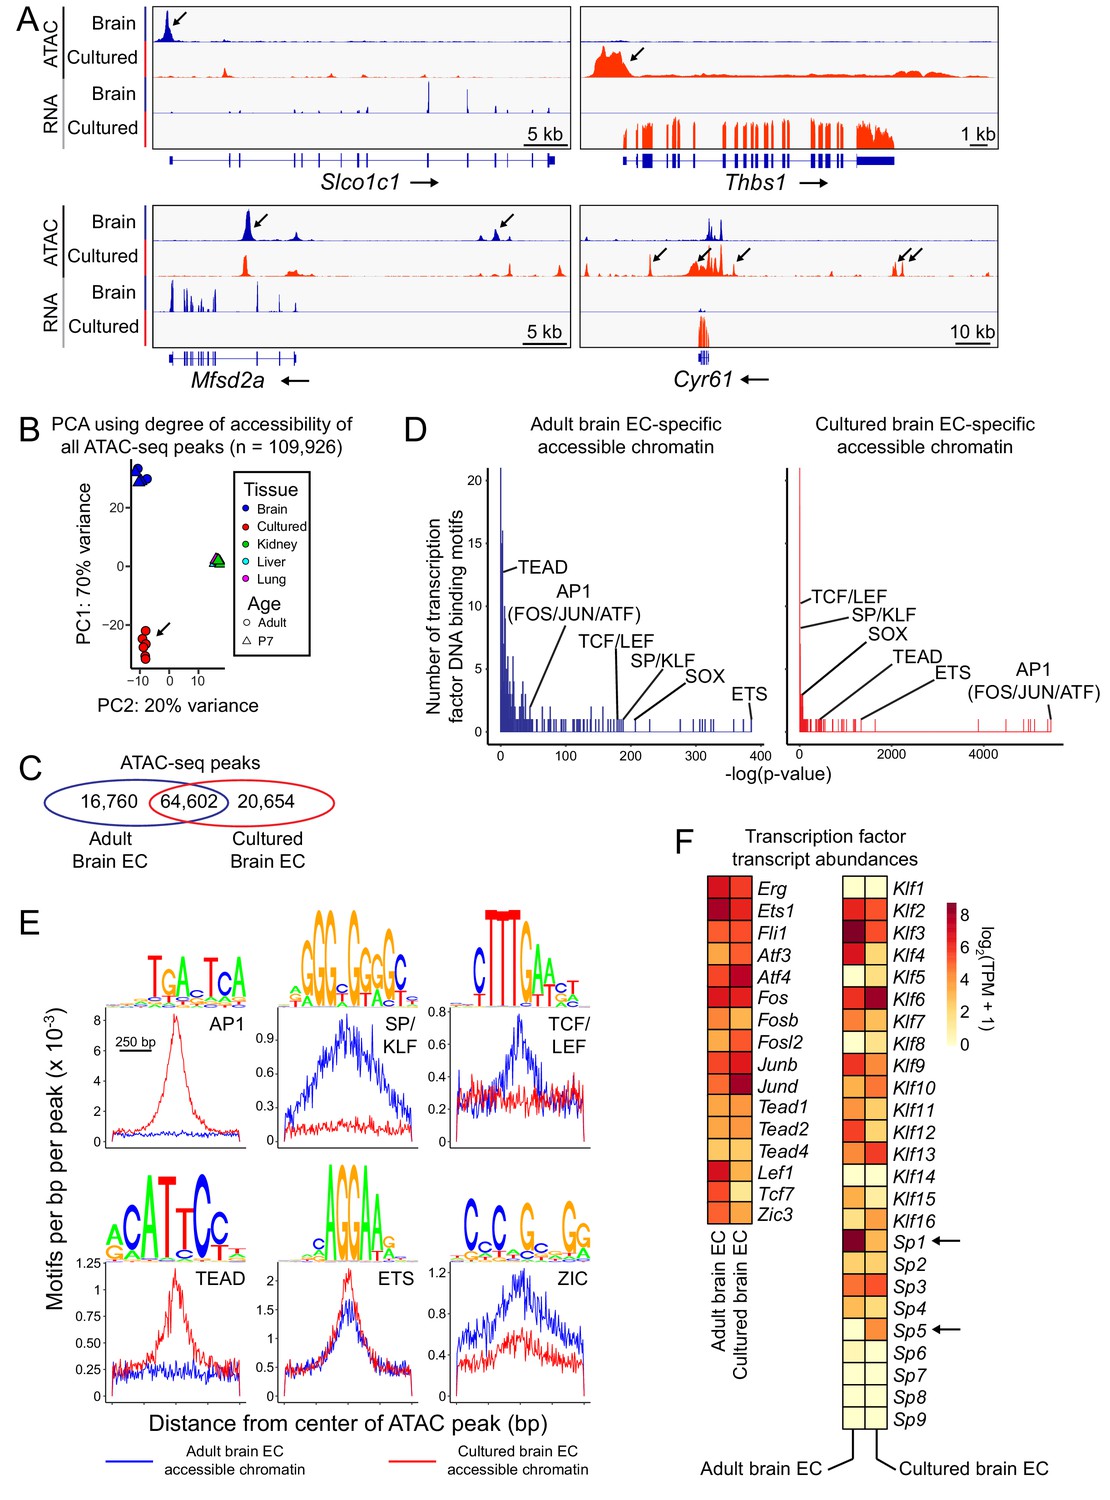
(A) Genome browser images showing ATAC-seq reads (top) and RNA-seq reads (bottom) at or near Slco1c1 and Mfsd2a, BBB genes with reduced expression in cultured adult brain ECs (left panels), and Thbs1 and Cyr61 (Ccn1), genes with enhanced expression in cultured adult brain ECs (right panels). Increases in transcript abundance are accompanied by increases in accessible chromatin near each gene (black arrows). Read counts are averaged over the independent replicates (Figure 1—figure supplement 1). (B) PCA of ATAC-seq read density at all called ATAC-seq peaks in independent biological replicates from cultured adult brain ECs, acutely isolated adult and P7 brain ECs, and P7 liver, lung, and kidney ECs. Liver, lung, and kidney samples cluster at center right. The arrow points to cultured ECs. (C) Venn diagram summarizing the number of shared and distinct ATAC-seq peaks between acutely isolated and cultured adult brain ECs. (D) TF motif enrichment in ATAC-seq peaks that is specific to either acutely isolated adult brain ECs (left) or cultured adult brain ECs (right). Histograms of the -log10(p-value) for 414 TF DNA binding motifs that were tested for enrichment. The x-axis bin size is 1. The y-axis has been truncated. The vast majority of tested motifs have high p-values (i.e., low statistical significance) and thus are found in the first few bins. The statistically most significant TF motif families are labeled. Most TF families are represented by multiple closely related motifs, and only the motif with the lowest p-value for each family is labeled. The number of ATAC-seq peaks analyzed in (D) and (E) corresponds to the values shown in the Venn diagram in (C). (E) Enriched TF motifs identified by HOMER. The frequency of the indicated motifs is plotted as a function of distance from the center of the ATAC-seq peaks (from either acutely isolated or cultured adult brain ECs). Shown above each individual plot is the position weight matrix (PWM) of the enriched nucleotide sequence. The TF family that most closely matches the motif is indicated below the PWM. (F) Heatmap showing log2 transformed TPMs for acutely isolated and cultured adult brain ECs for transcripts coding for a subset of TFs with the motifs shown in (E).
Figure 3 with 2 supplements

Stabilization of beta-catenin does not promote a BBB-like state in cultured CNS ECs as determined by RNA-seq and ATAC-seq.
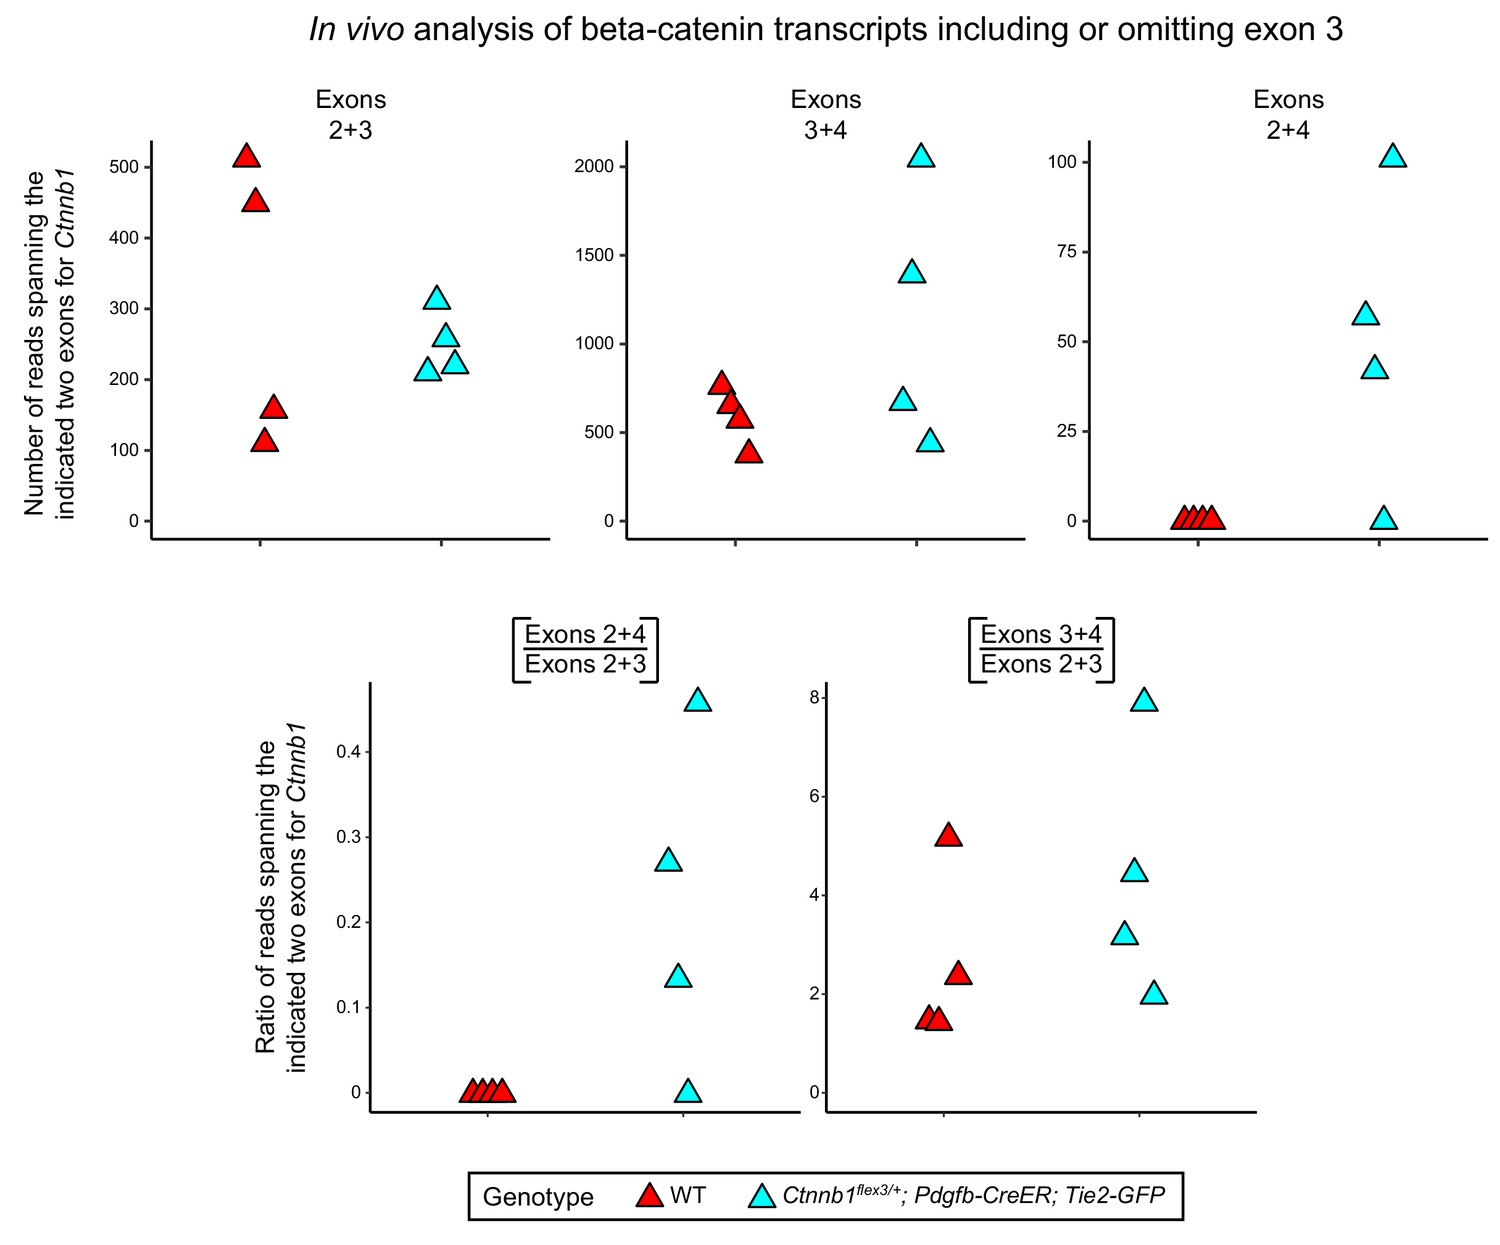
(A) Schematic outline of the genetic strategy for stabilizing beta-catenin (encoded by Ctnnb1). The Ctnnb1flex3 allele contains loxP sites flanking exon 3. Cre-recombination produces an in-frame deletion of exon 3, and the resulting beta-catenin protein is stabilized and activates transcription in conjunction with LEF/TCF proteins. (B) Analysis of Ctnnb1 transcripts that include or omit exon 3. The six replicates of wild-type (WT) cultured adult brain ECs produced no RNA-seq reads that join exons 2+4 whereas each of the four replicates of Ctnnb1flex3/+;Pdgfb-CreER;Tie2-GFP cultured adult brain ECs (in which exon 3 is deleted by Cre-mediated recombination) produced several hundred RNA-seq reads that join exons 2+4. (C) Scatter plots comparing cross-sample normalized RNA-seq read counts for protein-coding genes between beta-catenin stabilized and WT primary brain ECs cultured for 8 days. The left plot highlights (in red) EC-enriched genes that are expressed at similar levels in brain, liver, lung, and kidney EC subtypes. The right plot highlights (in blue) genes associated with the blood-brain barrier (BBB). Gene sets are as described for Figure 1B. Stabilizing beta-catenin does not increase the expression of BBB genes in cultured ECs. (D) Transcript abundances for seven genes from the ‘Regulated by beta-catenin signaling’ category. (E) PCA of protein-coding transcript abundances (RNA-seq; top) and PCA of ATAC-seq read density at all called ATAC-seq peaks (bottom) from independent biological replicates of WT and beta-catenin stabilized cultured adult brain ECs, acutely isolated adult and P7 brain ECs, and P7 liver, lung, and kidney ECs. The cyan-outlined red circles correspond to the beta-catenin stabilized cultured adult brain EC samples, and are indicated by cyan arrows. Black arrows point to cultured brain ECs without stabilized beta-catenin.
Figure 3—figure supplement 1
In vivo analysis of transcripts from FACS-purified pituitary ECs that include or omit Ctnnb1 exon 3.
Analysis of Ctnnb1 transcripts that include or omit exon 3 from FACS-purified anterior and posterior pituitary ECs from WT control mice (red; four RNA-seq data sets) or following Pdgfb-CreER mediated excision of Ctnnb1 exon 3 from the floxed allele (blue; four RNA-seq data sets). The RNA-seq data come from Wang et al. (2019). The four WT data sets (two each from anterior and posterior pituitary ECs) showed no RNA-seq reads that join exons 2+4, whereas the four Ctnnb1flex3/+;Pdgfb-CreER;Tie2-GFP data sets (two each from anterior and posterior pituitary ECs) produced a mean of ~50 RNA-seq reads that join exons 2+4 (representing exon 3 deletion by Cre-mediated recombination). The ~50 exon 2+4 reads correspond to ~25% as many reads as spanned exons 2+3; the ratios for each sample are shown in the lower left panel. One of the four Ctnnb1flex3/+;Pdgfb-CreER;Tie2-GFP samples showed no exon 2+4 reads.
Figure 3—figure supplement 2
WT and beta-catenin stabilized brain ECs in culture have nearly identical patterns of transcription and accessible chromatin.
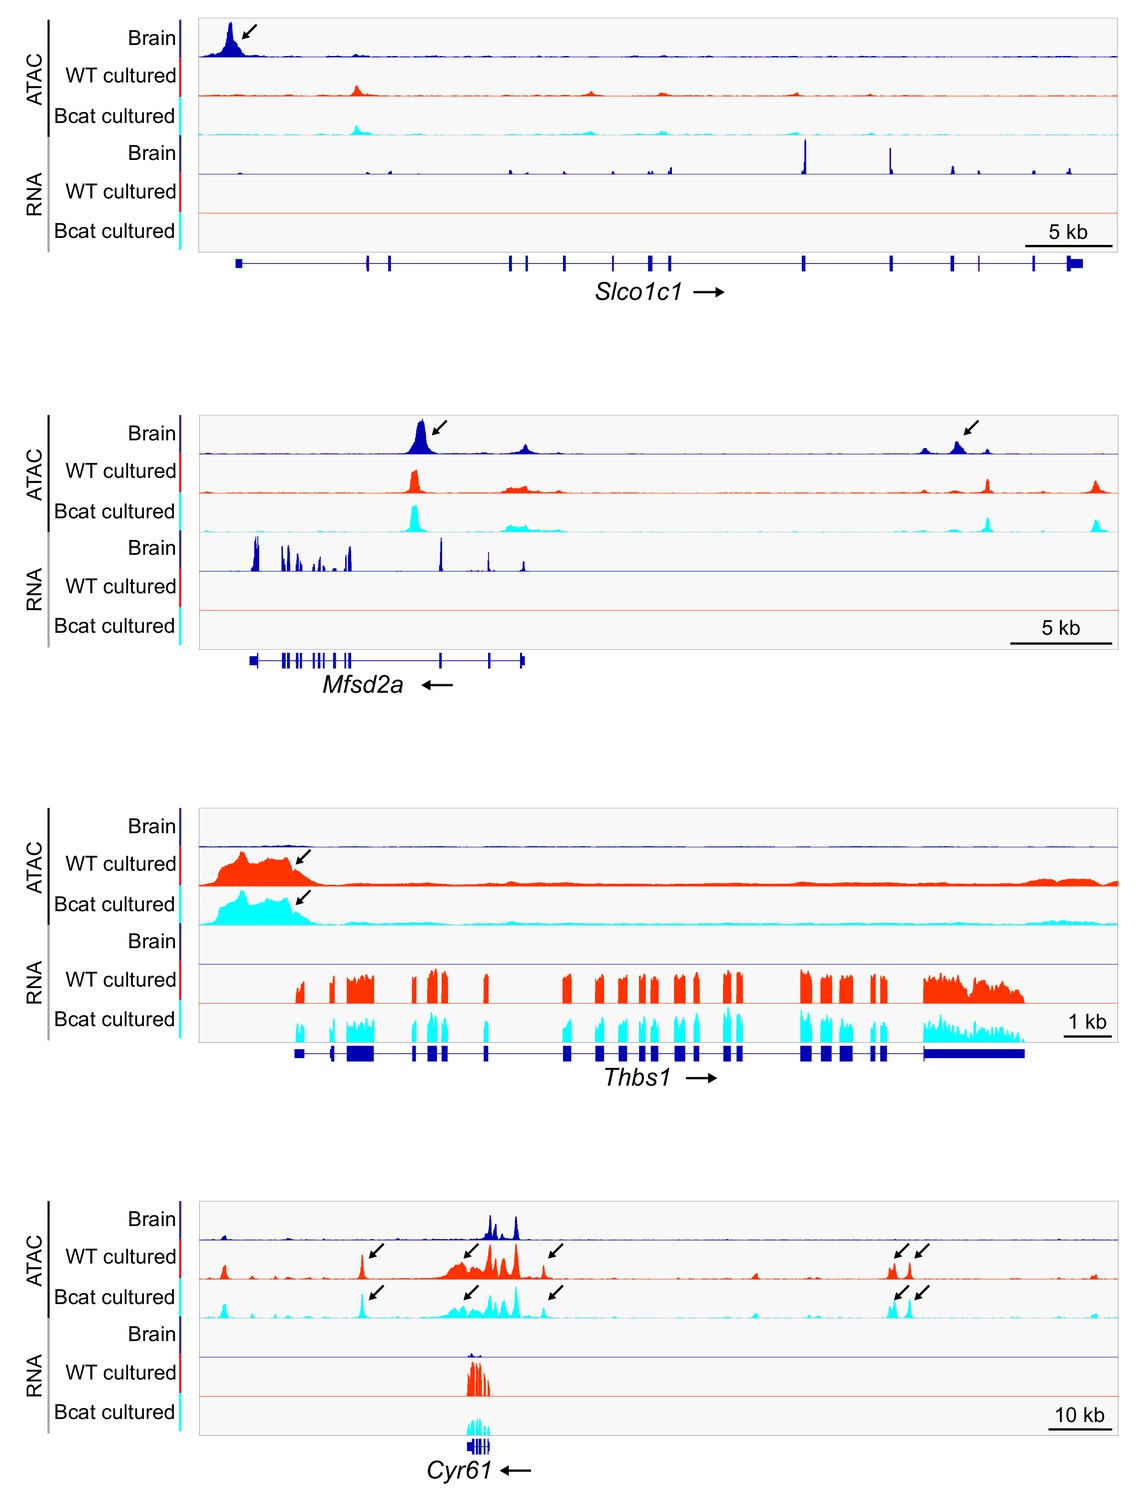
Genome browser images showing ATAC-seq reads (top) and RNA-seq reads (bottom) for the same set of genes shown in Figure 2A for freshly isolated adult brain ECs, WT cultured adult brain ECs, and beta-catenin stabilized and cultured adult brain ECs. Read counts are averaged over the independent replicates. Arrows indicate ATAC-seq peaks that correlate with differential gene expression.
Tables
Key resources table
| Reagent type (species) or resource | Designation | Source or reference | Identifiers | Additional information |
|---|---|---|---|---|
| Genetic reagent (Mus musculus) | Ctnnb1flex3 | DOI: 10.1093/emboj/18.21.5931 | ||
| Genetic reagent (M. musculus) | Tie2-Cre (Tek-Cre) | The Jackson Laboratory | Stock No: 008863; RRID:IMSR_JAX:008863 | |
| Genetic reagent (M. musculus) | Tie2-GFP (Tek-GFP) | The Jackson Laboratory | Stock No: 003658; RRID:IMSR_JAX:003658 | |
| Genetic reagent (M. musculus) | Pdgfb-CreER | DOI: 10.1002/dvg.20367 | ||
| Peptide, recombinant protein | Tn5 transposase | Illumina | Cat no: FC-121–1030 | |
| Commercial assay or kit | Worthington Papain Dissociation Kit | Worthington Biochemical Corporation | Cat no: LK003160 | |
| Chemical compound, drug | 4-hydroxytamoxifen | Sigma-Aldrich | Cat no: H7904 | |
| Software, algorithm | Salmon | DOI: 10.1038/nmeth.4197 | ||
| Software, algorithm | deepTools | DOI: 10.1093/nar/gkw257 | RRID:SCR_016366 | |
| Software, algorithm | tximport | DOI: 10.12688/f1000research.7563.2 | RRID:SCR_016752 | |
| Software, algorithm | EBSeq | DOI: 10.1093/bioinformatics/btv193 | RRID:SCR_003526 | |
| Software, algorithm | MACS2 | DOI: 10.1186/gb-2008-9-9-r137 | ||
| Software, algorithm | DiffBind | DOI: 10.1038/nature10730 | RRID:SCR_012918 |
Additional files
-
Supplementary file 1
Gene expression data.
(A) EC-enriched transcripts for adult brain. PPDE, posterior probability of differential expression (1-FDR). (B) Differentially expressed genes in acutely isolated adult brain ECs when compared to cultured brain ECs. (C) The intersection of genes in (A) and (B). EC-enriched differentially expressed genes in acutely isolated adult brain ECs. (D) Differentially expressed genes in cultured brain ECs when compared to acutely isolated adult brain ECs. (E) All EC-enriched genes. (F) Pan-endothelial cell genes. (G) Tissue-specific EC genes. (H) Blood-brain barrier genes. (I) Blood-brain barrier genes with reduced expression in cultured brain ECs.
- https://cdn.elifesciences.org/articles/51276/elife-51276-supp1-v1.xlsx
-
Supplementary file 2
Accessible chromatin peaks.
(A) Differential ATAC-seq peaks in acutely isolated adult brain ECs when compared to cultured brain ECs. (B) Differential ATAC-seq peaks in cultured brain ECs when compared to acutely isolated adult brain ECs.
- https://cdn.elifesciences.org/articles/51276/elife-51276-supp2-v1.xlsx
-
Transparent reporting form
- https://cdn.elifesciences.org/articles/51276/elife-51276-transrepform-v1.docx
Download links
A two-part list of links to download the article, or parts of the article, in various formats.
Downloads (link to download the article as PDF)
Open citations (links to open the citations from this article in various online reference manager services)
Cite this article (links to download the citations from this article in formats compatible with various reference manager tools)
A genome-wide view of the de-differentiation of central nervous system endothelial cells in culture
eLife 9:e51276.
https://doi.org/10.7554/eLife.51276


