mTORC1 in the orbitofrontal cortex promotes habitual alcohol seeking
- University of California, San Francisco, United States
Figures
Figure 1 with 4 supplements

Inhibition of mTORC1 in the OFC reduces alcohol seeking.
(a–c) Intra-OFC infusion of rapamycin does not alter self-administration of alcohol. Rats underwent 7 weeks of IA-20%2BC and were then trained to self-administer 20% alcohol using a FR3 schedule. Vehicle (white) or rapamycin (50 ng/μl, red) was infused bilaterally in the OFC 3 hr before a 30 min self-administration session. (a) RM ANOVA of cumulative lever presses did not identify a significant main treatment effect (F1,12=0.26, p>0.05). Two-tailed paired t-test revealed that the number of active lever presses (b) (t6 = 1.40, p>0.05), and amount of alcohol consumed (c) (t6 = 1.51, p>0.05) did not differ between treatment groups. (d–e) Intra-OFC infusion of rapamycin inhibits lever presses during extinction. Vehicle (white) or rapamycin (50 ng/μl, red) was infused in the OFC 3 hr before a 30 min extinction session, and responses on the previously active lever were recorded. (d) RM ANOVA revealed a significant main treatment effect (F1,16=4.40, p=0.05) of cumulative lever presses. (e) Two-tailed paired t-test revealed that the number of lever presses (per 5 min) t8 = 3.31, p<0.05, were reduced in the rapamycin-treated animals. Data are presented as individual values and mean ± SEM. *p<0.05. (a–c) n = 7, (d–e) n = 9.
-
Figure 1—source data 1
Cumulative lever presses at 3 min intervals for vehicle- and rapamycin-treated rats during a 30 min self-administration session (Figure 1a).
- https://cdn.elifesciences.org/articles/51333/elife-51333-fig1-data1-v3.xlsx
-
Figure 1—source data 2
Total lever presses and alcohol consumed (g/kg) during a 30 min self-administration session in vehicle- and rapamycin-treated rats (Figure 1b–c).
- https://cdn.elifesciences.org/articles/51333/elife-51333-fig1-data2-v3.xlsx
-
Figure 1—source data 3
Cumulative lever presses at 3 min intervals for vehicle- and rapamycin-treated rats during a 30 min extinction session (Figure 1d).
- https://cdn.elifesciences.org/articles/51333/elife-51333-fig1-data3-v3.xlsx
-
Figure 1—source data 4
Total lever presses during a 30 min extinction session in vehicle- and rapamycin-treated rats (Figure 1e).
- https://cdn.elifesciences.org/articles/51333/elife-51333-fig1-data4-v3.xlsx
Figure 1—figure supplement 1
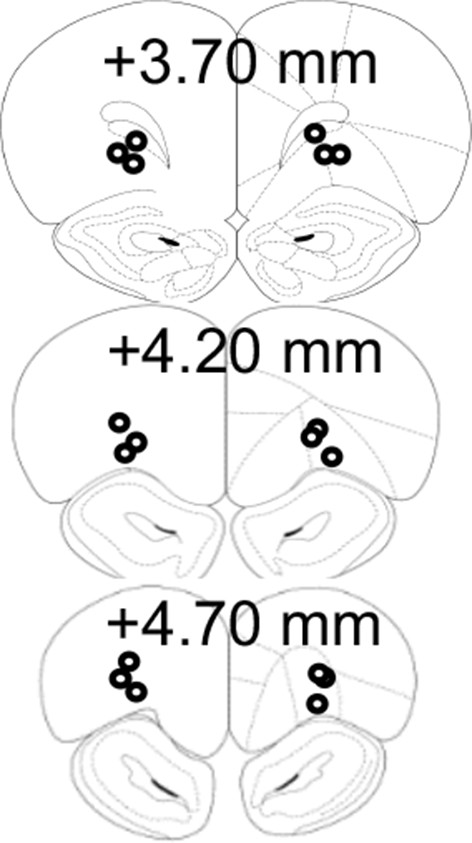
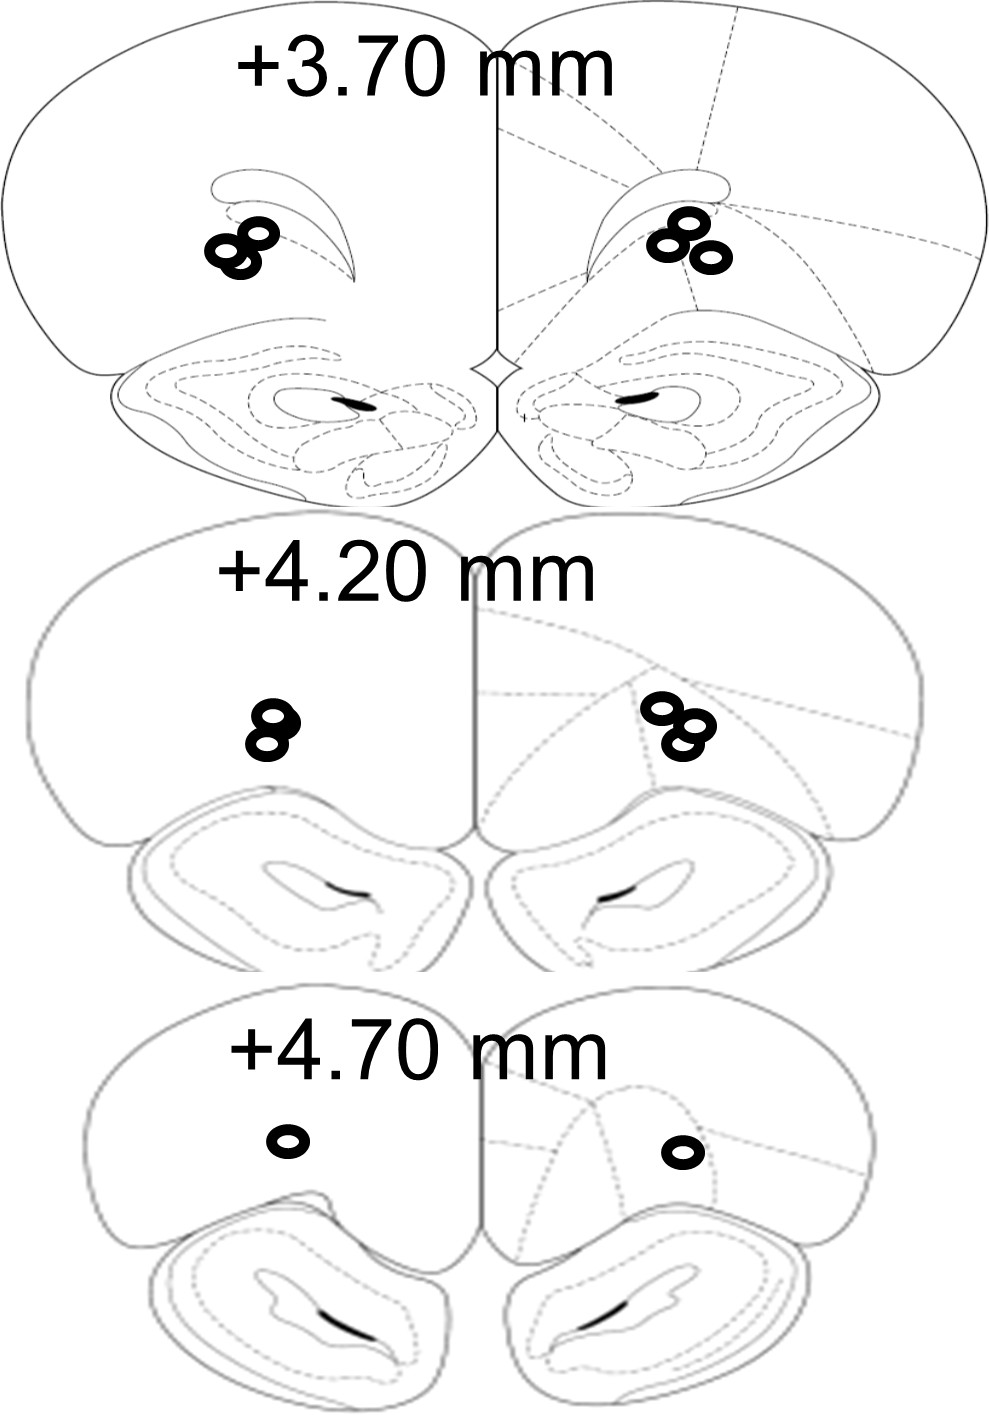
Schematic drawing of cannulae placement.
Schematic illustration of coronal sections of the rat brain showing approximate bilateral placements of cannulae in the OFC according to Paxinos and Franklin (2001).
Figure 1—figure supplement 2
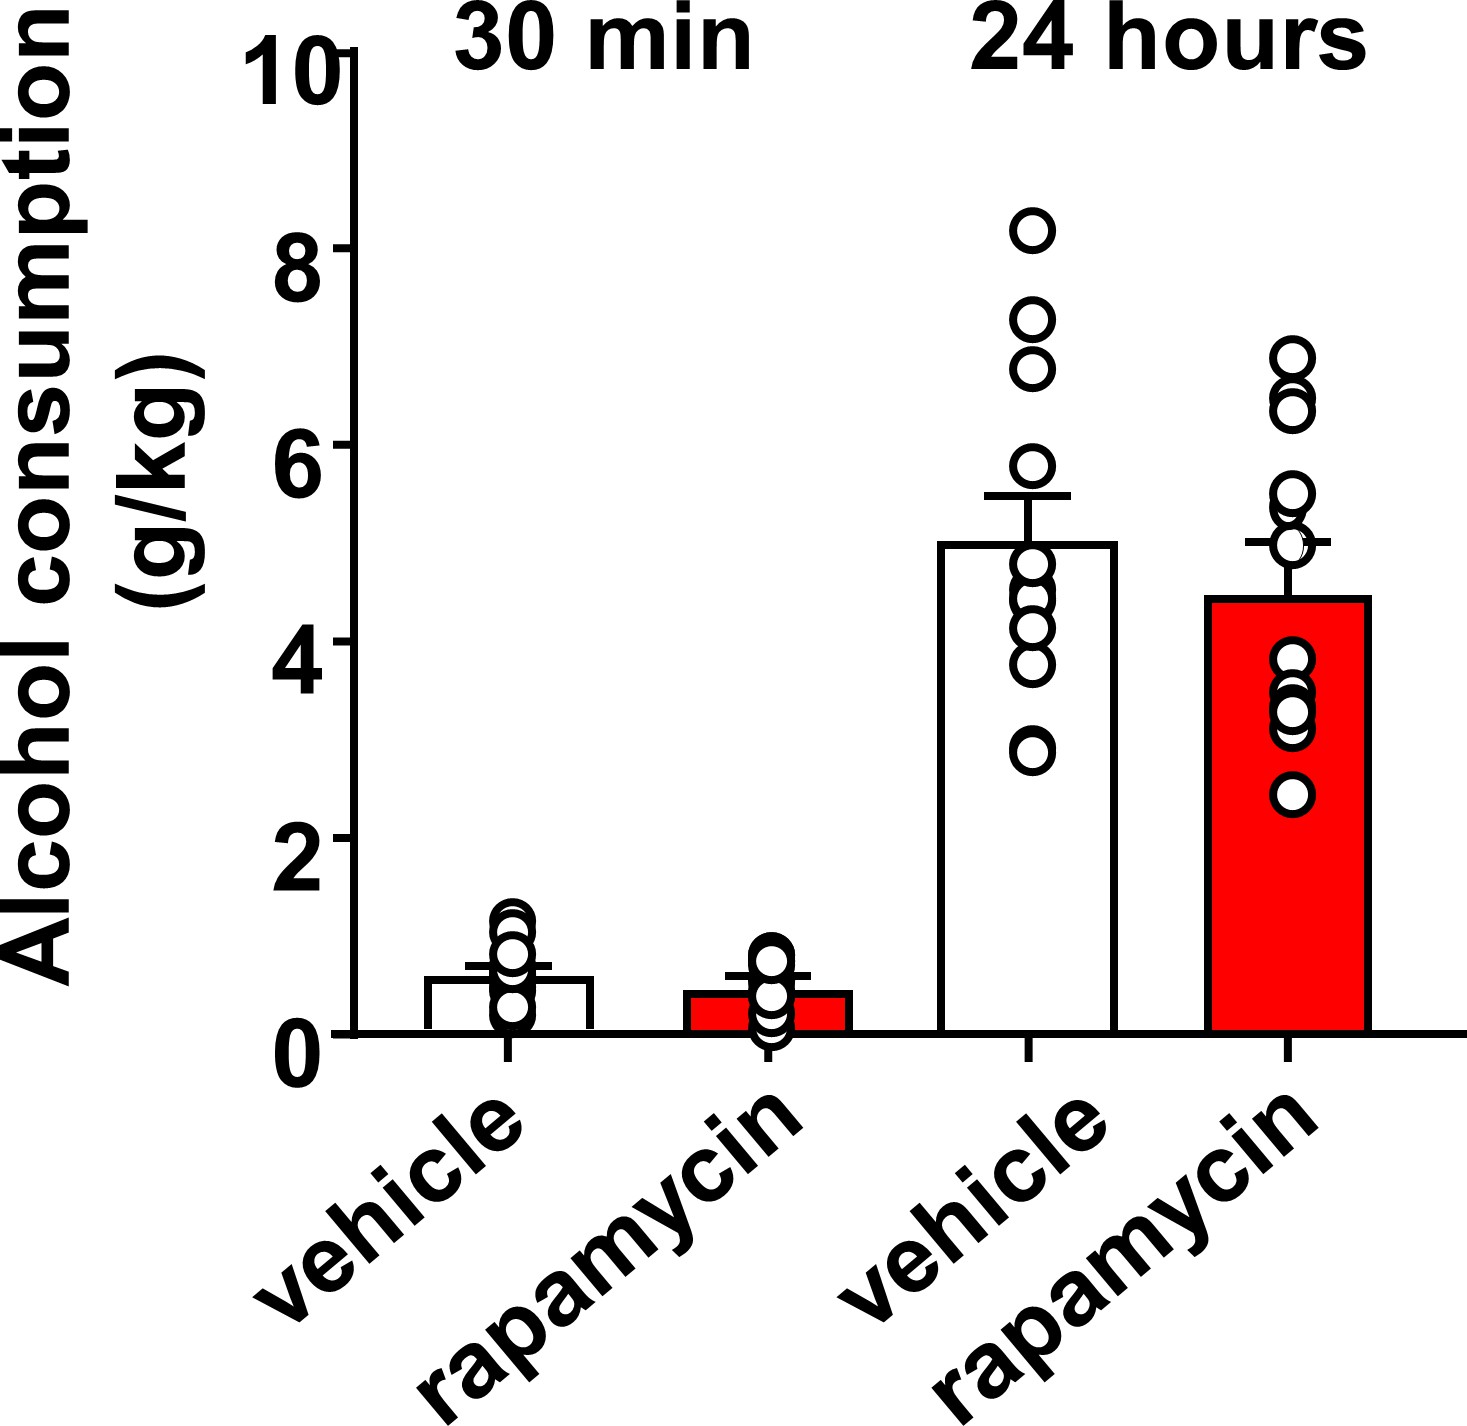
Inhibition of mTORC1 in the OFC does not alter alcohol consumption in a 2-bottle choice paradigm.
Rats with a history of IA-20%2BC were infused with vehicle (white) or rapamycin (50 ng/μl, red) into the OFC 3 hr before the beginning of the final 2BC session, and alcohol consumption was recorded at the 30 min and 24 hr time points. Significance between treatment groups was determined using RM ANOVA. No differences were observed in alcohol consumption at the 30 min (t11 = 1.25, p>0.05), or at the 24 hr time point (t11 = 0.87, p>0.05). n = 12.
-
Figure 1—figure supplement 2—source data 1
Alcohol consumed (g/kg) by vehicle- and rapamycin-treated rats after 30 min or 24 hr of two-bottle choice.
- https://cdn.elifesciences.org/articles/51333/elife-51333-fig1-figsupp2-data1-v3.xlsx
Figure 1—figure supplement 3
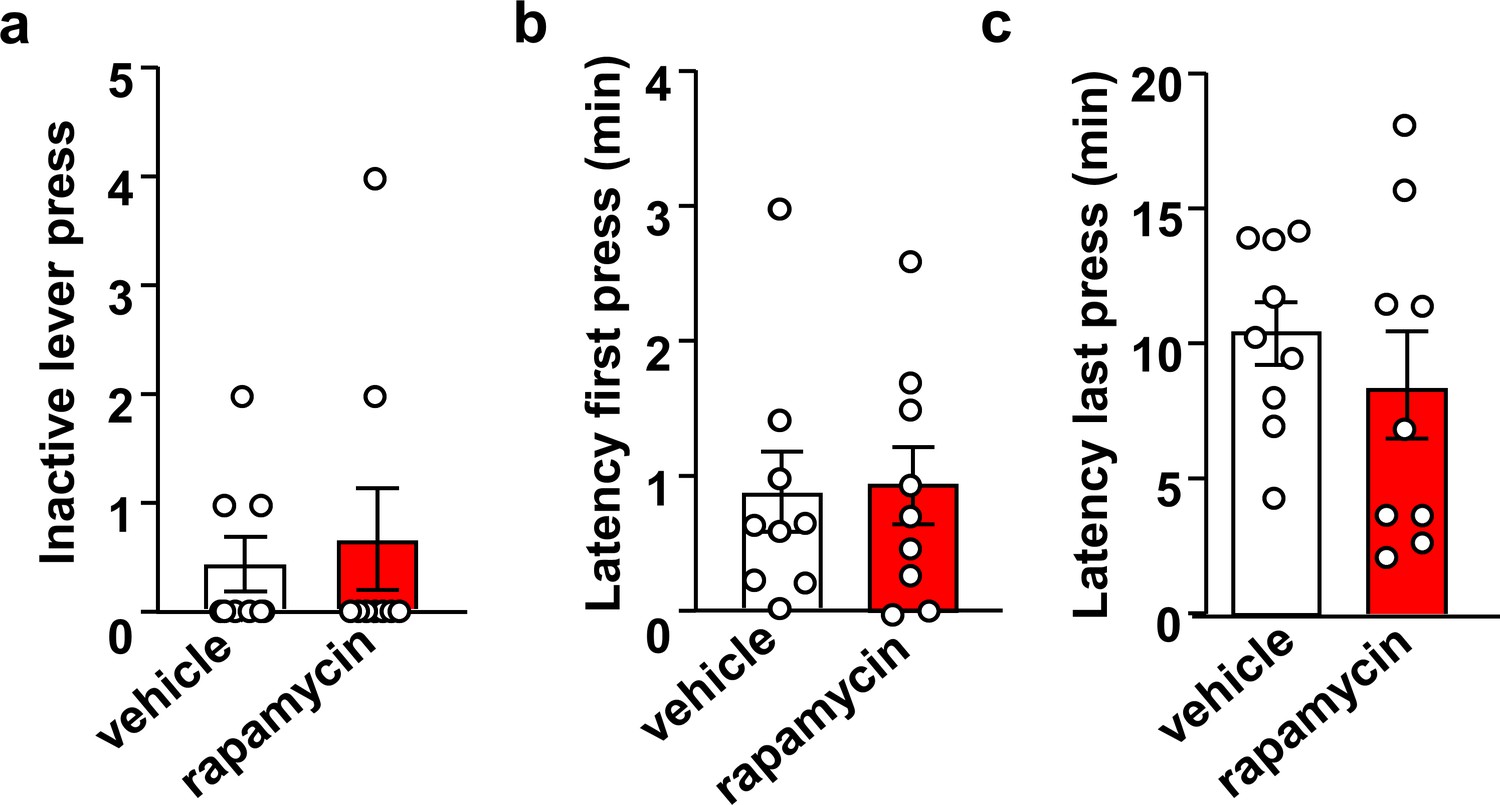
Inhibition of mTORC1 in the OFC does not impact inactive lever presses or the latency to the first and last active lever press.
Rats were trained to self-administer 20% alcohol using an FR3 schedule. Vehicle (white) or rapamycin (50 ng/μl, red) was infused into the OFC 3 hr before an operant self-administration session, and active and inactive lever presses were recorded. Significance between treatment groups was determined using two-tailed paired t-tests. Number of inactive lever presses (a) (t8 = 0.37, p>0.05), latency to first lever press (b) (t8 = 0.27, p>0.05), and latency to the last active lever press (c) (t8 = 0.89, p>0.05) did not differ between groups. n = 9.
-
Figure 1—figure supplement 3—source data 1
Total inactive lever presses and the latencies to the first and last active lever presses during a 30 min self-administration session in vehicle- and rapamycin-treated rats.
- https://cdn.elifesciences.org/articles/51333/elife-51333-fig1-figsupp3-data1-v3.xlsx
Figure 1—figure supplement 4
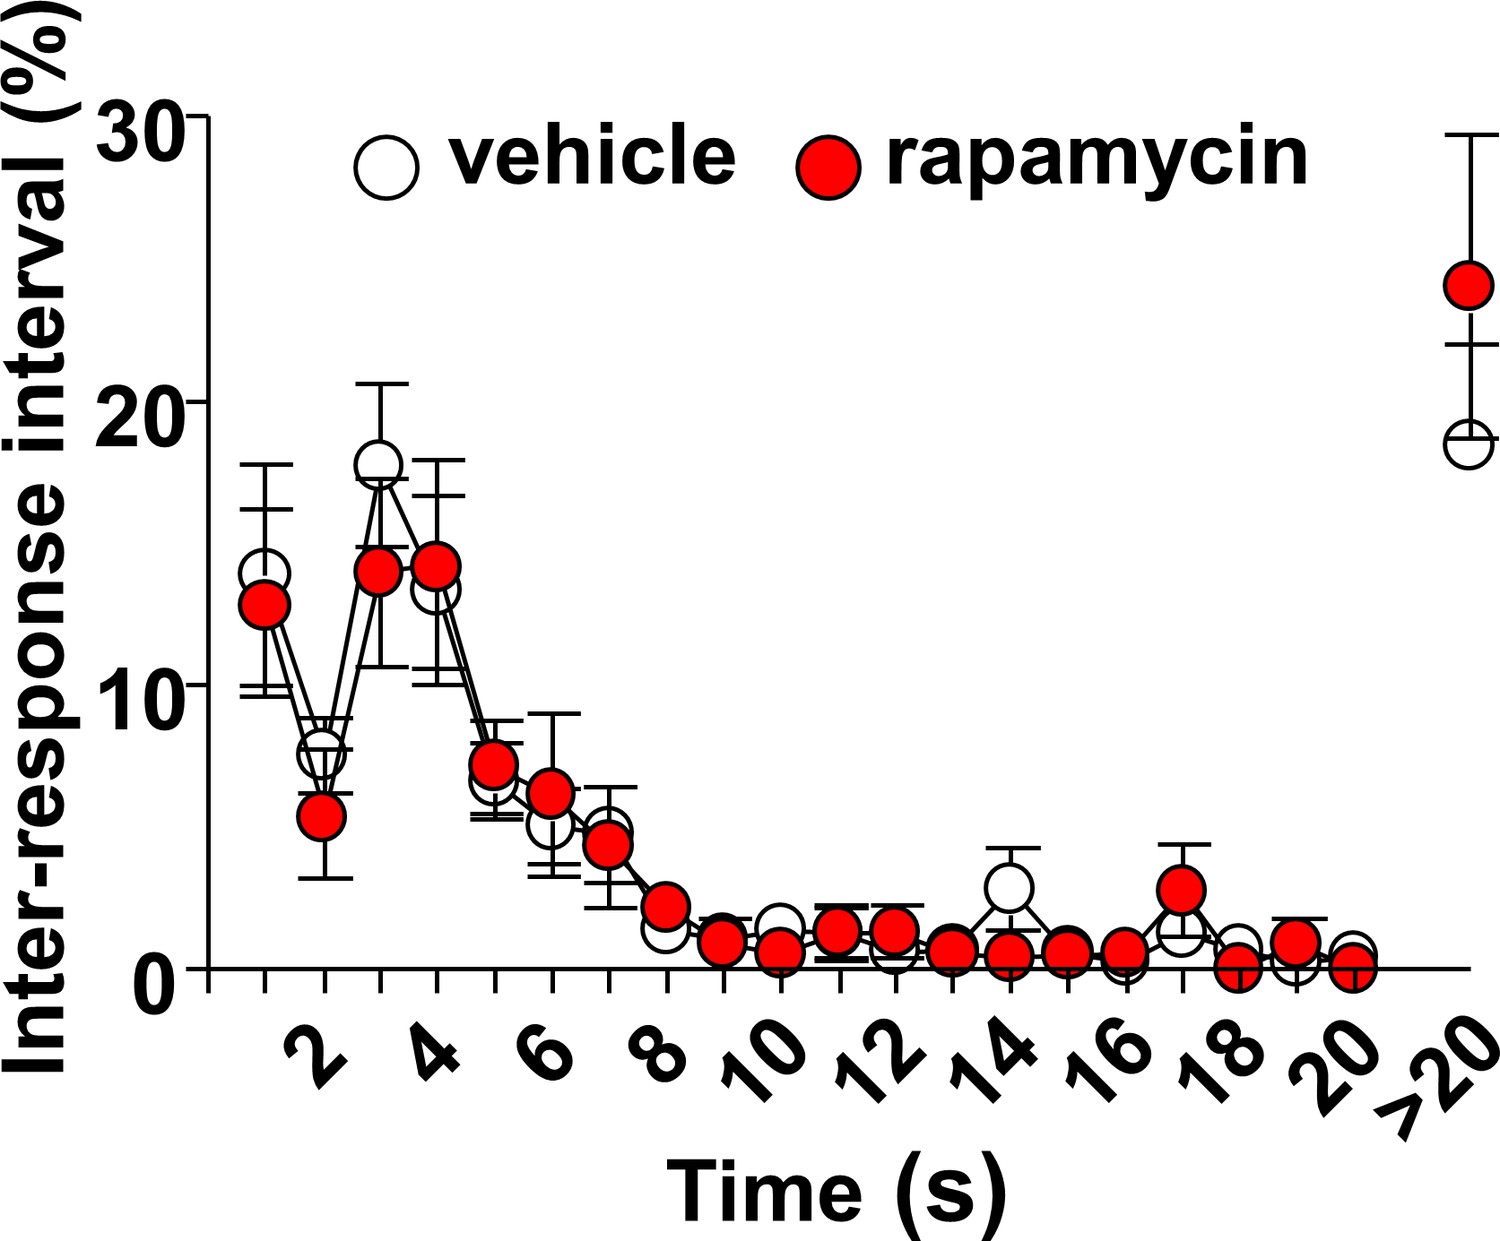
Intra-OFC infusion of rapamycin does not alter locomotion.
Rats were trained to self-administer 20% alcohol using a FR3 schedule. Vehicle (white) or rapamycin (50 ng/μl, red) was infused into the OFC 3 hr before a 30 min extinction session, and inter-response intervals (IRIs) were measured. Relative number of IRIs expressed as % of total IRIs with all intervals equal or smaller of 20 s presented in 1 s bins. Interval greater than 20 s are also shown. Two-way ANOVA of IRIs across the session did not identify a significant main treatment effect (F1,12=0.1412, p=0.7137). n = 9.
-
Figure 1—figure supplement 4—source data 1
Inter-response intervals during a 30 min self-administration session in vehicle- and rapamycin-treated rats.
- https://cdn.elifesciences.org/articles/51333/elife-51333-fig1-figsupp4-data1-v3.xlsx
Figure 2 with 3 supplements
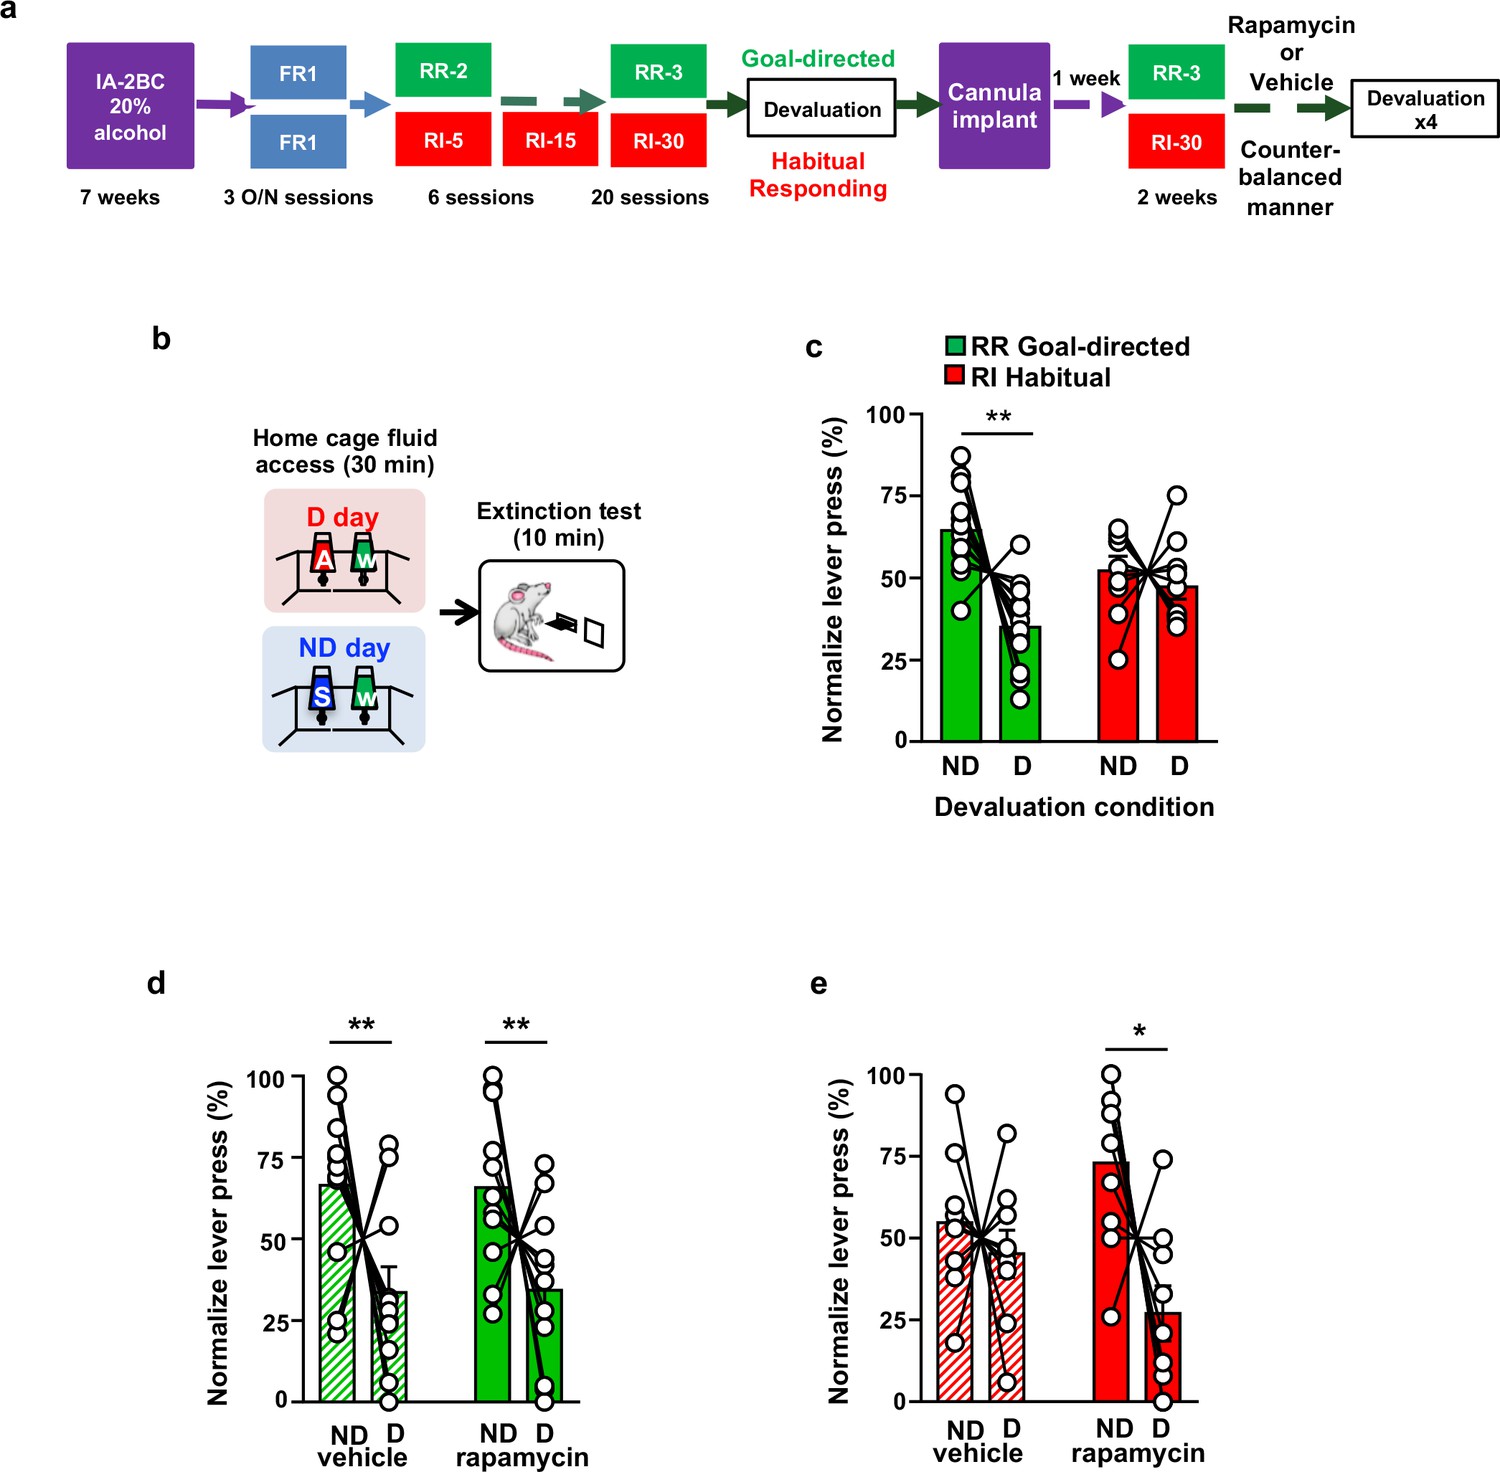
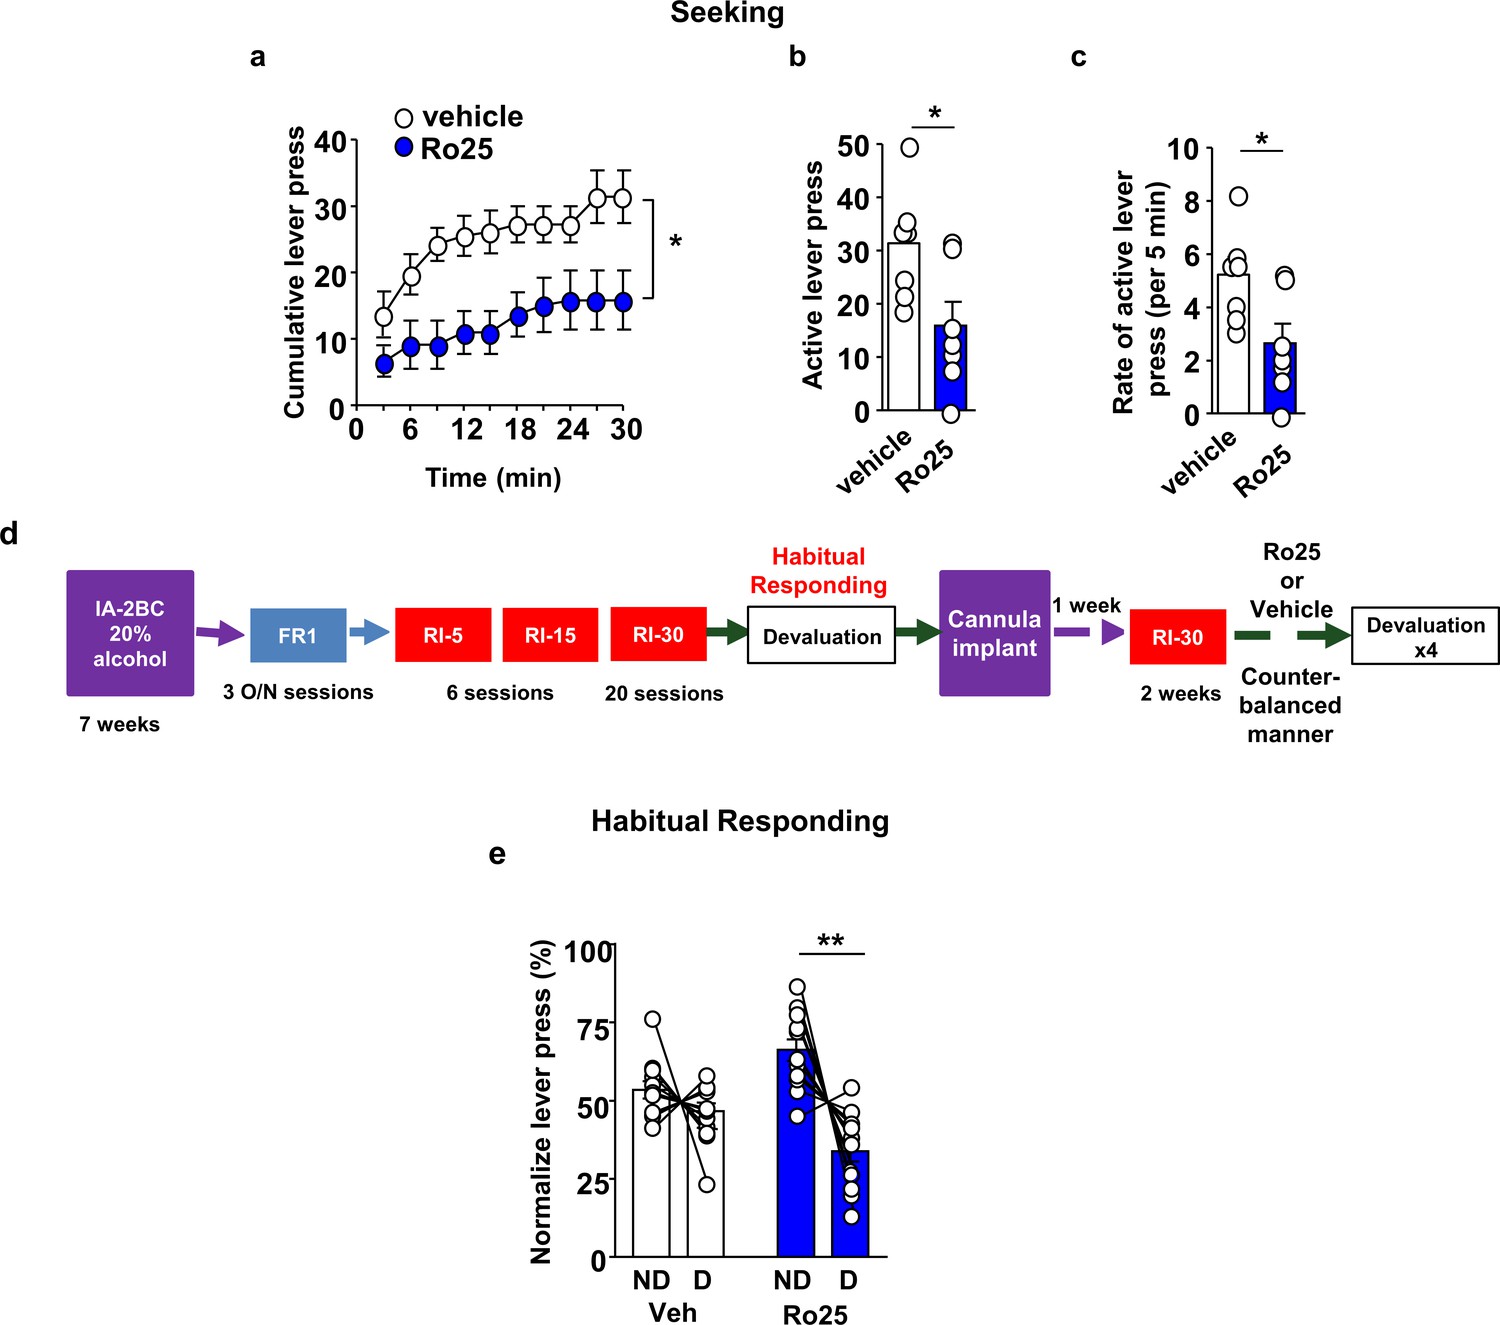
Inhibition of mTORC1 in the OFC attenuates habitual responding for alcohol.
(a) Timeline of experiment. Rats underwent 7 weeks of IA20%−2BC. Rats were then trained to operant self-administer 20% alcohol during three overnight FR1 sessions and were pseudo-randomly assigned to two groups. One group was subjected to a progressive RI reinforcement schedule, while the other was assigned to a RR schedule. Following a stable RI-30 or RR-3 responding, rats underwent alcohol devaluation testing depicted in (b). Upon establishing the behavior, rats underwent stereotaxic surgery to bilaterally implant a guide cannula. One week later, RI-30 or RR-3 training was resumed for 2 weeks, after which rats received microinjections of vehicle or drug in a counter-balanced manner, prior to the devaluation test. (b) Alcohol devaluation test. On test day, rats were pre-fed with 20% alcohol for 30 min in their home cage during devalued day (D) or with 1% sucrose in the non-devalued day (ND) (Table 1), and normalized lever pressing (percent of total presses on D or ND, see Materials and methods) was used to evaluate goal-directed or habitual responding during a 10 min extinction session. (c) RR trained animals are goal-directed whereas RI trained animals show habitual behavior. RR trained rats (green) press less during devalued day as compared to RI trained animals (red). Two-way ANOVA with Sidak post hoc analysis indicates a significant decrease in normalized lever pressing on D vs ND in RR-trained rats (p=0.0018), but not in RI-trained rats (p=0.8014) (Main effect of devaluation: F (1, 20)=9.391, p=0.0061; reinforcement schedule X devaluation: F (1, 20)=4.736, p=0.0417). (d) Intra-OFC infusion of rapamycin does not alter goal-directed alcohol seeking. Rats that were trained using a RR schedule of reinforcement received an intra-OFC infusion of vehicle (hatched green) or rapamycin (50 ng/μl) (green) 3 hr before the alcohol devaluation procedure as in (b), and the number of lever presses were measured during extinction. Total lever press-based normalization indicates significant decreases in lever pressing between ND and D days in both vehicle-treated and rapamycin-treated RR-trained rats (Main effect of devaluation: F(1, 20)=8.826, p=0.0076). (e) Intra-OFC infusion of rapamycin reduces habitual lever presses. Rats that were trained using a RI schedule of reinforcement received an intra-OFC infusion of vehicle (hatched red) or rapamycin (50 ng/μl) (red) 3 hr before the alcohol devaluation procedure as in (b), and the number of lever presses were measured during extinction. Total lever press-based normalization indicates significant decreases upon intra-OFC infusion of rapamycin- (p=0.0202), but not vehicle (p=0.8006) in RI trained rats on D compared to ND days (Main effect of devaluation: F(1,16)=6.189, p=0.0243). Data are presented as mean ± SEM. *p<0.05, **p<0.01 . (c) n = 8–10, (d) n = 11, (e) n = 9.
-
Figure 2—source data 1
Total lever presses during 10 min extinction sessions on non-devalued and devalued days in RR- and RI-trained rats (Figure 2c).
- https://cdn.elifesciences.org/articles/51333/elife-51333-fig2-data1-v3.xlsx
-
Figure 2—source data 2
Total lever presses during 10 min extinction sessions on non-devalued and devalued days in vehicle- and rapamycin-treated, RR-trained rats (Figure 2d).
- https://cdn.elifesciences.org/articles/51333/elife-51333-fig2-data2-v3.xlsx
-
Figure 2—source data 3
Total lever presses during 10 min extinction sessions on non-devalued and devalued days in vehicle- and rapamycin-treated, RI-trained rats (Figure 2e).
- https://cdn.elifesciences.org/articles/51333/elife-51333-fig2-data3-v3.xlsx
Figure 2—figure supplement 1
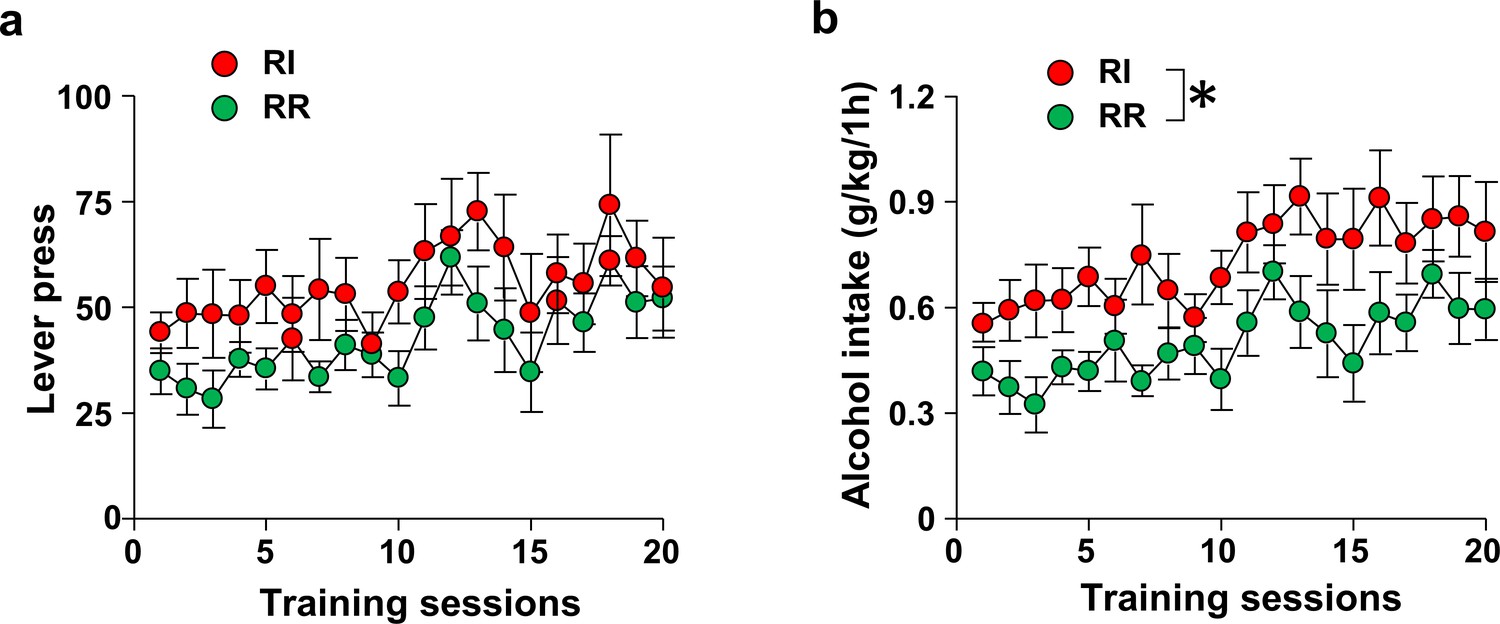
Number of lever presses and alcohol consumed in RI and RR-trained animals.
Rats were trained to respond for alcohol in an operant self-administration paradigm under RI (red) or RR (green) schedule of reinforcement. Significance between treatment groups was determined using RM ANOVA. (a) Training groups did not differ in the number of lever presses during training (F1,20=2.01, p>0.05). (b) RI-trained rats exhibited a small but significant increase of alcohol intake over the course of training (F1,20=6.65, p<0.05). *p<0.05. RR n = 12, RI n = 10.
-
Figure 2—figure supplement 1—source data 1
Total lever presses during 1 hr RR and RI training sessions (Figure 2—figure supplements 1a).
Alcohol consumed (g/kg) during 1 hr RR and RI training sessions (Figure 2—figure supplements 1b).
- https://cdn.elifesciences.org/articles/51333/elife-51333-fig2-figsupp1-data1-v3.xlsx
Figure 2—figure supplement 2
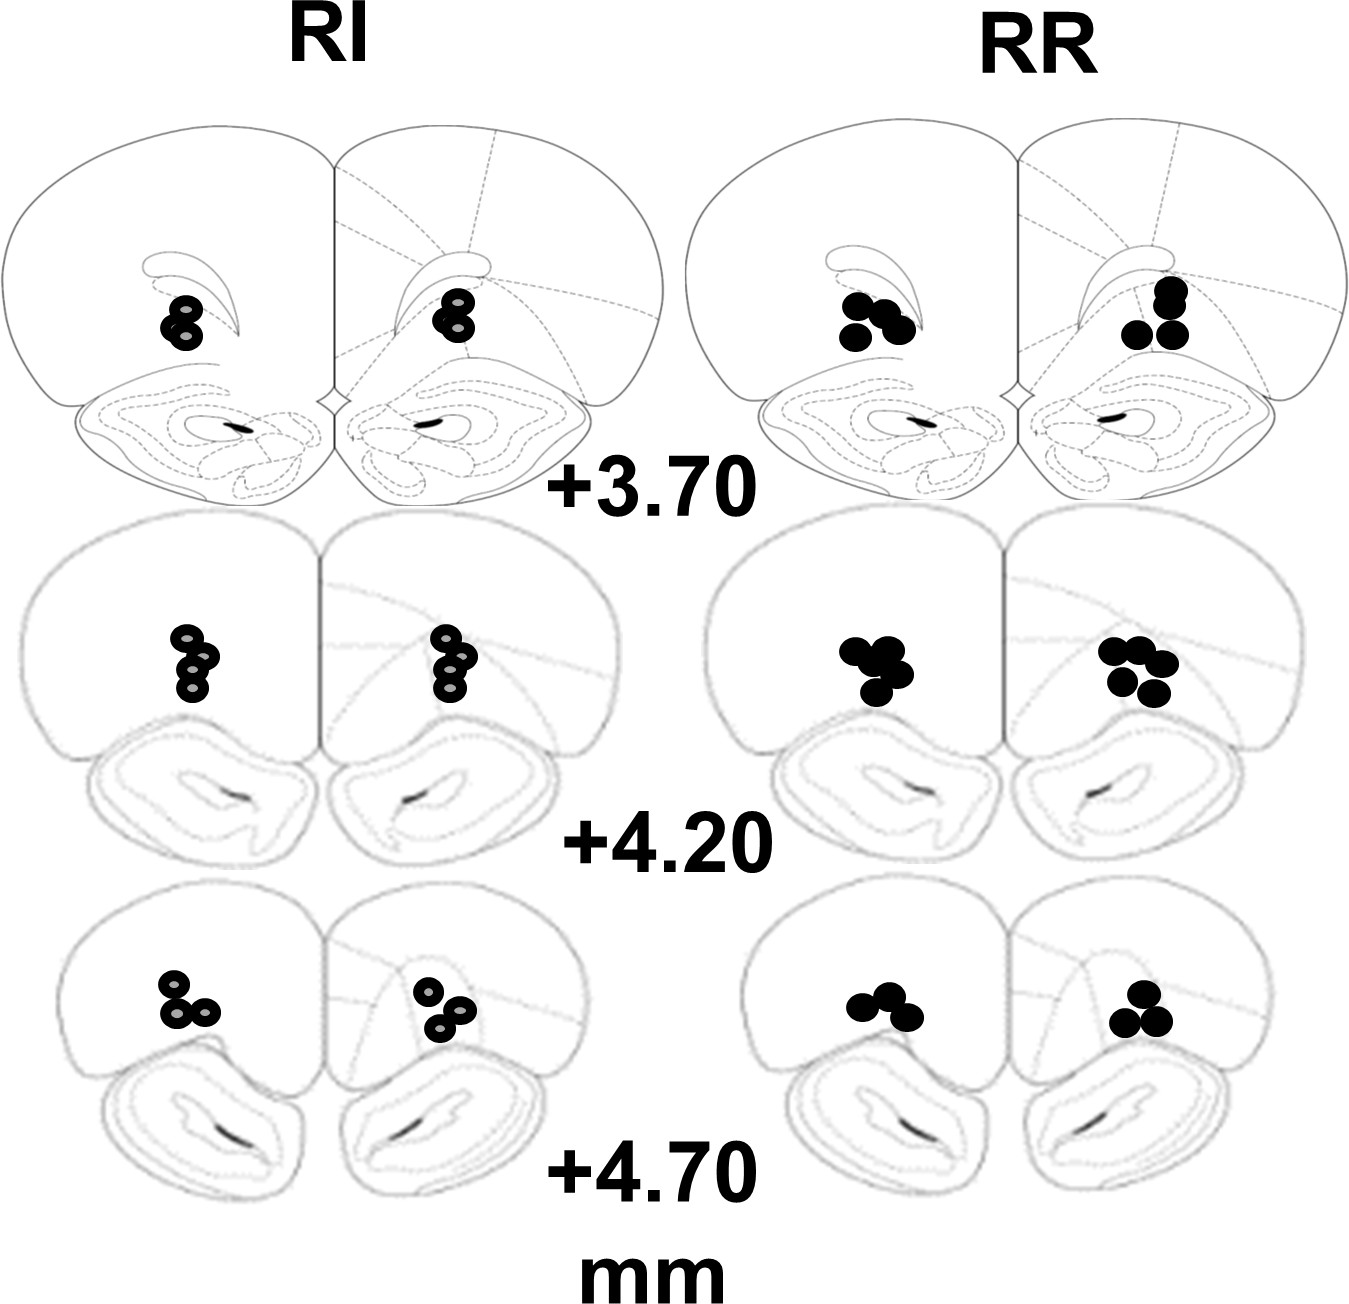
Schematic drawing of cannulae placement.
Schematic illustration of coronal sections of the rat brain showing approximate bilateral placements of cannulae in the OFC according to Paxinos and Franklin (2001).
Figure 2—figure supplement 3
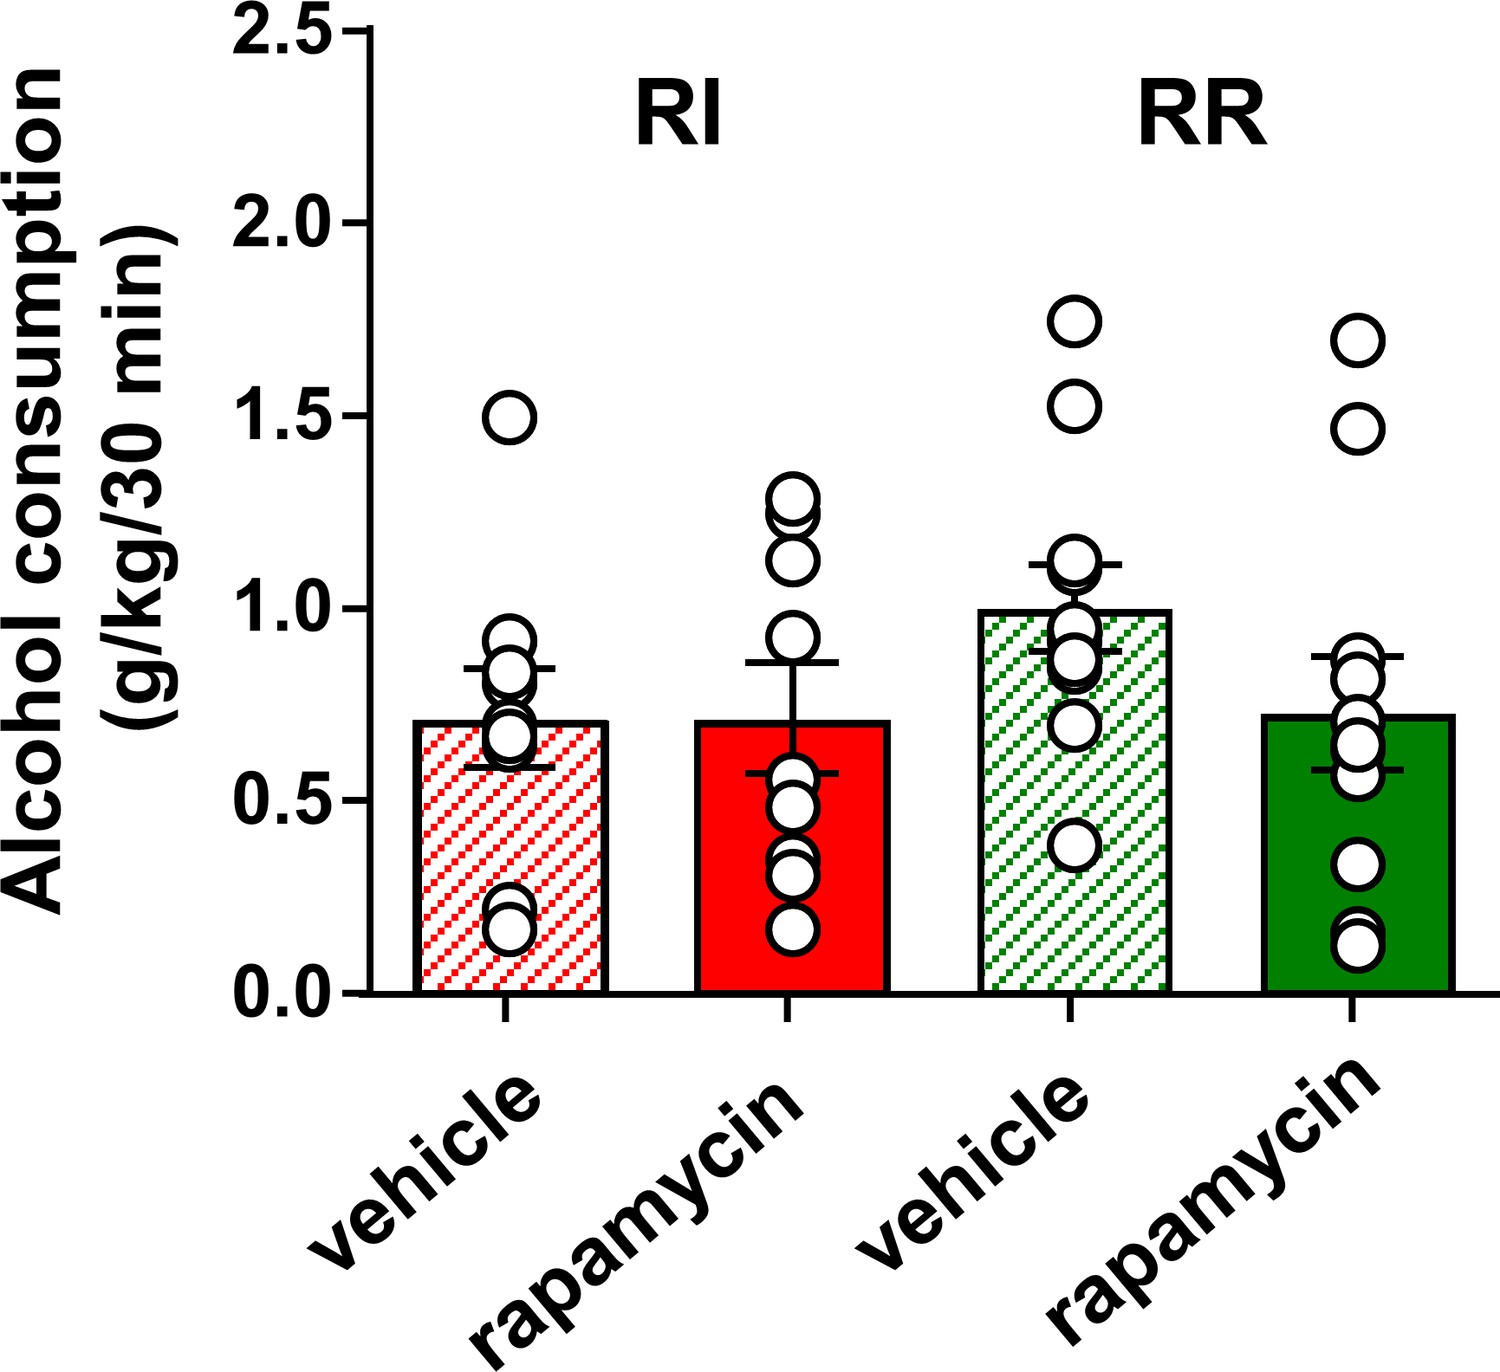
Inhibition of mTORC1 in the OFC does not alter voluntary alcohol intake prior to devaluation.
Rats were trained to respond for alcohol in an operant self-administration paradigm under RI (red) or RR (green) schedule of reinforcement. Vehicle (white) or rapamycin (50 ng/μl, red) was infused into the OFC 3 hr prior to home cage access to alcohol, and alcohol intake was recorded at the end of the 30 min session. Significance between treatment groups was determined using RM ANOVA. The amount of alcohol consumed did not differ by treatment (F1,30=0.21, p>0.05) or training history (F1,30=1.48, p>0.05). *p<0.05. RR n = 12, RI n = 10.
-
Figure 2—figure supplement 3—source data 1
Alcohol consumed (g/kg) during 30 min home cage alcohol exposure prior to devaluation extinction tests in vehicle- and rapamycin-treated rats.
- https://cdn.elifesciences.org/articles/51333/elife-51333-fig2-figsupp3-data1-v3.xlsx
Figure 3 with 2 supplements
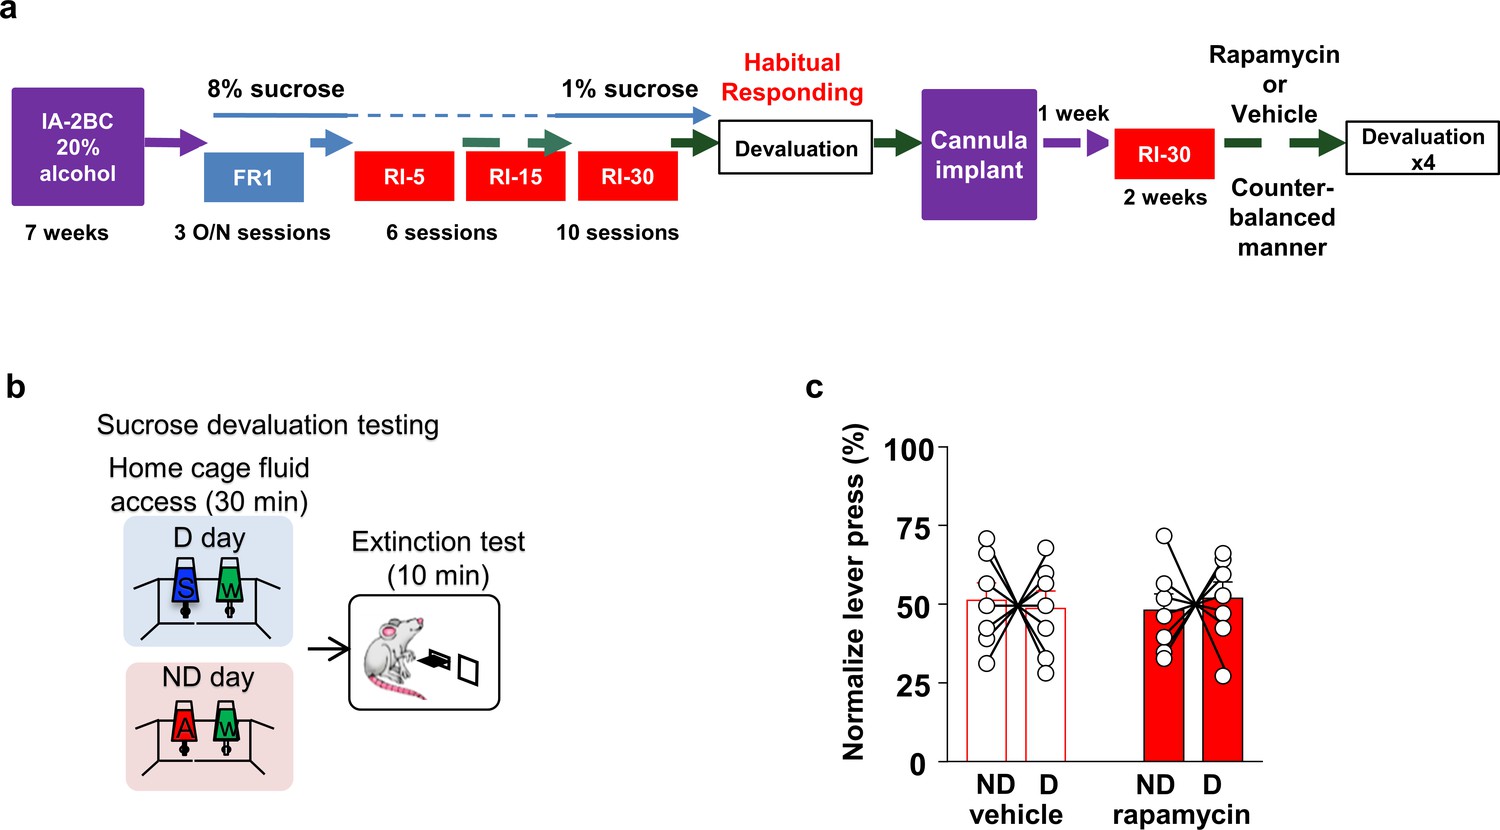
Habitual sucrose responding is not affected by mTORC1 inhibition in the OFC.
(a) Timeline of experiment. Rats underwent 7 weeks of IA20%−2BC and were then trained to operant self-administer 8% sucrose. Sucrose concentration was progressively reduced to 1% during three overnight FR1 sessions. Rats were then subjected to a RI reinforcement schedule. Drinking data are detailed in Table 1. Following a stable RI-30 responding, rats underwent alcohol devaluation testing depicted in (b). Upon establishing the behavior, rats underwent stereotaxic surgery to bilaterally implant a guide cannula. One week later, RI-30 training was resumed for 2 weeks, after which rats received microinjections of vehicle or rapamycin (50 ng/μl) in a counter-balanced manner, prior to the devaluation test. (b) Sucrose devaluation test. Habitual behavior was probed in an identical way to the alcohol-trained cohorts with the exception that sucrose pre-feeding was considered the devaluing context and alcohol was the non-devalued substance. (c) Two-way RM ANOVA failed to show a significant effect of repeated testing (Main effect of devaluation: F(1, 12)=0.006464, p>0.9999; treatment X devaluation: F(1, 12)=0.7257, p=0.4110) on lever presses between devalued and non-devalued days when habitually responding animals were pretreated with either vehicle or rapamycin. n = 7.
-
Figure 3—source data 1
Lever presses during sucrose devaluation extinction test in vehicle- and rapamycin-treated rats (Figure 3c).
- https://cdn.elifesciences.org/articles/51333/elife-51333-fig3-data1-v3.xlsx
Figure 3—figure supplement 1
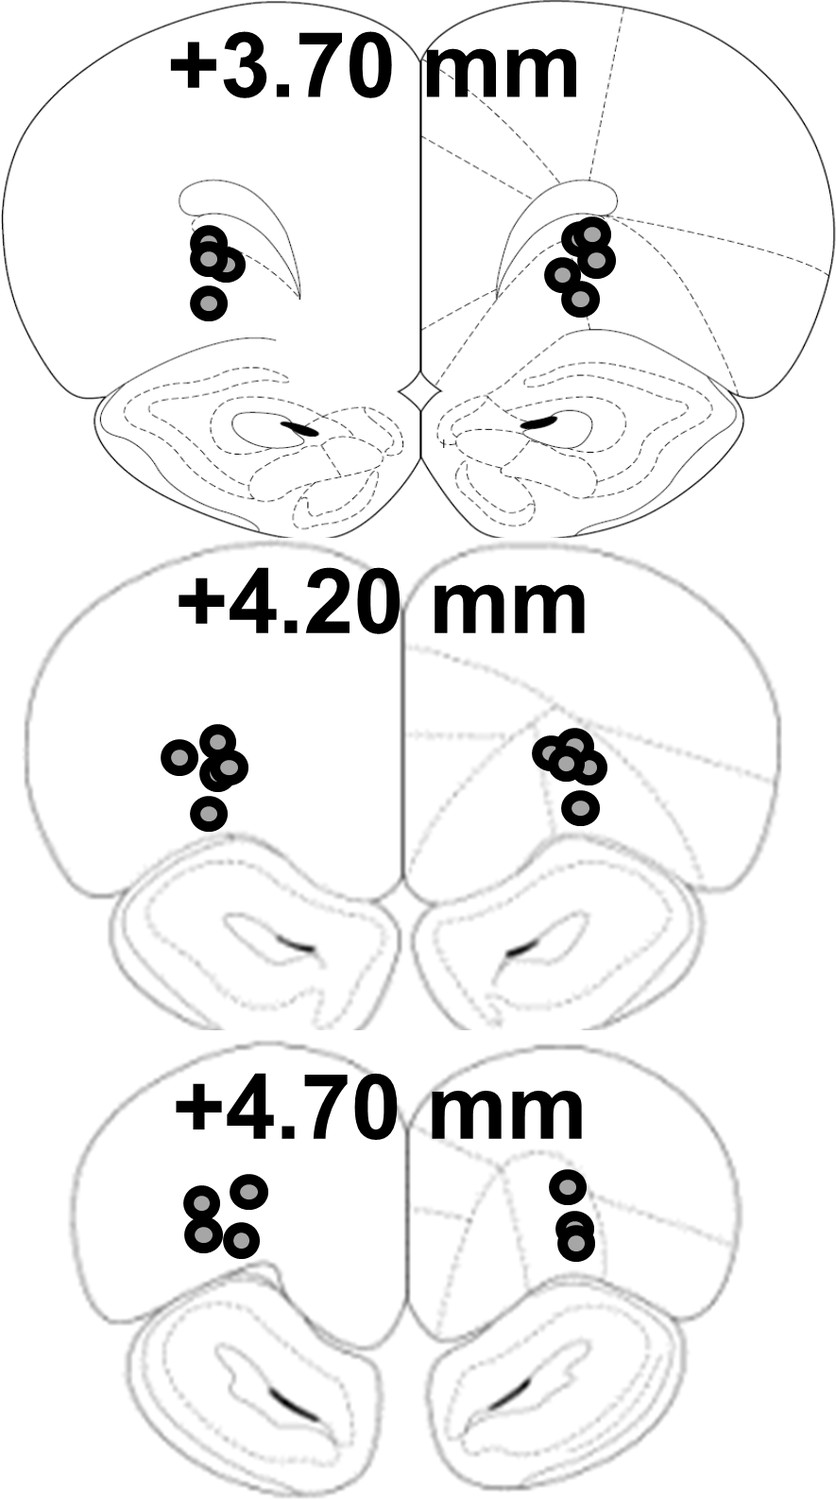
Schematic drawing of cannulae placement.
Schematic illustration of coronal sections of the rat brain showing approximate bilateral placements of cannulae in the OFC according to Paxinos and Franklin (2001).
Figure 3—figure supplement 2
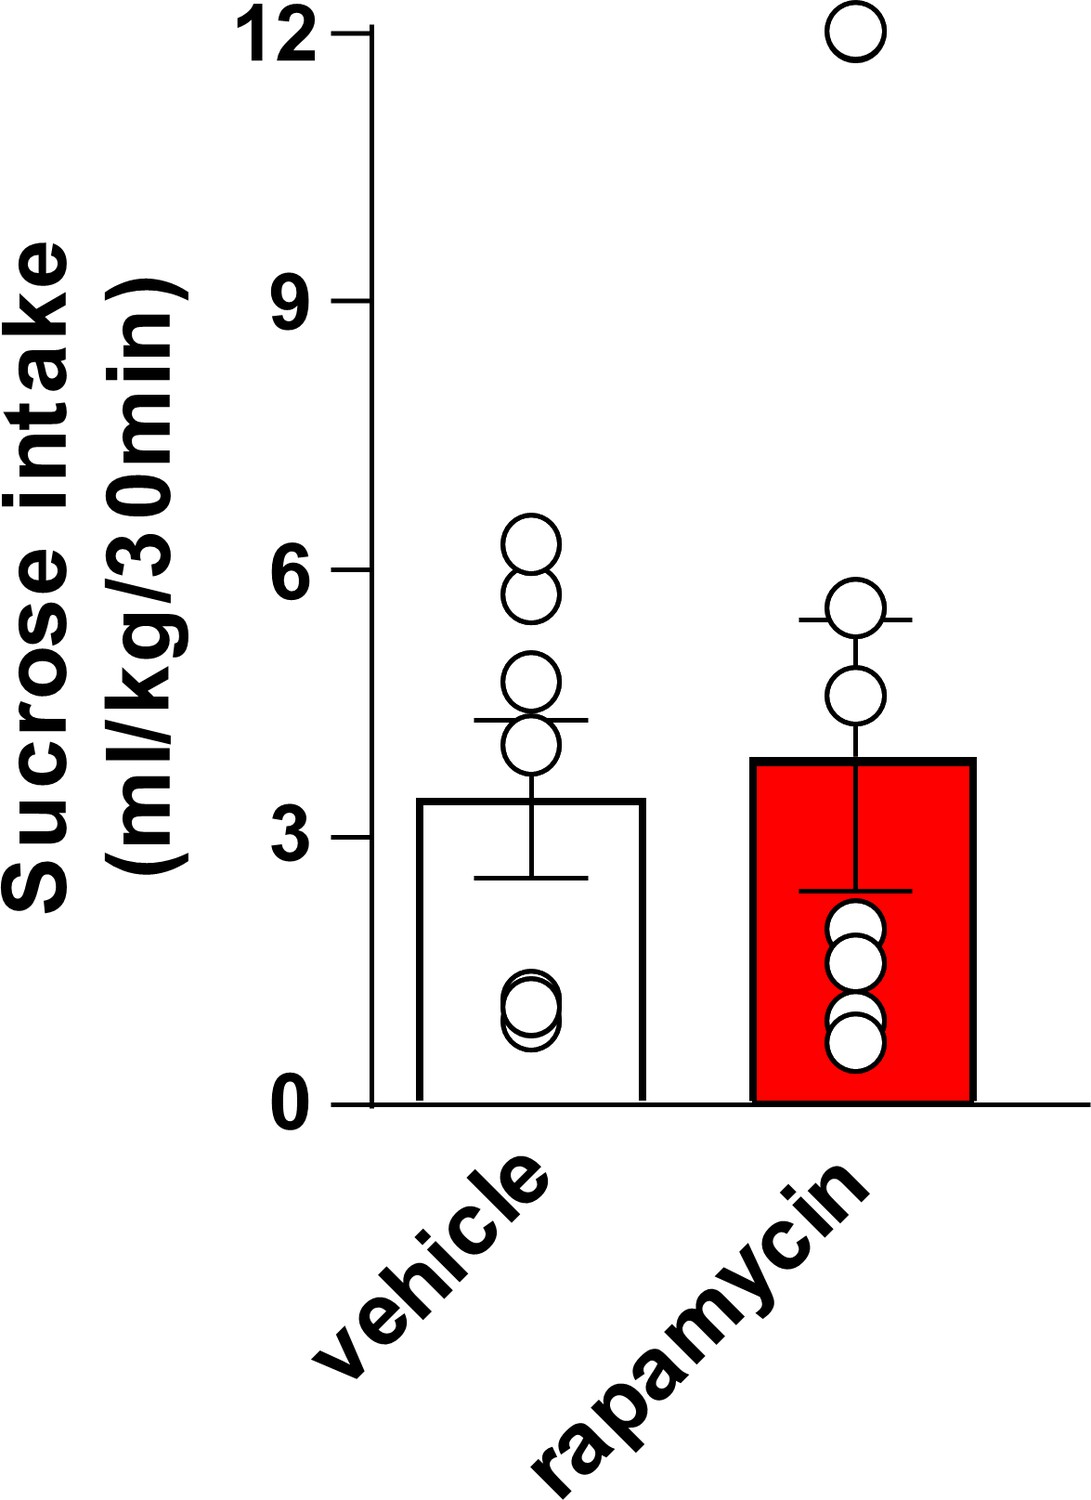
Inhibition of mTORC1 in the OFC does not alter voluntary sucrose intake prior to devaluation.
Rats were trained to respond for sucrose in an operant self-administration paradigm under RI schedule of reinforcement. Vehicle (white) or rapamycin (50 ng/μl, red) was infused into the OFC 3 hr prior to home cage access to sucrose, and sucrose intake was recorded at the end of the 30 min session. Significance between treatment groups was determined using a two-tailed, paired t-test. The amount of sucrose consumed did not differ by treatment (T6 = 0.3545, p>0.05). n = 7.
Figure 4 with 2 supplements
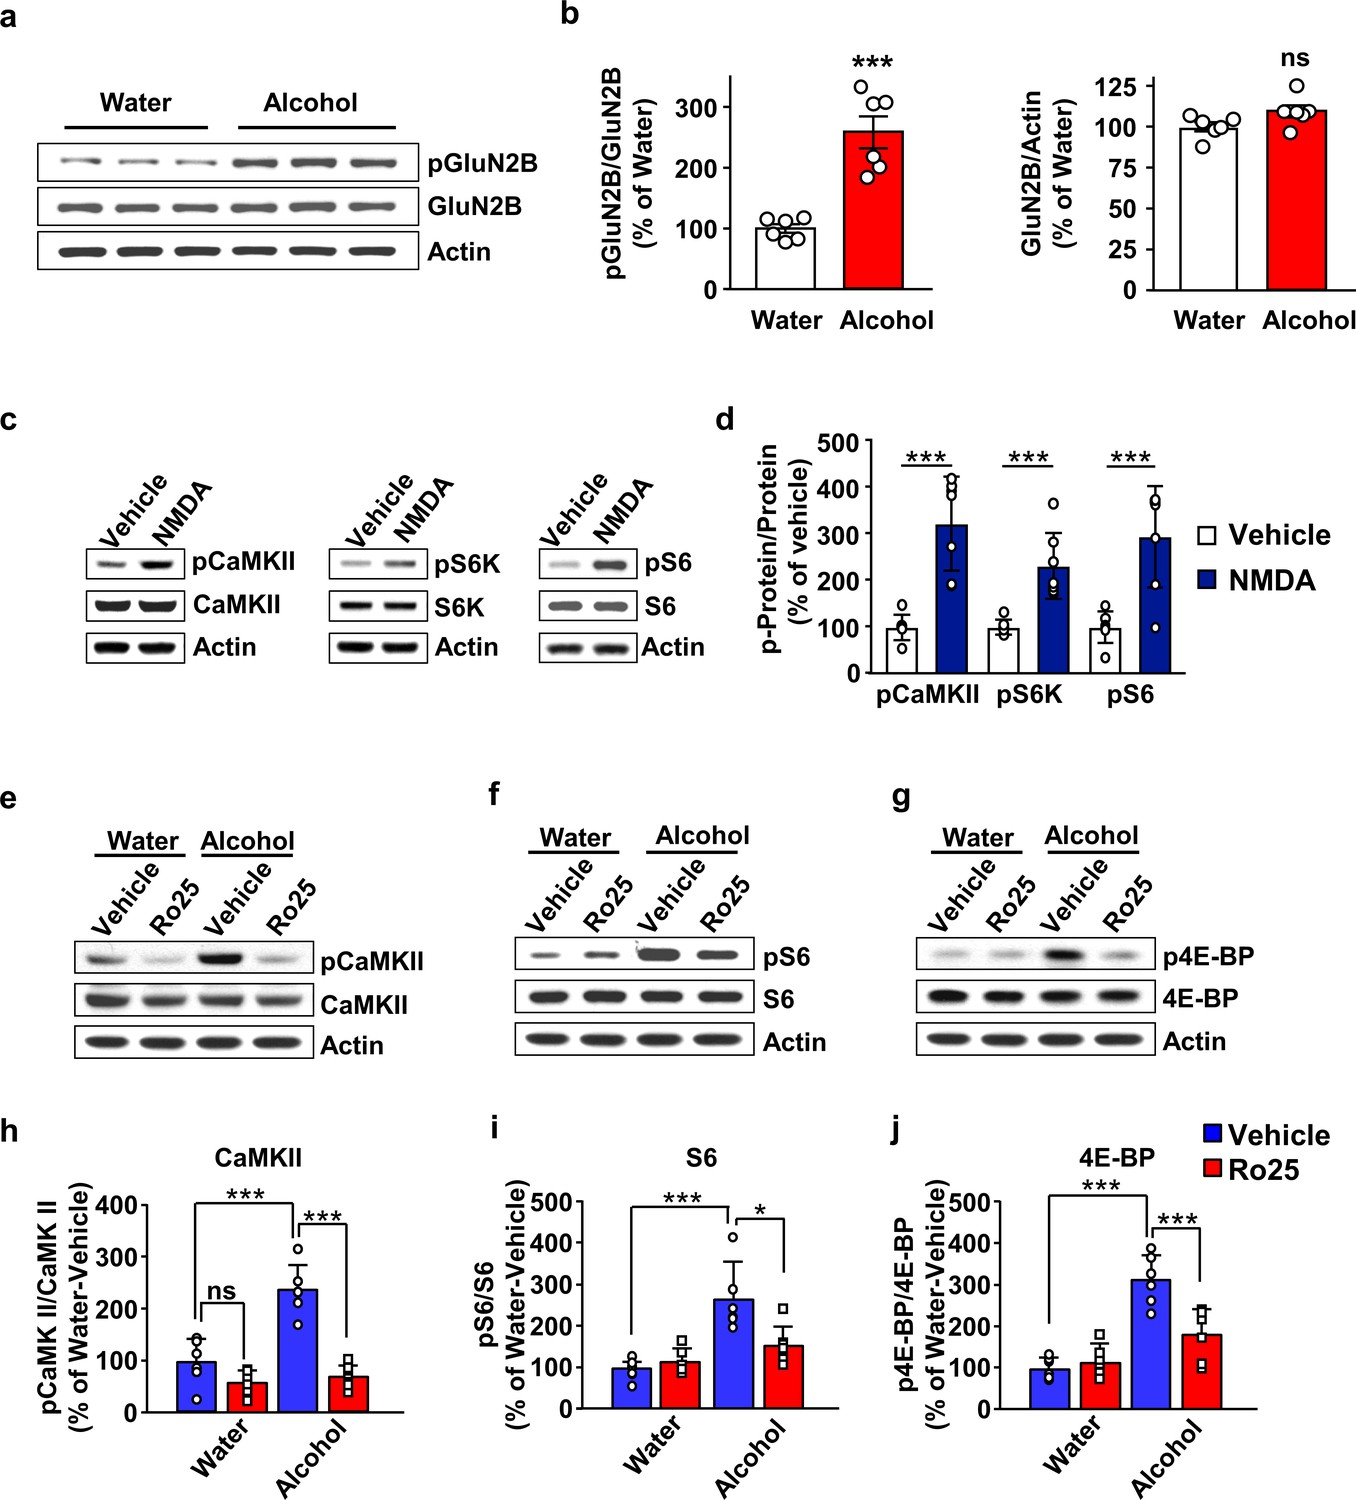
GluN2B in the OFC is required for mTORC1 activation by alcohol.
(a–b) Alcohol increases GluN2B phosphorylation in the OFC. Rats underwent 7 weeks of IA-20%2BC resulting in an average of alcohol intake of 5.01 g/kg/24 hr (Table 2). The OFC was dissected at the end of the last 24 hr alcohol withdrawal session, and GluN2B phosphorylation and protein levels were determined by western blot analysis, with actin used as a loading control. (a) Representative images depicting GluN2B phosphorylation (top) and total protein (middle) in the OFC of alcohol consuming vs. water only consuming rats. (b) ImageJ was used for optical density quantification. Data are expressed as the average ratio ± S.E.M of phospho-GluN2B to GluN2B (middle) or GluN2B to actin (right) and expressed as percentage of the water control. Significance was determined using unpaired t-test. Alcohol increased GluN2B phosphorylation (t10 = 5.829, p<0.001), but did not alter GluN2B levels (t10 = 2.025, p>0.05). (c–d) Stimulation of NMDA receptors activates mTORC1 in the OFC. Vehicle (0.1% DMSO) or NMDA (25 μM) was applied to OFC slices of naïve rats for 3 min. Phosphorylation of CaMKII, S6K and S6 were determined by western blot analysis. Total levels of the proteins were also measured, and actin was used as a loading control. (c) Representative blots of CaMKII (left), S6K (middle), and S6 (right) phosphorylation in OFC slices treated with vehicle or NMDA. (d) ImageJ was used for optical density quantification. Data are expressed as the average ratio ± S.E.M of phospho-CaMKII to CaMKII, phospho-S6K to S6K and phospho-S6 to S6, and are expressed as percentage of vehicle. Significance was determined using two-tailed unpaired t-test. (CaMKII: t12 = 5.61, p<0.001; S6K: t12 = 4.77, p<0.001; S6: t12 = 4.51, p<0.001). (e–j) Alcohol-dependent mTORC1 activation is attenuated by the GluN2B inhibitor, Ro25-6981. Rats underwent 7 weeks of IA-20%2BC resulting in an average of alcohol intake of 4.37 g/kg/24 hr (Table 2). Rats received an intra-OFC bilateral infusion of vehicle (saline) or Ro25-6981 (Ro25, 10 μg/μl), 15 min prior to the beginning of the last water only session and the OFC was dissected 24 hr later. Water only consuming rats were used as controls. (e–g) Representative images of CaMKII (e), S6 (f) and 4E-BP (g) phosphorylation in water vs. alcohol-exposed animals that were pre-treated with vehicle or Ro25-6981. (h–j) ImageJ was used for optical density quantification. Data are expressed as the average ratio ± S.E.M of phospho-CaMKII to CaMKII (h), phospho-S6 to S6 (i), and phospho-4E-BP to 4E-BP (j), and are expressed as percentage of water + vehicle group. Two-way RM ANOVA showed a significant effect of alcohol on phospho-CaMKII (F1,20=24.66, p<0.0001), phospho-S6 (F1,20=21.92, p=0.0001), and phospho-4E-BP (F1,20=48.23, p<0.0001). In addition, two-way RM ANOVAs indicated a main effect of drug treatment for phospho-CaMKII (F1,20=48.51, p<0.0001), phospho-S6 (F1,20=4.58, p<0.05), and phospho-4E-BP (F1,20=8.49, p<0.01), as well as treatment x alcohol interaction for phospho-CaMKII (F1,20=18.57, p<0.01), phospho-S6 (F1,20=7.559, p<0.05), and phospho-4E-BP (F1,20=13.22, p<0.01). Tukey’s multiple comparison post hoc analysis revealed that alcohol increased phospho-CaMKII (p<0.001), pS6 (p<0.001), and phospho-4E-BP (p<0.001) in vehicle-treated animals, and that pretreatment with Ro25-6981 reduced the phosphorylation of CaMKII (p<0.0001), S6 (p<0.05), and 4E-BP (p<0.001). *p<0.05, ***p<0.001. (a–b, e–j) n = 6 per group, (c–d) n = 7 per group.
-
Figure 4—source data 1
Full, uncropped western blot films from experiments in Figure 4.
- https://cdn.elifesciences.org/articles/51333/elife-51333-fig4-data1-v3.pptx
Figure 4—figure supplement 1
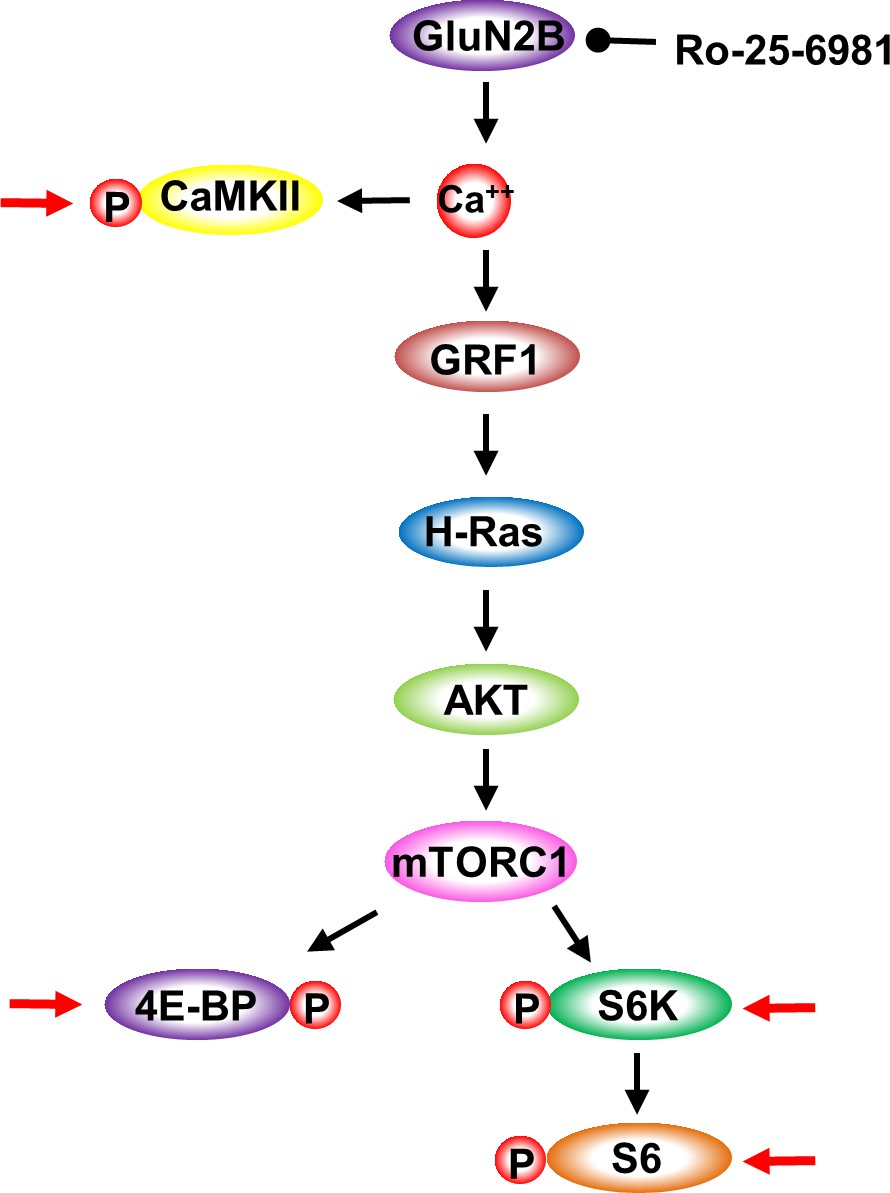
GluN2B-dependent activation of mTORC1 signaling.
Cartoon depicting the signaling cascade detailed in Figure 4. GluN2B activation results in calcium entry and in the activation CaMKII. CaMKII activation is measured by phosphorylation (P). Calcium binding to GRF1 activates H-Ras which activates AKT that in turn activates mTORC1. mTORC1 activation is measured by the phosphorylation of 4E-BP, S6K and S6. Red arrows depicts the specific proteins whose phosphorylation levels were tested.
Figure 4—figure supplement 2
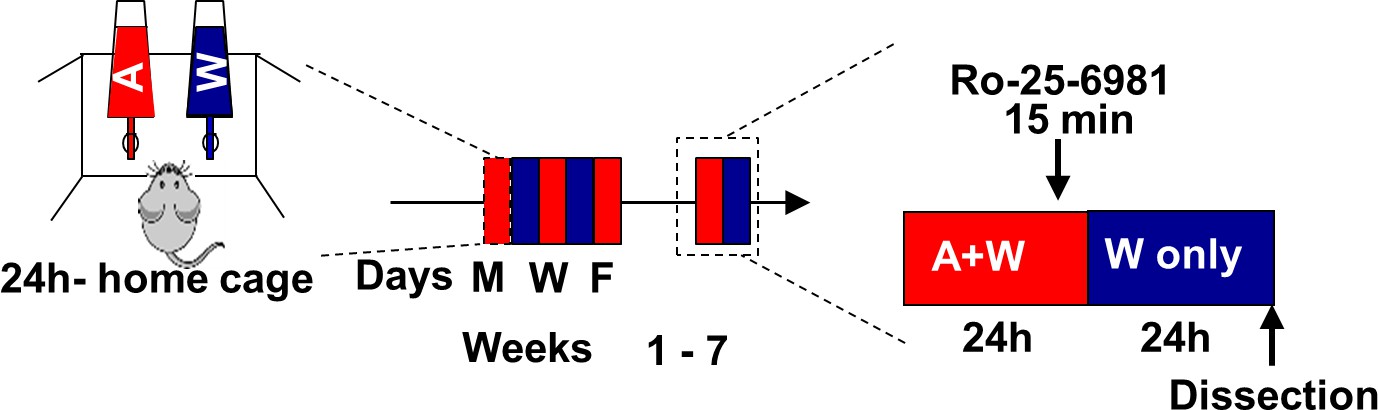
Timeline of experiments depicted in Figure 4e–j.
Rats underwent 7 weeks of IA-20%2BC paradigm or drank water only for the same duration of time. Ro-25–6981 (Fischer et al., 1997) (10 μg/µl) or vehicle was bilitteraly infused into the OFC 15 min before the end of the last 24 hr alcohol drinking session, and mTORC1 activation was measured 24 hr later.
Figure 5 with 3 supplements
GluN2B in the OFC promotes alcohol seeking and habitual alcohol responding.
(a–c) Intra-OFC administration of Ro25-6981 decreases alcohol seeking. Rats underwent 7 weeks of IA-20%2BC, and were then trained to self-administer 20% alcohol. Vehicle (white) or Ro25-6981 (Ro25, 10 μg/μl, blue) was infused bilaterally in the OFC 15 min prior to a 30 min extinction session. (a) Cumulative lever presses. Two-way RM ANOVA revealed a significant main treatment effect (F1,12=10.89, p<0.05). Two-tailed paired t-test revealed that the number (b) and the rate (per 5 min) (c) of lever press were significantly different in the vehicle vs. Ro25-6981 groups (both t6 = 2.62, p<0.05). (d) Timeline of experiment. Rats underwent 7 weeks of IA20%−2BC, and were then trained to operant self-administer 20% alcohol using a progressive RI reinforcement schedule. Following stable RI-30 lever presses, rats underwent stereotaxic surgery to bilaterally implant guide cannulae in the OFC. One week later, RI-30 training was resumed for 2 weeks, after which rats received microinjections of vehicle (white) or Ro25-6981 (5 μg/μl, blue) in a counter-balanced manner 15 min prior to a 30 min home cage 20%2BC alcohol drinking session, and the number of lever presses were measured during extinction. (e) Intra-OFC administration of Ro25-6981 attenuates habitual alcohol seeking. Two way RM ANOVA showed a main effect of devaluation (F1,33=13.72, p<0.001) as well as a treatment x devaluation interaction (F1,33=6.31, p<0.05). Sidak’s multiple comparison test detected a significant difference for Ro25-6981 (p<0.001) on D compared to ND days. Individual data points and mean ± SEM are shown, (a–c) n = 7, (e) n = 12. *p<0.05, **p<0.01.
-
Figure 5—source data 1
Cumulative lever presses at 3 min intervals for vehicle- and Ro25-treated rats during a 30 min extinction session (Figure 5a).
- https://cdn.elifesciences.org/articles/51333/elife-51333-fig5-data1-v3.xlsx
-
Figure 5—source data 2
Total lever presses and lever pressing rate (presses/min) during a 30 min extinction session in vehicle- and Ro25-treated rats (Figure 5b–c).
- https://cdn.elifesciences.org/articles/51333/elife-51333-fig5-data2-v3.xlsx
-
Figure 5—source data 3
Total lever presses during 10 min extinction sessions on non-devalued and devalued days in vehicle- and Ro25-treated, RI-trained rats (Figure 5d).
- https://cdn.elifesciences.org/articles/51333/elife-51333-fig5-data3-v3.xlsx
Figure 5—figure supplement 1
Schematic drawing of cannulae placement.
Schematic illustration of coronal sections of the rat brain showing approximate bilateral placements of cannulae in the OFC according to Paxinos and Franklin (2001).
Figure 5—figure supplement 2
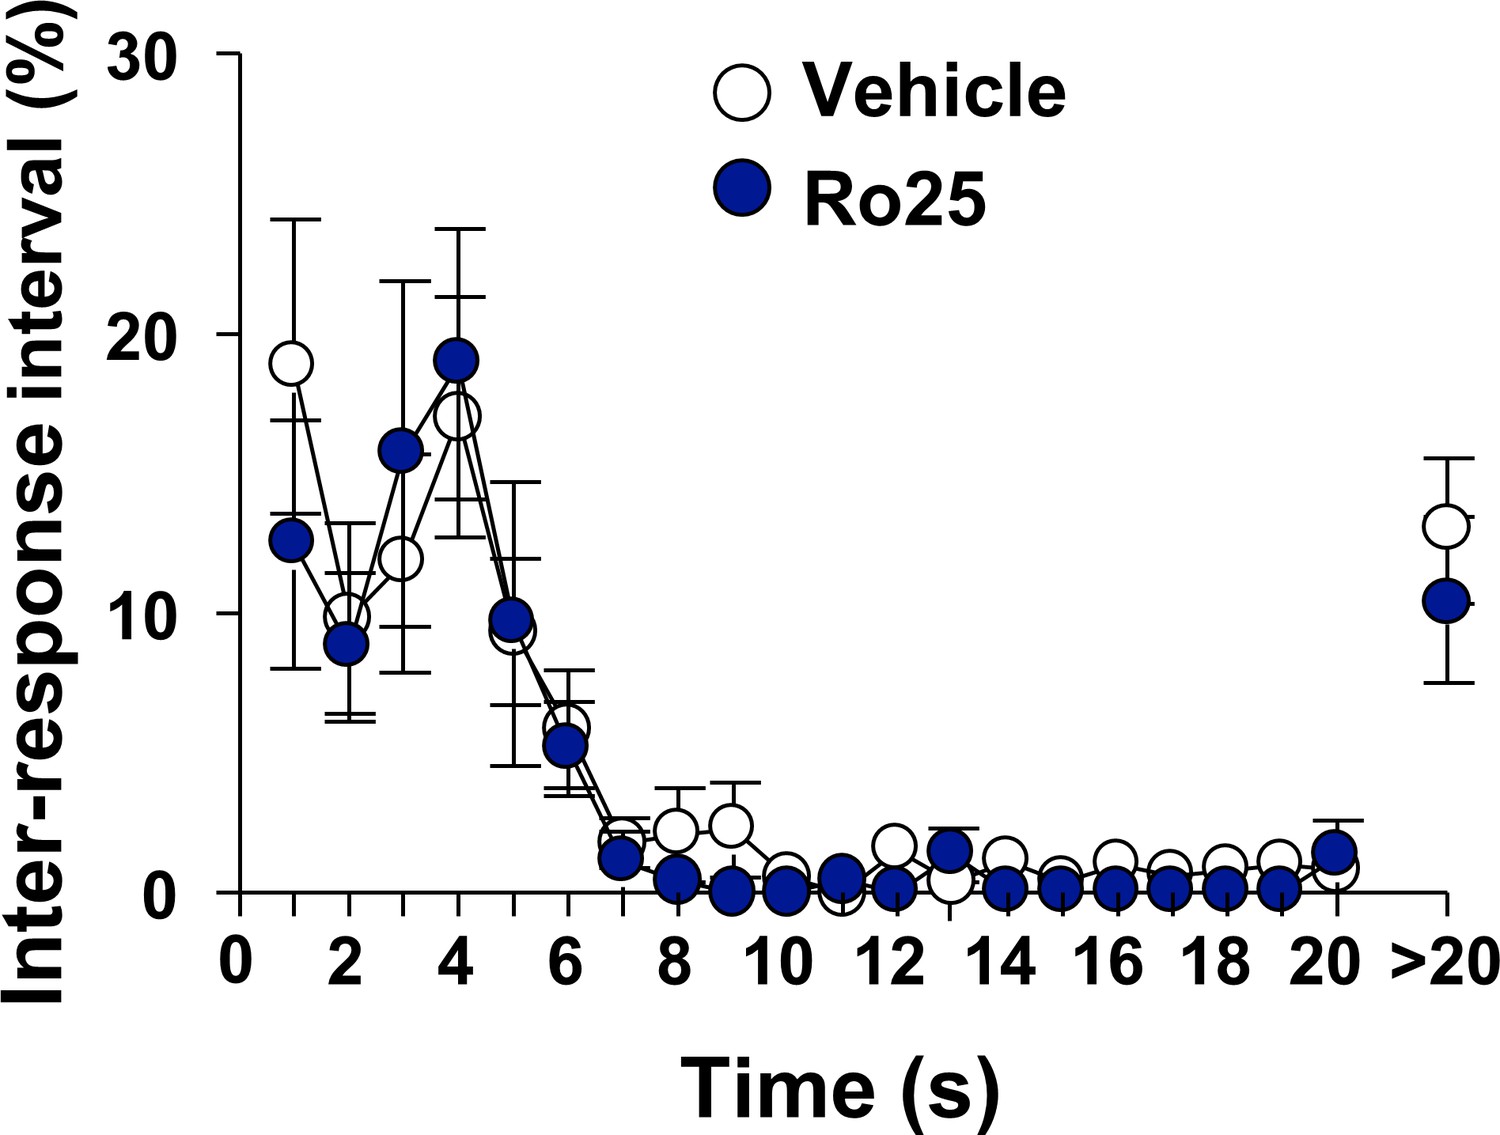
Inhibition of GluN2B in the OFC does not alter locomotion.
Vehicle (white) or Ro25-6981 (10 μg/μl, blue) was infused in the OFC 15 min before a single 30 min extinction session and inter-response intervals (IRIs) were measured. Mean ± SEM of the relative number of IRIs expressed as % of total IRIs with all intervals equal or smaller of 20 s presented in 1 s bins. Intervals greater than 20 s are also shown. Two way RM ANOVA of IRIs across the session did not identify a significant main treatment effect (F1,12=0.81, p=0.3858). n = 7.
-
Figure 5—figure supplement 2—source data 1
Inter-response intervals during a 30 min extinction session in vehicle- and Ro25-treated rats.
- https://cdn.elifesciences.org/articles/51333/elife-51333-fig5-figsupp2-data1-v3.xlsx
Figure 5—figure supplement 3
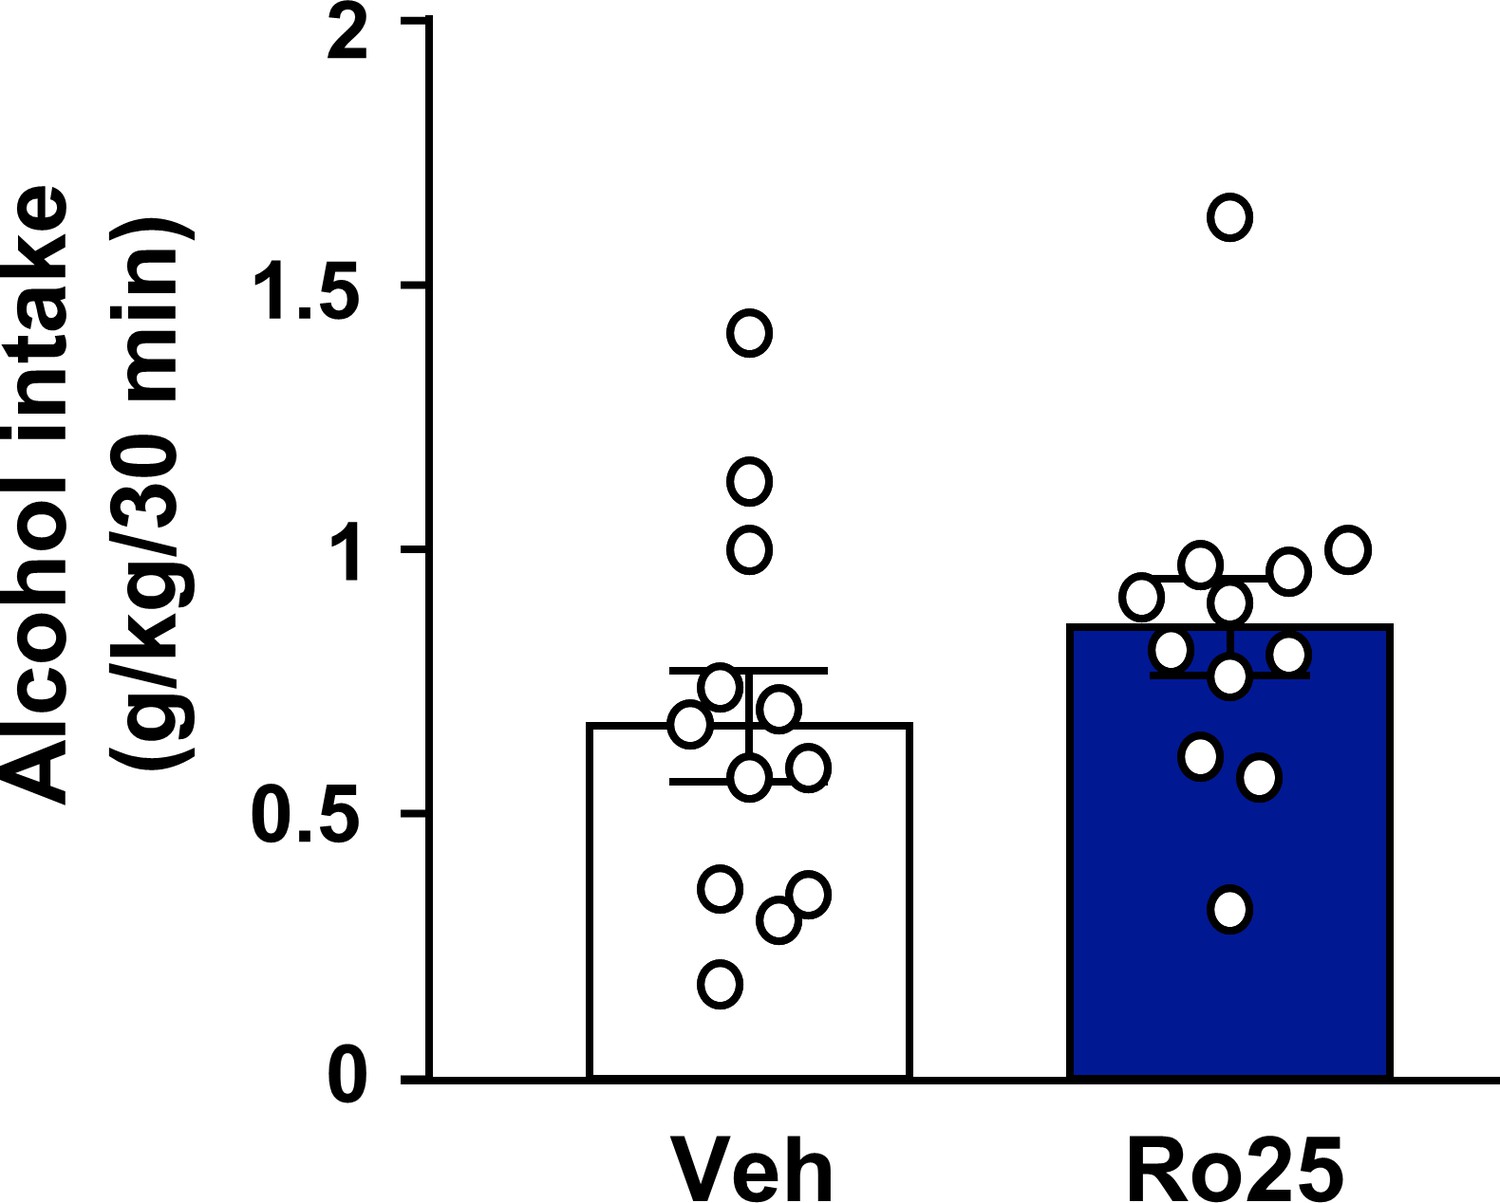
Inhibition of GluN2B in the OFC does not alter voluntary alcohol intake prior to devaluation.
Rats were trained to respond for alcohol in an operant self-administration paradigm under RI schedule of reinforcement. Vehicle (white) or Ro25-6981 (5 μg/μl, blue) was infused into the OFC 15 min prior to home cage access to alcohol, and alcohol intake was recorded at the end of the 30 min session (Table 1). Significance between treatment groups was determined using RM ANOVA. The amount of alcohol consumed did not differ by treatment (t5 = 2.80, p>0.05). n = 12.
-
Figure 5—figure supplement 3—source data 1
Alcohol consumed (g/kg) during 30 min home cage alcohol exposure prior to devaluation extinction tests in vehicle- and Ro25-treated rats.
- https://cdn.elifesciences.org/articles/51333/elife-51333-fig5-figsupp3-data1-v3.xlsx
Tables
Table 1
Mean consumption of sucrose, alcohol and water during outcome devaluation.
Rats undergoing alcohol seeking probe trials were pre-fed with sucrose (non-devalued test) or alcohol (devalued test), and water 30 min prior to a 10 min extinction session.
| Alcohol Devaluation | |||||||
|---|---|---|---|---|---|---|---|
| Training | RI | RR | RI | ||||
| Group | Vehicle | rapamycin | Vehicle | rapamycin | Vehicle | Ro25 | |
| Non-devalued day | 1% Sucrose (ml/kg) | 1.4 | 2.0 | 1.2 | 1.9 | 2.7 | 4.5 |
| ± | ± | ± | ± | ± | ± | ||
| 0.5 | 0.8 | 0.4 | 0.6 | 1.5 | 0.9 | ||
| Water (ml/kg) | 0.7 | 0.6 | 1.2 | 0.8 | 1.0 | 2.5 | |
| ± | ± | ± | ± | ± | ± | ||
| 0.3 | 0.1 | 0.7 | 0.1 | 0.2 | 1.2 | ||
| Devalued day | 20% Alcohol (g/kg) | 0.7 | 0.7 | 1.0 | 0.7 | 0.9 | 1.0 |
| ± | ± | ± | ± | ± | ± | ||
| 0.1 | 0.1 | 0.1 | 0.1 | 0.1 | 0.2 | ||
| Water (ml/kg) | 0.4 | 0.6 | 0.7 | 0.6 | 1.0 | 0.9 | |
| ± | ± | ± | ± | ± | ± | ||
| 0.1 | 0.1 | 0.1 | 0.1 | 0.4 | 0.2 | ||
| Sucrose Devaluation | |||||||
| Training | RI | ||||||
| Group | Vehicle | rapamycin | |||||
| Non-devalued day | 20% Alcohol (g/kg) | 0.9 | 0.8 | ||||
| ± | ± | ||||||
| 0.1 | 0.1 | ||||||
| Water (ml/kg) | 0.9 | 1.1 | |||||
| ± | ± | ||||||
| 0.1 | 0.1 | ||||||
| Devalued day | 1% Sucrose (ml/kg) | 4.5 | 5.1 | ||||
| ± | ± | ||||||
| 0.7 | 1.4 | ||||||
| Water (ml/kg) | 1.2 | 0.9 | |||||
| ± | ± | ||||||
| 0.2 | 0.1 | ||||||
Table 2
Individual alcohol drinking data from rodents used for biochemical experiments.
Individual alcohol drinking data of the final 4 sessions of IA-2BC20%. Alcohol intake is expressed as mean ± S.E.M.
| Figure 4a, b | Drinking paradigm IA20%−2BC 24h-withdrawal | Rat number | Last four drinking session (g/kg /24 ) |
|---|---|---|---|
| 1 | 5.97 | ||
| Animal numbers | 2 | 6.40 | |
| n = 6 | 3 | 4.00 | |
| 4 | 5.84 | ||
| 5 | 4.23 | ||
| 6 | 3.60 | ||
| Mean ± S.E.M. | 5.01 ± 0.49 | ||
| Figure 4e,f and g | Drinking paradigm IA20%−2BC 24h-withdrawal | Rat number | Last four drinking session (g/kg/24 h) |
| Animal numbers n = 12 | 1 | 5.35 | |
| 2 | 5.52 | ||
| 3 | 5.54 | ||
| 4 | 4.84 | ||
| 5 | 6.41 | ||
| 6 | 3.16 | ||
| 7 | 4.37 | ||
| 8 | 3.45 | ||
| 9 | 3.48 | ||
| 10 | 6.24 | ||
| 11 | 2.71 | ||
| 12 | 5.72 | ||
| Mean ± S.E.M. | 4.73 ± 0.37 |
Additional files
Download links
A two-part list of links to download the article, or parts of the article, in various formats.
Downloads (link to download the article as PDF)
Open citations (links to open the citations from this article in various online reference manager services)
Cite this article (links to download the citations from this article in formats compatible with various reference manager tools)
mTORC1 in the orbitofrontal cortex promotes habitual alcohol seeking
eLife 8:e51333.
https://doi.org/10.7554/eLife.51333


