Single-cell transcriptome reveals the novel role of T-bet in suppressing the immature NK gene signature
- Laboratory of Molecular Immunology and Immunotherapy, Blood Research Institute, Blood Center of Wisconsin, United States
- Department of Microbiology and Immunology, Medical College of Wisconsin, United States
- Bioinfomatics Core, Blood Research Institute, Blood Center of Wisconsin, United States
- Laboratory of B-Cell Lymphopoiesis, Blood Research Institute, Blood Center of Wisconsin, United States
- Flow Cytometry Core, Blood Research Institute, Blood Center of Wisconsin, United States
- Department of Surgery, Medical College of Wisconsin, United States
- Laboratory of Lymphocyte Biology, Blood Research Institute, Blood Center of Wisconsin, United States
- Department of Medicine, Medical College of Wisconsin, United States
- Laboratory of Stem Cell Transcriptional Regulation, Blood Research Institute, Blood Center of Wisconsin, United States
- Laboratory of Coagulation Biology, Blood Research Institute, Blood Center of Wisconsin, United States
- Department of Pediatrics, Medical College of Wisconsin, United States
Figures
Figure 1 with 2 supplements
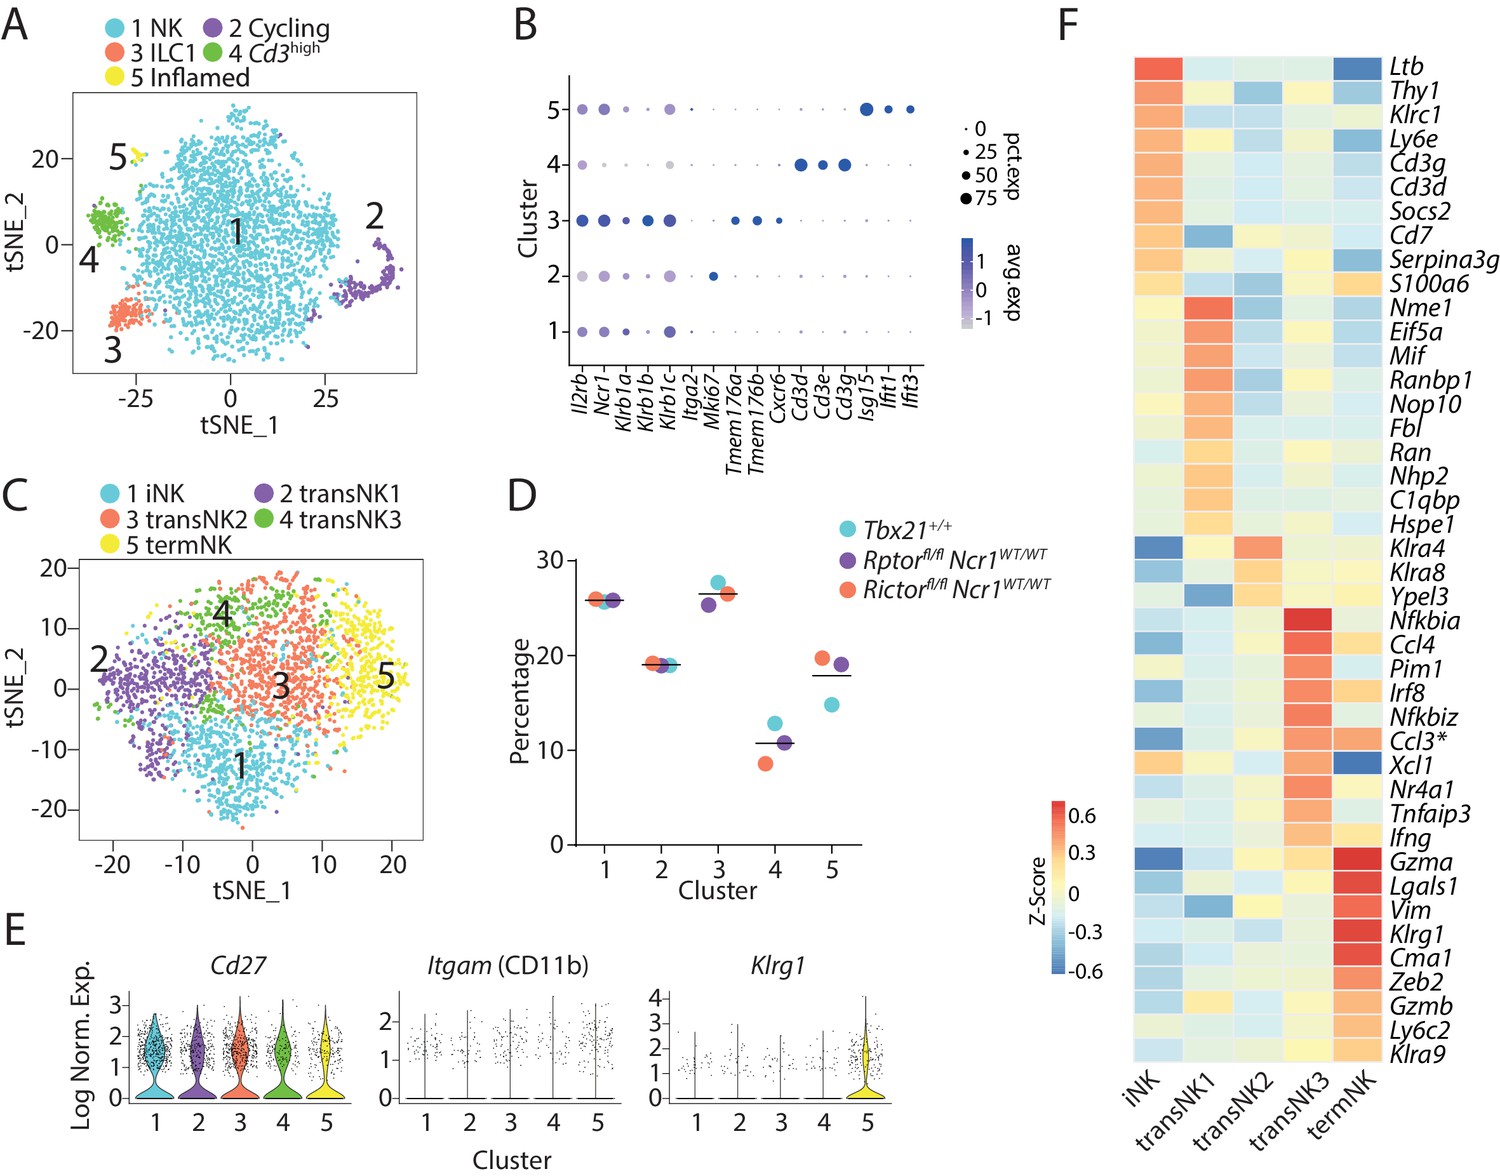
Transcriptome-based classification of CD3ε−CD122+ murine BM cells.
(A) With low clustering resolution (0.2), the bulk CD3ε−CD122+ BM cells from three WT mice were clustered into five distinct populations demonstrated in the tSNE plot. (B) The expression of selected genes associated with the identity of each cluster in (A) were shown in a dot plot. The size of the dot indicates the percentage of cells expressing the gene within each cluster (pct.exp). The color of the dot indicates the average expression of the gene within each cluster (avg.exp). (C) Five distinct clusters identified through unbiased clustering analysis of the NK cluster in (A). (D) The composition of the five NK clusters in each of the WT mouse. (E) Violin plots demonstrate the expression of Cd27, Itgam (CD11b), and Klrg1 in each NK cluster. The y-axis represents log-normalized expression value. (F) The average expression of the top 10 up-regulated DEGs (ranked by log fold-change) of each NK cluster were plotted using heatmap. The transNK2 cluster only contained three up-regulated DEGs with the 0.25 average log fold-change cutoff. * indicates genes that are DEGs of more than one cluster.
Figure 1—figure supplement 1
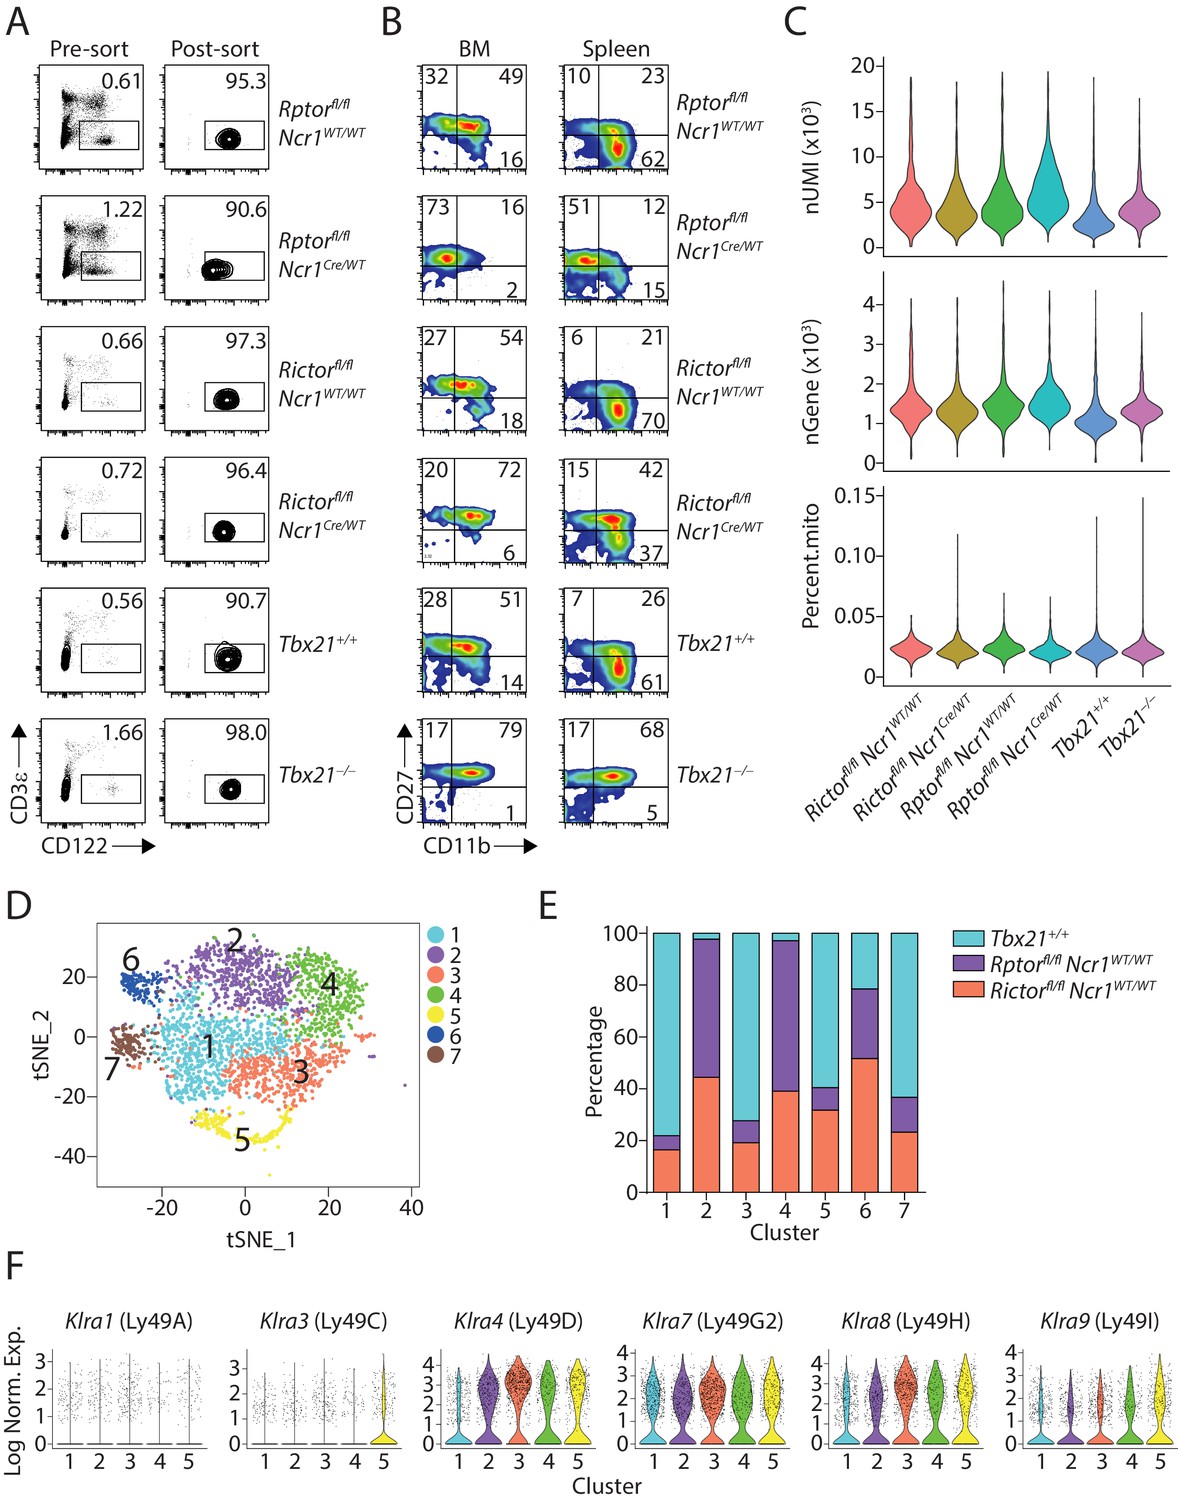
scRNA-seq analysis of CD3ε−CD122+ murine BM cells from three mutant mice and their corresponding WT mice.
(A) Post-sort purity of the six samples that went through the scRNA-seq experiment. (B) The expression of CD27 and CD11b on NK cells (gated on CD3ε−NK1.1+) from BM and spleen of the six mice used in the scRNA-seq experiment. (C) nUMI, nGene and percentage of mitochondria genes in the transcriptome (percent.mito) of all cells from six samples were shown in Violin plots. (D) Seven clusters generated from the unbiased clustering analysis of NK cells from three WT mice without scaling the sample origin. (E) The composition of the three WT mice within each cluster. The input cell number from each mouse was normalized to be equal. (F) Violin plots demonstrate the expression of six Ly49 family members in each NK cluster from Figure 1C. The y-axis represents log-normalized expression value.
Figure 1—figure supplement 2
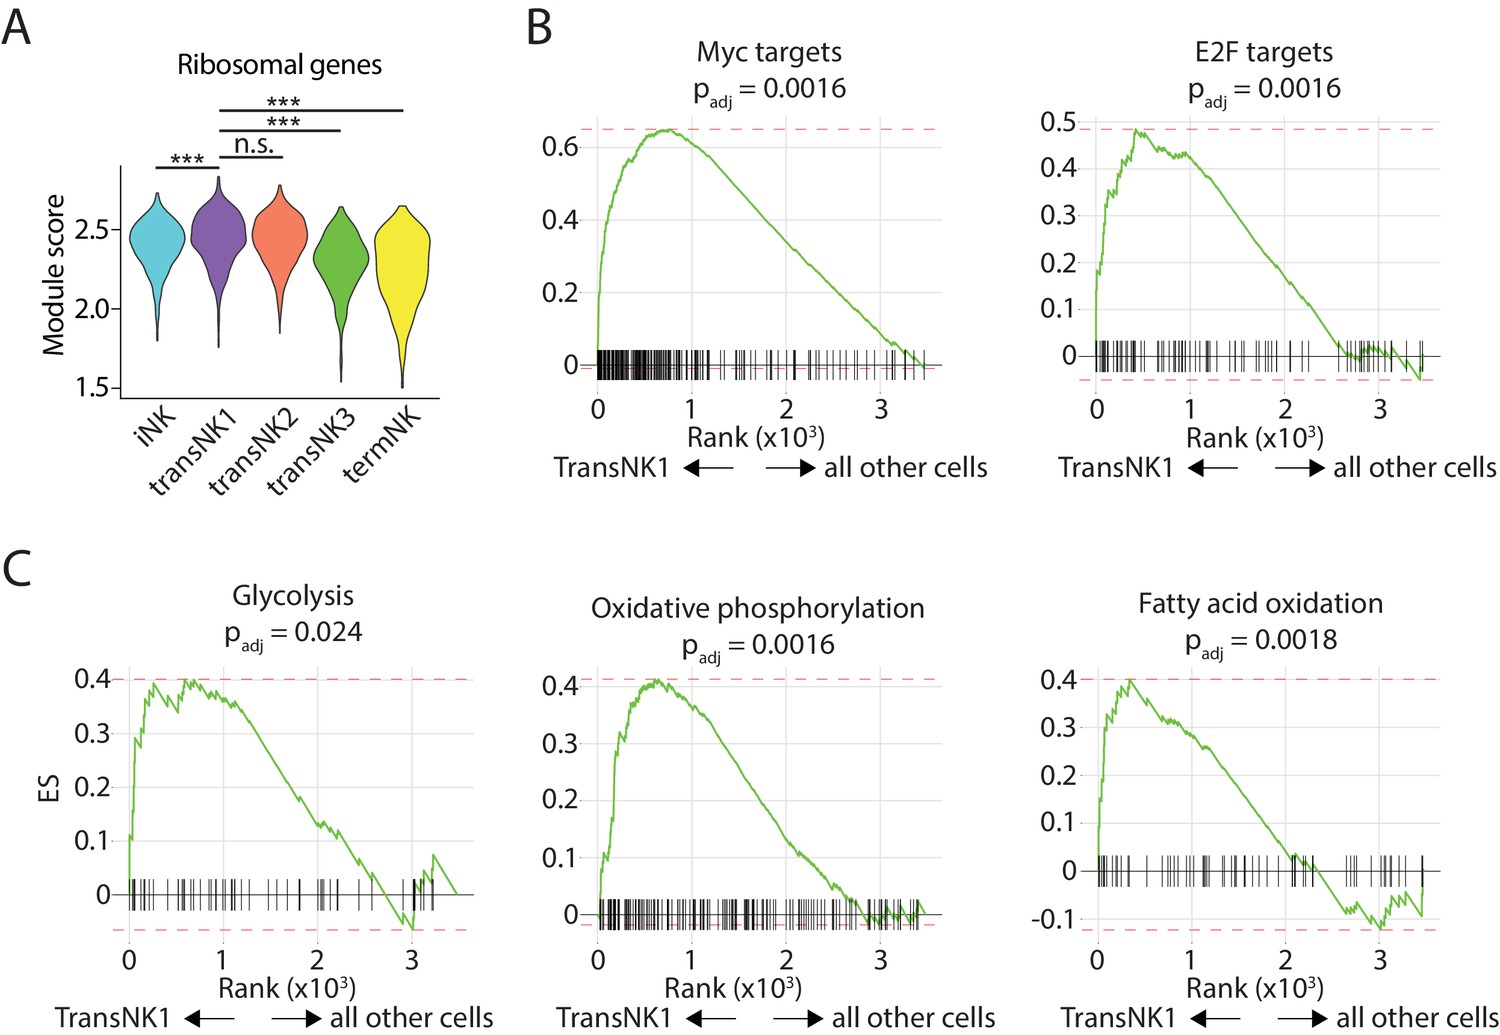
Unique features associated with tranNK1 cluster.
(A) Module scores were calculated using all the genes encoding ribosomal subunits and plotted via violin plots. Statistical analysis was conducted using Two-way ANOVA followed by Tukey Honest Significant test. ***p<0.0001 (B, C) Significant enrichment of MYC, E2F (B) and metabolic pathways (C) in the tranNK1 cluster compared to all other cells.
Figure 2
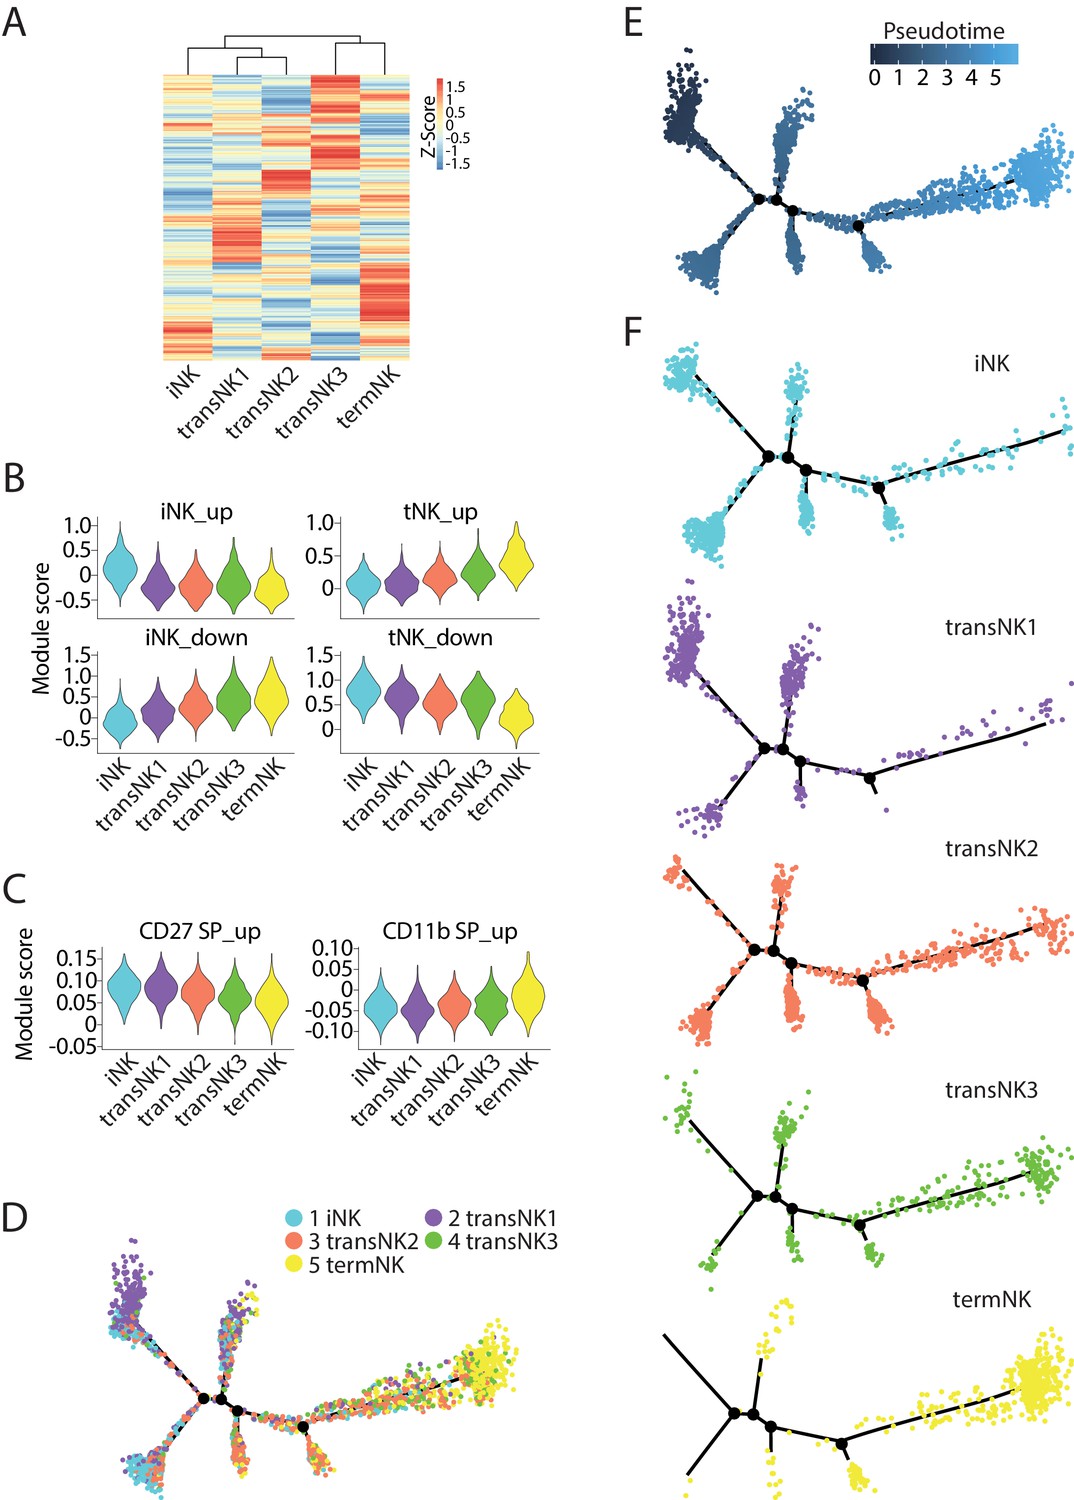
The relative maturity of the five distinct NK clusters.
(A) The transcriptome similarity among the five NK clusters was evaluated by the hierarchical clustering analysis and visualized via heatmap. Each row represents one of the highly variable genes across all cells and each column represents the average expression of these genes within one cluster. (B) Module scores were calculated using up-regulated or down-regulated DEGs of iNK and termNK clusters and plotted via violin plots. (C) The up-regulated genes in the CD27 SP and CD11b SP subset were extracted from the CD27/CD11b bulk RNA-seq dataset. The expression level of these genes in the five NK clusters were evaluated via calculating module scores and plotted via violin plots. (D) Distribution of all five NK clusters along the pseudotime trajectory. (E) The relative maturity of the developmental trajectory displayed across pseudotime. (F) Distribution of each NK clusters along the pseudotime trajectory.
Figure 3 with 1 supplement
scRNA-seq analysis of Raptor- or Rictor-deficient NK cells.
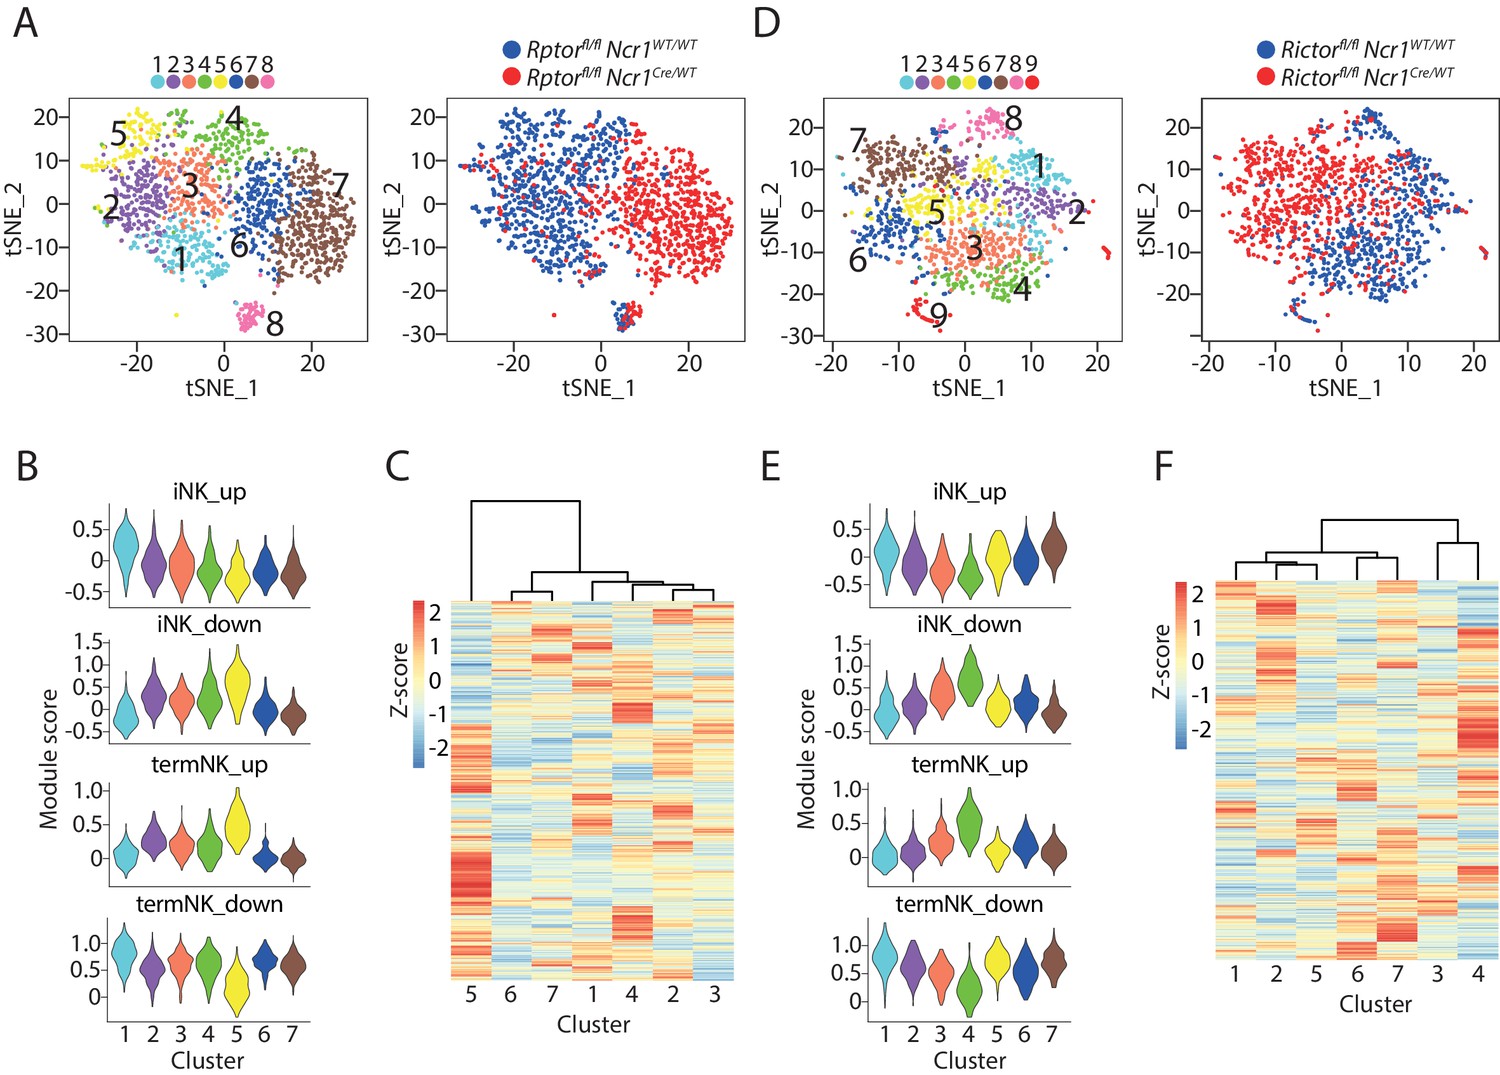
(A) Clustering analysis of CD3ε−CD122+ cells from BM of Raptor cKO mouse and the littermate WT mouse. The clusters are displayed as tSNE plots on the left. The cell origin was labeled in the same tSNE plot on the right. (B) Module scores were calculated using up-regulated or down-regulated DEGs of iNK and termNK clusters and plotted in all the NK clusters formed by WT and Raptor-deficient cells. (C) The transcriptome similarity among the NK clusters formed by WT and Raptor-deficient cells was evaluated by the hierarchical clustering analysis and visualized via heatmap. (D–F) (D), (E) and (F) are same analysis using WT and Rictor-deficient NK cells as (A), (B), and (C), respectively.
Figure 3—figure supplement 1

Unbiased clustering analysis of Raptor- or Rictor-deficient NK cells.
(A) The composition of the WT and Raptor-deficient cells within each cluster. The input cell number from each mouse was normalized to be equal. (B) A list of genes defining NK, ILC1, Cd3high, cycling, and inflamed cells was used to evaluate the identity of each cluster formed by WT and Raptor-deficient cells. (C) The expression level of CD27 SP and CD11b SP subset signature genes in the NK clusters formed by WT and Raptor-deficient cells were evaluated via calculating module scores and plotted via violin plots. (D–F) (D), (E) and (F) are same analysis using WT and Rictor-deficient NK cells as (A), (B), and (C), respectively.
Figure 4 with 1 supplement
The identity of the Raptor- or Rictor-deficient NK cells defined by machine-learning classifiers.
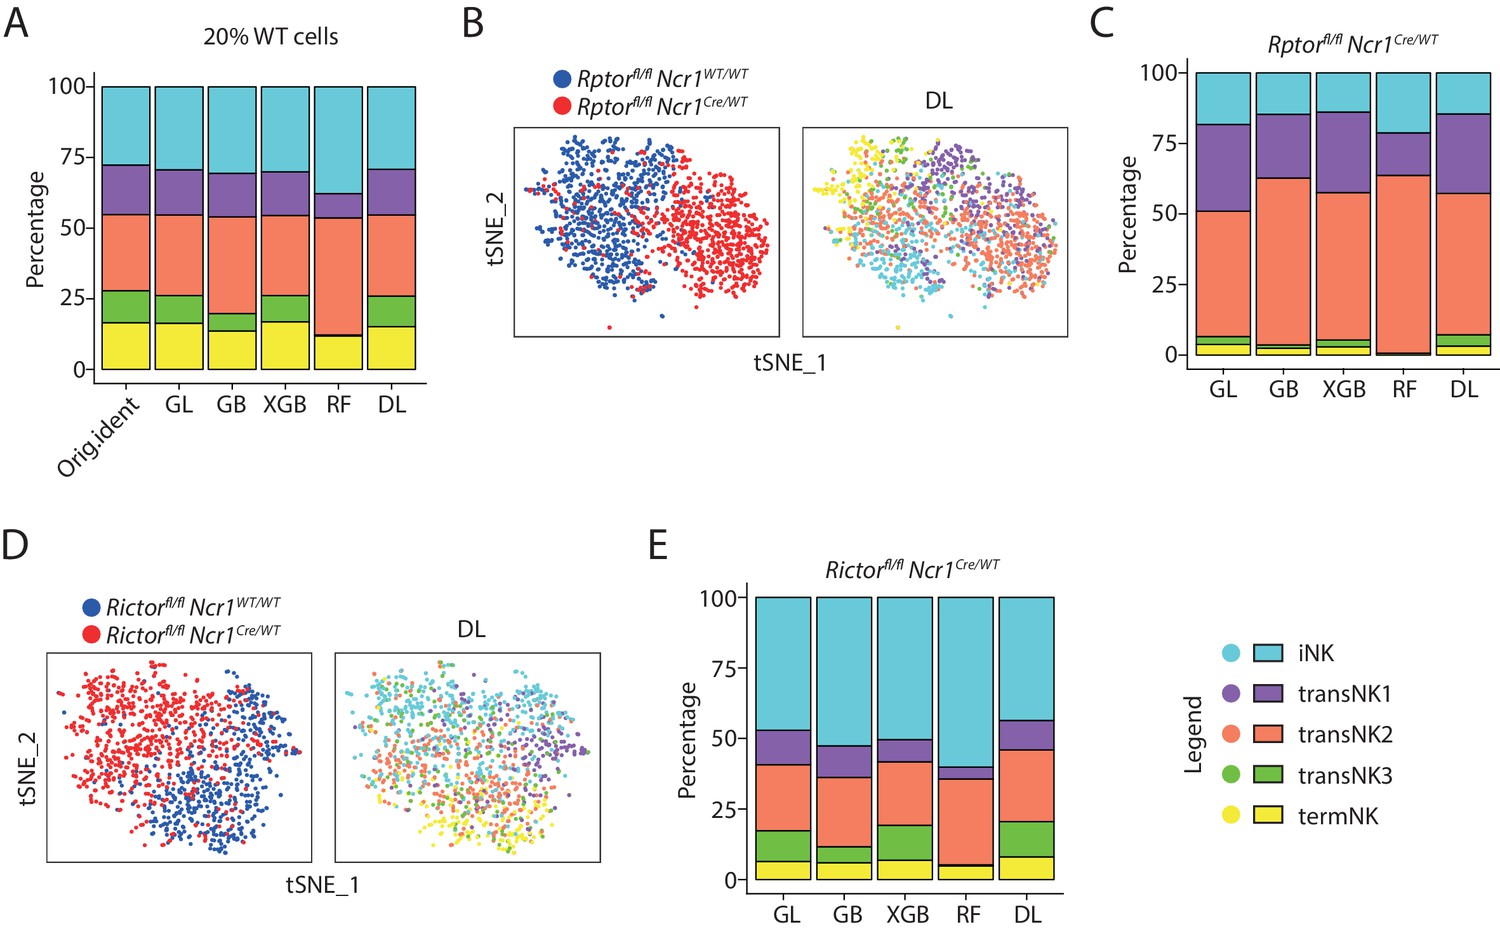
(A) The original composition of the five NK clusters in the 20% WT testing cells (referred as ‘Orig.ident’) along with the composition determined by the machine-learning classifiers were plotted in the bar graph. GL, GB, XGBoost, RF, and DL represents generalized linear classifier, gradient boosting classifier, extreme gradient boosting classifier, random forest classifier, and deep learning classifier, respectively. (B) The identity of each WT and Raptor-deficient NK cells were assigned by the deep learning classifier as shown in the tSNE plots. (C) The composition of the five NK clusters in Raptor-deficient NK cells determined by the machine-learning classifiers. (D, E) (D) and (E) are same analysis using WT and Rictor-deficient NK cells as (B) and (C), respectively.
Figure 4—figure supplement 1
The accuracy of the five machine-learning classifiers.
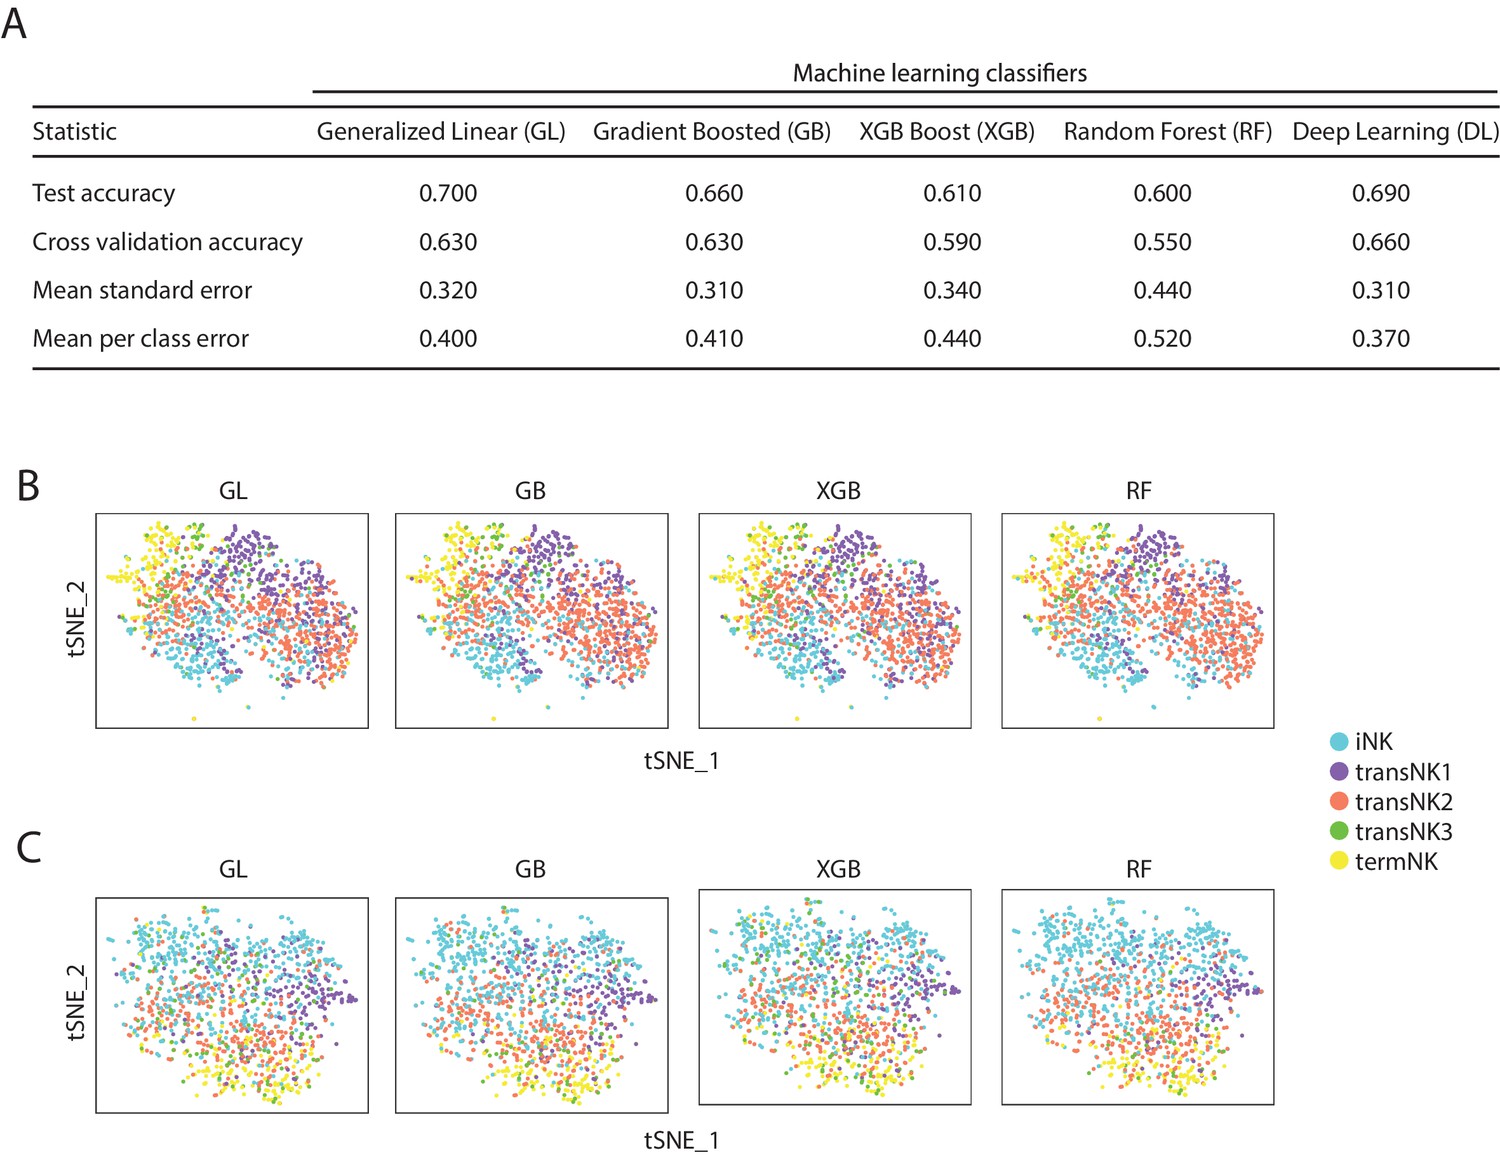
(A) A table summarizing the accuracy and error rates of the five distinct machine-learning classifiers. (B, C) The identity of each Raptor-deficient NK cells (B) or Rictor-deficient NK cells (C) and their corresponding WT cells were assigned by distinct classifiers as shown in the tSNE plots. GL, GB, XGBoost, and RF represents generalized linear classifier, gradient boosting classifier, extreme gradient boosting classifier, and random forest classifier, respectively.
Figure 5 with 2 supplements
scRNA-seq analysis of T-bet-deficient NK cells.
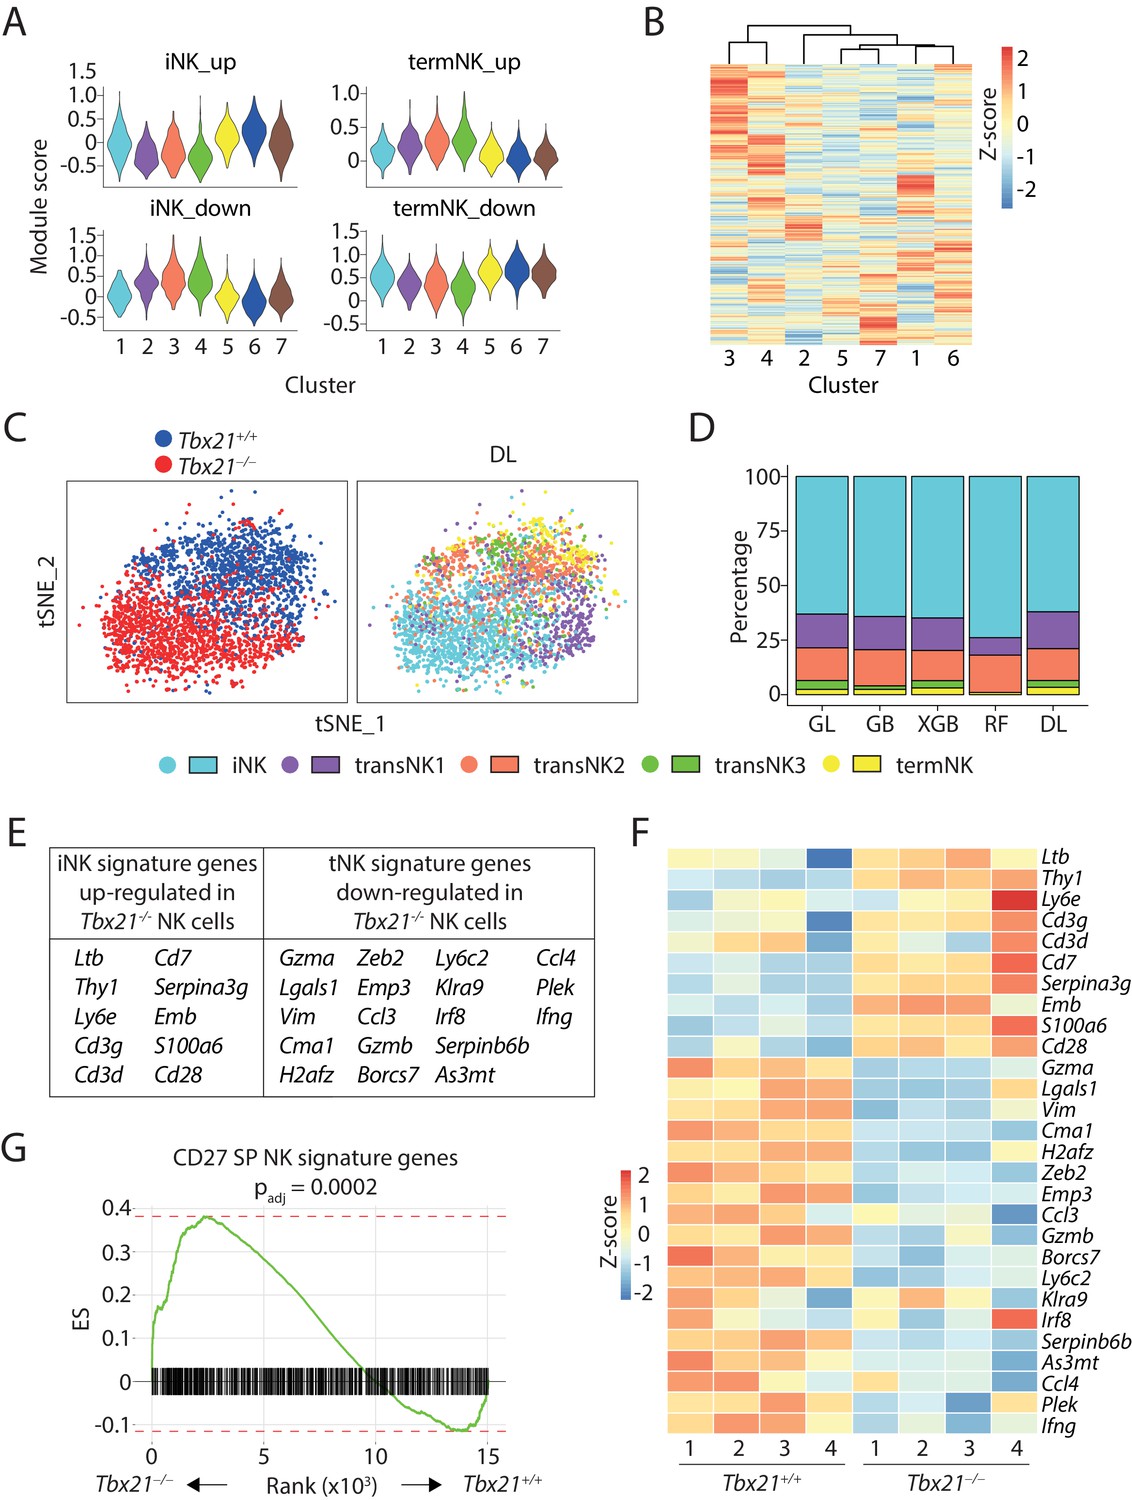
(A) Module scores were calculated using up-regulated or down-regulated DEGs of iNK and termNK clusters and plotted in all the NK clusters formed by WT and T-bet-deficient cells. (B) The transcriptome similarity among the NK clusters formed by WT and T-bet-deficient cells was evaluated by the hierarchical clustering analysis and visualized via heatmap. (C) The identity of each WT and T-bet-deficient NK cells were assigned by the deep learning (DL) classifier as shown in the tSNE plot. (D) The composition of the five NK clusters in T-bet-deficient NK cells determined by the machine-learning classifiers. GL, GB, XGBoost, RF, and DL represents generalized linear classifier, gradient boosting classifier, extreme gradient boosting classifier, random forest classifier, and deep learning classifier, respectively. (E) With a minimum of 0.25 average log fold-change threshold, the iNK signature genes that were significantly up-regulated and the termNK signature genes that were significantly down-regulated in T-bet-deficient NK cells compared to WT NK cells were listed in the table. (F) The expression level of genes listed in (E) was further validated in the bulk RNA-seq analysis of the CD27+ WT and T-bet-deficient NK cells and shown in the heatmap. (G) The enrichment of CD27 SP NK subset signature genes in the T-bet-deficient NK cells compared to the WT NK cells.
Figure 5—figure supplement 1
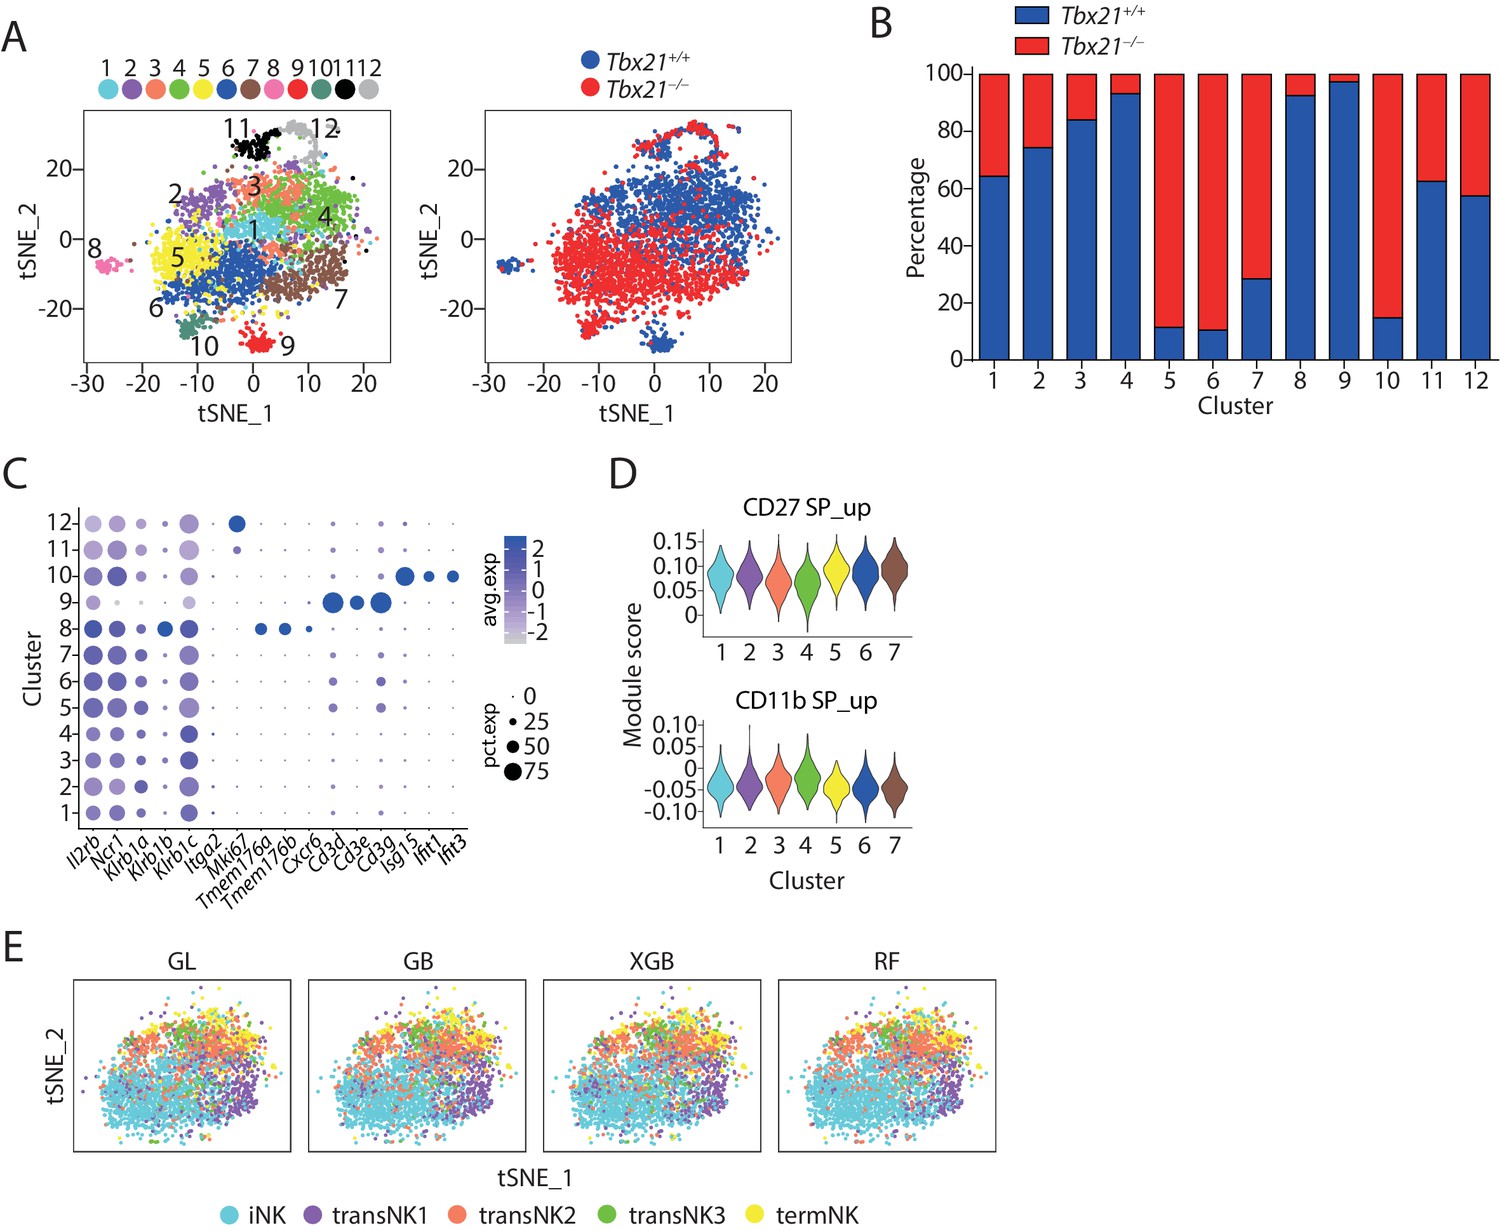
Unbiased clustering analysis of CD3ε−CD122+ cells from BM of the Tbx21 KO mouse.
(A) Clustering analysis of CD3ε−CD122+ cells from BM of the Tbx21 KO mouse and the WT mouse. The clusters are displayed as tSNE plots on the left. The cell origin was labeled in the same tSNE plot on the right. (B) The composition of the WT and T-bet-deficient cells within each cluster. The input cell number from each mouse was normalized to be equal. (C) A list of genes defining NK, ILC1, Cd3high, cycling, and inflamed cells were used to evaluate the identity of each cluster formed by WT and T-bet-deficient cells. (D) The expression level of CD27 SP and CD11b SP subset signature genes in the NK clusters formed by WT and T-bet-deficient cells were evaluated via calculating module scores and plotted via violin plots. (E) The identity of each WT and T-bet-deficient NK cells were assigned by distinct classifiers as shown in the tSNE plots. GL, GB, XGBoost, and RF represents generalized linear classifier, gradient boosting classifier, extreme gradient boosting classifier, and random forest classifier, respectively.
Figure 5—figure supplement 2
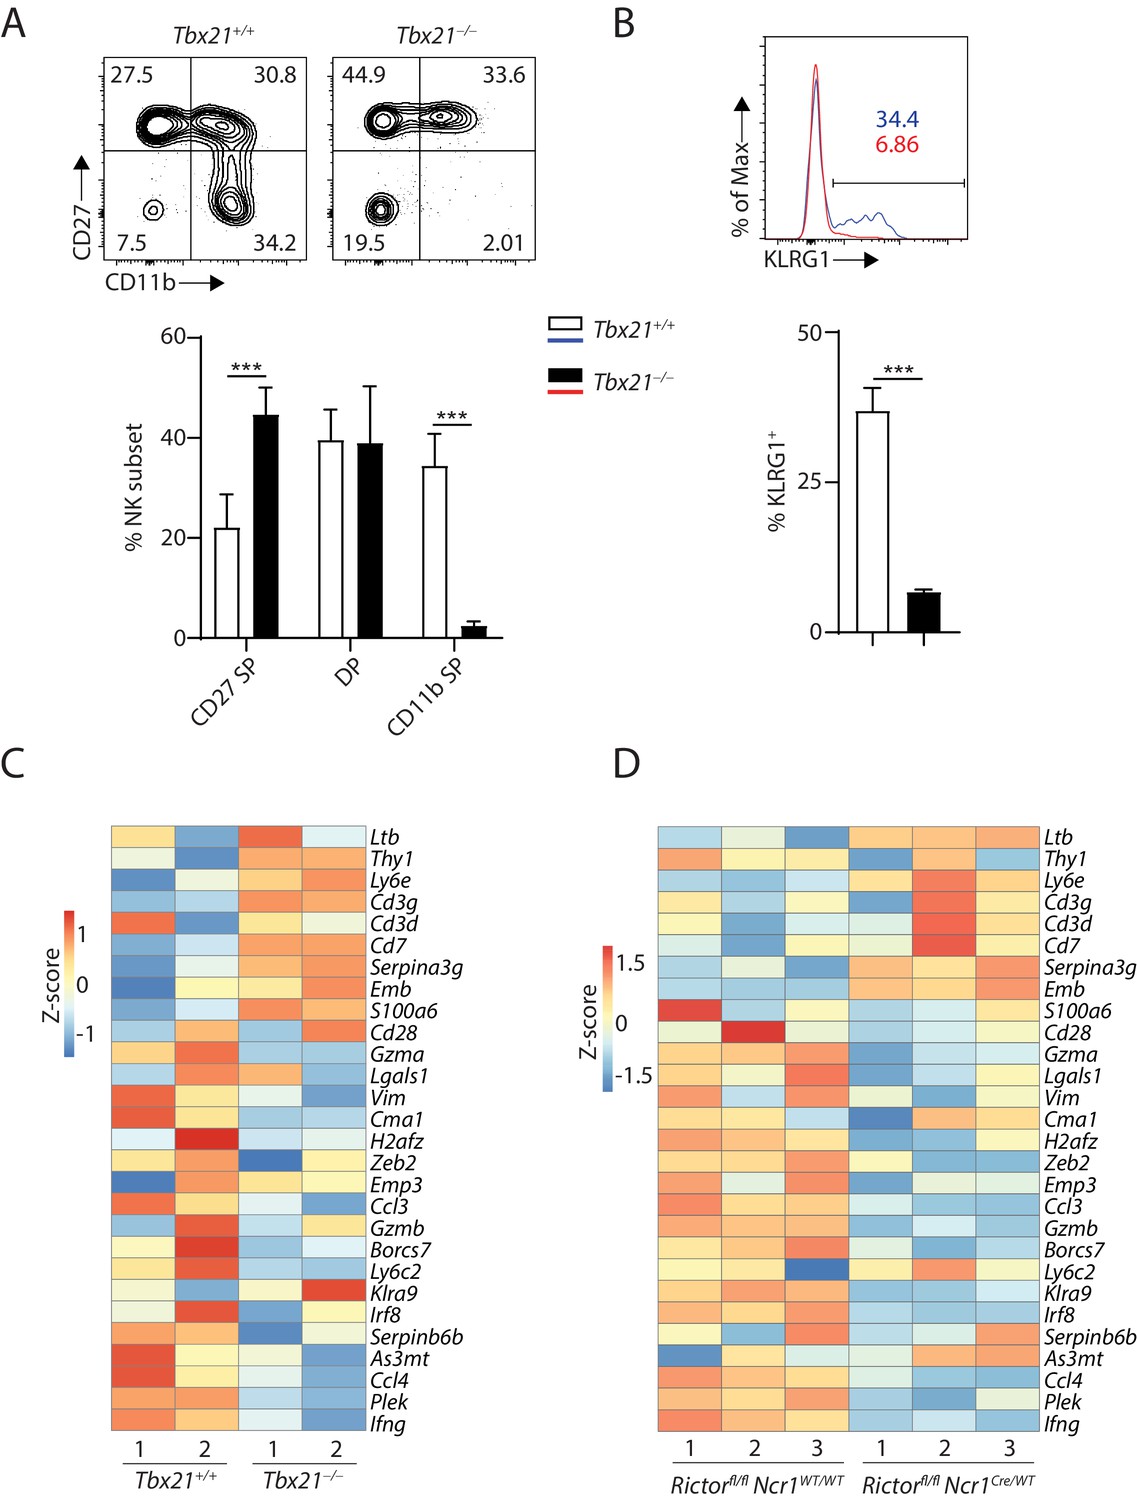
Up-regulation of immature NK genes is intrinsic due to the loss of T-bet.
Mixed BM chimera experiment was conducted using BM cells from CD45.1+ WT mice and CD45.2+ Tbx21−/− mice and CD45.2+Rag1−/−Il2rg−/− as recipient mice. (A, B) Phenotypical analysis of CD27/CD11b (A) and KLRG1 (B) on splenic NK cells from recipient mice eight weeks after donor cell injection. n = 5 (C) The expression level of genes listed in Figure 5E was evaluated in the bulk RNA-seq analysis of the CD27+ WT and T-bet-deficient NK cells sorted from BM of recipient mice. Cells derived from the same donor were pooled. (D) The expression level of genes listed in Figure 5E was evaluated in the bulk RNA-seq analysis of the CD27+ WT and Rictor-deficient NK cells and shown in the heatmap. Statistical significance was calculated using Two-way ANOVA (A) or unpaired Student t.test (B). *p < 005; **p < 0.01; ***p < 0.001.
Figure 6 with 1 supplement
Exploration of the mechanisms underline the suppressive role of T-bet in regulating the immature NK transcriptional signature.
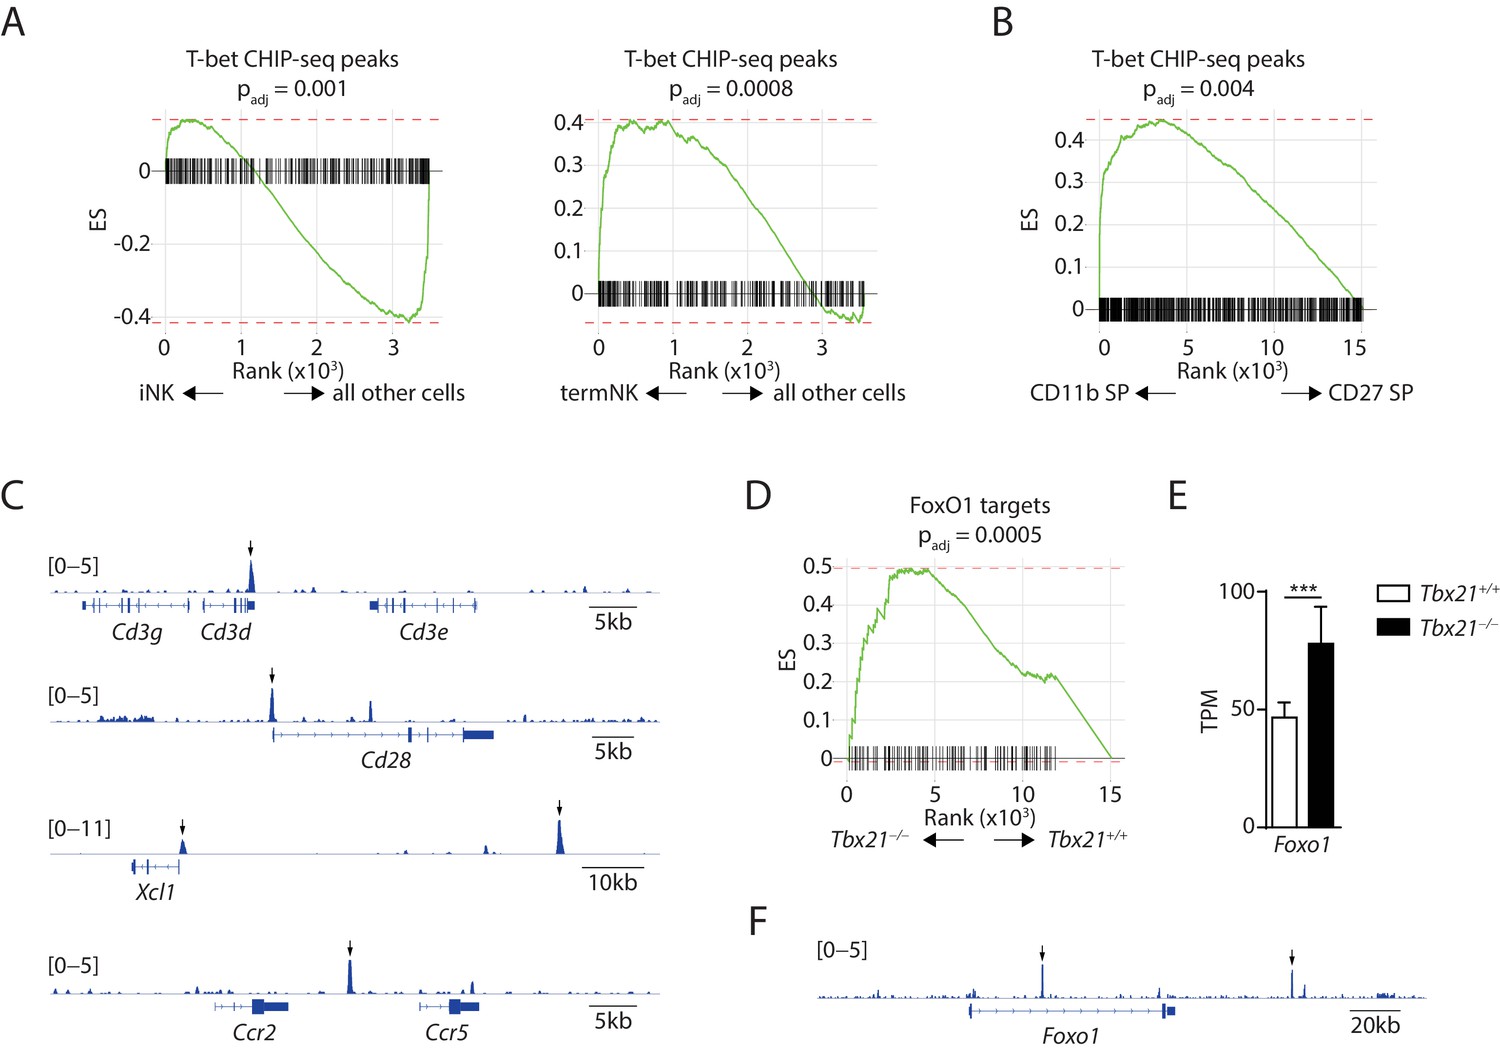
(A) Depletion of the T-bet ChIP-seq peaks in the iNK cluster compared to all other cells (left) and enrichment of the T-bet ChIP-seq peaks in the termNK cluster compared to all other cells (right). (B) The T-bet ChIP-seq peaks were significantly enriched in the CD11b SP NK subset compared to the CD27 SP NK subset. (C) Examples of immature NK genes up-regulated in T-bet-deficient NK cells with significant binding of T-bet in the regulatory elements. Arrows point the significantly enriched peaks. (D) Enrichment of transcription factor FoxO1 in the T-bet-deficient NK cells compared to the WT NK cells. (E) The transcripts level of Foxo1 in the CD27+ WT and T-bet-deficient NK cells. TPM stands for transcripts per million. (F) Significant enrichment of T-bet ChIP-seq peaks at the regulatory elements associated with the Foxo1 locus. Arrows point the significantly enriched peaks.
Figure 6—figure supplement 1
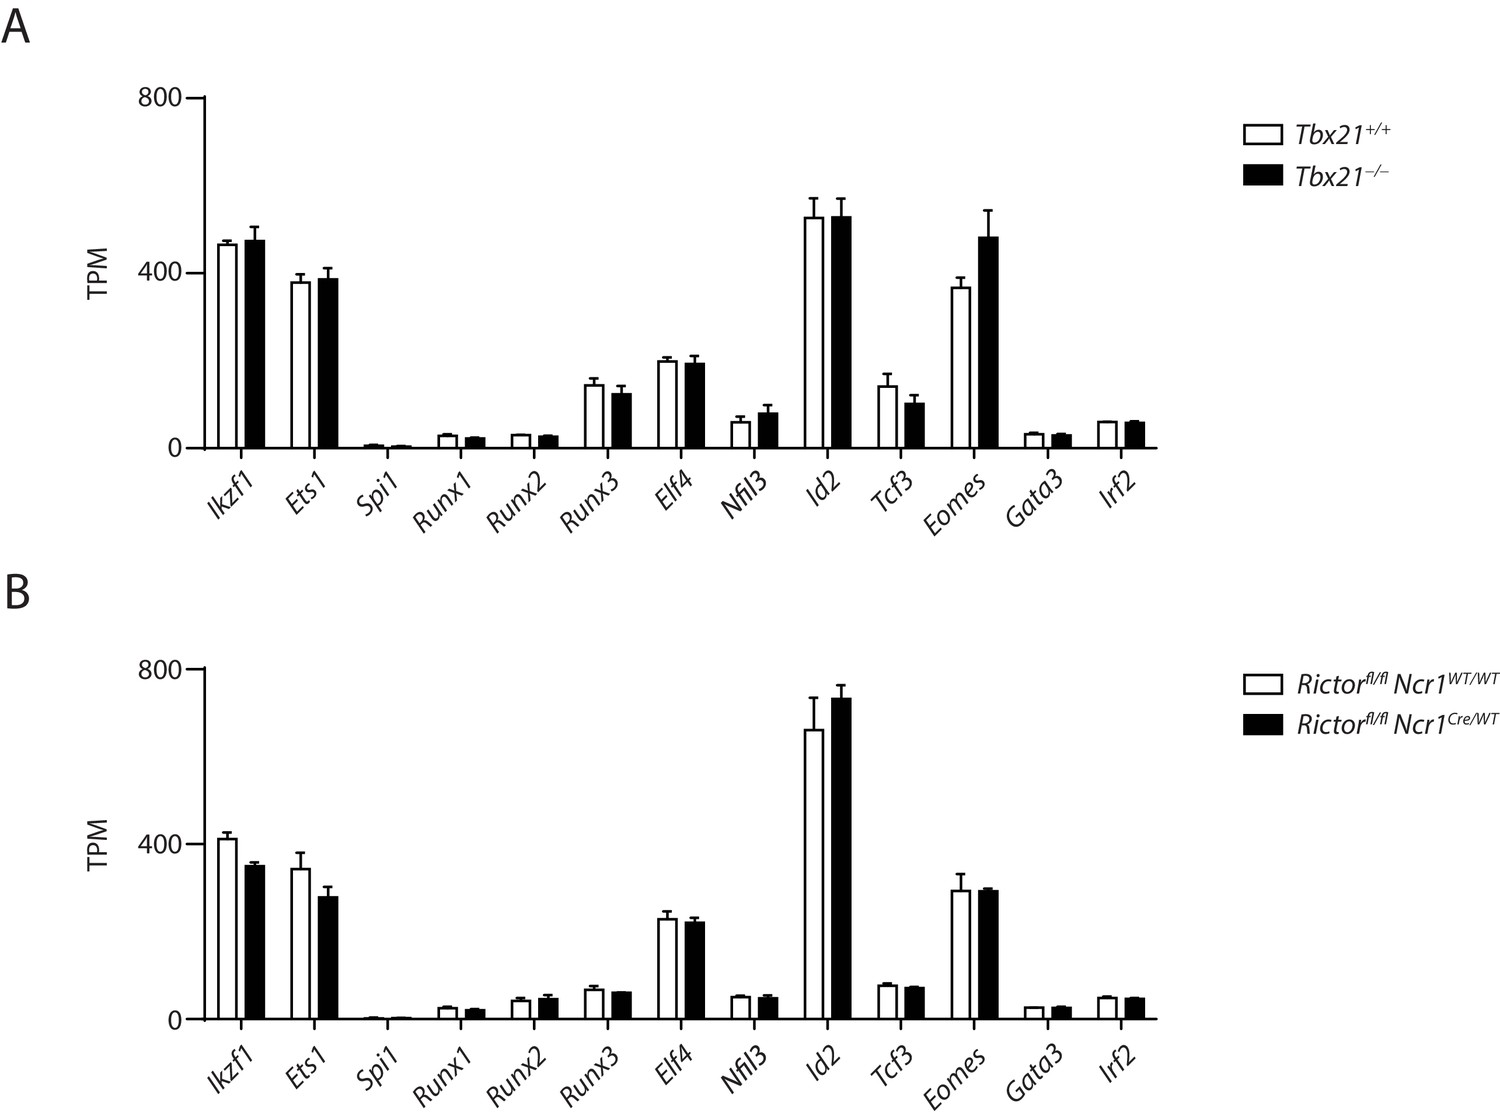
T-bet- or Rictor-deficiency does not result in large alteration in the expression of known transcription factors critical for the development of NK cells.
(A, B) The mRNA level of transcription factors essential for NK cell development in the CD27+ T-bet- (A) or Rictor-deficient (B) NK cells and their corresponding WT control. TPM stands for transcripts per million.
Figure 7 with 1 supplement
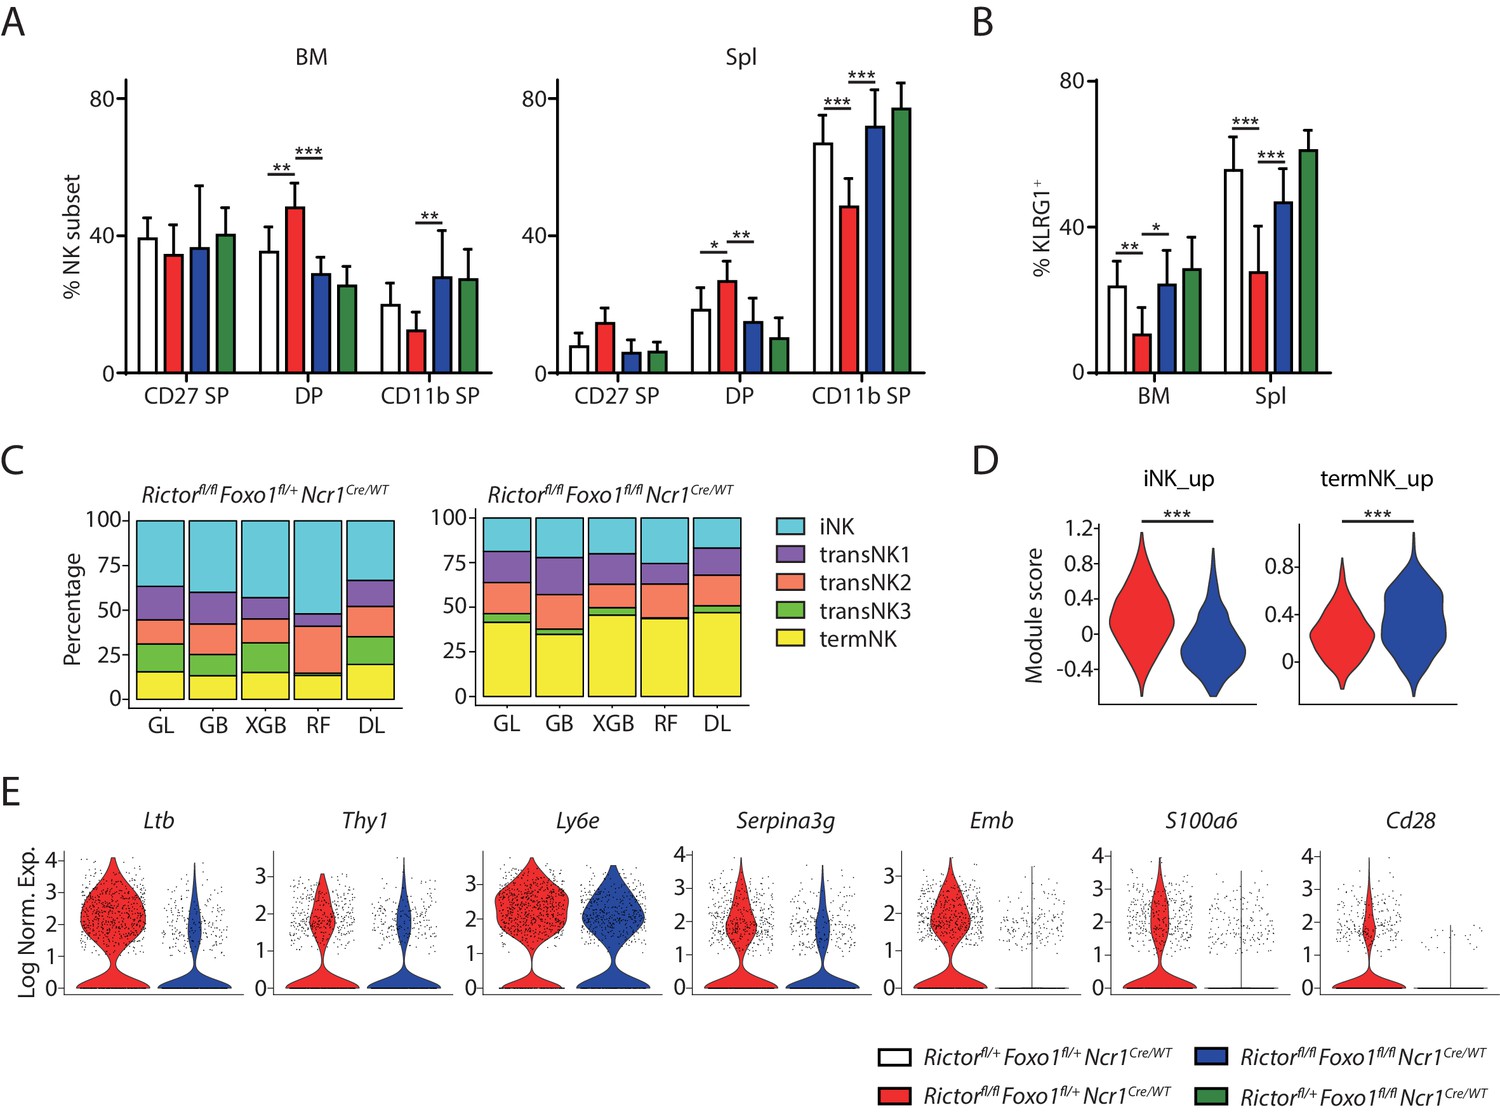
Deletion of Foxo1 rescues the developmental defects in Rictor-deficient NK cells.
(A) Quantification of each NK subsets defined by the expression of CD27 and CD11b in BM and spleen of the four group mice (gated on CD3ε−NCR1+). n ≥ 6, pooled from six independent experiments. (B) Quantification of the percentage KLRG1+ NK cells in the four group mice (gated on CD3ε−NCR1+). n ≥ 6, pooled from six independent experiments. (C) The composition of the five NK clusters in the littermate Rictorfl/flFoxo1fl/+NcrCre/WT and Rictorfl/flFoxo1fl/flNcrCre/WT mice determined by the machine-learning classifiers. GL, GB, XGBoost, RF, and DL represents Generalized Linear classifier, Gradient Boosting classifier, extreme gradient boosting classifier, Random Forest classifier, and Deep Learning classifier, respectively. (D) The expression of iNK and termNK signature genes in NK cells from Rictorfl/flFoxo1fl/+NcrCre/WT and Rictorfl/flFoxo1fl/flNcrCre/WT mice were evaluated by module scores and plotted as violin plots. (E) The expression of several iNK signature genes in NK cells from Rictorfl/flFoxo1fl/+NcrCre/WT and Rictorfl/flFoxo1fl/flNcrCre/WT mice were demonstrated via violin plots. Statistical significance was calculated using Two-way ANOVA (A and B) or unpaired Student t.test (D). *p<005; **p<0.01; ***p<0.001.
Figure 7—figure supplement 1
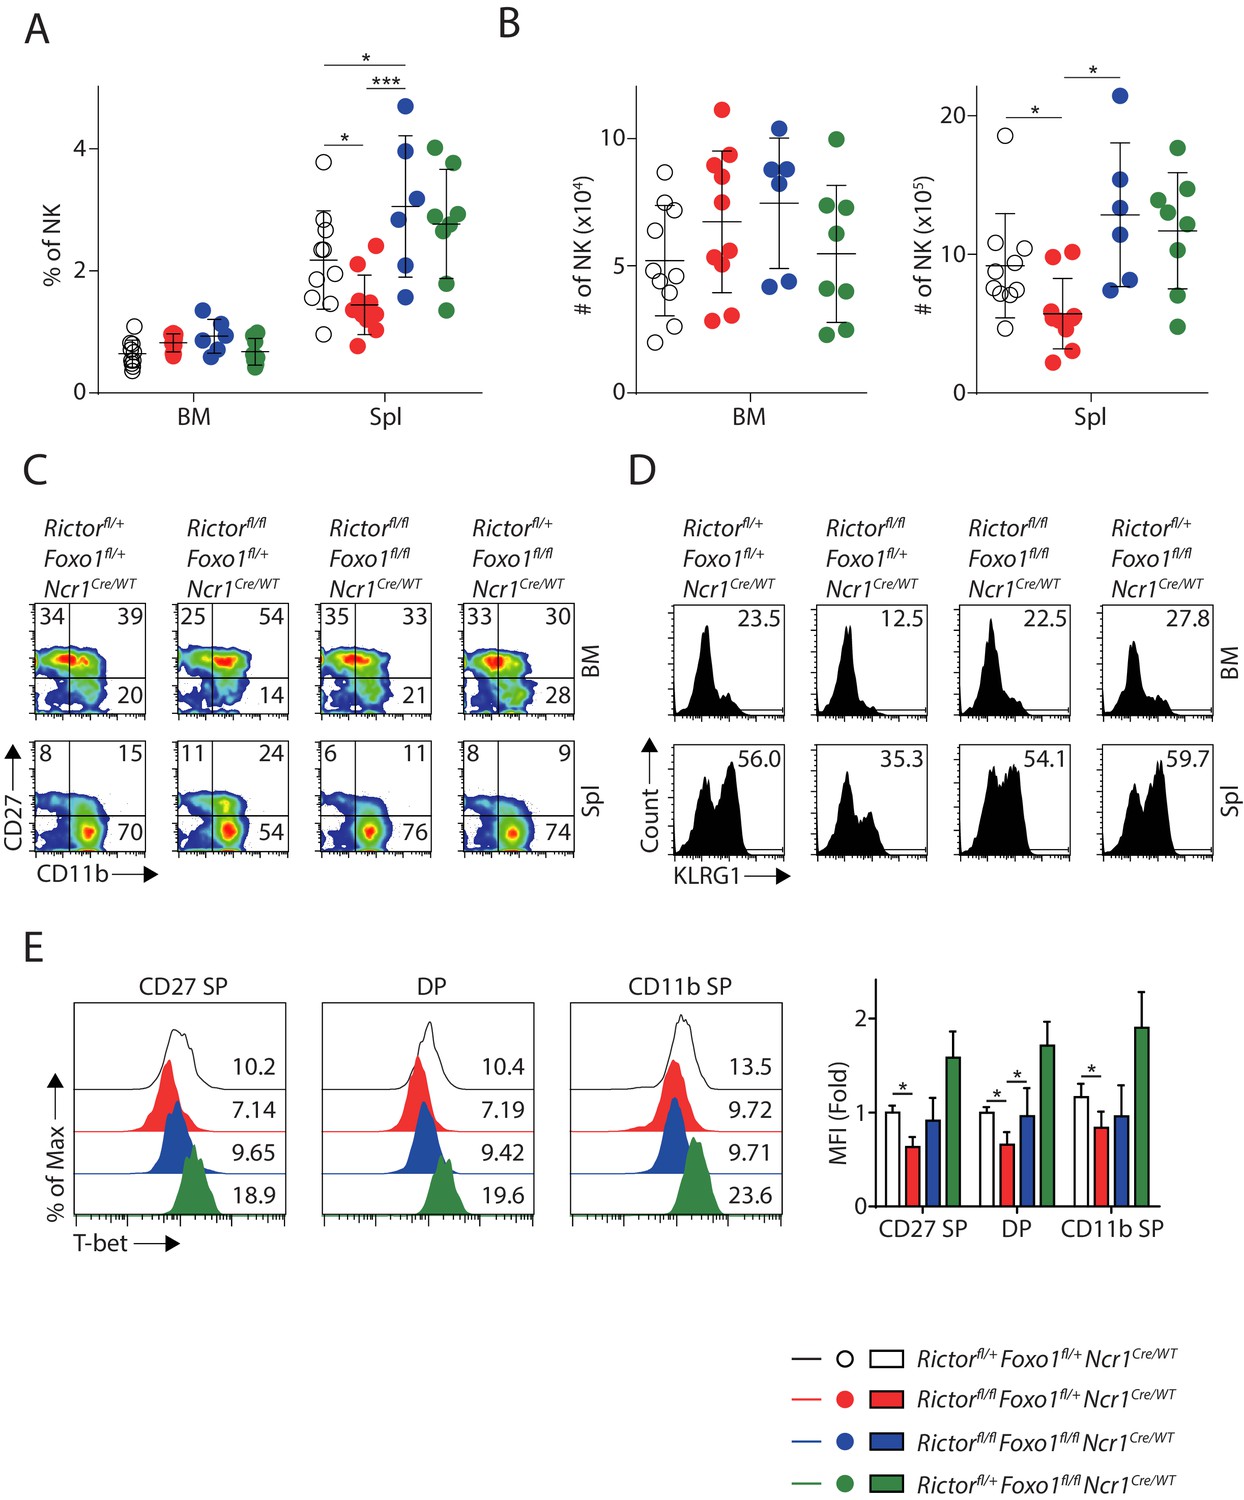
Deletion of Foxo1 rescues the NK cellularity and maturation defects in Rictor cKO mice.
(A) Quantification of the percentage of NK cells in the BM and spleen of the four group mice (gated on CD3ε−NCR1+). Pooled from eight independent experiments. (B) Quantification of the absolute number of NK cells in the BM and spleen of the four group mice (gated on CD3ε−NCR1+). Pooled from eight independent experiments. (C, D) Representative flow plots demonstrating the expression of CD27/CD11b (C) and KLRG1 (D) in the NK cells from BM and spleen of the four group mice (gated on CD3ε−NCR1+). (E) The protein level of T-bet in three NK subsets defined by the expression of CD27 and CD11b were evaluated by intracellular staining and gated on CD3ε−NCR1+ cells from spleen of the four group mice. The representative flow plots were shown on the left. The mean fluorescent intensity (MFI) of T-bet was quantified and shown as fold-change normalized to the CD27 SP population from WT control as shown on the right. n ≥ 3, pooled from three independent experiments. Statistical significance was calculated using Two-way ANOVA. The data from Rictorfl/+Foxo1fl/flNcrCre/WT mice were not included in the statistical analysis for Figure E. *p<005; **p<0.01; ***p<0.001.
Additional files
-
Supplementary file 1
DEGs of five WT NK clusters.
- https://cdn.elifesciences.org/articles/51339/elife-51339-supp1-v2.xlsx
-
Supplementary file 2
DEGs of clusters formed by WT and Raptor-deficient cells.
Related to Figure 3.
- https://cdn.elifesciences.org/articles/51339/elife-51339-supp2-v2.xlsx
-
Supplementary file 3
DEGs of clusters formed by WT and Rictor-deficient cells.
Related to Figure 3.
- https://cdn.elifesciences.org/articles/51339/elife-51339-supp3-v2.xlsx
-
Supplementary file 4
DEGs of clusters formed by WT and T-bet-deficient cells.
Related to Figure 5.
- https://cdn.elifesciences.org/articles/51339/elife-51339-supp4-v2.xlsx
-
Transparent reporting form
- https://cdn.elifesciences.org/articles/51339/elife-51339-transrepform-v2.pdf
Download links
A two-part list of links to download the article, or parts of the article, in various formats.
Downloads (link to download the article as PDF)
Open citations (links to open the citations from this article in various online reference manager services)
Cite this article (links to download the citations from this article in formats compatible with various reference manager tools)
Single-cell transcriptome reveals the novel role of T-bet in suppressing the immature NK gene signature
eLife 9:e51339.
https://doi.org/10.7554/eLife.51339


