Insights into the dynamic control of breathing revealed through cell-type-specific responses to substance P
- Seattle Children’s Research Institute, United States
- University of Washington School of Medicine, United States
Figures
Figure 1
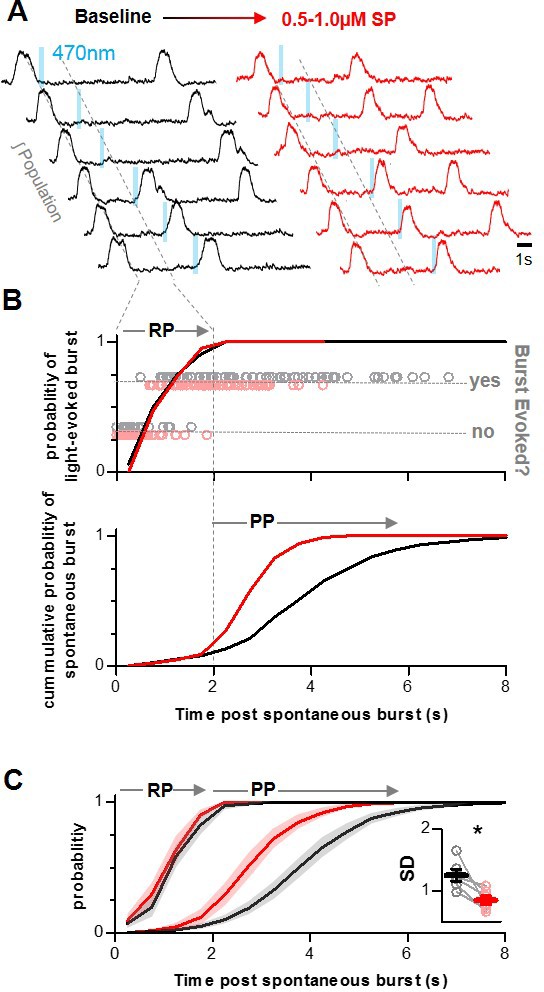
Differential modulation of the refractory phase (RP) and recurrent excitation or percolation phase (PP) of the inspiratory rhythm by SP.
(A) Representative integrated preBötC population recordings from a Dbx1CreERT2;Rosa26ChR2-EYFP horizontal slice during photostimulation of Dbx1 neurons under baseline conditions (black) and in SP (red). (B) Quantified data from the experiment in A showing time-dependent changes in the probabilities of evoking a burst (top) and of a spontaneous burst occurring (bottom). (C) Group data from n = 6 experiments. Spontaneous and evoked probability curves were compared under baseline conditions and in SP using non-linear regression analysis. Inset shows the standard deviation (SD) of the inter-burst intervals under baseline conditions and in SP (paired, two tailed t-test). Data available in Figure 1—source data 1.
-
Figure 1—source data 1
Differential modulation of therefractory phase(RP) and recurrent excitation orpercolation phase(PP) of the inspiratory rhythm by SP.
- https://cdn.elifesciences.org/articles/51350/elife-51350-fig1-data1-v2.xlsx
Figure 2 with 2 supplements
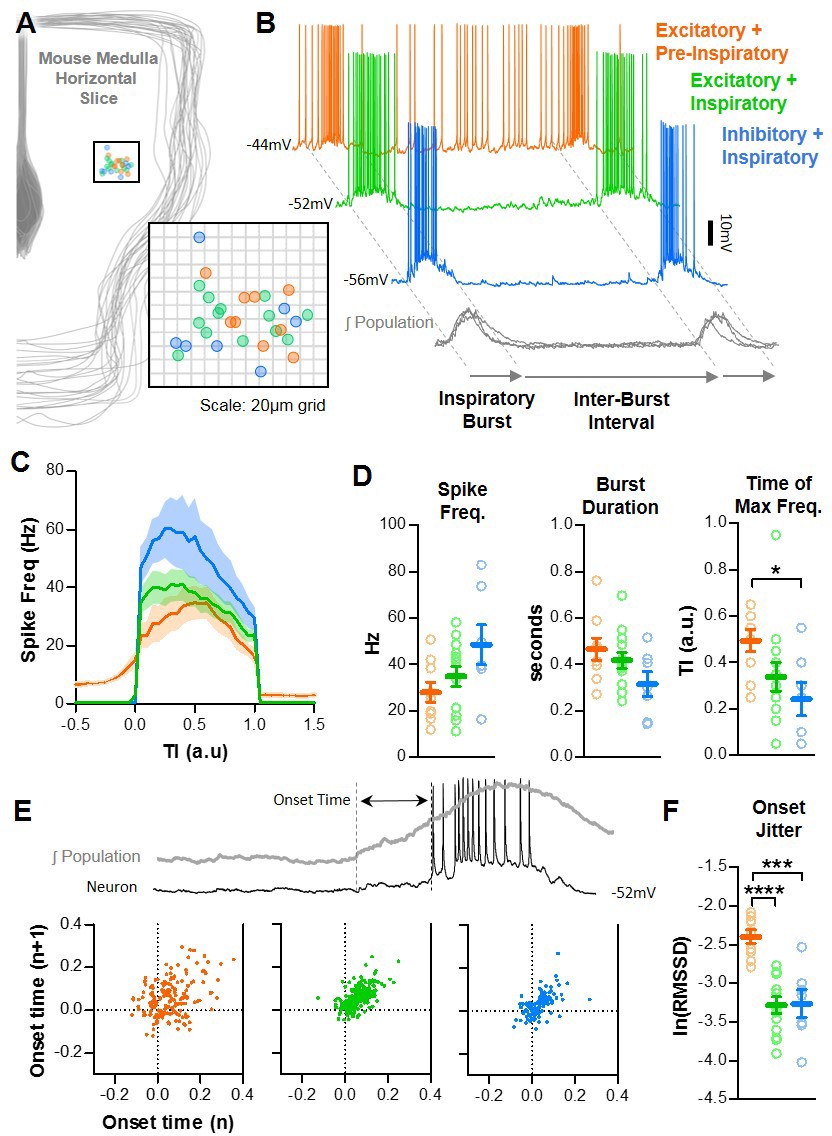
Baseline spiking patterns of excitatory and inhibitory neurons in the preBötC.
(A) Anatomical locations of n = 29 recorded preBötC neurons. (B) Example traces of an excitatory neuron with pre-I spiking (orange) and without pre-I spiking (green) and an inhibitory neuron (blue) during the inspiratory burst and inter-burst interval (IBI). (C) Quantified spike frequency as a function of time (normalized to burst duration) from n = 9 pre-I excitatory, n = 13 non pre-I excitatory, and n = 7 inhibitory neurons. (D) Quantified mean spike frequency, duration, and shape of inspiratory bursts generated by each type of neuron (one-way ANOVA with Bonferroni post hoc tests). (E) Example quantification of neuronal burst onset time relative to the preBötC population and Poincaré plots showing onset time variability from n = 9 pre-I excitatory, n = 13 non pre-I excitatory, and n = 7 inhibitory neurons (20 inspiratory bursts/neuron). (F) Burst onset time variability or ‘jitter’ quantified as the natural log of the root mean square of successive differences (one-way ANOVA with Bonferroni post hoc tests). Data available in Figure 2—source data 1.
-
Figure 2—source data 1
Baseline spiking patterns of excitatory and inhibitory neurons in the preBötC.
- https://cdn.elifesciences.org/articles/51350/elife-51350-fig2-data1-v2.xlsx
Figure 2—figure supplement 1
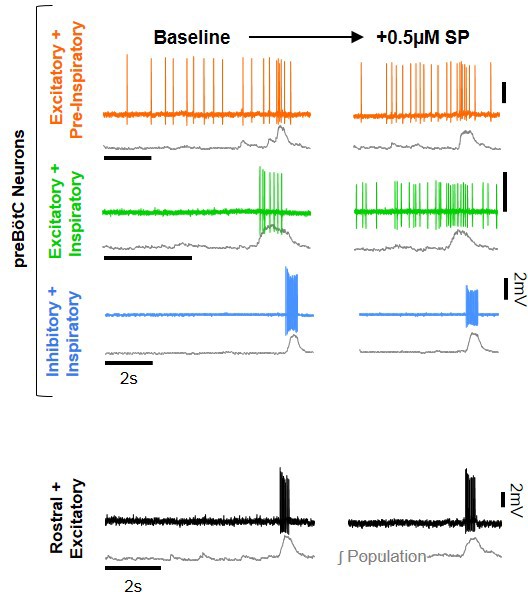
Representative cell-attached recordings under baseline condition and in SP.
Integrated preBötC population is show below each recording in gray. All vertical scale bars = 2 mV, and all horizontal scale bars = 2 s.
Figure 2—figure supplement 2
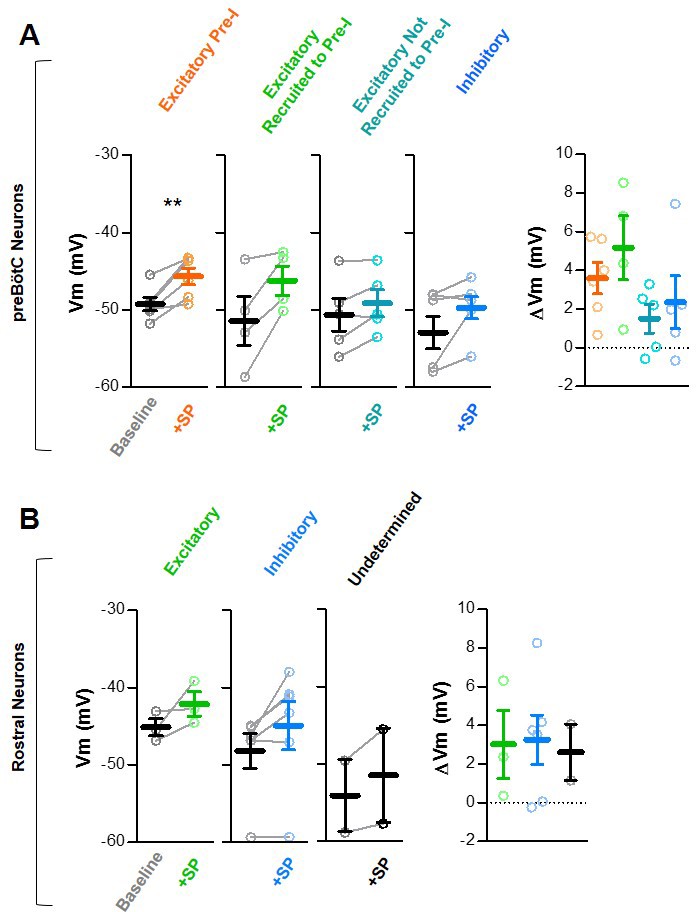
Membrane potentials (Vm) at baseline and after SP.
(A) Membrane potentials of excitatory pre-I (n = 6), excitatory recruited to pre-I (n = 4), excitatory not recruited to pre-I (n = 7), and inhibitory (n = 5) preBötC inspiratory neurons (paired, two tailed t-tests). Changes in Vm elicited by SP are shown on the right (One-way ANOVA). (B) Membrane potentials of excitatory (n = 3), inhibitory (n = 6), and undetermined (n = 2) rostral inspiratory neurons (paired, two tailed t-tests). Changes in Vm elicited by SP are shown on the right (one-way ANOVA).
Figure 3
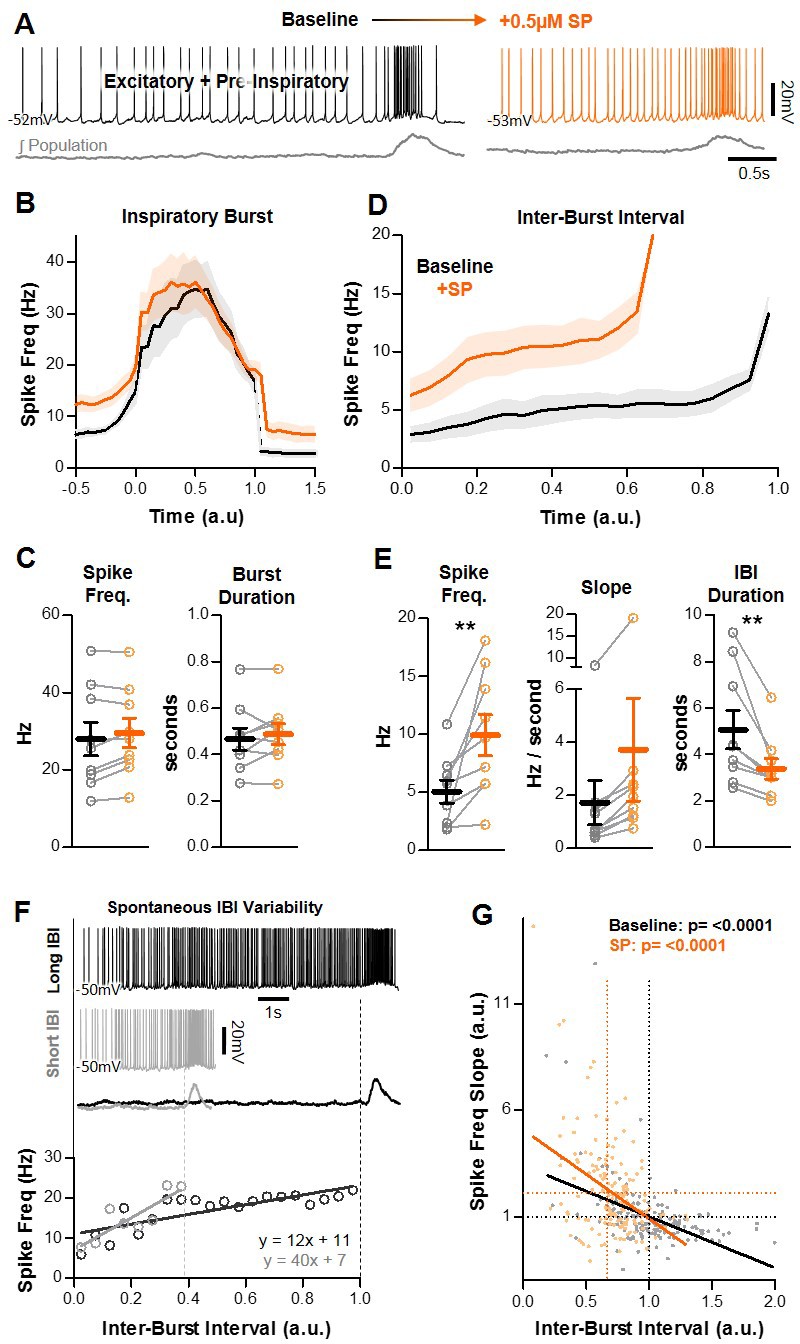
Effects of SP on pre-I excitatory neurons in the preBötC.
(A) Example intracellular recording from a pre-I neuron at baseline (black) and in SP (orange) with corresponding integrated preBötC population activity (gray). (B) Quantified spike frequency as a function of time (normalized to inspiratory burst duration) in n = 9 pre-I neurons. (C) Mean spike frequency and burst duration of pre-I neurons (paired, two tailed t-tests). (D) Quantified spike frequency vs. time (normalized to IBI duration) during the inter-burst interval showing changes in pre-inspiratory ramp activity induced by SP. (E) Mean spike frequency, pre-inspiratory ramp slope, and IBI duration (paired, two tailed t-tests). (F) Example spiking of a pre-I neuron during a long (black) and short (gray) inter-burst interval under baseline conditions (top), and quantified pre-inspiratory slope during each IBI (below). (G) Inverse relationship between the slope of pre-inspiratory spiking and the length of the IBI from n = 9 pre-I neurons (20 consecutive IBIs/neuron) at baseline and in SP (parameters normalized to baseline values) (linear regression analysis). Data available in Figure 3—source data 1.
-
Figure 3—source data 1
Effects of SP on pre-I excitatory neurons in the preBötC.
- https://cdn.elifesciences.org/articles/51350/elife-51350-fig3-data1-v2.xlsx
Figure 4
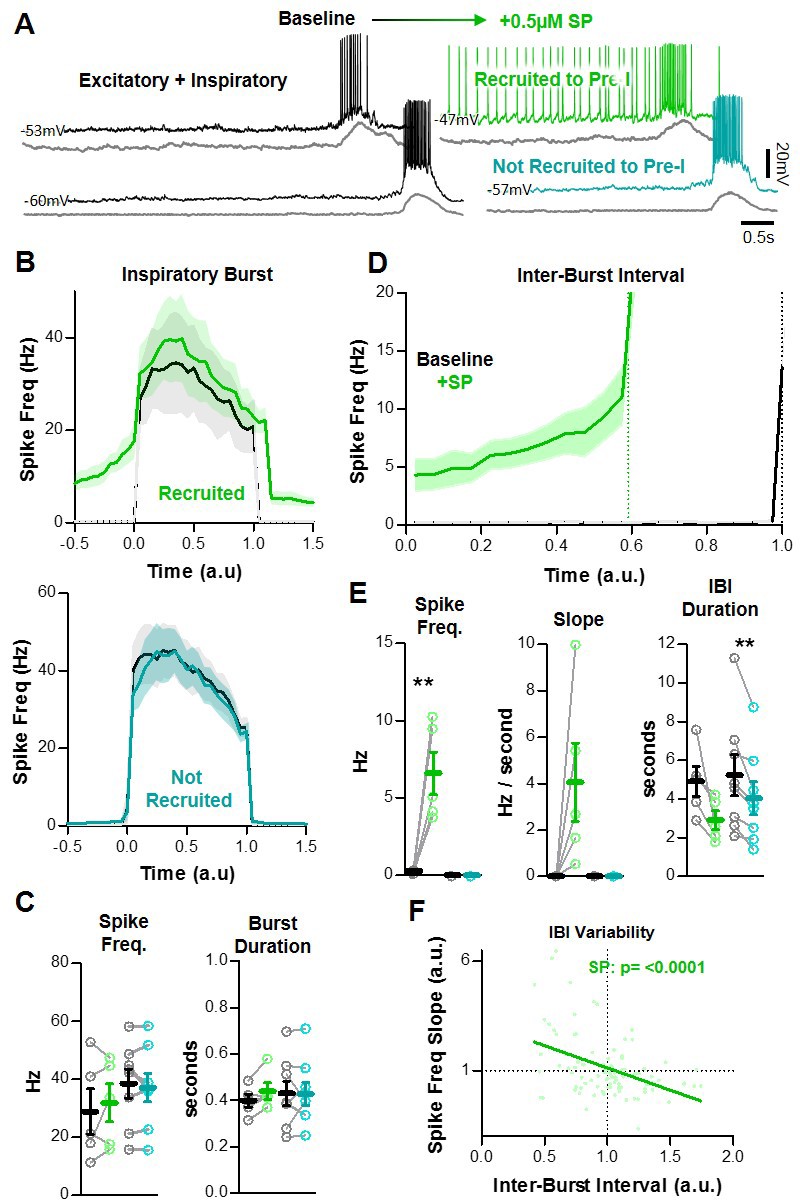
SP recruits a subpopulation of excitatory preBötC neurons to participate in the percolation phase.
(A) Example intracellular recordings from two excitatory neurons, one that develops pre-I activity in SP (green) and one that does not (teal). Corresponding integrated preBötC population activity is shown below each trace (gray). (B) Quantified spike frequency as a function of time (normalized to baseline inspiratory burst duration) in n = 5 excitatory neurons that were recruited to pre-I (top) and n = 8 excitatory neurons that were not recruited to pre-I (bottom). (C) Mean spike frequency and burst duration in both neuron groups (paired, two-tailed t-tests). (D) Quantified spike frequency vs. time (normalized to baseline IBI duration) during the inter-burst interval showing the recruitment of pre-inspiratory ramp activity by SP. (E) Mean spike frequency, pre-inspiratory ramp slope, and IBI duration in both neuron groups (paired, two tailed t-tests). (F) Inverse relationship between the slope of pre-inspiratory spiking and the length of the IBI in SP from n = 5 excitatory neurons that were recruited to pre-I (20 consecutive IBIs/neuron) (linear regression analysis). Data available in Figure 4—source data 1.
-
Figure 4—source data 1
SP recruits a subpopulation of excitatory preBötC neurons to participate in thepercolation phase.
- https://cdn.elifesciences.org/articles/51350/elife-51350-fig4-data1-v2.xlsx
Figure 5
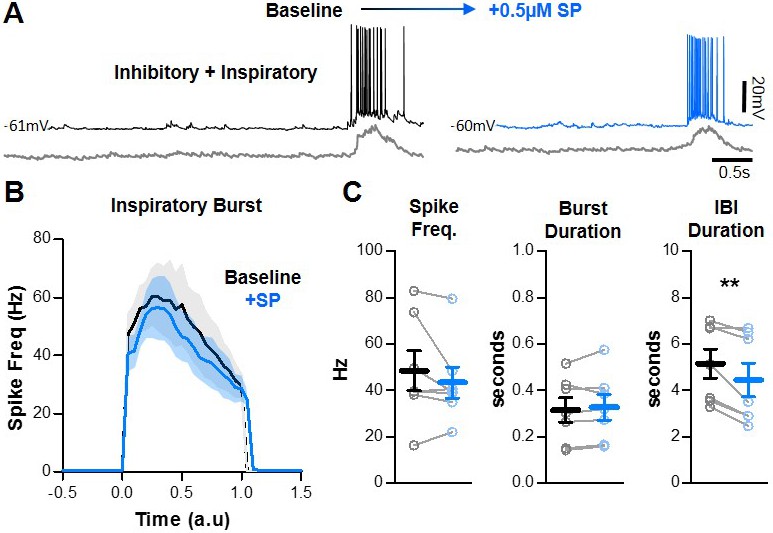
SP does not change inhibitory network interactions.
(A) Example intracellular recordings from an inhibitory preBötC neuron under baseline conditions (black) and in SP (blue) with corresponding integrated preBötC population activity is shown below (gray). (B) Quantified spike frequency as a function of time (normalized to baseline inspiratory burst duration) in n = 7 inhibitory neurons. (C) Mean spike frequency, burst duration, and IBI (paired, two-tailed t-tests). Data available in Figure 5—source data 1.
-
Figure 5—source data 1
SP does not change inhibitory network interactions.
- https://cdn.elifesciences.org/articles/51350/elife-51350-fig5-data1-v2.xlsx
Figure 6
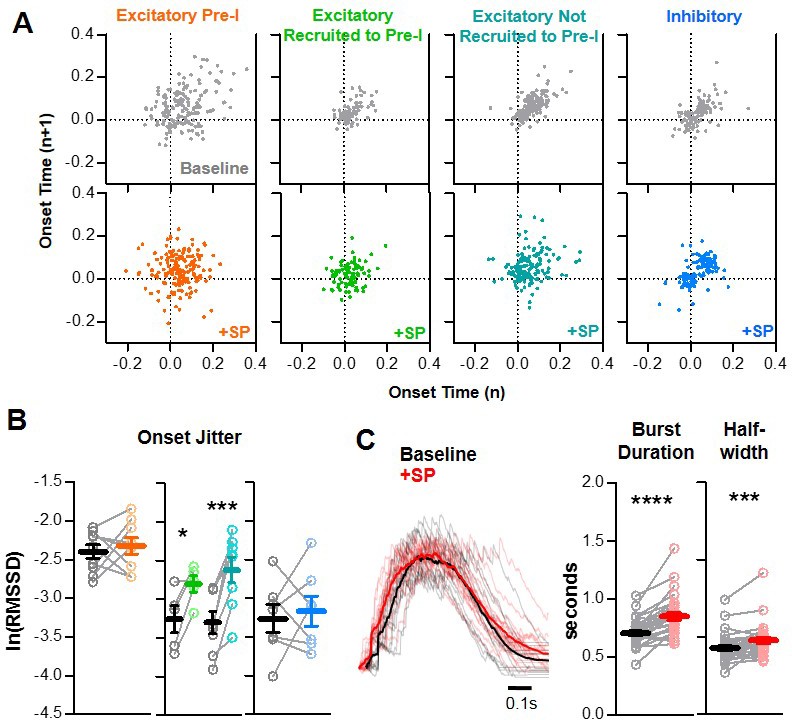
SP increases onset variability among non pre-I excitatory neurons during preBötC bursts.
(A) Poincaré plots of burst-to-burst variability in onset times under baseline conditions (gray) and in SP for n = 9 excitatory, pre-I (orange); n = 5 excitatory, recruited to pre-I (green); n = 8 excitatory, not recruited to pre-I (teal); and n = 7 inhibitory (blue) neurons. (B) Burst onset time variability or ‘jitter’, quantified as the natural log of the root mean square of successive differences, at baseline and in SP for each neuron type. (paired, two tailed t-tests). (C) Representative population bursts at baseline (black) and in SP (red) with averaged traces in bold and quantified burst duration and burst half-width from the n = 29 slices in which onset jitter was quantified (paired, two tailed t-tests). Data available in Figure 6—source data 1.
-
Figure 6—source data 1
P increases onset variability among non pre-I excitatory neurons during preBötC bursts.
- https://cdn.elifesciences.org/articles/51350/elife-51350-fig6-data1-v2.xlsx
Figure 7
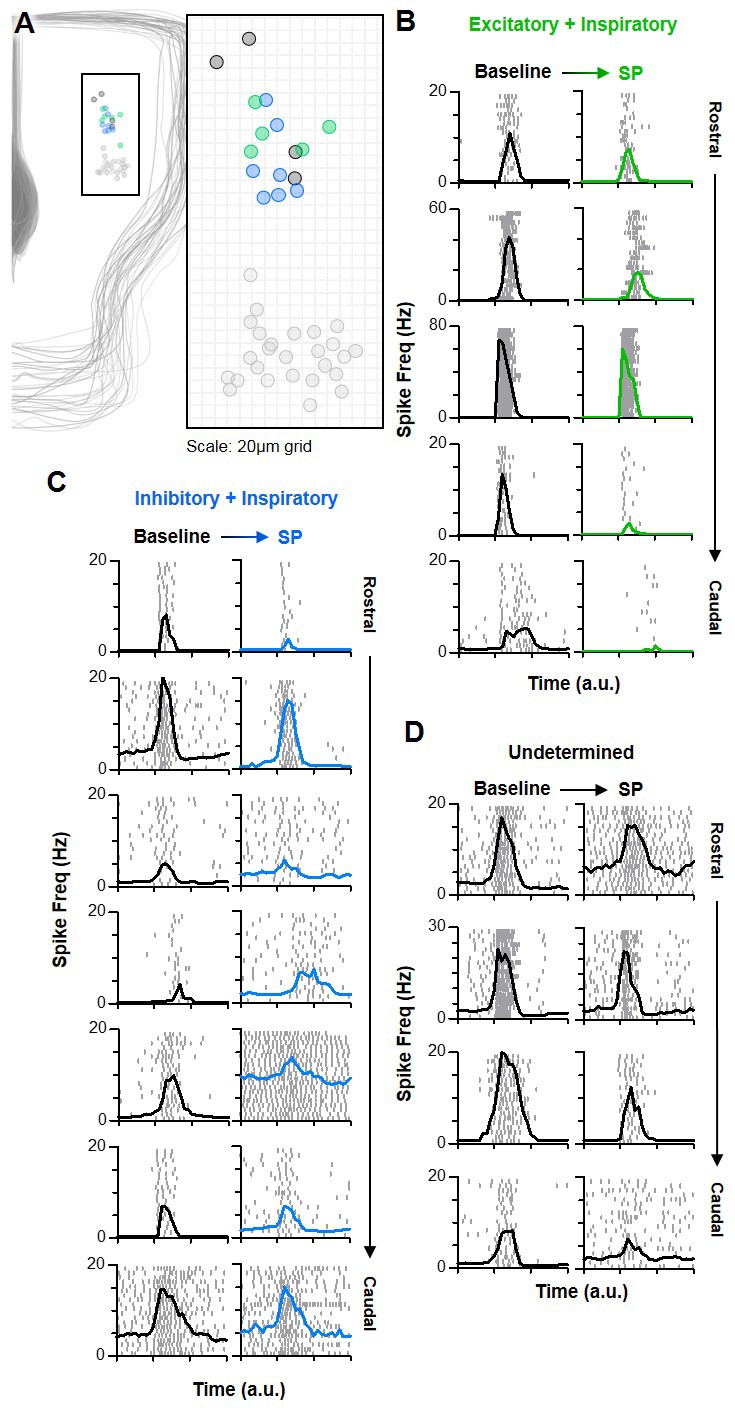
Inspiratory neurons rostral of the preBötC have varied responses to SP.
(A) Anatomical locations of n = 16 rostral inspiratory neurons [n = 5 excitatory (green), n = 7 inhibitory (blue), and n = 4 unknown (black)], relative to preBötC neurons (light gray). (B–D) Spike rasters (each row is one burst cycle; 20 consecutive cycles are stacked) and average spike frequency for each excitatory (B), inhibitory (C), and unknown (D) rostral neuron at baseline and in SP. Time is normalized to the preBötC population burst duration, denoted by the x-axis tick marks.
Figure 8

Quantified effects of SP on rostral excitatory and inhibitory inspiratory neurons.
(A–C) Average spike frequency as a function of time (normalized to preBötC population burst duration) in n = 5 excitatory neurons (A), n = 7 inhibitory neurons (B), and in all rostral neurons (n = 16, red). Mean changes in inspiratory spike frequency at baseline and in SP are plotted to the right of each panel (paired, two tailed t-tests, A and B; one-way ANOVA, (C). (D) Poincaré plots showing burst-to-burst variability in onset times among rostral excitatory (n = 5) and inhibitory (n = 7) neurons (20 consecutive inspiratory bursts/neuron). (E) Mean burst onset time variability or ‘jitter’ at baseline and in SP for each excitatory (left) and inhibitory (right) neurons (paired t-tests). (F) Average spike frequency of rostral inhibitory neurons during the inter-burst interval (normalized to baseline IBI) at baseline and in SP. Mean changes in spike frequency and slope during the IBI are plotted to the right (paired, two tailed t-tests). Data available in Figure 8—source data 1.
-
Figure 8—source data 1
Quantified effects of SP on rostral excitatory and inhibitory inspiratory neurons.
- https://cdn.elifesciences.org/articles/51350/elife-51350-fig8-data1-v2.xlsx
Figure 9
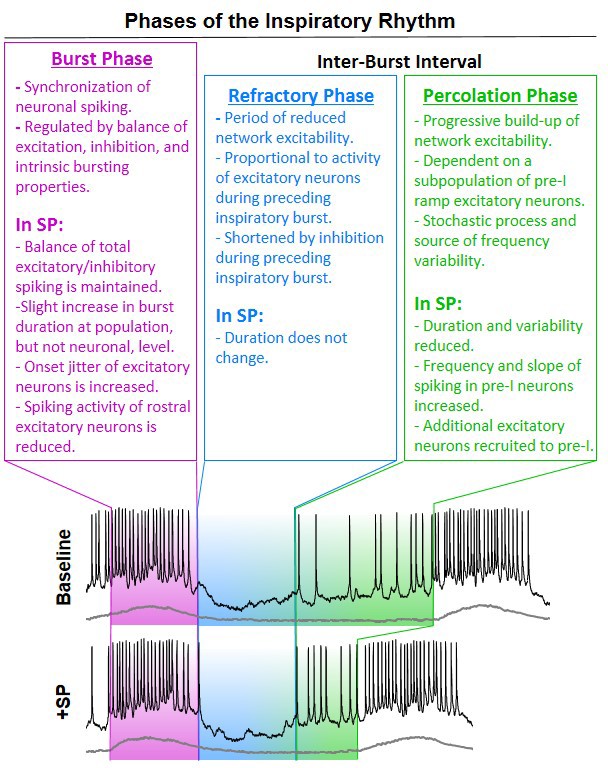
Intrinsic phases of the inspiratory rhythm generator and their modulation by substance P.
Additional files
Download links
A two-part list of links to download the article, or parts of the article, in various formats.
Downloads (link to download the article as PDF)
Open citations (links to open the citations from this article in various online reference manager services)
Cite this article (links to download the citations from this article in formats compatible with various reference manager tools)
Insights into the dynamic control of breathing revealed through cell-type-specific responses to substance P
eLife 8:e51350.
https://doi.org/10.7554/eLife.51350


