Calpain fosters the hyperexcitability of motoneurons after spinal cord injury and leads to spasticity
- Institut de Neurosciences de la Timone (UMR7289), Aix-Marseille Université and CNRS, France
Figures
Figure 1 with 5 supplements

Calpain inhibition alleviates early behavioral signs of spasticity in neonatal rats with SCI.
(A,B) Pictures of typical hindlimb motor response to tail pinching in sham-operated (A), n = 6 rats) and SCI rats (B), 5 d post-SCI, n = 8 rats). Lower and upper traces represent the pinch force and the evoked electromyographic (EMG) response of the triceps surae muscle, respectively. (C,D) Group means quantification of EMG responses. *p<0.05, ***p<0.001 comparing sham versus SCI groups; Mann-Whitney test. (E) Groups means quantification of twitches over a time period of 10 min obtained from sham-operated and SCI rats (5 d post-SCI) at rest on heating pad (~34.5°C). ***p<0.001 comparing sham versus SCI groups (n = 22 rats in both groups); Mann-Whitney test. (F) Time-course changes of twitches after acute i.p. administration (t = 0) of vehicle (black, n = 5 rats) or MDL28170 at 60 mg/kg (red, n = 5 rats) or MDL28170 at 120 mg/kg (green, n = 5 rats) in SCI neonatal rats (5 d post-SCI). *p<0.05, **p<0.01, ***p<0.001, repeated measures one-way ANOVA, Dunnett’s post-test. (G) Representative EMG responses of the triceps surae muscle to tail pinching in SCI neonatal rats (5 d post-SCI) 60 min after an acute i.p. administration of vehicle (black, n = 9 rats) or MDL28170 (red, 120 mg/kg, n = 6 rats). Lower traces represent the pinch force. Group means quantification of EMG responses on the right-hand side. *p<0.05; comparing vehicle-treated versus MDL28170-treated rats; Mann-Whitney test. Underlying numerical values can be found in the Figure 1—source data 1.
-
Figure 1—source data 1
Values displayed in bar plots in Figure 1C-G.
- https://cdn.elifesciences.org/articles/51404/elife-51404-fig1-data1-v2.xlsx
Figure 1—figure supplement 1

Calpain inhibition does not affect the number of twitches recorded in intact neonatal rats.
Time-course changes of twitches after acute i.p. administration (t = 0) of MDL28170 (120 mg/kg) in intact neonatal rats (4–5 d old; n = 6 rats). n.s. p>0.05, repeated measures one-way ANOVA, Dunnett’s post-test. Data are means ± SD. Underlying numerical values can be found in the Figure 1—figure supplement 1—source data 1.
-
Figure 1—figure supplement 1—source data 1
Values displayed in the time course shown in Figure 1—figure supplement 1.
- https://cdn.elifesciences.org/articles/51404/elife-51404-fig1-figsupp1-data1-v2.xlsx
Figure 1—video 1
Typical hindlimb motor movements to tail pinching in sham-operated neonatal rats.
Figure 1—video 2
Typical hindlimb motor movements to tail pinching in spinal cord transected neonatal rats.
Figure 1—video 3
Typical spontaneous tail and hindlimb movements in sham-operated neonatal rats.
Figure 1—video 4
Typical spontaneous tail and hindlimb movements in spinal cord transected neonatal rats.
Figure 2

The expression of Calpain-I increased after SCI.
On the left, calpain-I and calpain-II immunoblots of lumbar segments in sham-operated (n = 4 rats) and SCI neonatal rats (5 d post-SCI, n = 4 rats). One rat per lane. On the right, group means quantification of bands of both calpain-I and calpain-II in SCI rats normalized to sham-operated controls. *p<0.05 comparing sham versus SCI groups; Mann-Whitney test. Data are means ± SD. Underlying numerical values can be found in the Figure 1—source data 1.
-
Figure 2—source data 1
Values displayed in bar plots in Figure 2.
- https://cdn.elifesciences.org/articles/51404/elife-51404-fig2-data1-v2.xlsx
Figure 3 with 1 supplement
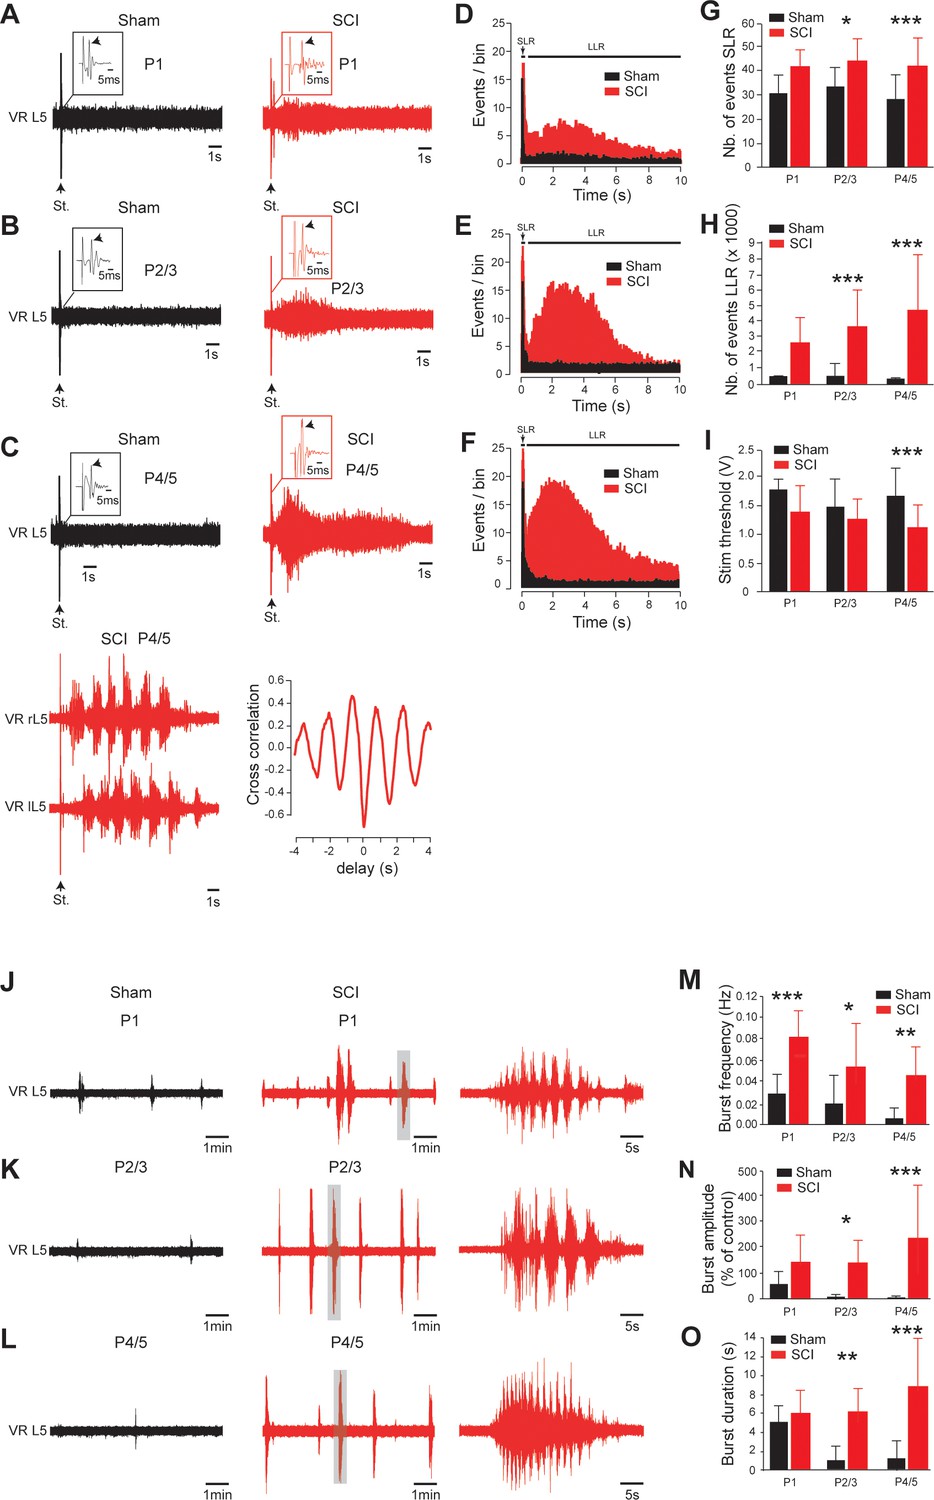
Early development of hyperexcitability on caudal spinal cord after SCI.
(A–C, J–L) Representative L5 ventral root activities (VR L5) evoked by a supramaximal stimulation (St.) of the ipsilateral dorsal root (A–C) or occurring spontaneously (J–L) in spinal cords isolated 1 d (A, J), 2–3 d (B,K) or 4–5 d (C,L) after sham surgery (black) or SCI (red) [for A–C: 1 d, n = 24 sham and n = 6 SCI; 2–3 d, n = 29 sham and n = 10 SCI; 4–5 d, n = 52 in both groups; for J–L: 1 d, n = 12 sham and n = 7 SCI; 2–3 d, n = 11 sham and n = 12 SCI; 4–5 d, n = 10 sham and n = 17 SCI]. Insets in (A–C) are enlargements of the monosynaptic reflex while single arrows indicate the monosynaptic reflex and the stimulus artifact (St.). Bottom traces in (C) illustrate a dorsal root-evoked alternating locomotor-like activity recorded from opposite L5 ventral roots, with the corresponding cross-correlation histograms for left/right relationship. Parts of the recordings in J–L indicated by shaded areas are shown at a faster time scale on the right-hand side. (D–F) Average peristimulus time histogram (PSTH, bin width: 20 ms) of dorsal root evoked L5 ventral root responses collected from sham-operated (black) or SCI rats (red) 1 d (D), 2–3 d (E) or 4–5 d (F) post-SCI. (G–I,M–O) Group means quantification of: events per rat detected over time windows of 10–40 ms and 500–15,000 ms post-stimulus for SLR and LLR, respectively (G,H), threshold for evoking ventral root responses (i) and of spontaneous activites (M–O) at different time points post-SCI. *p<0.05, **p<0.01, ***p<0.001 comparing sham versus SCI groups; two-way ANOVA, Bonferroni’s post-test. Data are means ± SD. Underlying numerical values can be found in the Figure 3—source data 1.
-
Figure 3—source data 1
Values displayed in bar plots shown in Figure 3G-I, M-O.
- https://cdn.elifesciences.org/articles/51404/elife-51404-fig3-data1-v2.xlsx
Figure 3—figure supplement 1
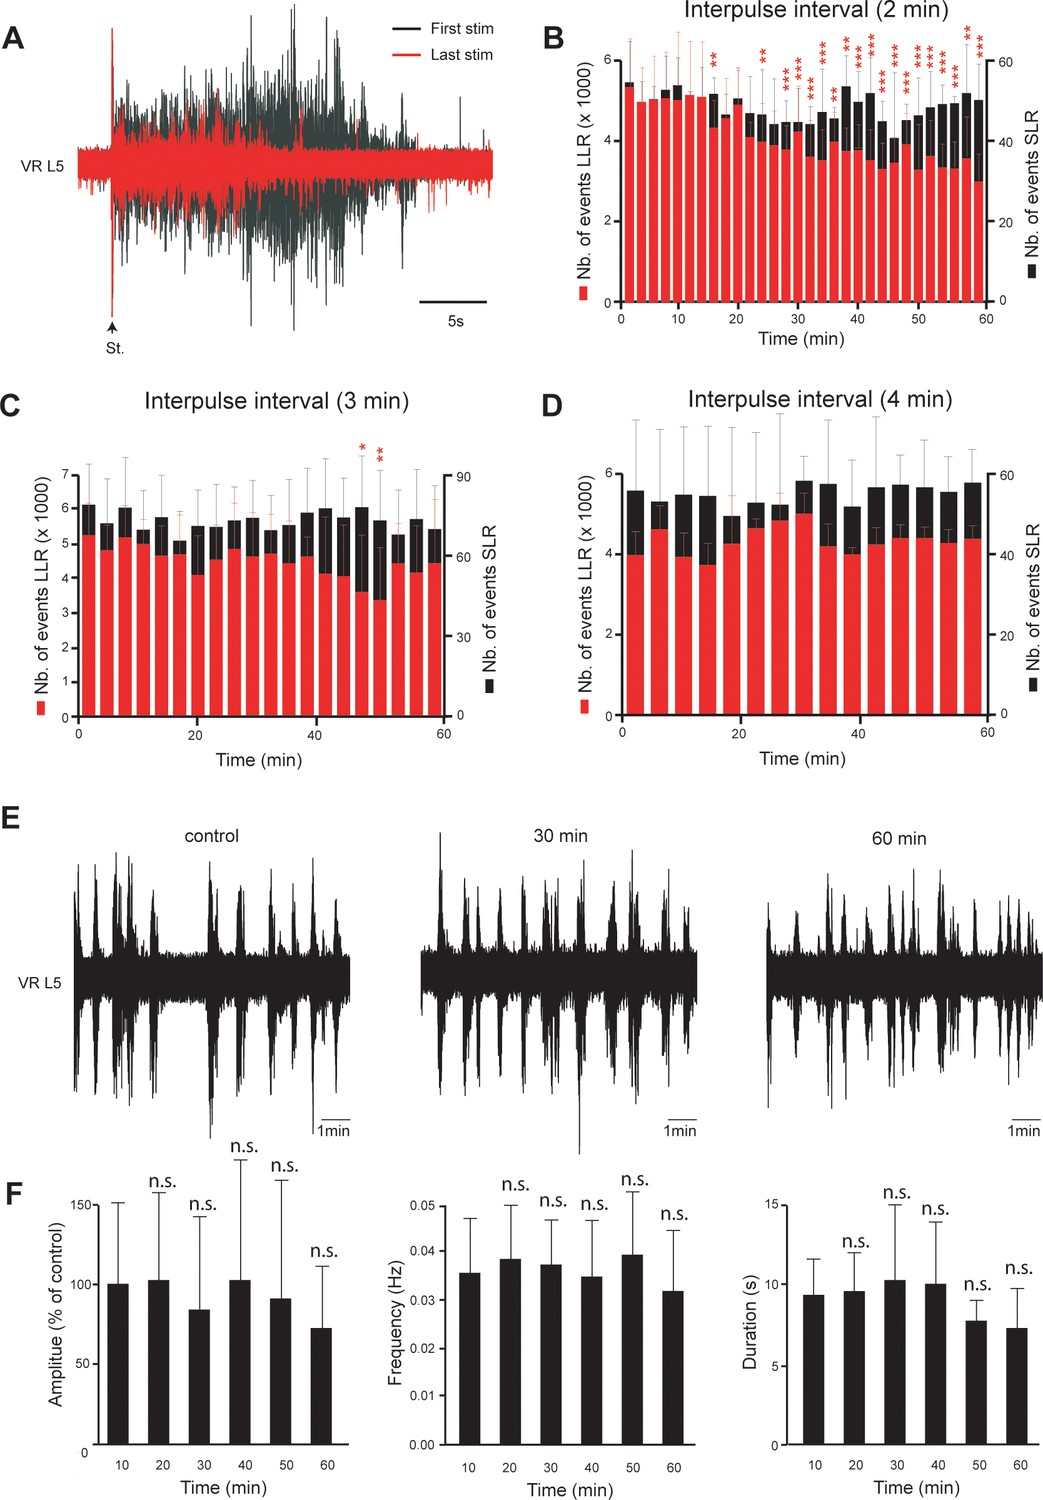
Stability of both hyperreflexia and spontaneous activities in spinal cord isolated from neonatal rats with SCI.
(A) Superimposition of the first (black) and the last (red) dorsal root evoked L5 ventral root responses recorded in spinal cord isolated from SCI rats (4–5 d post-SCI) during a stimulation session of 60 min with an interpulse interval of 2 min. (B–D) Mean time course changes in the peristimulus time histogram (PSTH) of L5 ventral root responses (VR L5) during repetitive supramaximal stimuli of the ipsilateral dorsal root delivered with an interpulse interval of 2 min (B), n = 7 rats), 3 min (C), n = 9 rats) or 4 min (D), n = 6 rats). The transient short latency (SLR, black) and long-lasting reflexes (LLR, red) were computed over time windows of 10–40 ms and 500–15,000 ms post-stimulus, respectively. *p<0.05, **p<0.01, ***p<0.001, repeated measures one-way ANOVA, Dunnett’s post-test. Values measured during the first time window are taken as control values. Data are means ± SD. (E) Spontaneous activities recorded on L5 ventral root (VR L5) as a function of time in spinal cord isolated from SCI rats (4–5 d post-SCI, n = 9 rats). (F) Time course changes in amplitude, frequency and duration of spontaneous activities. n.s. p>0.05, repeated measures one-way ANOVA, Dunnett’s post-test. Values measured during the first time window are taken as control values. Data are means ± SD. Underlying numerical values can be found in the Figure 3—figure supplement 1—source data 1.
-
Figure 3—figure supplement 1—source data 1
Values displayed in bar plots shown in Figure 3—figure supplement 1B–D, F.
- https://cdn.elifesciences.org/articles/51404/elife-51404-fig3-figsupp1-data1-v2.xlsx
Figure 4 with 2 supplements
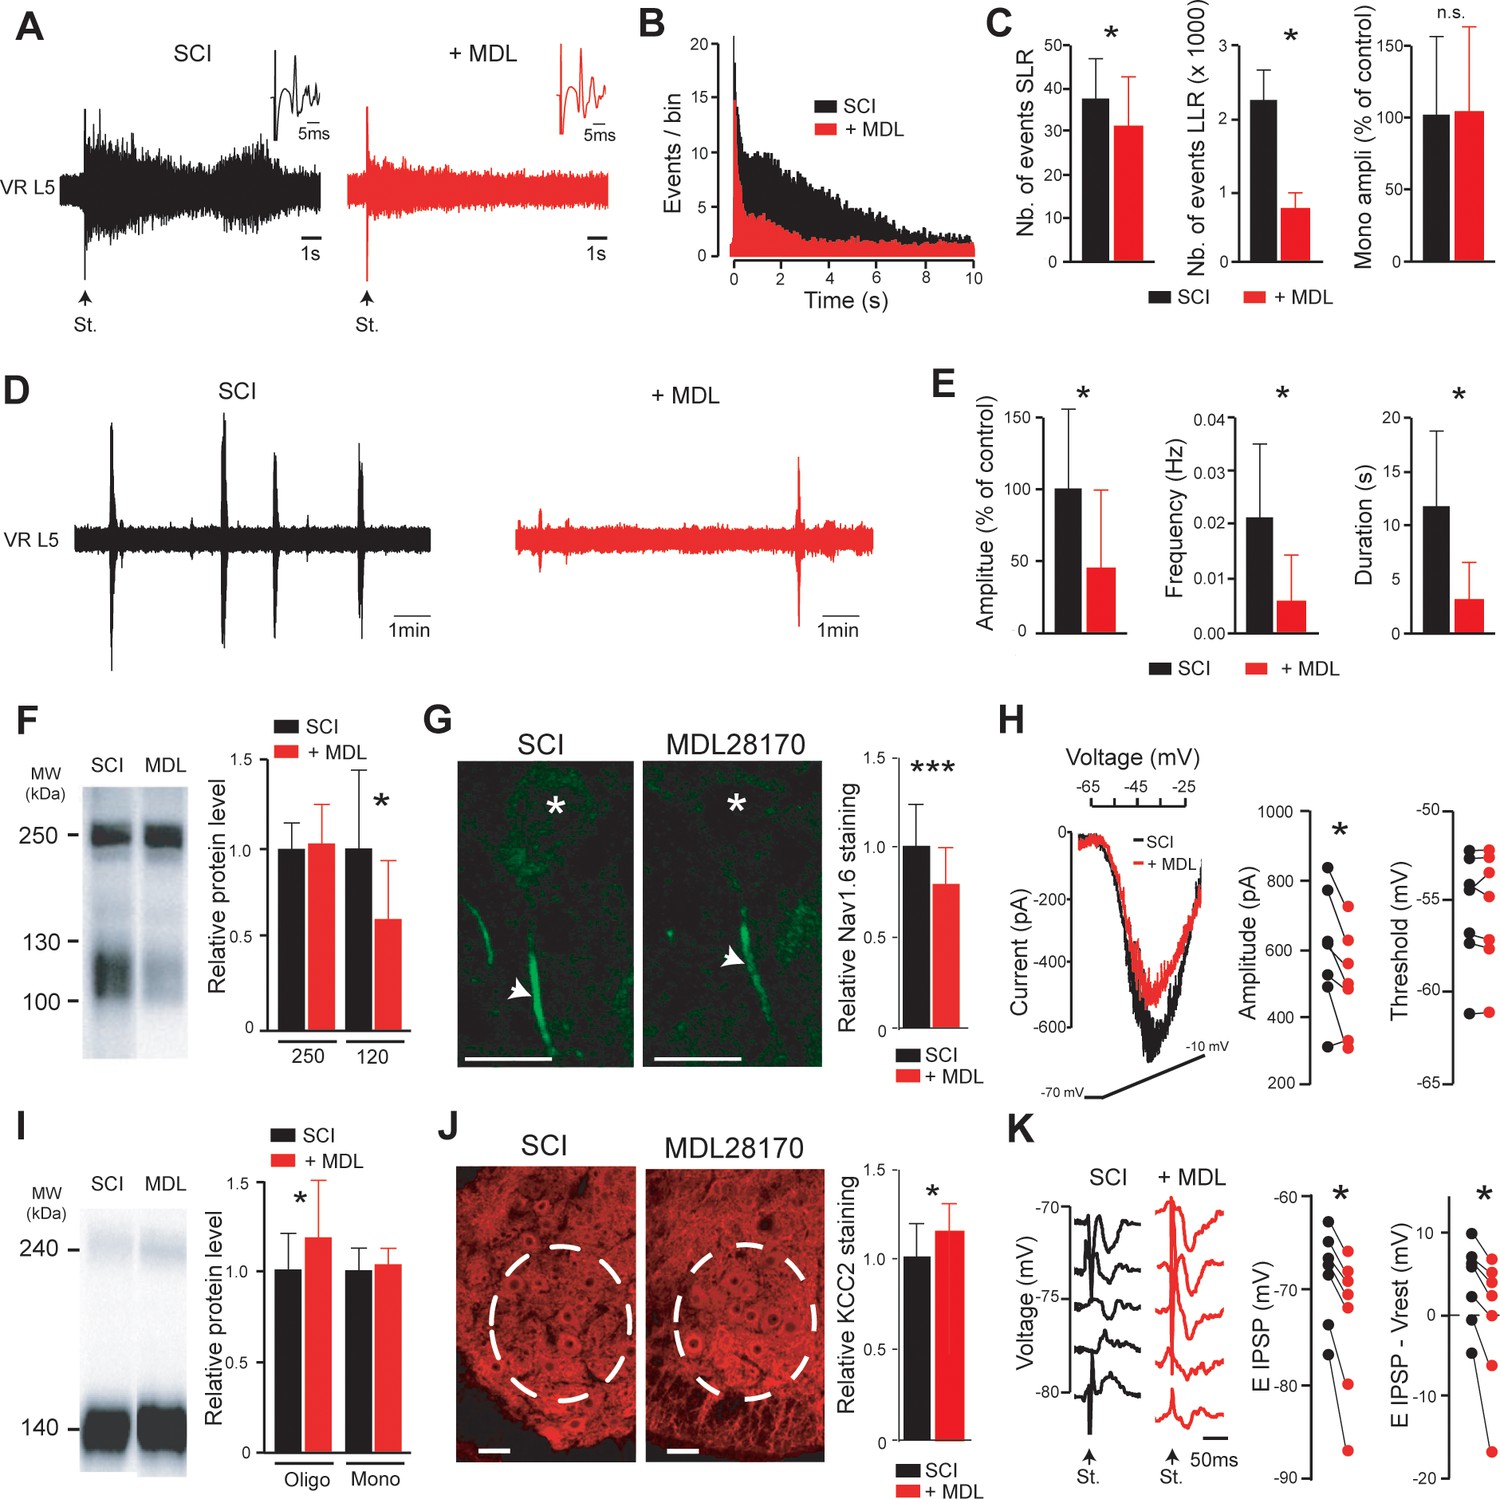
Inhibition of calpain restores the excitatory/inhibitory equilibrium of motoneurons.
(A,D) Representative L5 ventral root activities (VR L5) evoked by a supramaximal stimulation (St.) of the ipsilateral dorsal root (A) or occurring spontaneously (D) in spinal cords isolated from SCI rats (4–5 d post-SCI; n = 6 rats) before (black) and after (red) bath-applying MDL28170 (30 µM, 60 min). Insets in (A) illustrate enlargements of the monosynaptic response. (B) Average peristimulus time histogram (PSTH, bin width: 20 ms) of dorsal root evoked L5 ventral root responses before (black) and after (red) adding MDL28170. (C,E) Group means quantification of: the monosynaptic reflex and events per rat detected over time windows of 10–40 ms and 500–15,000 ms post-stimulus for SLR and LLR, respectively (C) and of spontaneous activities (E). *p<0.05, comparing data collected before (black) and after MDL28170 (red); Wilcoxon paired test. (F,I) Pan-Nav (F) and KCC2 (I) immunoblots of lumbar segments from SCI rats (5 d post-SCI) bath-applied with vehicle (left lane) or MDL28170 (30 µM, right lane). On the right-hand side, quantification of immunoblots in MDL28170-treated samples (red, n = 12 rats for Pan-Nav, n = 8 rats for KCC2) normalized to vehicle-treated samples (black, n = 11 rats for Pan-Nav, n = 7 rats for KCC2). *p<0.05; comparing vehicle- to MDL28170-treated samples; Mann-Whitney test. (G,J) Representative single optical sections showing immunostaining in vehicle- (left) and MDL28170-treated (right) lumbar enlargement (L4–L5) from SCI rats (5 d post-SCI), against Nav1.6 α-subunit expressed in AISs of motoneurons (G) or KCC2 expressed in ventral horns (J). Asterisks in (G) indicate the motoneuron nucleus position and arrows their AISs. Dotted circles in (J) surround the ROI where KCC2 staining was quantified. Scale bars, 20 µm and 40 µm in (G) and (J), respectively. On the right-hand side, relative immunostaining intensities obtained with Nav 1.6 (G) and KCC2 (J) antibodies in MDL28170-treated samples (red) normalized to vehicle-treated controls (black). For Nav 1.6: N = 71 cells each from three rats per group; For KCC2: N = 47 slices each from three rats per group. *p<0.05, ***p<0.001 comparing vehicle-treated versus MDL28170-treated groups; t-test. (H) Representative leak-subtracted INaP in a lumbar motoneuron (visualized as the largest cells located in layer IX of slices) from SCI rat (5 d post-SCI) and evoked by a slow (12 mV/s) voltage ramp increase from −70 mV to −10 mV over 5 s before (black) and after (red) bath-applying MDL28170 (30 µM, 30–60 min, n = 6 cells). Quantification of INaP on the right-hand side. *p<0.05, Wilcoxon paired test. (K) IPSPs evoked by stimulation (St.) of the ventral funiculus of the spinal cord at different holding potentials in a lumbar motoneuron (identified by the antidromic response to stimulation of the ventral roots) from SCI rat (5 d post-SCI) before (black) and after (red) bath-applying MDL28170 (30 µM, 30–60 min, n = 7 cells). Quantification of EIPSP (left) and driving force (EIPSP-Vrest, right) on the right-hand side. *p<0.05; Wilcoxon paired test (n = 7 cells). Data are mean ± SD. Underlying numerical values can be found in the Figure 4—source data 1.
-
Figure 4—source data 1
Values displayed in Figure 4C, E-K.
- https://cdn.elifesciences.org/articles/51404/elife-51404-fig4-data1-v2.xlsx
Figure 4—figure supplement 1
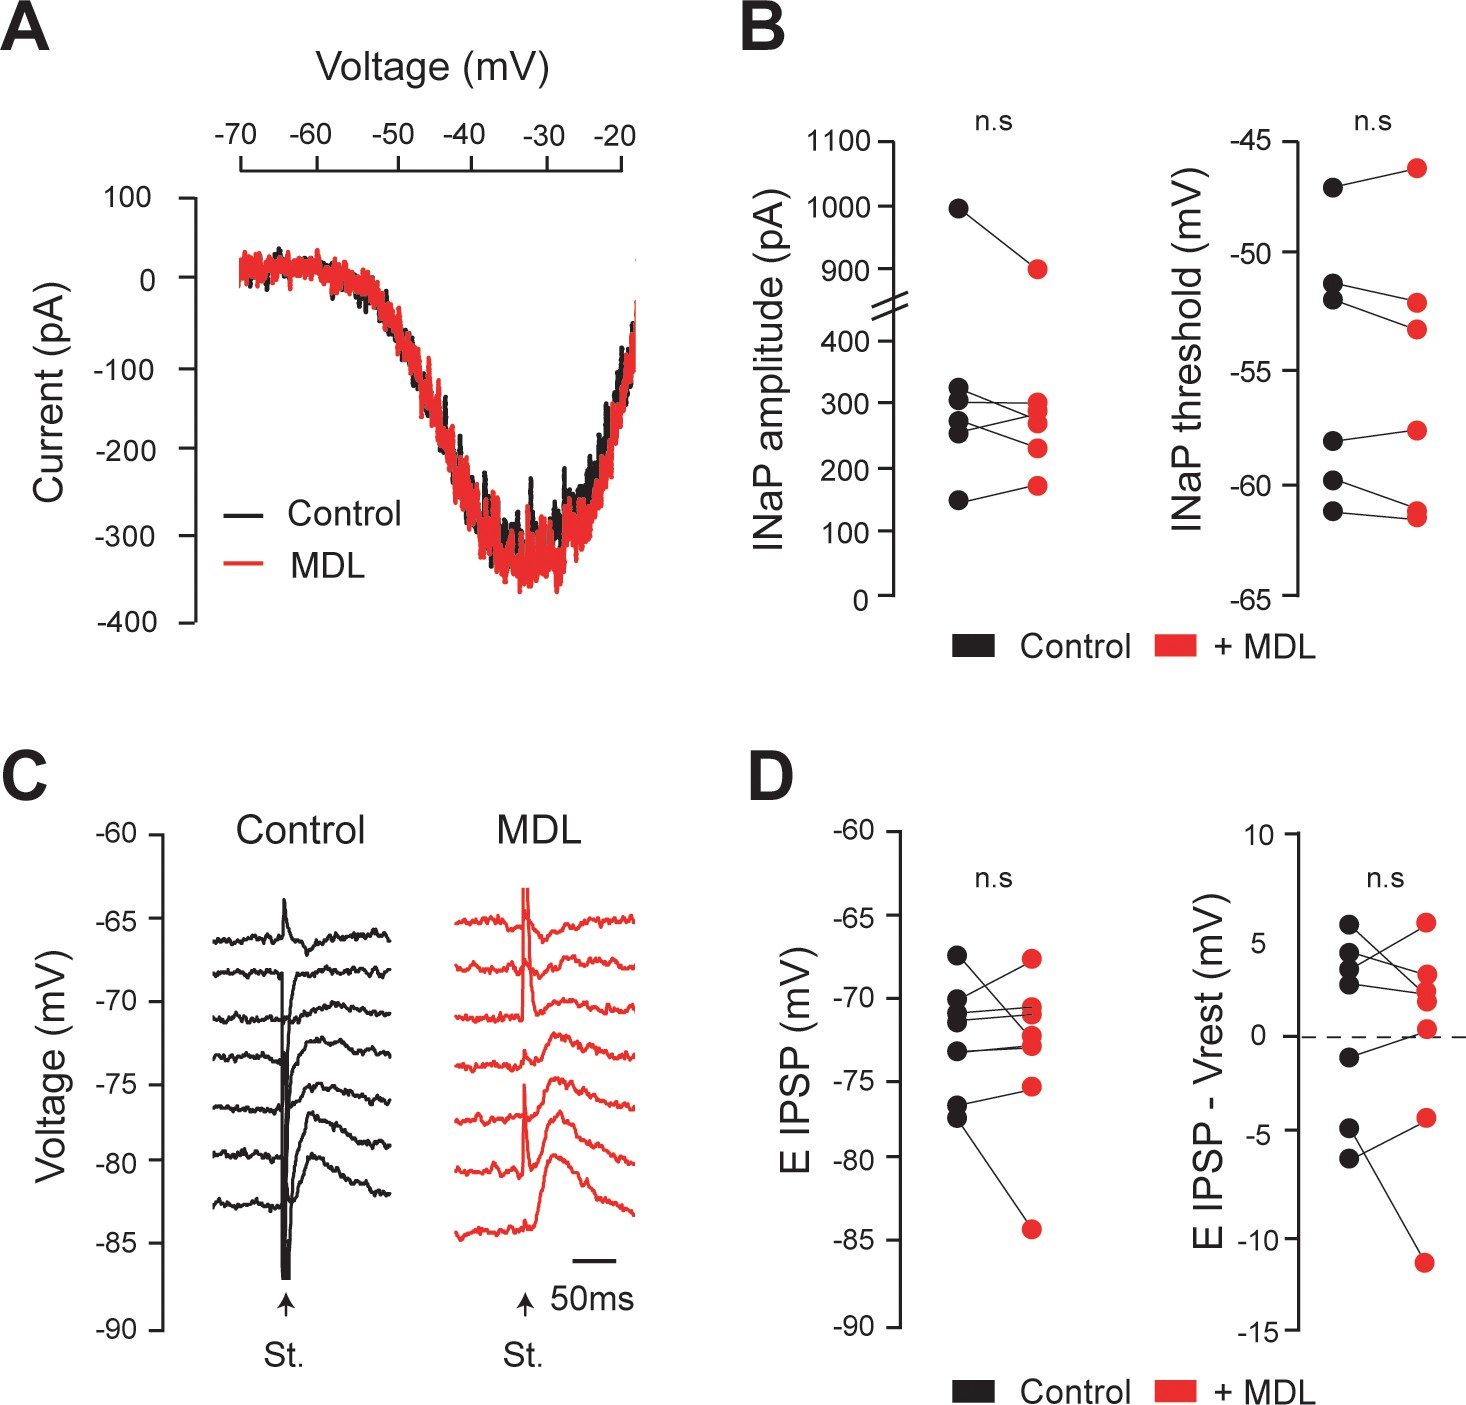
Calpain inhibition affects neither INaP nor EIPSP in lumbar motoneurons recorded from neonatal intact rats.
(A) Leak-subtracted INaP in lumbar motoneurons (n = 6 cells) from intact rats (5 d old) before (black) and after (red) bath-applying MDL28170 (30 µM, 30–60 min). (B) Quantification of INaP. n.s. p>0.05; Wilcoxon paired test. (C) IPSPs evoked by stimulation (St.) of the ventral funiculus of the spinal cord at different holding potentials in lumbar motoneurons (n = 7 cells) from intact rats (5 d old) before (black) and after (red) bath-applying MDL28170 (30 µM, 30–60 min). (D) Quantification of EIPSP and driving force (EIPSP-Vrest). n.s.P >0.05; Wilcoxon paired test. Underlying numerical values can be found in the Figure 4—figure supplement 1—source data 1.
-
Figure 4—figure supplement 1—source data 1
Values displayed in plots shown in Figure 4—figure supplement 1B, D.
- https://cdn.elifesciences.org/articles/51404/elife-51404-fig4-figsupp1-data1-v2.xlsx
Figure 4—figure supplement 2

Cleavage of KCC2 channels by calpain-1.
(A) KCC2 immunoblot from intact neonatal rat with incremental concentration of calpain-1 (B). Quantification of ~240 kDa and ~140 kDa bands in calpain-treated homogenates, normalized to untreated homogenates (for each concentration, 1 replicate from one rat). (C) KCC2 immunoblot of lumbar spinal cord homogenates from intact neonatal rat with (+) or without (-) calpain (2 U). Chemiluminescence signals for ~240 kDa and ~140 kDa bands are two different exposure time images. (D) Quantification of ~240 kDa and ~140 kDa bands in calpain-treated homogenates normalized to untreated homogenates (0 U, n = 8; 2 U, n = 8; n replicates from eight rats). **p<0.01, ***p<0.001; Mann-Whitney test. Data are mean ± SD. Underlying numerical values can be found in the Figure 4—figure supplement 2—source data 1.
-
Figure 4—figure supplement 2—source data 1
Values displayed in bar plots shown in Figure 4—figure supplement 2B, D.
- https://cdn.elifesciences.org/articles/51404/elife-51404-fig4-figsupp2-data1-v2.xlsx
Figure 5 with 2 supplements
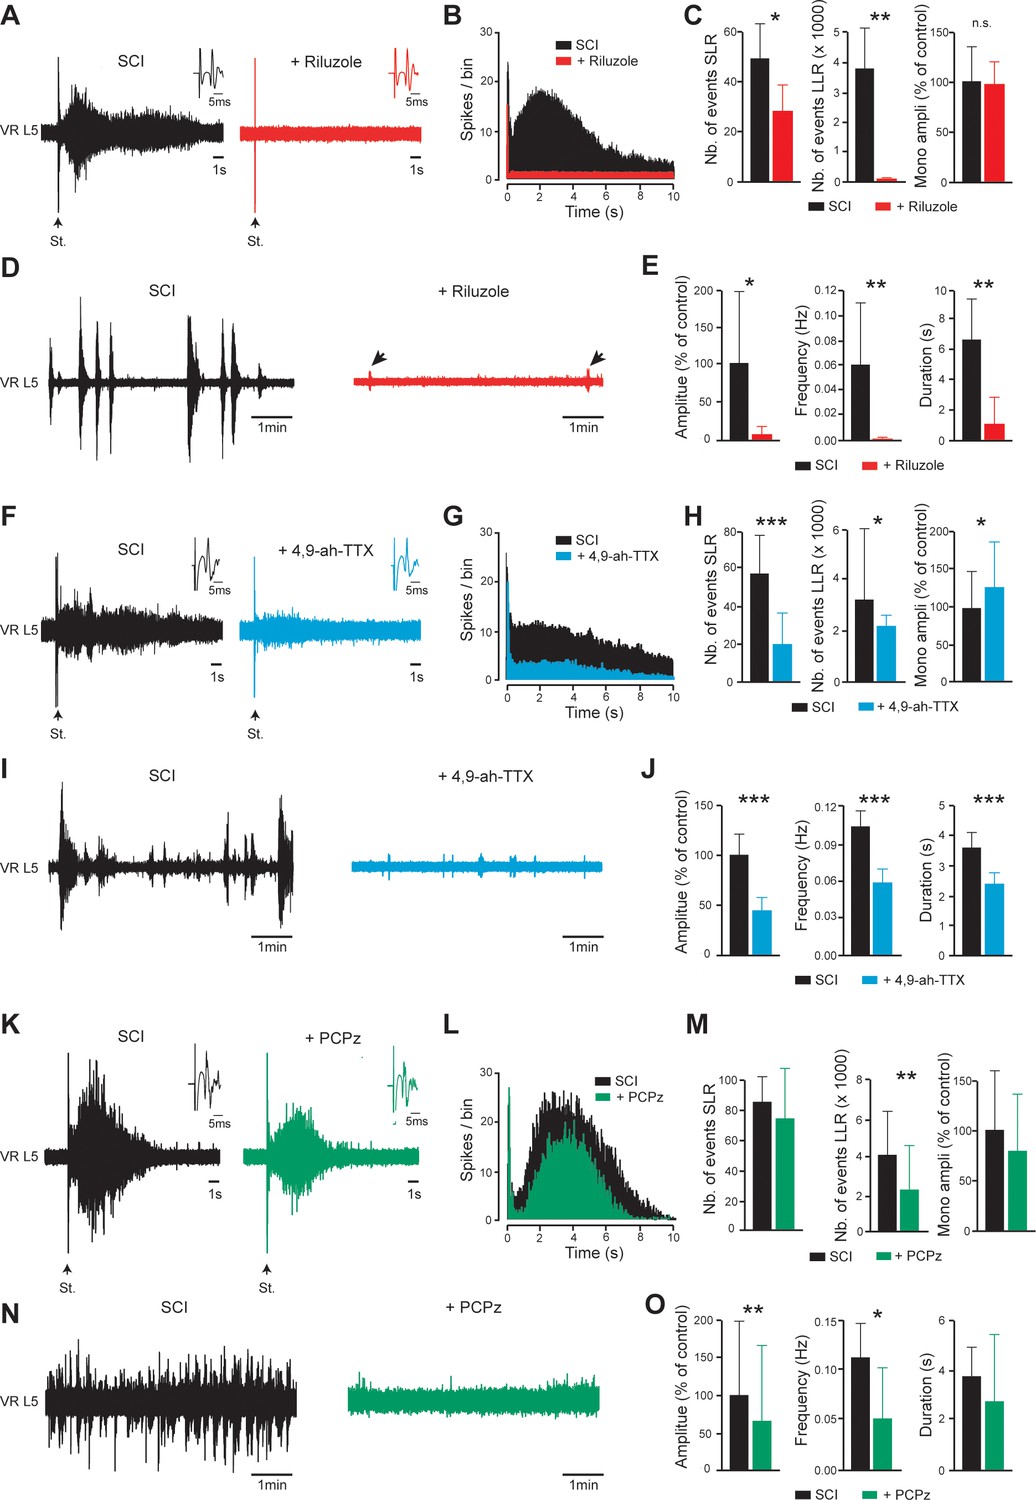
INaP-blockers or a KCC2-enhancer normalize the excitability of the spinal cord below SCI.
(A,D,F,I,K,N) Representative L5 ventral root activities (VR L5) evoked by a supramaximal stimulation (St.) of the ipsilateral dorsal root (A,F,K) or occurring spontaneously (D,I,N) in spinal cords isolated from SCI rats (4–5 d post-SCI) before (black) and after bath-applying 5 µM riluzole (A,D); red, 30 min, n = 8 rats), 200 nM 4,9-ah-TTX (F,I; blue, 30 min, n = 15 rats for F, n = 20 rats for I) or 10 µM PCPz (K,N; green, 30 min, n = 9 rats for K, n = 11 rats for N). Insets in (A,F,K) illustrate enlargements of the monosynaptic response. (B,G,L) Average peristimulus time histogram (PSTH, bin width: 20 ms) of dorsal root evoked L5 ventral root responses before (black) and after (color) bath-applying the above-mentioned drugs. (C,E,H,J,M,O) Group means quantification of: the monosynaptic reflex and events per rat detected over time windows of 10–40 ms and 500–15,000 ms post-stimulus for SLR and LLR, respectively (C,H,M), and spontaneous activities (E,J,O). *p<0.05, **p<0.01, ***p<0.001, comparing data collected before and after adding drugs mentioned above; Wilcoxon paired test. Data are mean ± SD. Underlying numerical values can be found in the Figure 5—source data 1.
-
Figure 5—source data 1
Values displayed in bar plots shown in Figure 5C, E, H, J, M, O.
- https://cdn.elifesciences.org/articles/51404/elife-51404-fig5-data1-v2.xlsx
Figure 5—figure supplement 1

The INaP-enhancer veratridine used at 100 nM triggers riluzole-sensitive hyperreflexia and spontaneous activities in isolated spinal cords from intact neonatal rats.
(A,D) Representative L5 ventral root activities (VR L5) evoked by a supramaximal stimulation (St.) of the ipsilateral dorsal root (A) or occurring spontaneously (D) in spinal cords isolated from intact rats (4–5 d-old; n = 8 rats) before (black) and after (red) bath-applying veratridine alone (100 nM) and then superfused with riluzole (5 µM, gray). (B) Average peristimulus time histogram (PSTH, bin width: 20 ms) of dorsal root evoked L5 ventral root. (C) Group means quantification of: the monosynaptic reflex and events per rat detected over time windows of 10–40 ms and 500–15,000 ms post-stimulus for SLR and LLR, respectively. *p<0.05, **p<0.01; One-way ANOVA. (E) Group means quantification of spontaneous activities. *p<0.05; Wilcoxon paired test. Underlying numerical values can be found in the Figure 5—figure supplement 1—source data 1.
-
Figure 5—figure supplement 1—source data 1
Values displayed in bar plots shown in Figure 5—figure supplement 1C, E.
- https://cdn.elifesciences.org/articles/51404/elife-51404-fig5-figsupp1-data1-v2.xlsx
Figure 5—figure supplement 2
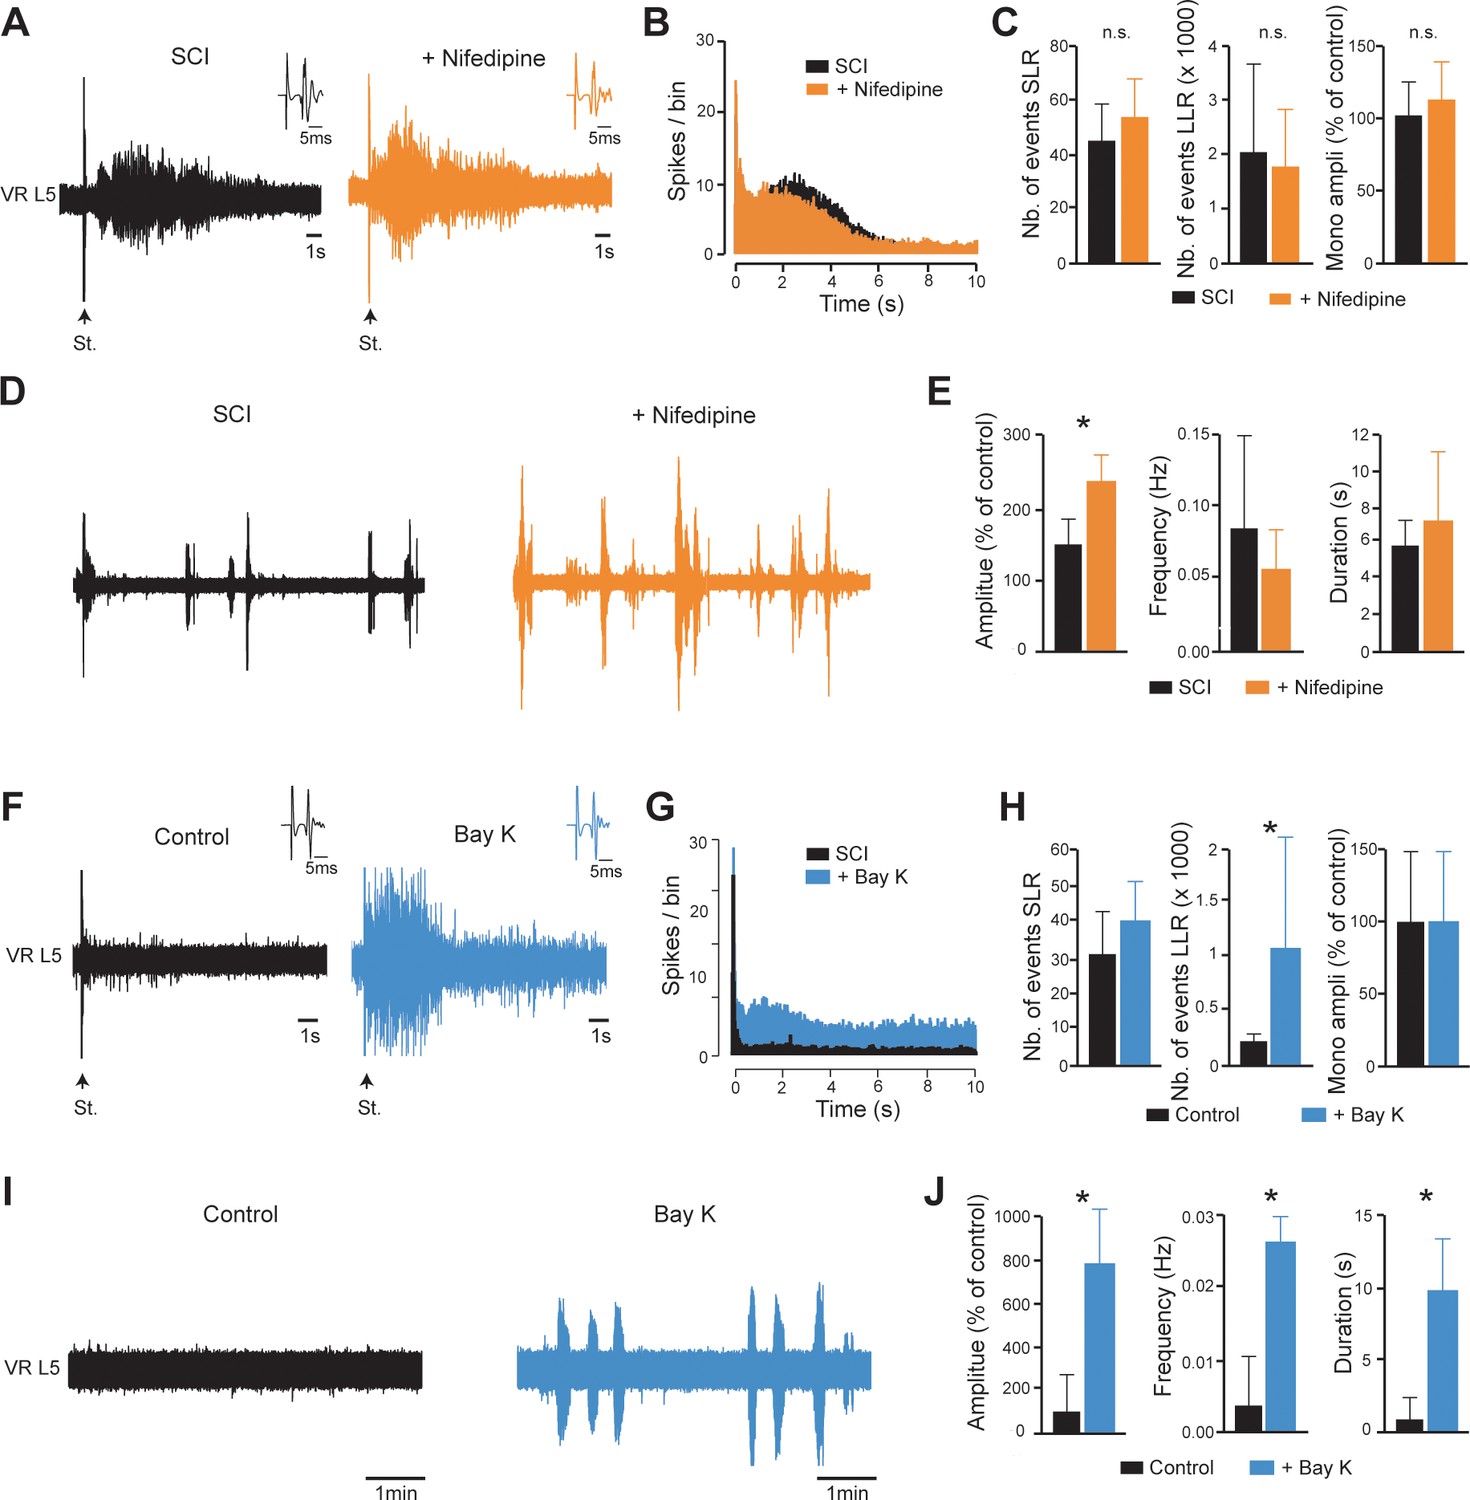
ICaP does not contribute to hyperexcitability caudal to SCI.
(A,D,F,I) Representative L5 ventral root activities (VR L5) evoked by a supramaximal stimulation (St.) of the ipsilateral dorsal root (A,F) or occurring spontaneously (D,I) before (black) and after bath-applying 20 µM nifedipine in spinal cords isolated from SCI rats (A,D, 4–5 d post-SCI, orange, 30 min, n = 14 rats), or 10 µM Bay-K in spinal cords isolated from intact rats (F,I, 4–5 d-old, blue, 30 min, n = 7 rats). Insets in A,F illustrate enlargements of the monosynaptic response. (B,G) Average peristimulus time histogram (PSTH, bin width: 20 ms) of dorsal root evoked L5 ventral root responses before (black) and after (color) bath-applying the above-mentioned drugs. (C,E,H,J) Group means quantification of: the monosynaptic reflex and events per rat detected over time windows of 10–40 ms and 500–15,000 ms post-stimulus for SLR and LLR, respectively (C,H), and spontaneous activities (E,J). *p<0.05, **p<0.01, ***p<0.001, comparing data collected before and after adding drugs mentioned above; Wilcoxon paired test. Data are mean ± SD. Underlying numerical values can be found in the Figure 5—figure supplement 2—source data 1.
-
Figure 5—figure supplement 2—source data 1
Values displayed in bar plots shown in Figure 5—figure supplement 2C, E, H, J.
- https://cdn.elifesciences.org/articles/51404/elife-51404-fig5-figsupp2-data1-v2.xlsx
Figure 6
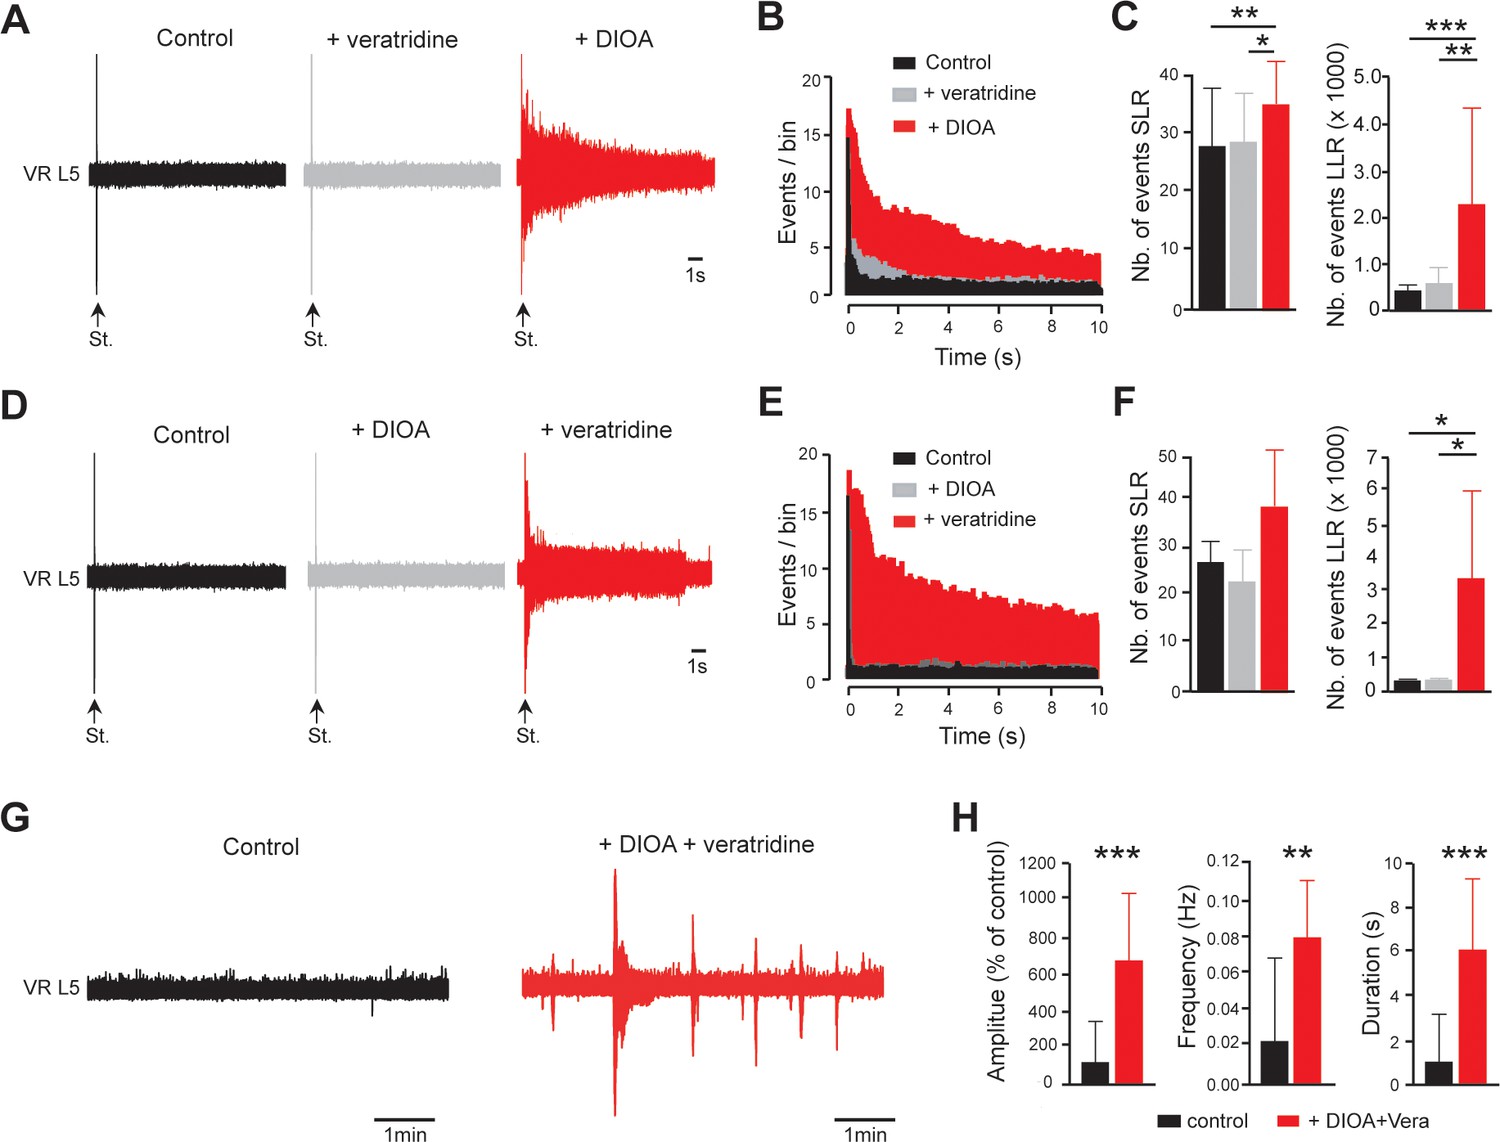
EIPSP and INaP act synergistically to promote spinal hyperexcitability.
(A) Representative L5 ventral root activities (VR L5) evoked by a supramaximal stimulation (St.) of the ipsilateral dorsal root in spinal cords isolated from intact rats (4–5 d old, n = 11 rats) before (black) and after (gray) the application of veratridine (60 nM, 30 min) followed by the superfusion (red) of DIOA (30 µM, 30 min). (D) Same experiments (n = 6 rats) as in (A) but by applying DIOA (gray) before veratridine (red). (B,E) Average peristimulus time histogram (PSTH, bin width: 20 ms) of dorsal root evoked L5 ventral root responses recorded either in the presence of veratridine or DIOA alone (gray), or in the presence of both (red). (C,F) Group means quantification of events per rat detected over time windows of 10–40 ms and 500–15,000 ms post-stimulus for SLR and LLR, respectively. *p<0.05, **p<0.01, ***p<0.001 repeated measures one-way ANOVA. (G) Representative spontaneous activities recorded on L5 ventral root (VR L5) in spinal cords isolated from intact rats (4–5 d old, n = 19 rats) before (black) and after (red) the superfusion of 60 nM veratridine with 30 µM DIOA (30 min). (H) Group means quantification of spontaneous activities. **p<0.01, ***p<0.001 Wilcoxon paired test. Data are mean ± SD. Underlying numerical values can be found in the Figure 6—source data 1.
-
Figure 6—source data 1
Values displayed in bar plots shown in Figure 6C, F, H.
- https://cdn.elifesciences.org/articles/51404/elife-51404-fig6-data1-v2.xlsx
Tables
Key resources table
| Reagent type (species) or resource | Designation | Source or reference | Identifiers | Additional information |
|---|---|---|---|---|
| Antibody | mouse monoclonal anti-PanNav | Sigma | clone K58/35 CAT#S8809 RRID:AB_477552 | (1:500) |
| Antibody | rabbit polyclonal anti-Nav1.6 | Alomone | Cat # ASC-009 RRID:AB_2040202 | (1:200) |
| Antibody | rabbit polyclonal anti-KCC2 | Millipore | CAT# 07–432 RRID:AB_310611 | (1:400, 1:500) |
| Antibody | rabbit polyclonal anti-calpain-I | Ozyme | CAT#2556S | (1:500) |
| Antibody | rabbit polyclonal anti-calpain-II | Millipore | CAT#AB81023 RRID:AB_1586917 | (1:500) |
| Antibody | ImmunoPure goat HRP-conjugated mouse-specific antibody | Thermo Fisher Scientific | CAT#0031430 RRID:AB_228307 | (1:40000) |
| Antibody | AlexaFluor-488 goat anti-mouse IgG2b | Thermo Fisher Scientific | CAT# A-21141 RRID:AB_141626 | (1:800) |
| Antibody | AlexaFluor-546 F(ab’)two goat anti-rabbit IgG | Thermo Fisher Scientific | CAT# A-11071 RRID:AB_2534115 | (1:400) |
| Chemical compound, drug | NaCl | Sigma-Aldrich | CAT# 71376 | |
| Chemical compound, drug | KCl | Sigma-Aldrich | CAT# P3911 | |
| Chemical compound, drug | NaH2PO4 | Sigma-Aldrich | CAT# S0751 | |
| Chemical compound, drug | MgSO4 | Sigma-Aldrich | CAT# 1880 | |
| Chemical compound, drug | CaCl2 | Sigma-Aldrich | CAT# 21115 | |
| Chemical compound, drug | NaHCO3 | Sigma-Aldrich | CAT# S6014 | |
| Chemical compound, drug | D-glucose | Sigma-Aldrich | CAT# G8270 | |
| Chemical compound, drug | K+-gluconate | Sigma-Aldrich | CAT# P1847 | |
| Chemical compound, drug | MgCl2 | Sigma-Aldrich | CAT# M8266 | |
| Chemical compound, drug | HEPES | Sigma-Aldrich | CAT# H3375 | |
| Chemical compound, drug | EGTA | Sigma-Aldrich | CAT# E3889 | |
| Chemical compound, drug | ATP | Sigma-Aldrich | CAT# A9062 | |
| Chemical compound, drug | GTP | Sigma-Aldrich | CAT# G9002 | |
| Chemical compound, drug | Sucrose | Sigma-Aldrich | CAT# S9378 | |
| Chemical compound, drug | Cadmium Chloride | Sigma-Aldrich | CAT# 202908 | |
| Chemical compound, drug | Tetraethylammonium chloride | Sigma-Aldrich | CAT# 86616 | |
| Chemical compound, drug | Nifedipine | Sigma-Aldrich | CAT# N7634 | |
| Chemical compound, drug | Dimethylsulphoxide | Sigma-Aldrich | CAT# D8418 | |
| Chemical compound, drug | Paraformaldehyde | EMS | CAT# 15714 s | |
| Chemical compound, drug | Phosphate Buffered Saline | Argene Biomérieux | CAT# 33–011 | |
| Chemical compound, drug | Tissue-Tek OCT compound | VWR | CAT# 25608–930 | |
| Chemical compound, drug | Tris-buffered saline | Bio-world | CAT# 105300272 | |
| Chemical compound, drug | Triton X-100 | Sigma-Aldrich | CAT# T9284 | |
| Chemical compound, drug | CompleteMini | Roche diagnostic Basel | CAT#11836170001 | |
| Chemical compound, drug | Iodoacetamide | Sigma-Aldrich | CAT#I1149 | |
| Chemical compound, drug | Igepal CA-630 | Sigma-Aldrich | CAT#I8896 | |
| Chemical compound, drug | SDS | Sigma-Aldrich | CAT#05030–1 L-F | |
| chemical compound, drug | Acryl/Bisacrylamide solution | Biorad | CAT#161–0146 | |
| Chemical compound, drug | PMSF | Sigma-Aldrich | CAT#93482 | |
| Chemical compound, drug | Pepstatin A | Sigma-Aldrich | CAT#77170 | |
| Chemical compound, drug | MDL28170 | Calbiochem | CAT#208722 | |
| Chemical compound, drug | Calpain 1 | Calbiochem | CAT#208712 | |
| Chemical compound, drug | Bay K8644 | Sigma-Aldrich | CAT# B112 | |
| chemical compound, drug | CNQX | Sigma-Aldrich | CAT# C127 | |
| Chemical compound, drug | DIOA | Sigma-Aldrich | CAT# D129 | |
| Chemical compound, drug | Veratridine | Sigma-Aldrich | CAT# V5754 | |
| Chemical compound, drug | AP5 | Tocris | CAT# 3693/10 | |
| Chemical compound, drug | PCPz | Tocris | CAT# 3287/100 | |
| Chemical compound, drug | Riluzole | Tocris | CAT# 0768/25 | |
| Chemical compound, drug | 4,9-ah-TTX | Focus Biomolecules | CAT# 10–3700 | |
| Strain, strain background (Rattus norvegicus) | Wistar rats | Charles River Laboratories | RRID:RGD_2308816 | |
| Software, algorithm | pClamp v10.3 | Molecular Devices | RRID:SCR_011323 | |
| Software, algorithm | ImageJ v1.50i | https://imagej.nih.gov/ij/ | RRID:SCR_003070 | |
| Software, algorithm | FluoView v5.0 | Olympus | RRID:SCR_014215 | |
| Software, algorithm | Image Lab v5.1 | Bio-Rad | RRID:SCR_014210 | |
| Software, algorithm | Graphpad Prism | Prism | RRID:SCR_002798 | |
| Other | Vibrating microtome | Leica | VT1000S RRID:SCR_016495 | |
| Other | Temperature controller | Warner Instruments | CL-100 | |
| Other | Nikon Eclipse microscope | Nikon | E600FN | |
| Other | Confocal microscope | Zeiss | LSM510 | |
| Other | Infrared-sensitive CCD camera | Hitachi | KP-200/201 | |
| Other | Digidata 1440a interface | Molecular Devices | N/A | |
| Other | Multiclamp 700B amplifier | Molecular Devices | N/A | |
| Other | Borosilicate glass capillaries | World Precision Instruments | CAT# TW150-4 | |
| Other | Sutter P-97 puller | Sutter Instruments | RRID:SCR_016842 | |
| Other | Knittel Glass coverslips | Dutscher | CAT# 900529 | |
| Other | Polysine slides | Thermoscientific | CAT# P4981 | |
| Other | Small Animal Ventilator | CWE | SAR-830/AP | |
| Other | Cardiotachometer | CWE | CT-1000 | |
| Other | Chemidoc imaging system XRS+ | Bio-rad | RRID:SCR_014210 |
Additional files
Download links
A two-part list of links to download the article, or parts of the article, in various formats.
Downloads (link to download the article as PDF)
Open citations (links to open the citations from this article in various online reference manager services)
Cite this article (links to download the citations from this article in formats compatible with various reference manager tools)
Calpain fosters the hyperexcitability of motoneurons after spinal cord injury and leads to spasticity
eLife 8:e51404.
https://doi.org/10.7554/eLife.51404


