Bottom-up and top-down neural signatures of disordered multi-talker speech perception in adults with normal hearing
- Massachusetts Eye and Ear Infirmary, United States
- Harvard Medical School, United States
- Bennett Statistical Consulting Inc, United States
- Harvard TH Chan School of Public Health, United States
Figures
Figure 1 with 4 supplements
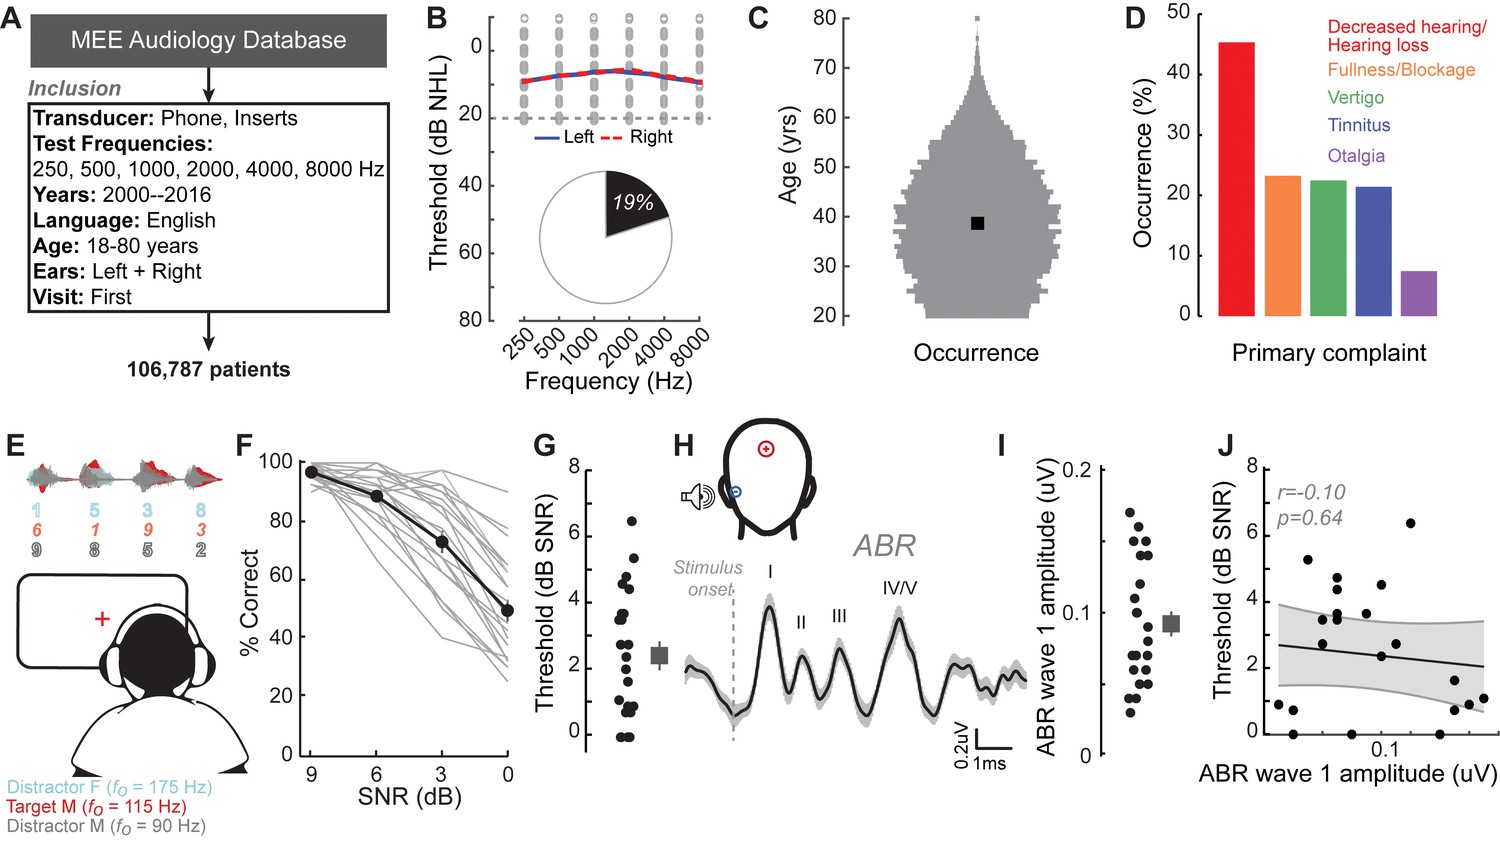
A normal audiogram does not guarantee robust speech intelligibility in everyday listening conditions.
(A) Screening criteria for eligible audiology patient records from our hospital collected between 2000 and 2016. (B) Bilateral normal audiograms, defined as thresholds better than 20 dB HL (gray dashed line) were identified in 19% of the total patient population. Average audiograms from the left (blue) and right (red) ears are shown with individual data points in gray open circles. (C) Normalized age distribution of patients with bilateral normal audiograms shows a larger percentage of younger and middle-aged patients between 20–50 years of age. Black square indicates median age of 39 years. (D) Top five primary complaints that resulted in the visit to the clinic for these patients, including perceived hearing loss or decreased hearing presenting in 45% of these patients. (E) Schematic of a multi-talker digit recognition task. Subjects (N = 23) were familiarized with a target male speaker (red) producing four digits between 1 and 9 (excluding the bi-syllabic ‘7’), while two spatially co-localized distractors, one male and one female, with F0 frequencies above and below the target speaker simultaneously spoke four digits at varying signal-to-noise ratios (SNRs). (F) Accuracy decreased as a function of SNR at variable rates and to variable degrees. Correct trials required correctly reporting all four digits. (G) Variability in individual speech reception thresholds, defined as the SNR that produced a 70.7% success rate. Value at right represents sample mean ± SEM. (H) Auditory brainstem responses measured using ear canal tiptrodes yielded robust wave one amplitudes, a marker for auditory nerve integrity. Data reflect mean ± SEM. (I) Wave one values from individual subjects (left) and mean ± SEM of the sample (right). (J) No significant associations were observed between the ABR wave one amplitudes and speech reception threshold on the multi-talker digit task. r = Pearson’s correlation, and shaded area indicates 95% confidence intervals of the regression line (black) in Figures 1–4.
-
Figure 1—source data 1
Digits comprehension thresholds and ABR wave one amplitudes.
- https://cdn.elifesciences.org/articles/51419/elife-51419-fig1-data1-v1.xlsx
Figure 1—figure supplement 1
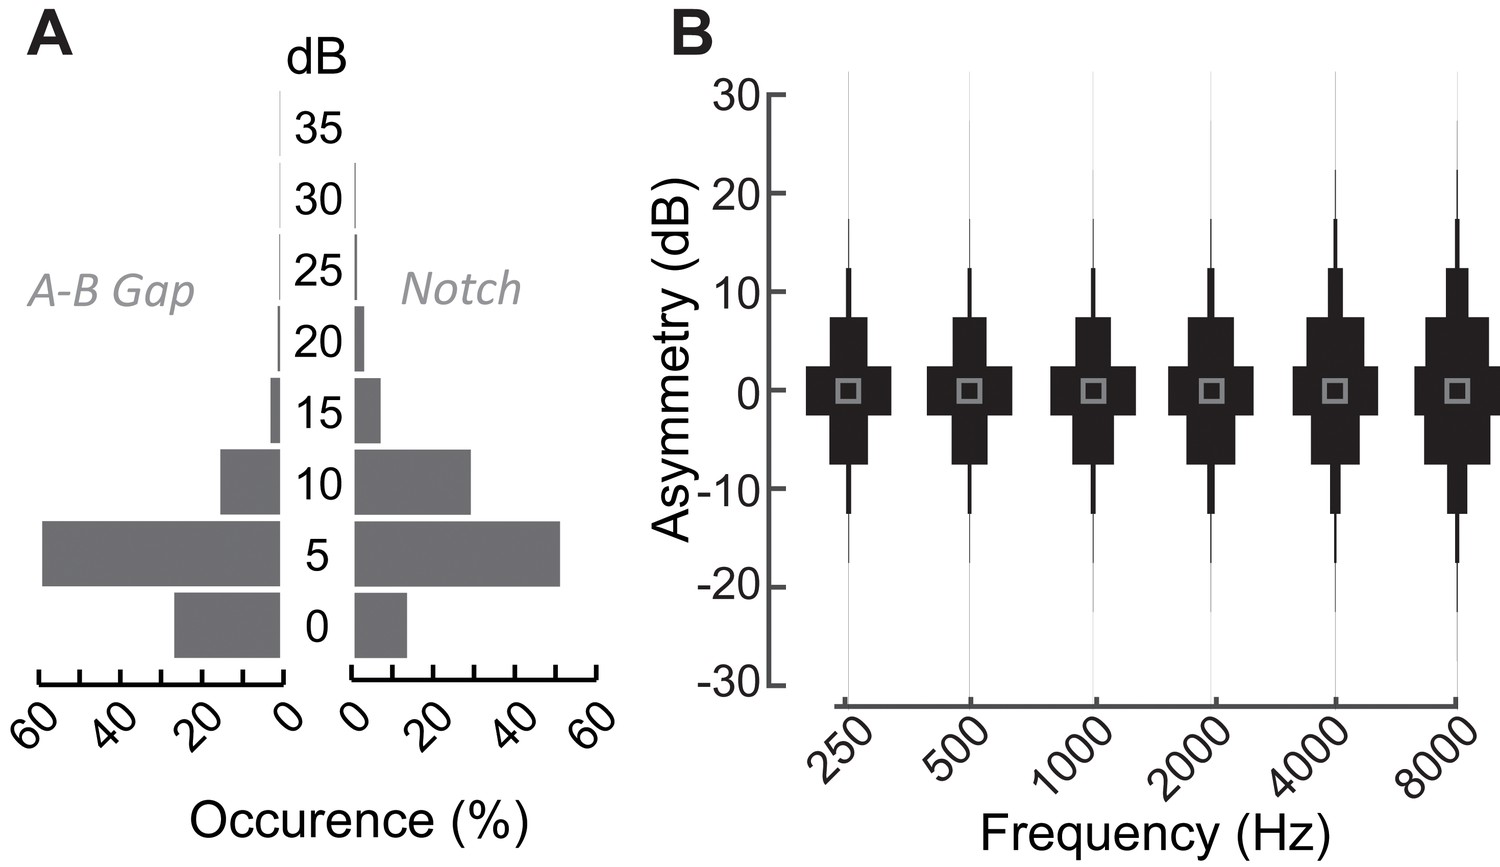
Audiometric characteristics of patients with normal audiograms that present at the Massachusetts Eye and Ear audiology clinic with complaints of poor hearing.
(A) Distribution of air-bone gaps, that is differences in pure tone thresholds measured via air conduction and bone conduction suggests the absence of any conductive hearing loss in these patients with normal audiograms at any test frequency (left). These patients also did not exhibit large focal threshold shifts (notches) in the audiograms, which are indicative of significant noise damage (right) (Fausti et al., 1981; Mehrparvar et al., 2011; Le Prell et al., 2013) (B) Normalized distribution plots of the difference in hearing thresholds between the right and left ears at the various test frequencies indicate the lack of significant between-ear asymmetries. Hence by all clinical measures of hearing, these patients coming in to the clinic with hearing difficulties are considered to be audiometrically ‘normal’.
Figure 1—figure supplement 2
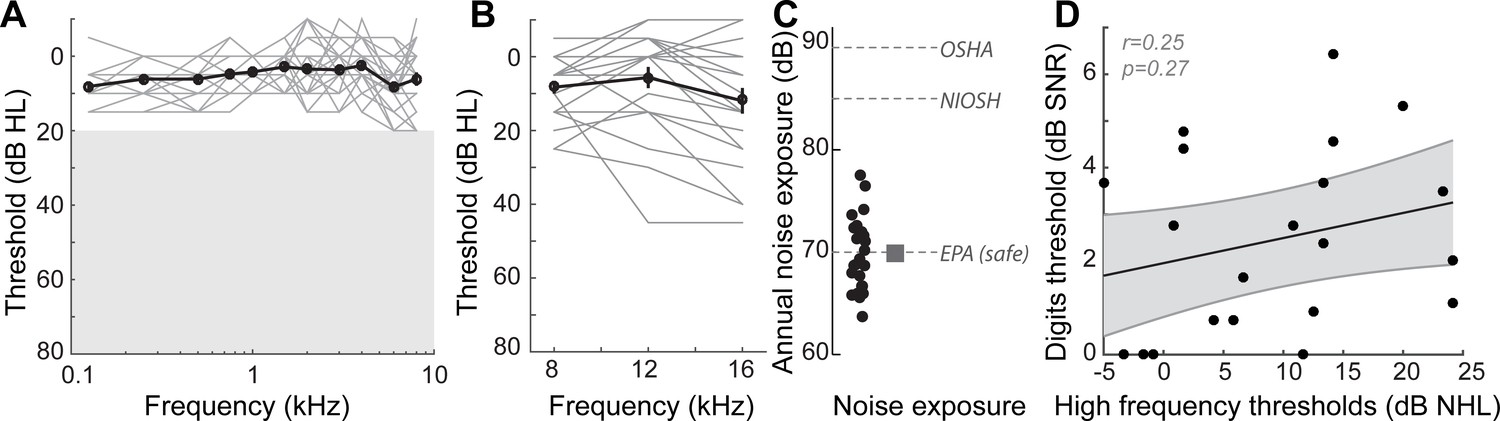
Audiometric profiles and markers of noise exposure in study participants.
(A) Audiograms from the right ear of the 23 participants in this study, indicating normal hearing thresholds for test frequencies up to 8 kHz. Similar thresholds were present in the left ear (data not shown). Individual audiograms are in gray, and the mean audiogram in black. Unshaded region represents the range of normal thresholds. (B) High frequency audiograms, considered an early marker for noise damage, showed wide variability in these individuals with normal thresholds in the lower frequencies. (C) This came as something of a surprise, as listeners reported lifetime levels of noise exposure that are deemed safe by the EPA, and well below unsafe levels recommended by OSHA and NIOSH. These data suggested that subjective self-reports of noise damage may underestimate the degree of noise damage present in these listeners and that extended high-frequency audibility may be one source of explanation for poor speech processing in noise. (D) However, the correlation between the high frequency thresholds and performance on the digits comprehension task was not statistically significant. r = Pearson’s correlation, and shaded area indicates 95% confidence intervals of the regression line (black).
-
Figure 1—figure supplement 2—source data 1
High-frequency audiometry and noise exposure questionnaire values.
- https://cdn.elifesciences.org/articles/51419/elife-51419-fig1-figsupp2-data1-v1.xlsx
Figure 1—figure supplement 3
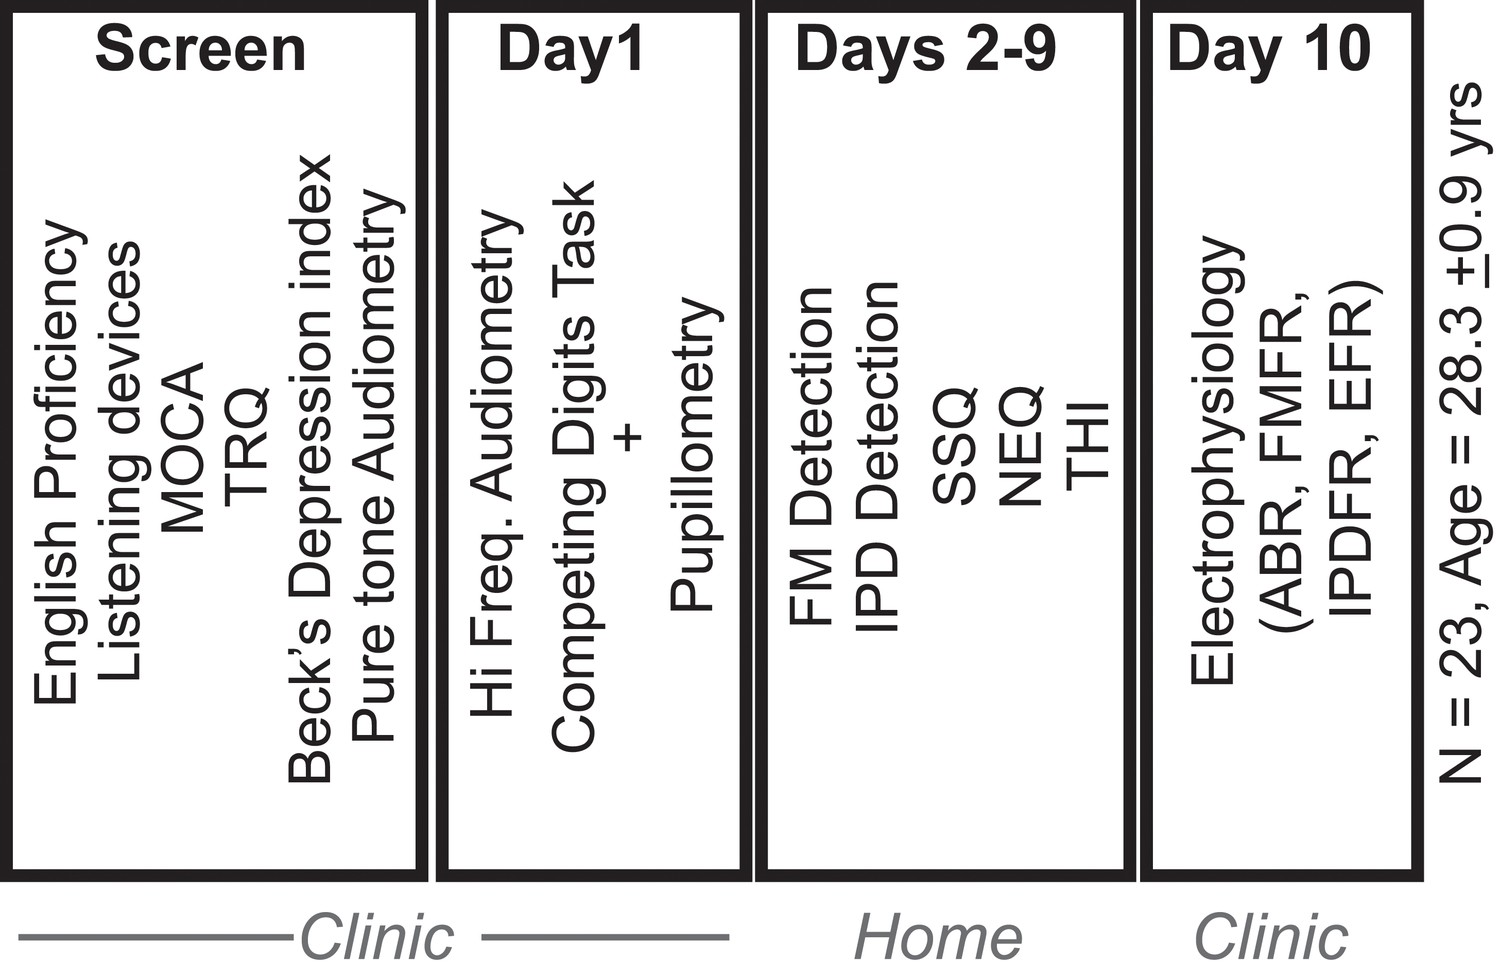
Experimental study design.
Of the 27 subjects who provided informed consent to participate in the study, 23 were found to be eligible, based on initial screening for English proficiency, use of listening devices, executive function (Montreal Cognitive Assessment, MOCA), depression (Beck’s depression index), tinnitus (Tinnitus Reaction Questionnaire, TRQ) and pure tone audiometry. Eligible participants completed a set of behavioral and physiological test in the clinic. They were then sent home with tablets and calibrated head phones to perform additional testing for 8 days. Subjects returned to the clinic with the tablet for a final day of electrophysiological testing.
Figure 1—figure supplement 4
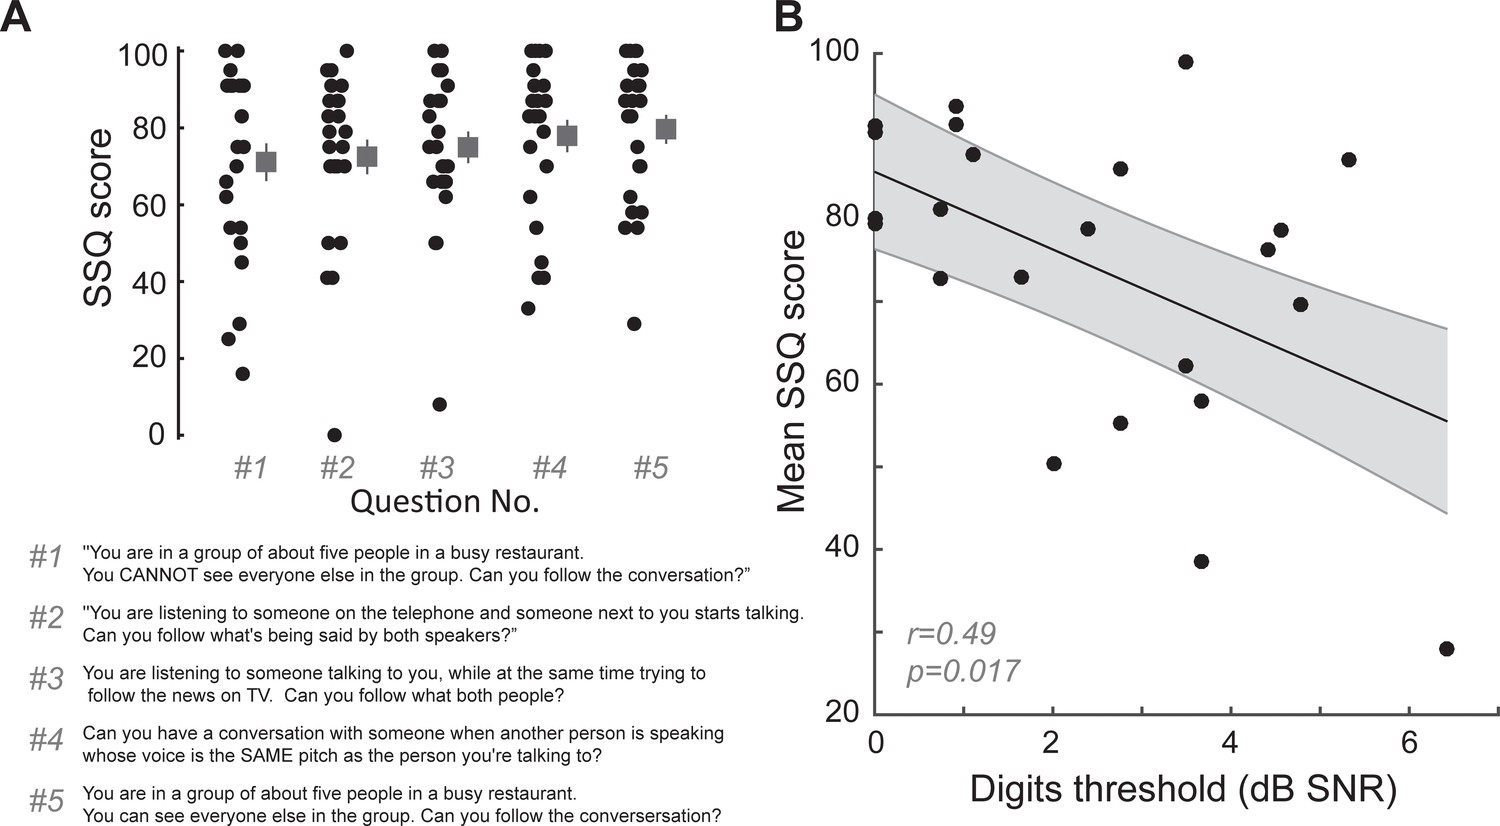
Digits comprehension task captures aspects of self-reported difficulties in real-world multi-talker listening conditions experienced by the participants.
(A) Questions related to hearing in multiple-speaker situations questions from the speech, spatial and qualities of hearing scale (SSQ) were among the top five answers that showed the maximum variability in responses in our participants. Participants answered on a sliding scale with 100 meaning ‘perfectly’ and 0 meaning ‘not at all’. (B) Mean scores on these five questions in the SSQ correlated with the participants’ performance on the digits comprehension task, indicating that the task captures self-reported difficulties of these participants in real world listening scenarios. r = Pearson’s correlation, and shaded area indicates 95% confidence intervals of the regression line (black).
-
Figure 1—figure supplement 4—source data 1
Mean values from the SSQ questionnaire.
- https://cdn.elifesciences.org/articles/51419/elife-51419-fig1-figsupp4-data1-v1.xlsx
Figure 2 with 2 supplements

Perceptual and neural processing of sTFS cues predict speech in noise intelligibility.
(A) Design of a psychophysical task to measure frequency modulation (FM) detection threshold. Participants indicated FM in a 500 Hz tone in an adaptive (2-down 1-up) two alternative forced choice task. (B) Individual (left) and average ± SEM (right) FM detection thresholds. Top and bottom five performers (~20th percentile) on the behavioral FM detection task are shown in blue and orange respectively, in panels B-C and F-I (C) FM detection thresholds were strongly predictive of speech in noise recognition threshold defined with the multi-talker digit comprehension task. (D) An objective neurophysiological measure of monaural sTFS processing was obtained using ear canal (-) and scalp (+) electrodes, and a 500 Hz tone presented with various FM deviations in alternating polarity. The averaged response was analyzed at 1000 Hz (2F) in order to minimize contributions by the cochlear microphonic and emphasize neural generators. The magnitude of the FM following response (FMFR) was computed using a heterodyne. (E) The FMFR magnitude increased as a function of FM deviation up to ~8 Hz. Inset: The FMFR magnitude was normalized by the pure tone phase-locking amplitude of each subject to minimize variability due to head size and recording conditions. (F–G) A sigmoidal fit to the normalized FMFR growth curve was used to calculate an FMFR measure of slope for each subject, by dividing the overall dynamic range of the response by the halfway point to the maximum (illustrated in (F) for the top and bottom five performers of the behavioral task). Blue and orange bars indicate the X and Y axes intercepts of the halfway point of the fit. (H–I) The neurophysiological FMFR was strongly predictive of FM detection thresholds determined with the psychophysical task (H) as well as performance on the digits comprehension task (I).
-
Figure 2—source data 1
FM detection thresholds and FMFR slope values.
- https://cdn.elifesciences.org/articles/51419/elife-51419-fig2-data1-v1.xlsx
Figure 2—figure supplement 1
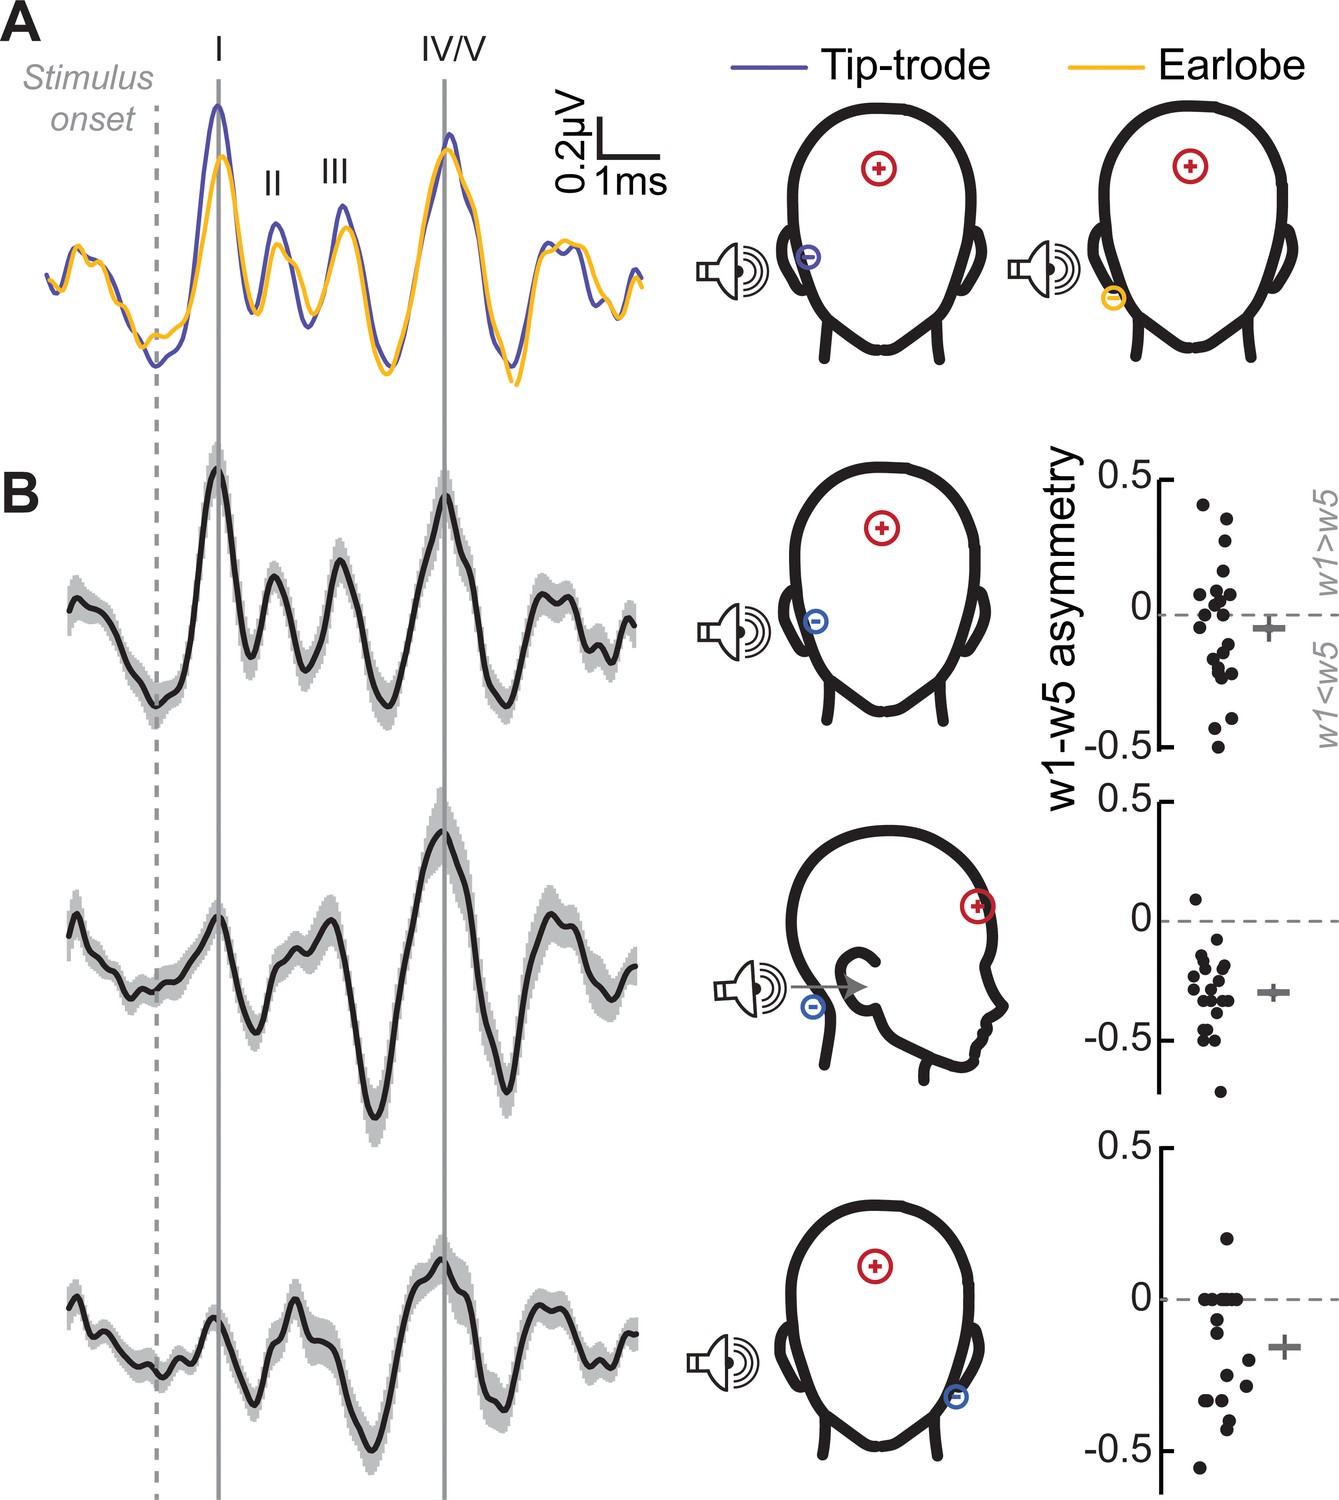
Determination of optimal electrode montages for obtaining electrophysiological responses.
(A) Grand-averaged ABRs elicited by 3 kHz tones at 105 dB SPL, and recorded simultaneously with an electrode on the ear lobe (yellow), and a gold-foil coated ‘tiptrode’ inserted in the ear canal (blue), shows greater amplitudes using tiptrodes for wave 1, with generators in the auditory nerve, but not wave 5, with midbrain generators. (B) Simultaneous multi-channel recordings reveal differential contributions from auditory generators for each electrode montage. Grand-averaged ABR waveforms (left) for three electrode montages show the differential contributions of the ABR waves for each montage, reflecting emphasis on peripheral vs. central generators. The relative amplitudes of waves 1 and 5 is characterized by the w1-w5 asymmetry index (right) with values > 0 having a larger wave 1, and values < 0 having a larger wave 5. Gray bars represent the mean asymmetry index, and error bars represent SEM.
-
Figure 2—figure supplement 1—source data 1
ABR wave 1 – wave 5 indices for various electrode montages.
- https://cdn.elifesciences.org/articles/51419/elife-51419-fig2-figsupp1-data1-v1.xlsx
Figure 2—figure supplement 2
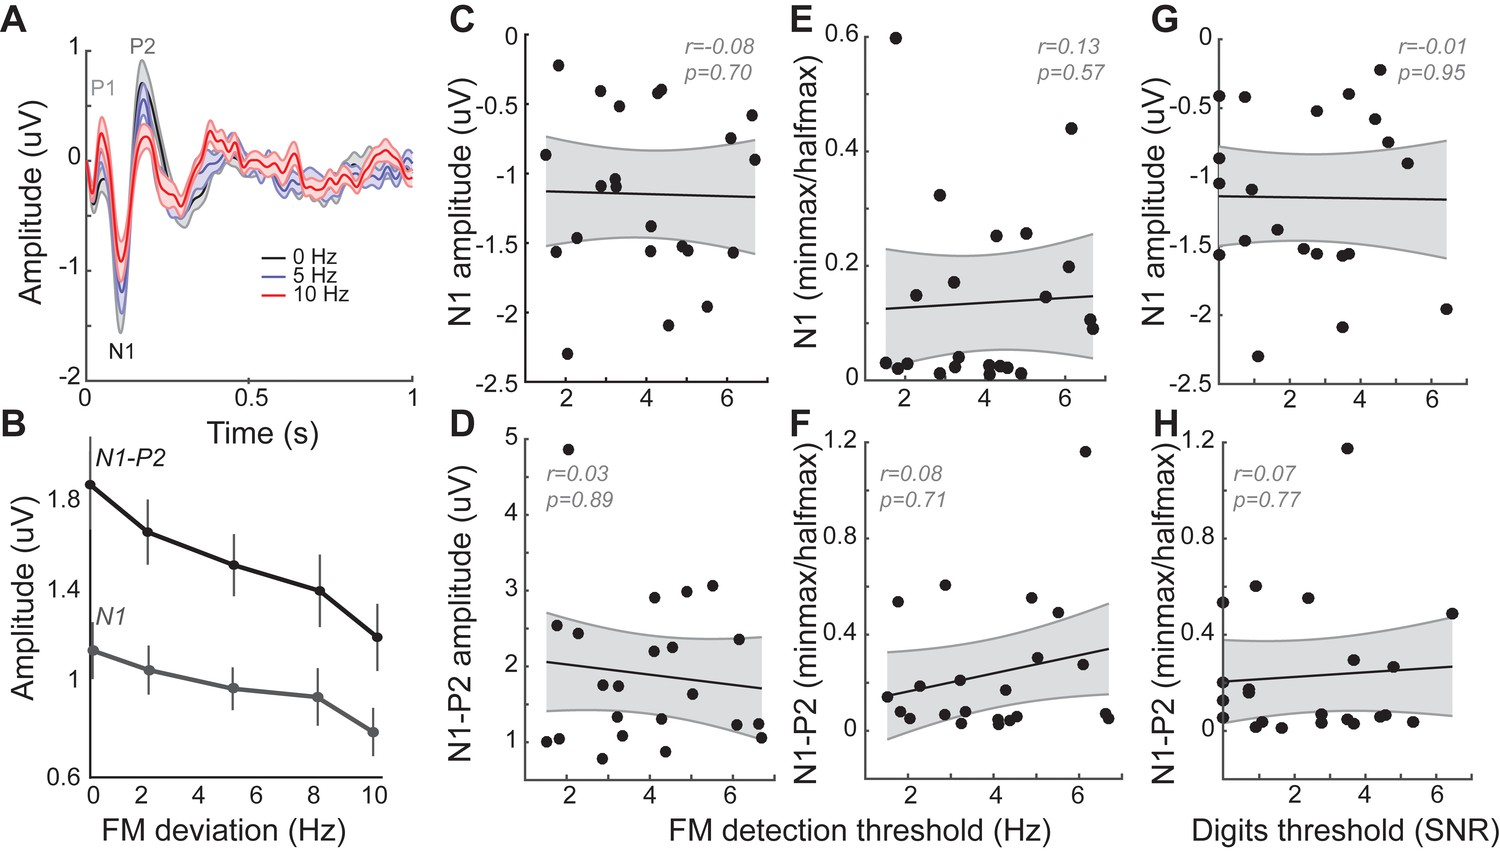
Cortical event-related potentials (ERPs) are modulated by FM stimuli, but not related to behavioral performance.
(A) Grand averaged ERPs recorded to FM tones from the Fz – tiptrode electrode montage show clear P1-N1-P2 peaks with associated latencies. (B) Peak amplitudes are modulated by FM modulation depth, with N1 amplitudes and N1-P2 amplitudes showing a decrease with larger FM deviations. (C–D) Absolute amplitudes for N1, and the N1-P2 elicited to pure tones (FM deviation of 0 Hz) were not correlated with behavioral performance on the FM detection task. (E–F) Slopes calculated from amplitude curves expressed as a fraction of the pure-tone phase-locking amplitude, in a manner similar to FMFRs (Figure 2F) were also not significantly correlated to behavioral performance on the FM task. (G–H) Neither the N1 amplitude nor the N1P2 slope were significantly correlated with performance on the digits task. These data demonstrate that whereas phase-locking to sTFS cues was significantly related to multi-talker speech perception, evoked potentials elicited by the same stimuli generated by downstream stages of auditory processing had no such relationship. However, these results should be interpreted with the caveat that the arousal states of the subjects were monitored but not controlled, and changes in arousal states can have significant effects on cortical ERP amplitudes.
-
Figure 2—figure supplement 2—source data 1
ERP measures.
- https://cdn.elifesciences.org/articles/51419/elife-51419-fig2-figsupp2-data1-v1.xlsx
Figure 3

Neural and perceptual processing of rapid temporal cues unrelated to the speech task do not predict speech recognition thresholds.
(A) Design of interaural phase difference (IPD) detection task. The phase of a 520 Hz tone instantaneously shifted from diotic (aligned interaural phase) to dichotic (variable interaural phase). Amplitude modulation (AM) at 40.8 Hz was aligned to the interaural phase shift such that the amplitude minimum coincided with the phase transition. (B) Minimal IPD detection threshold was measured in a 2-alternative forced choice task. IPD thresholds varied between 5 and 25 degrees across individual subjects (left), mean ± SEM shown at right. Top and bottom five performers on the behavioral FM detection task are shown in blue and orange respectively. (C–D) In EEG recordings, the IPD alternated between diotic and dichotic at a rate of 6.8 Hz. Fast Fourier transforms of scalp-recorded evoked responses revealed a phase-dependent IPD following response (IPDFR) at 6.8 Hz and a 40.8 Hz AM envelope following response. (E) The IPDFR magnitude was expressed as a fraction of the envelope following response for each subject to minimize variability due to head size and recording conditions. Min-max and half-max values were computed from sigmoidal fits to the normalized IPDFR growth function (Illustrated here for the top and bottom five performers on the behavioral task) (F–G) The IPDFR was strongly predictive of IPD detection thresholds (F), but not performance on the digits comprehension task (G).
-
Figure 3—source data 1
IPD detection thresholds and IPDFR slope values.
- https://cdn.elifesciences.org/articles/51419/elife-51419-fig3-data1-v1.xlsx
Figure 4 with 1 supplement
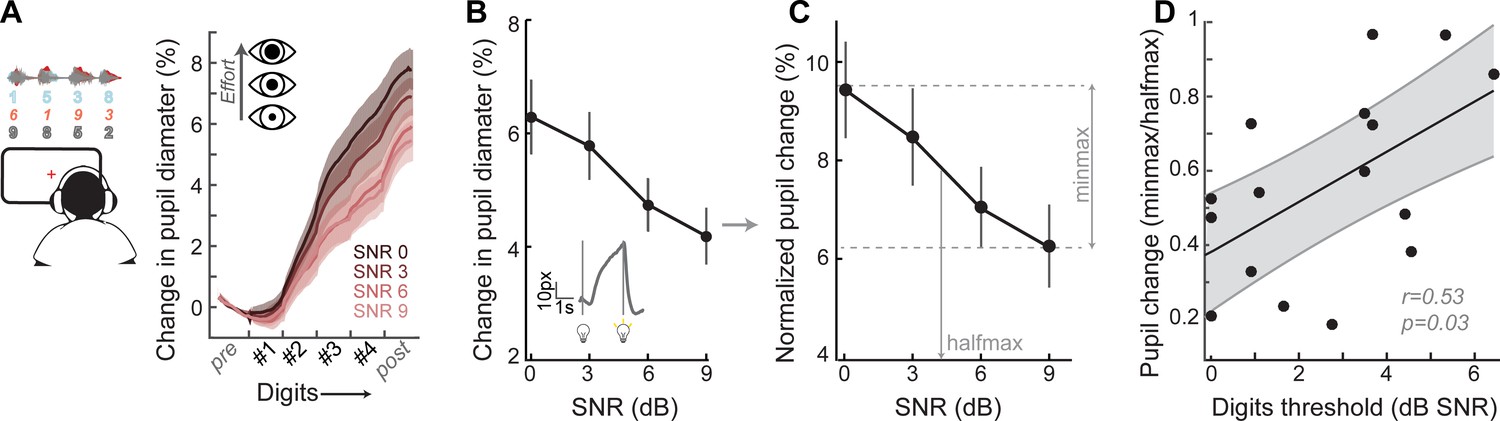
A pupil-indexed measure of effortful listening predicts multi-talker speech recognition thresholds.
(A) Fractional change in pupil diameter was measured under isoluminous conditions before, during and after the 4-digit sequence at various SNRs. (B) The peak fractional change in pupil diameter was normalized to the light-induced pupil change for each SNR (C). The SNR-dependent change in pupil diameter was calculated as the min-max/halfmax. (D) Greater recruitment of pupil-indexed effortful listening across SNRs was significantly associated with the speech intelligibility threshold. Baseline changes in pupil across the testing session, taken as a measure of listening fatigue, showed no relationship with task performance (Figure 4—figure supplement 1).
-
Figure 4—source data 1
Pupil diameter slope values.
- https://cdn.elifesciences.org/articles/51419/elife-51419-fig4-data1-v1.xlsx
Figure 4—figure supplement 1
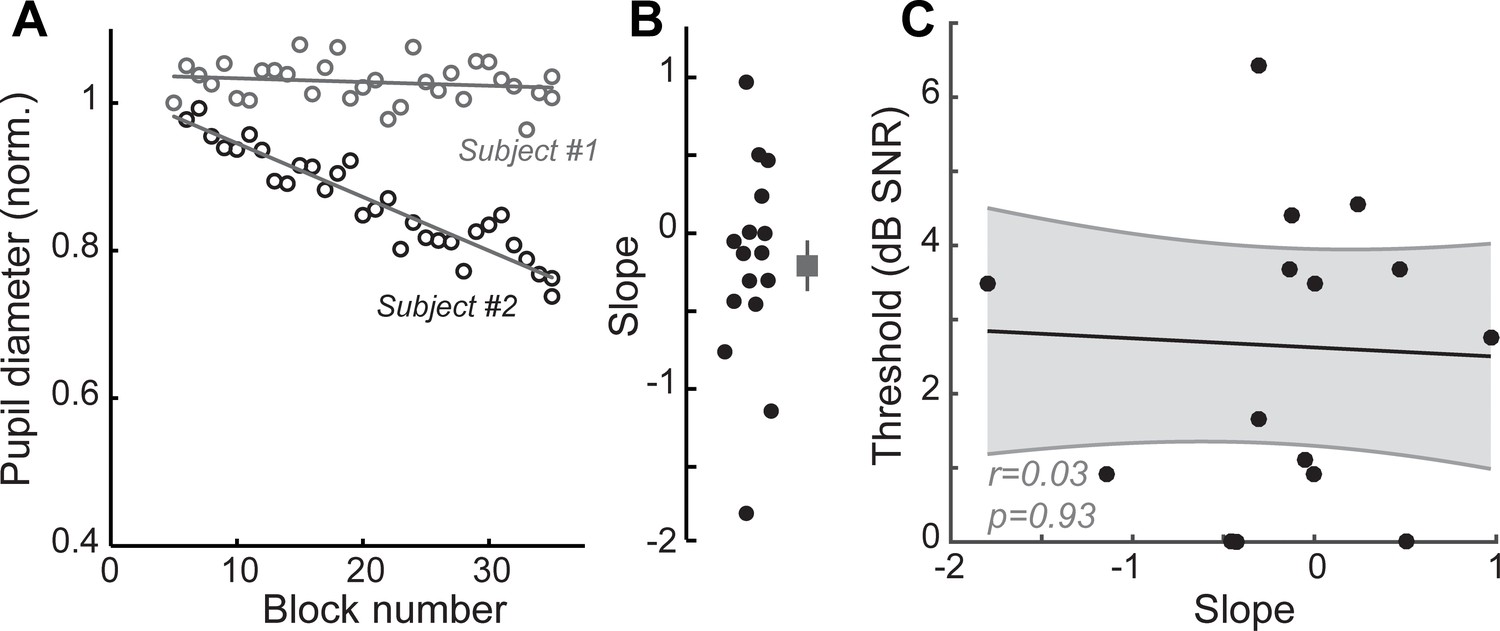
Listening fatigue does not account for performance on the multi-talker digit task.
Changes in baseline pupil diameter have been used as an index of listening fatigue (Zekveld et al., 2010; Zekveld et al., 2018). (A) Baseline pupil diameter measured over the course of successive testing blocks in the 0.5 s before trial onset shows minimal changes for one subject and a steady decrease for another. Gray lines show linear fit for each subject. (B) Calculated slope of linear fits for all subjects in the study showing the distributions of changes to baseline pupil diameter. Negative values are suggestive of listening fatigue. (C) No correlations were observed between changes in baseline pupil diameter and performance on the digits comprehension task, suggesting that listening fatigue did not contribute to changes seen in task performance. r = Pearson’s correlation, and shaded area indicates 95% confidence intervals of the regression line (black).
-
Figure 4—figure supplement 1—source data 1
Pupil slope measures as an index of listening fatigue.
- https://cdn.elifesciences.org/articles/51419/elife-51419-fig4-figsupp1-data1-v1.xlsx
Figure 5

A multiple variable linear model of bottom-up and top-down neural and behavioral markers best predicts speech intelligibility thresholds.
(A) The four neural markers studied here (ABR wave 1, FMFR, IPDFR and pupil-indexed effortful listening) were not correlated with each other. FMFR and pupil were both significantly correlated with the outcome measure, digits comprehension threshold. White asterisk indicates p<0.05 with a univariate linear regression model. (B) A multivariate regression model measuring the adjusted R2 (proportion of variance explained by predictors, adjusted for the number of predictors in the model) reveals incremental improvement in the prediction of the digits comprehension threshold when pupil, FMFR and ABR wave one amplitudes are added in succession. Adding additional neural markers to the model did not improve the total explained variance. A separate model which included behavioral FM detection thresholds improved the adjusted R2 value to 0.78 (gray). (C) All two-variable combinations were analyzed to study order effects for introducing variables into the model. The combination of pupil diameter and FMFR was still the most optimal model for explaining variance on the speech-in-noise task. Numbers indicate adjusted R2 values for each combination.
-
Figure 5—source data 1
Digits comprehension thresholds, ABR wave one amplitudes, FMFR slope values, IPDFR slope values and pupil diameter slope values used for the model.
- https://cdn.elifesciences.org/articles/51419/elife-51419-fig5-data1-v1.xlsx
Author response image 1

Relationship between bottom-up and top-down measures and their contributions to multi-talker speech intelligibility.
Author response image 2
Tonotopic contributions to the FMFR revealed using high-pass masking noise.
Additional files
Download links
A two-part list of links to download the article, or parts of the article, in various formats.
Downloads (link to download the article as PDF)
Open citations (links to open the citations from this article in various online reference manager services)
Cite this article (links to download the citations from this article in formats compatible with various reference manager tools)
Bottom-up and top-down neural signatures of disordered multi-talker speech perception in adults with normal hearing
eLife 9:e51419.
https://doi.org/10.7554/eLife.51419


