Molecular basis for catabolism of the abundant metabolite trans-4-hydroxy-L-proline by a microbial glycyl radical enzyme
- Department of Chemistry, Massachusetts Institute of Technology, United States
- Department of Chemistry and Chemical Biology, Harvard University, United States
- Department of Biology, Massachusetts Institute of Technology, United States
- Howard Hughes Medical Institute, Massachusetts Institute of Technology, United States
Figures
Figure 1 with 2 supplements
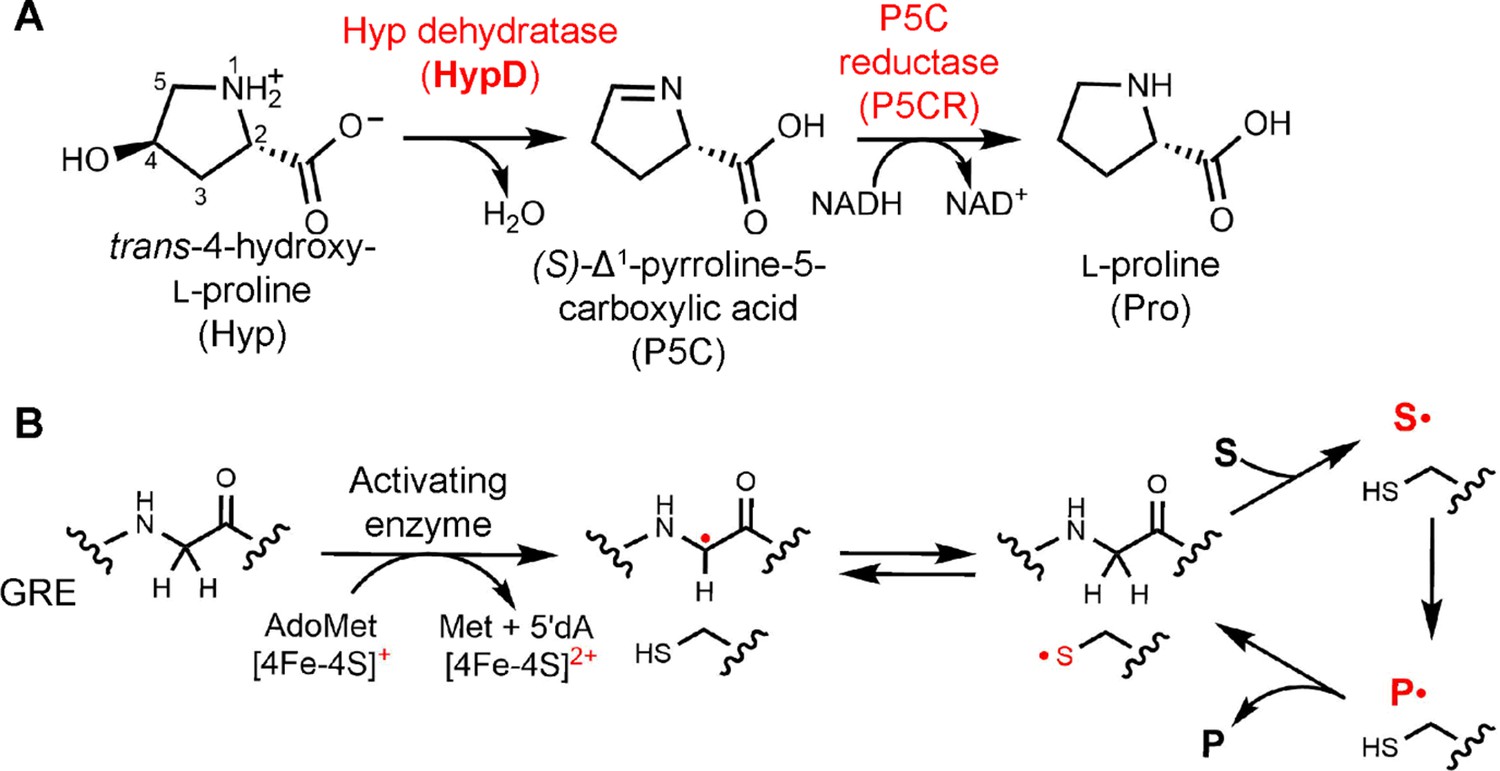
Hyp dehydration is catalyzed by the GRE HypD in a prominent gut microbial metabolic pathway.
(A) Anaerobic microbial metabolism of trans-4-hydroxy-l-proline (Hyp) is catalyzed by Hyp dehydratase (HypD), a glycyl radical enzyme (GRE). The product of this transformation, (S)-Δ1-pyrroline-5-carboxylate (P5C), is an intermediate in many primary metabolic pathways. Hyp can be used to generate ATP for energy metabolism, converted to other amino acids for protein synthesis, and catabolized to form sources of carbon and nitrogen. (B) General mechanism proposed for GREs. A [4Fe-4S]-cluster dependent radical S-adenosylmethionine (AdoMet) activating enzyme (AE) generates a radical species on a conserved glycine residue in the GRE, using S-adenosylmethionine and an electron, and forming 5'-deoxyadenosine (5'dA) and methionine. The glycyl radical generates a thiyl radical species on a conserved Cys, and this thiyl radical initiates catalysis by abstracting a hydrogen atom from the substrate (S). Upon product (P) formation, the thiyl radical is regenerated to complete the catalytic cycle.
Figure 1—figure supplement 1
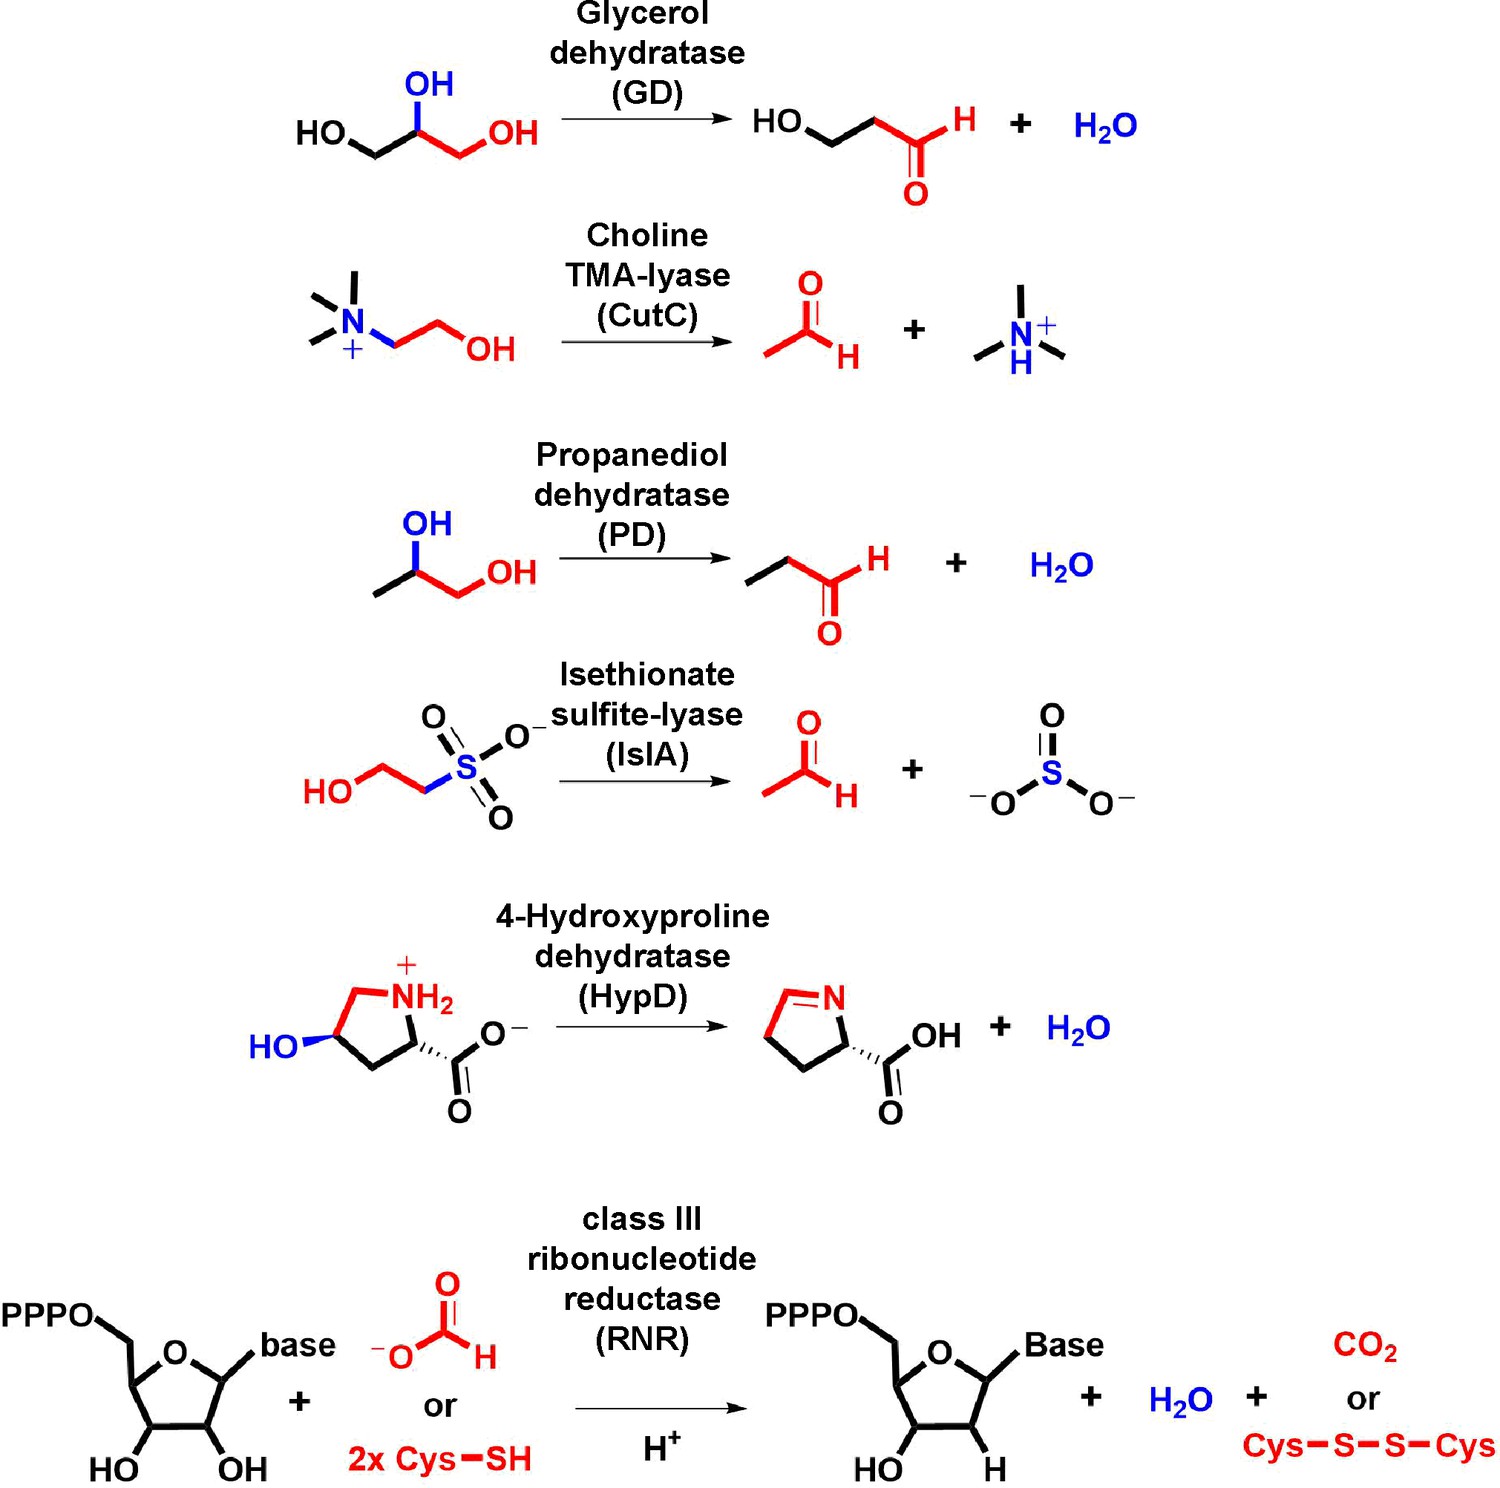
Transformations catalyzed by GRE eliminases.
The moieties undergoing oxidation to drive elimination are highlighted in red. The eliminated functional group and the bond undergoing cleavage are highlighted in blue.
Figure 1—figure supplement 2

Enzymatic transformations involving 5-membered heterocyclic substrates.
The scaffolds undergoing oxidation to drive elimination are highlighted in red. The eliminated functional group and the bond undergoing cleavage are highlighted in blue.
Figure 2 with 3 supplements
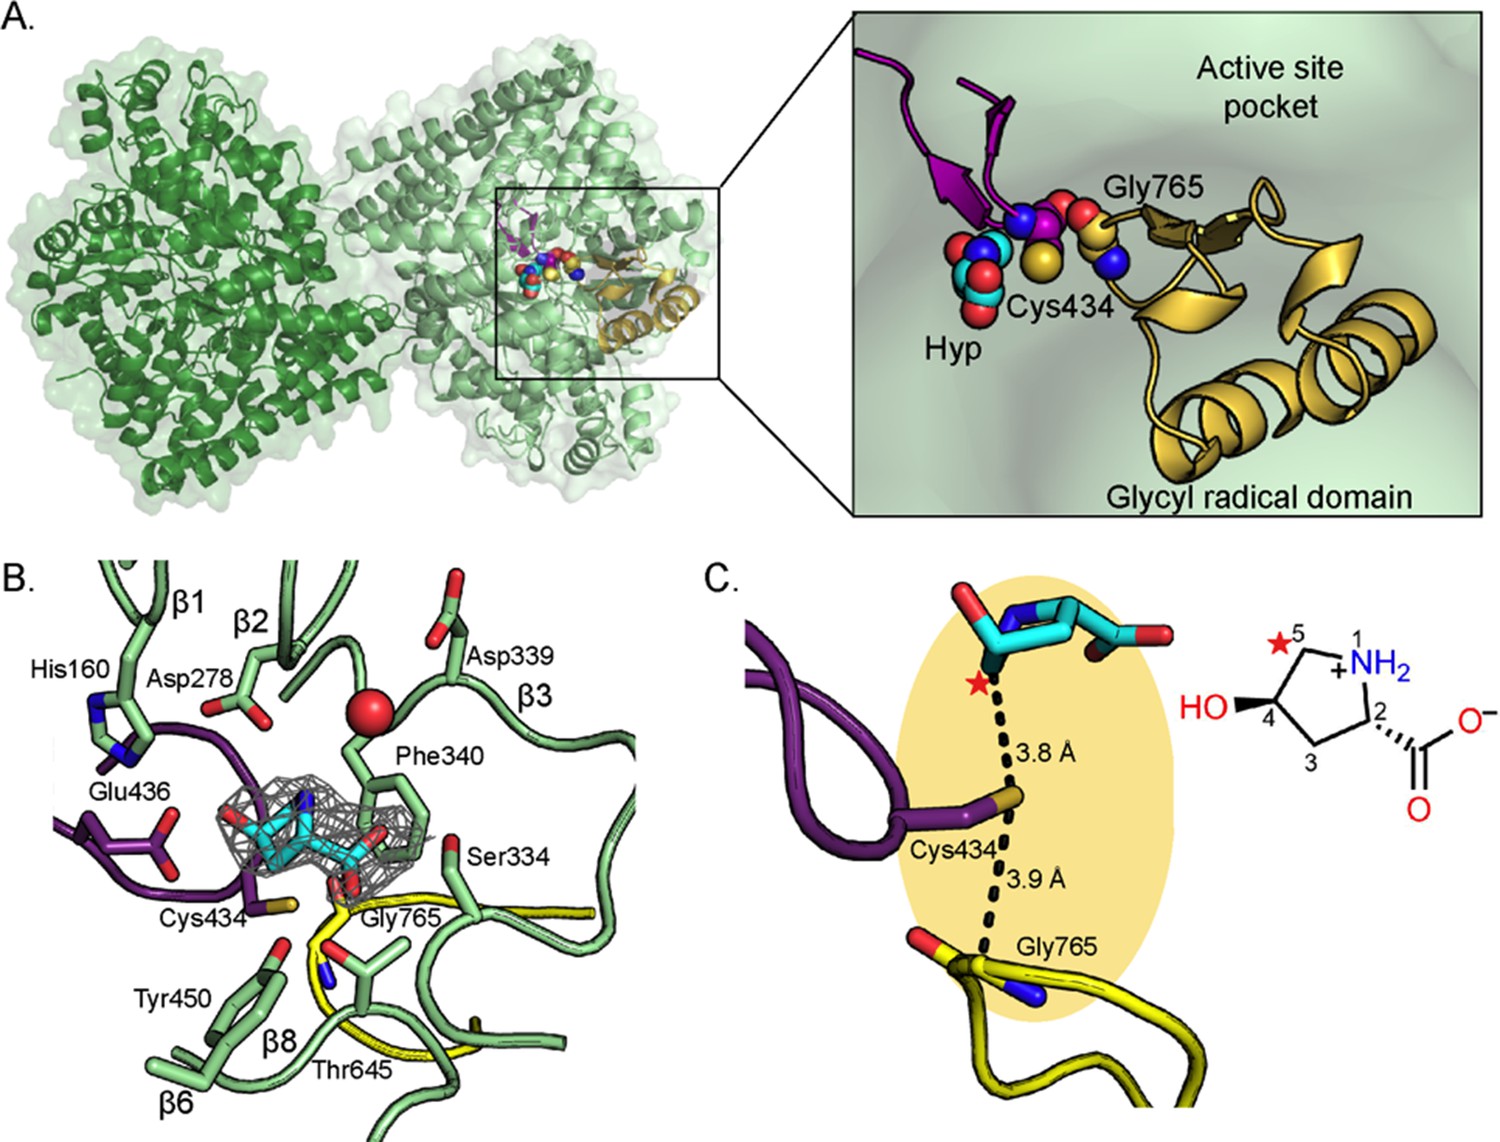
Structure of C. difficile HypD with Hyp bound.
(A) Dimeric structure of HypD (green) with the glycyl radical domain that houses the Gly loop in yellow and the Cys loop in purple. Gly765, Cys434, and Hyp are shown in spheres. (B) 2Fo-Fc maps (contoured at 1.0σ, gray) indicate electron density for Hyp. Hyp is positioned above the Gly loop (yellow) and Cys loop (purple) with residues from the strands of the β-barrel (green) forming the sides of the active site. A water molecule is shown as red sphere. (C) C5 of HypD (starred) is the closest atom to the catalytic Cys (Cys434), which is found in the active site within van der Waals distance of Gly765, the site of the glycyl radical. See Figure 8A for additional distances between Hyp and Cys434.
-
Figure 2—source data 1
Cartesian coordinates for zwitterionic Hyp in Cγ-exo pucker calculated from DFT.
Coordinates of zwitterionic Hyp structure used to fit into the HypD crystal structure.
- https://cdn.elifesciences.org/articles/51420/elife-51420-fig2-data1-v1.xlsx
-
Figure 2—source data 2
Cartesian coordinates for zwitterionic Hyp in Cγ-endo pucker calculated from DFT.
Coordinates of zwitterionic Hyp structure used to fit into the HypD crystal structure.
- https://cdn.elifesciences.org/articles/51420/elife-51420-fig2-data2-v1.xlsx
Figure 2—figure supplement 1
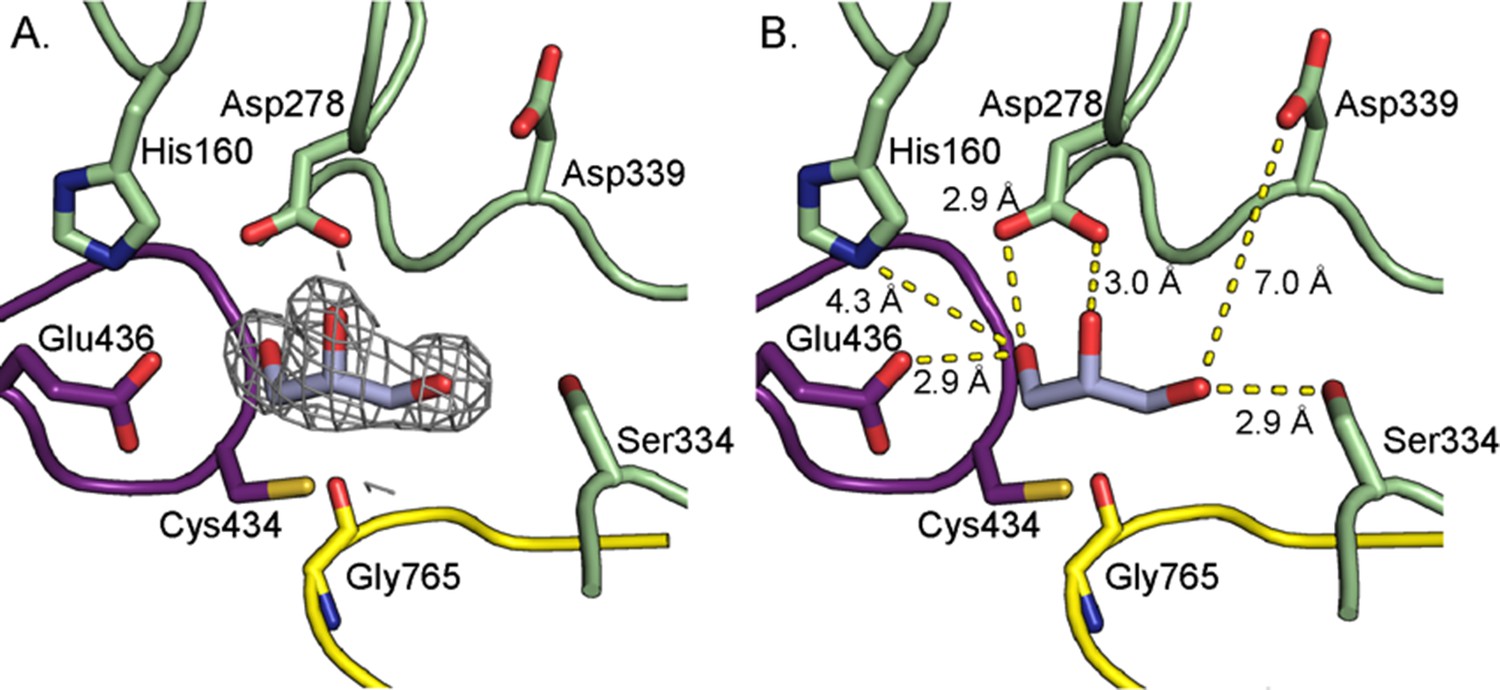
A 2.05 Å resolution structure of HypD with glycerol bound in the active site.
(A) 2Fo-Fc maps (contoured at 1.0σ, gray) indicate electron density for glycerol. (B) Distances between glycerol hydroxyl groups and nearby residues are indicated. Water molecules are not shown.
Figure 2—figure supplement 2
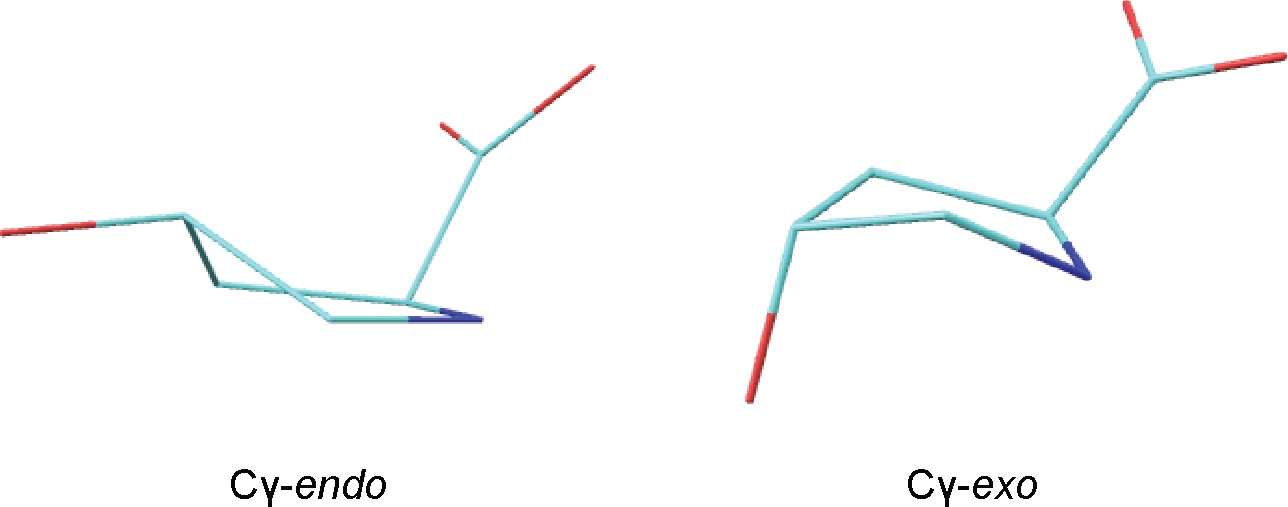
HypD conformers generated by DFT calculations.
Structures of zwitterionic Hyp obtained for Cγ-endo and Cγ-exo puckered states. Cartesian coordinates are provided in source data.
Figure 2—figure supplement 3
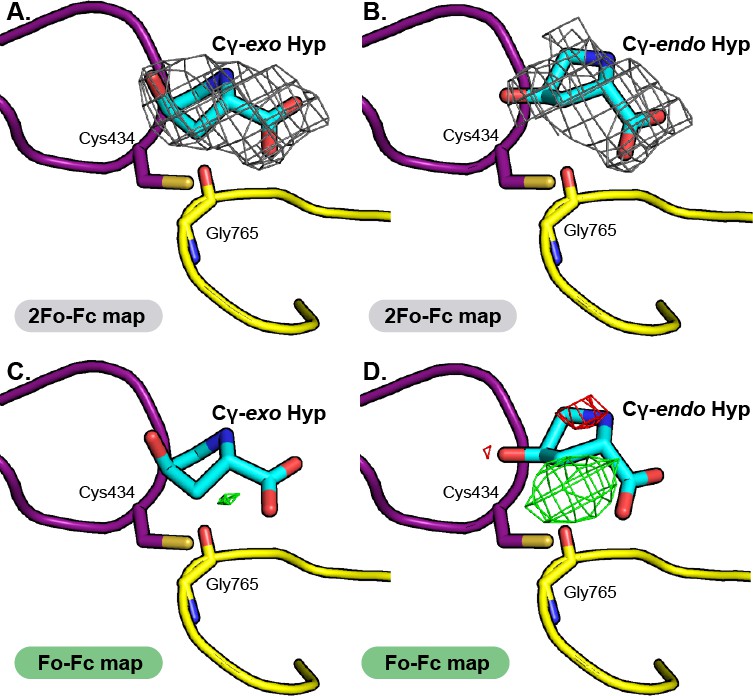
Comparison of electron density maps for Cγ-exo Hyp versus Cγ-endo Hyp modeled into HypD active site.
2Fo-Fc maps (contoured at 1.0σ, gray) indicate electron density for substrate in both (A) Cγ-exo Hyp and (B) Cγ-endo Hyp pucker states. Conformers were restrained to the calculated optimal conformation of each pucker. 2Fo-Fc maps show cleaner electron density for Hyp modeled in the Cγ-exo conformation. Fo-Fc maps (contoured at 3.0σ, positive difference density in green, negative difference density in red), for (C) Cγ-exo Hyp and (D) Cγ-endo Hyp further supports the modeling of Hyp in the Cγ-exo pucker. Positive difference density in Fo-Fc maps indicates that atoms should be modeled into the structure at that location; negative difference density indicates that atoms have been modelled into the structure at this location that are inconsistent with the diffraction data.
Figure 3 with 4 supplements

Active site of HypD has unique features that enable Hyp dehydration.
Conserved Gly and Cys loops in addition to active site residues are displayed for (A) HypD, (B) GD, and (C) CutC. PDB-deposited structures for GD (1R9D) and CutC (5FAU) were used to generate this figure. The Cys loop is highlighted in purple and the Gly loop is highlighted in yellow. Hydrogen bonds are shown as black dashed lines and CH–O interactions as yellow dashed lines. Aromatic residues in the active sites of HypD (D), GD (E), and CutC (F) aid in substrate packing.
Figure 3—figure supplement 1

Dihedral angles of substrates bound in GRE eliminases.
Dihedral angle between the departing group and the C1 hydroxyl group is displayed for (A) glycerol (GD, PDB: 1R9D), (B) (S)−1,2-propanediol, (PD, PDB: 5I2G), and (C) choline (CutC, PDB: 5FAU). Dihedral angle between the departing C4 hydroxyl group and the amino group is displayed for (D) Hyp in Cγ-exo pucker (HypD).
Figure 3—figure supplement 2
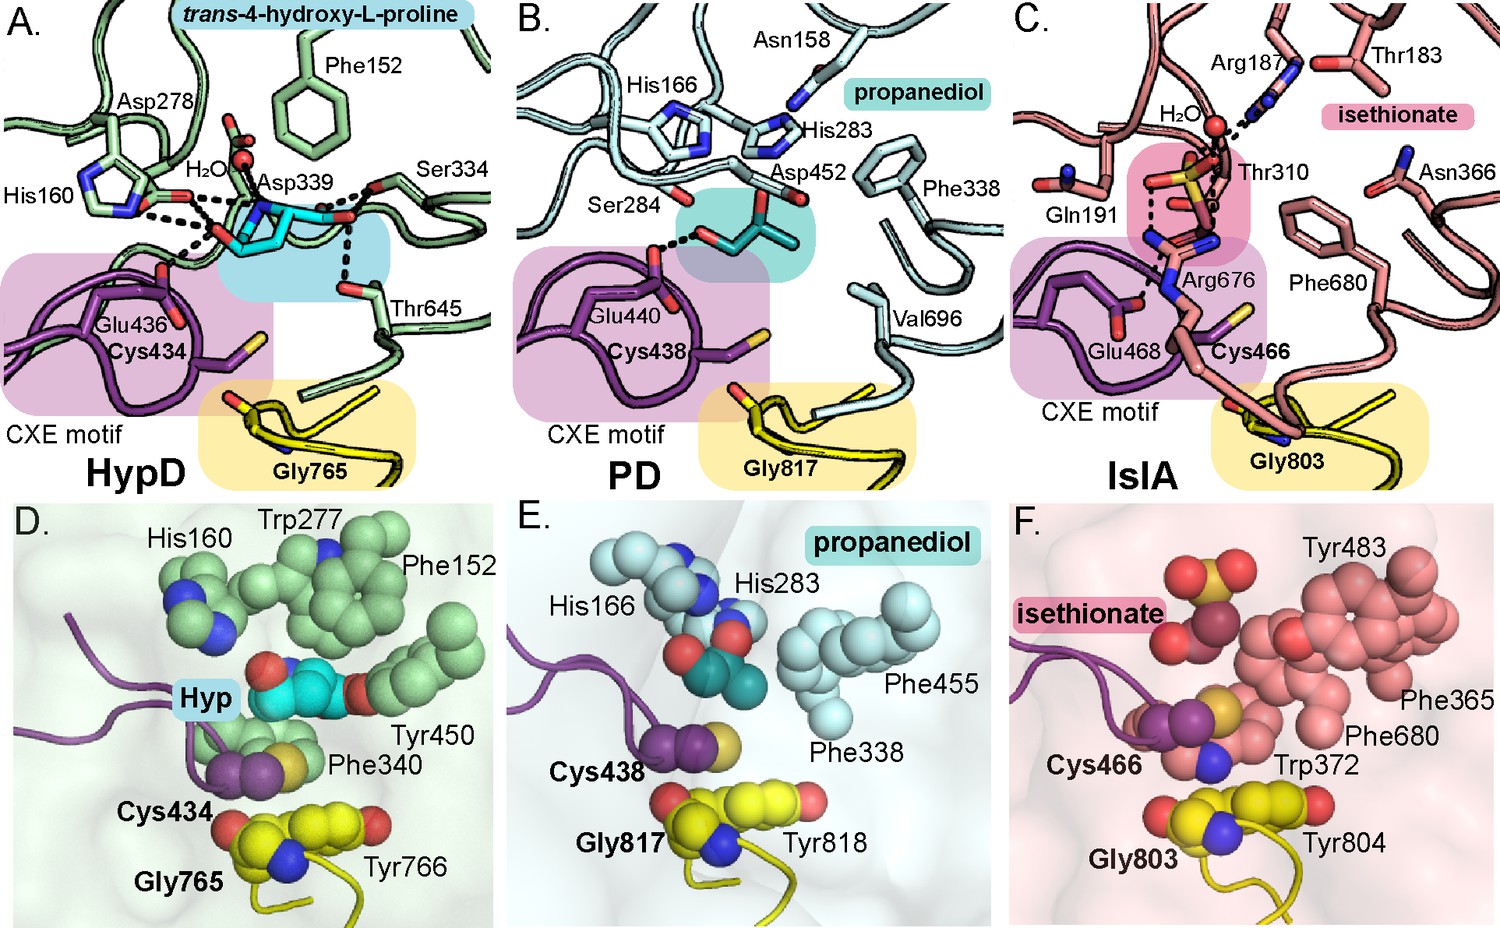
Active sites of propanediol dehydratase (PD) and isethionate sulfite-lyase (IslA) compared to HypD.
Conserved Gly and Cys loops in addition to active site residues are displayed for (A) HypD, (B) PD, and (C) IslA. PDB-deposited structures for PD (5I2G) and IslA (5YMR) were used to generate this figure. The Cys loop is highlighted in purple and the Gly loop is highlighted in yellow. Hydrogen bonds are shown as black dashed lines. Aromatic residues in the active sites of (D) HypD, (E) PD, and (F) IslA aid in substrate packing. These figures are shown in same orientations as those seen in Figure 3A–F.
Figure 3—figure supplement 3

Proposed mechanism for CutC elimination reaction.
Ketyl radical intermediate for CutC is highlighted. Similar ketyl radical species have been proposed for GD and PD mechanisms.
Figure 3—figure supplement 4
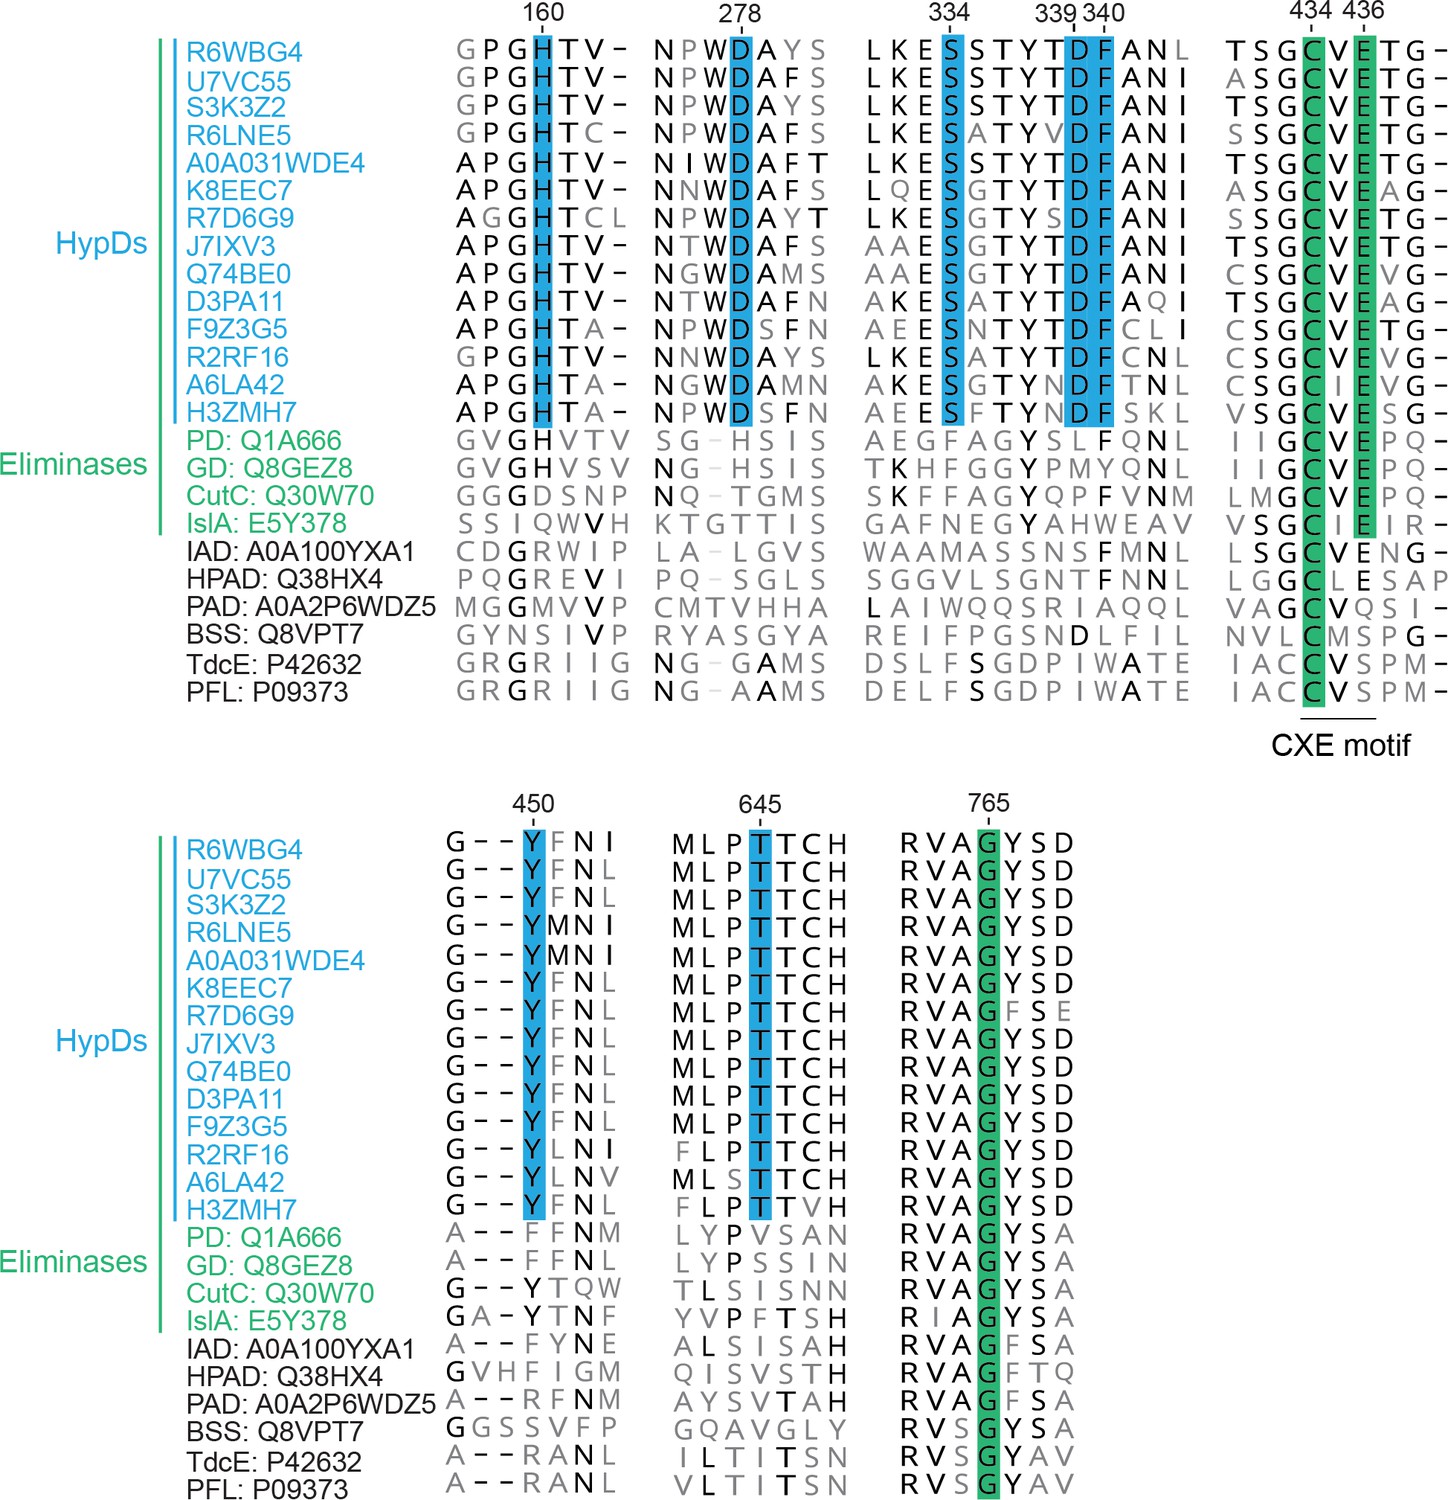
A multiple sequence alignment of putative HypDs with characterized GREs.
A multiple sequence alignment of characterized GREs and putative HypDs selected to cover a wide range of phylogenetic diversity. Residues conserved among GRE dehydratases are highlighted in green. Conserved residues observed to be in the active site of HypD are highlighted in blue. Conserved amino acids, among HypDs but not among all other GRE eliminases, are displayed in bold. UniProt accession codes are listed for each sequence with residue numbering based on HypD from C. difficile (A0A031WDE4). Sequences were aligned by MAFFT (Katoh and Standley, 2013).
Figure 4
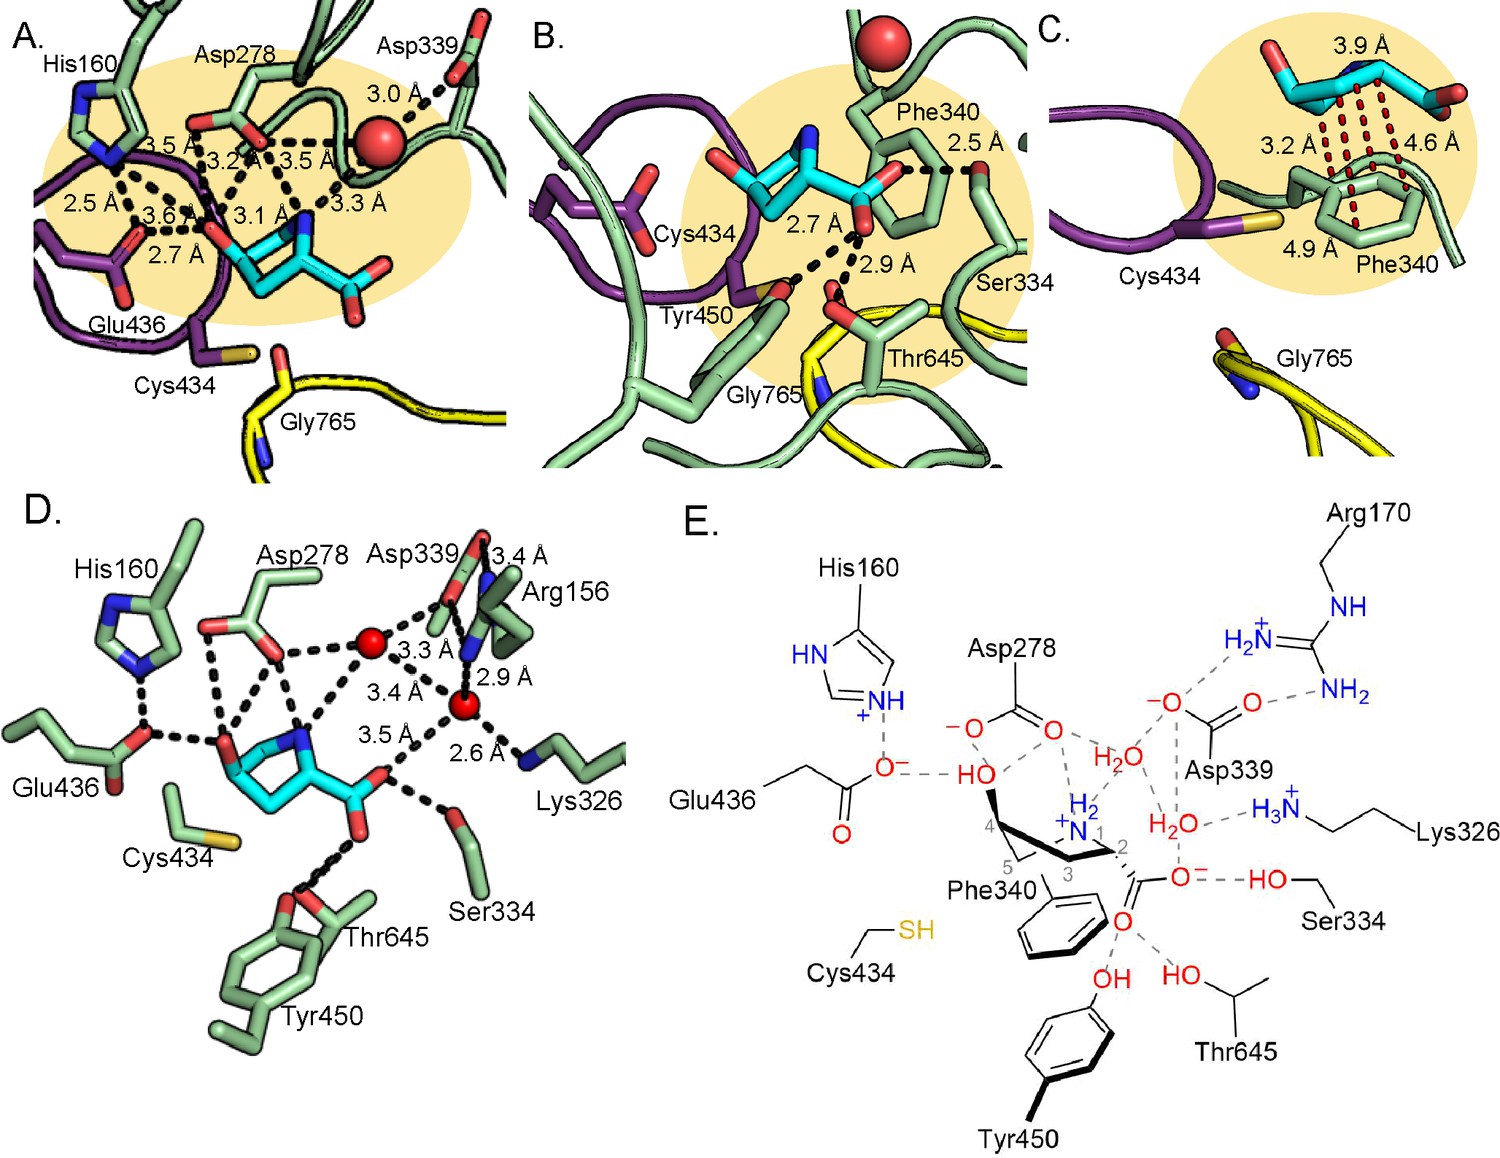
Hydrogen bonding and proline-aromatic interactions with nearby residues and bound water molecules allow for HypD chemistry.
(A) Residues and ordered water molecule (red sphere) that are within hydrogen bonding distance to the hydroxyl and amine of Hyp shown with corresponding distances. (B) Residues within hydrogen bonding distance of the carboxylate group of Hyp. (C) Phe340 is positioned such that it could make proline-aromatic interactions (shown as red dashed line) with Hyp. (D) An extended hydrogen bonding network among Hyp, protein residues, and water molecules (red spheres) is observed in the active site. (E) Diagram of protein and water interactions with Hyp. All hydrogen bonds are indicated with gray dashed lines. Distances (Å) can be found in panels A-D.
Figure 5 with 3 supplements

Most HypD variants do not have detectable activity.
(A) An in vitro coupled enzyme endpoint assay was used to measure activity of HypD variants. P5C generated from HypD activity was reduced to Pro by P5CR in assay mixtures. Pro and Hyp were quantified using LC-MS/MS. (B) Pro concentrations in assay mixtures after incubation for 21 hr. (C) Hyp concentrations in assay mixtures after incubation for 21 hr. Data points represent mean ± SD with n = 3 replicates. Individual data points are displayed for each assay (n = 3 individual experiments) along with the mean and SD.
-
Figure 5—source data 1
Quantification of Pro and Hyp after HypD coupled assay using LC-MS/MS.
- https://cdn.elifesciences.org/articles/51420/elife-51420-fig5-data1-v1.xlsx
-
Figure 5—source data 2
Source data for kinetic analysis of HypD-Y450F and HypD-T645A enzyme variants.
Individual data points for glycyl radical-normalized kobs values of HypD-Y450F and HypD-T645A variants in the HypD coupled assay (scheme shown in Figure 5—figure supplement 2A). These values were used to plot Michaelis-Menten kinetic curves in Figure 5—figure supplement 2B (HypD-Y450F) and Figure 5—figure supplement 2C (HypD-T645A). Figure 6—source data 1. LC-MS/MS data for HypD D2O assay and HypD assay using 2,5,5-D3-Hyp as substrate. LC-MS/MS and calculated percentages of total ions calculated for commercial standard of Pro diluted in D2O and for HypD coupled assays run in D2O, described in Figure 6. The mass 116.1 corresponds to the precursor undeuterated Pro ion, and the fragment 70.1 corresponds to the mass of Pro ion after fragmentation of the carboxylate group. These data were used to calculate average deuterium incorporation in Pro commercial standard in D2O and Pro generated by HypD reaction run in D2O, both presented in Figure 6C.
- https://cdn.elifesciences.org/articles/51420/elife-51420-fig5-data2-v1.xlsx
Figure 5—figure supplement 1
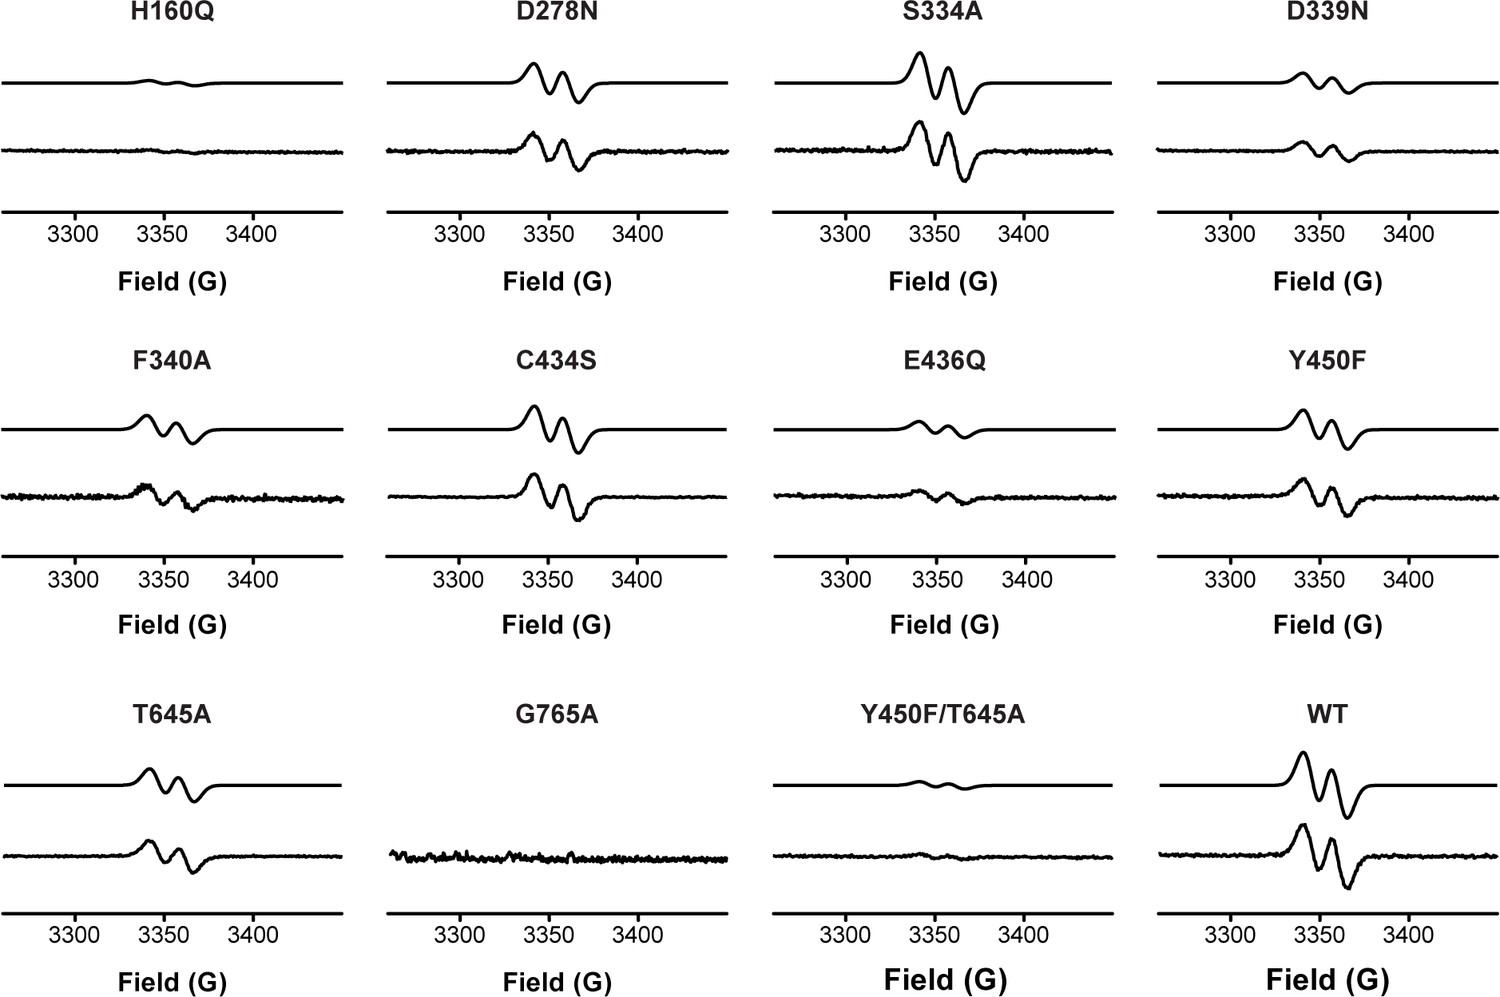
Activation of HypD variants detected by EPR spectroscopy.
Glycyl radical formation was quantified by EPR spectroscopy for all HypD variants and wild-type. Representative EPR spectra are shown here for each variant. Both simulated (top trace) and experimental (bottom trace) spectra are displayed for each HypD protein. HypD variants are ordered by residue number.
Figure 5—figure supplement 2
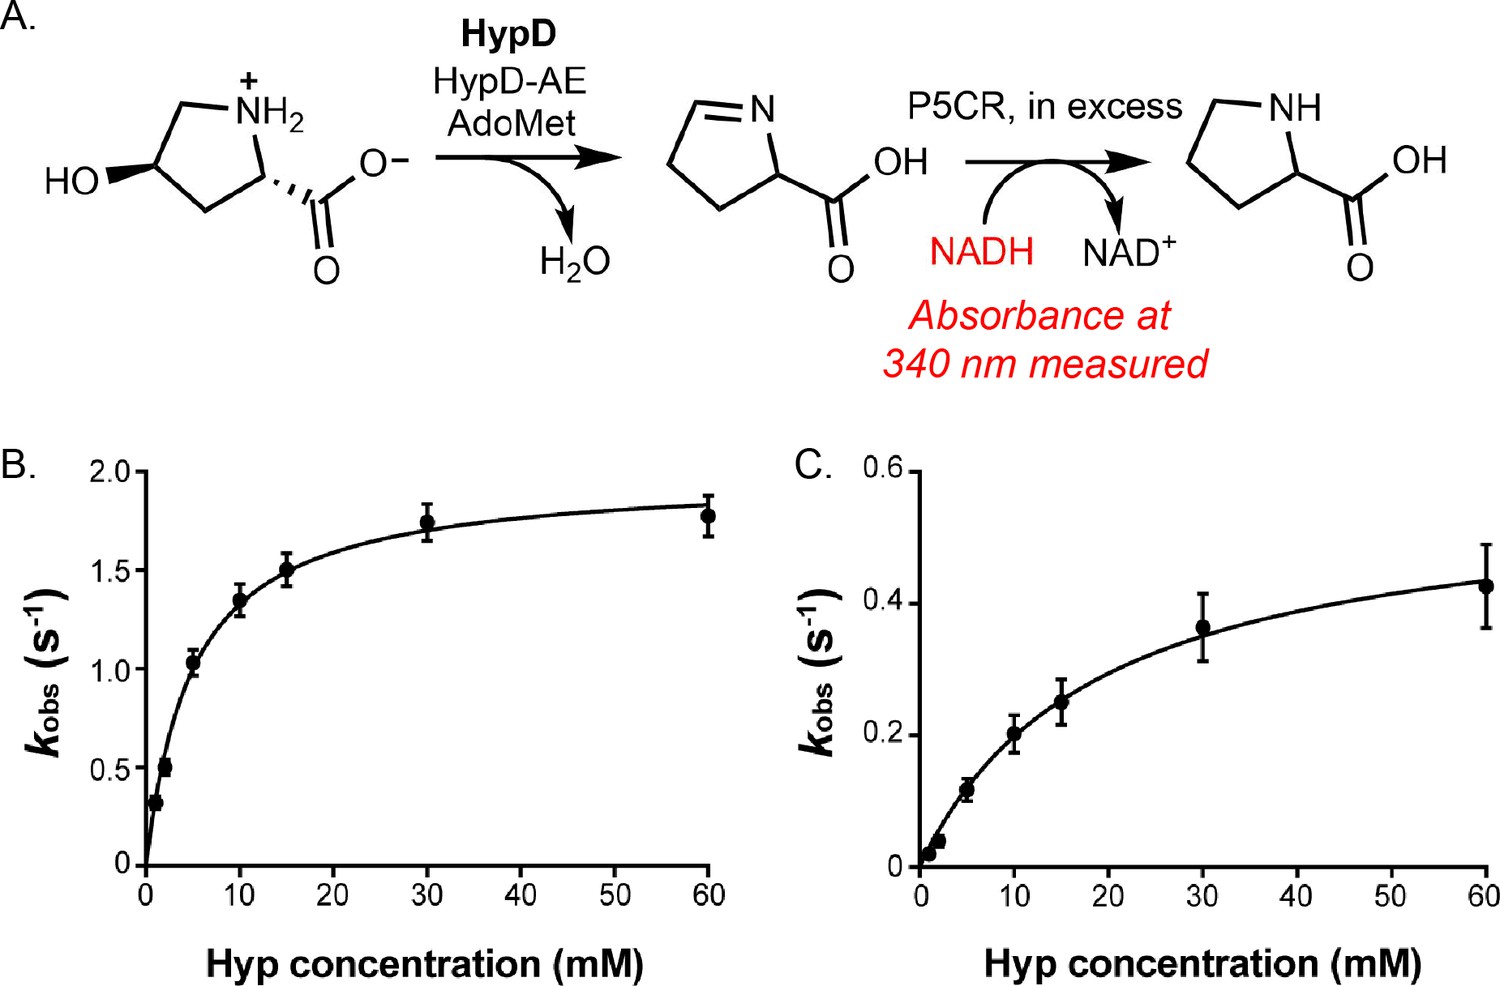
Kinetic analysis of HypD-Y450F and HypD-T645A.
(A) HypD activity was coupled to P5CR and absorbance at 340 nm was measured to calculate initial rates for NADH consumption. (B) Michaelis–Menten kinetic curve using glycyl radical-normalized values for HypD-Y450F. (C) Michaelis–Menten kinetic curve using glycyl radical-normalized values for HypD-T645A. Data points represent the mean of 3 replicates and error bars represent SD.
Figure 5—figure supplement 3
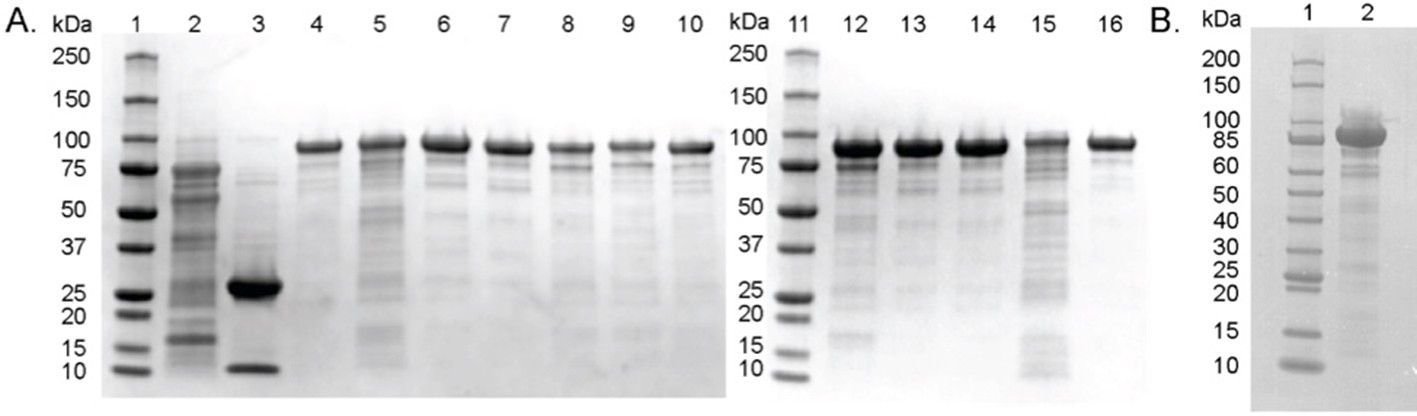
SDS-PAGE of purified proteins used in this study.
(A) Sodium dodecyl sulfate polyacrylamide gel electrophoresis (SDS-PAGE) of the proteins used in biochemical assays. Samples were loaded as follows: lane 1 and 11 – Precision Plus Protein All Blue Standards (Bio-Rad), lane 2 – MBP-AE, lane 3 – P5CR, lane 4 – HypD-wild-type, lane 5 – HypD-H160Q, lane 6 – HypD-D278N, lane 7 – HypD-S334A, lane 8 – HypD-D339N, lane 9 – HypD-F340A, lane 10 – HypD-C434S, lane 12 – HypD-E436Q, lane 13 – HypD-Y450F, lane 14 – HypD-T645A, lane 15 – HypD-G765A, lane 16 – HypD-Y450F/T645A. All proteins were cloned from C. difficile 70-100-2010. HypD variants exhibited similar stability and purification yields as wild-type. (B) SDS-PAGE of the protein used in crystallography experiments. Samples were loaded as follows: lane 1 – Broad Range Protein Standard (NEB), lane 2 – HypD-wild-type cloned from C. difficile 70-100-2010.
Figure 6 with 3 supplements
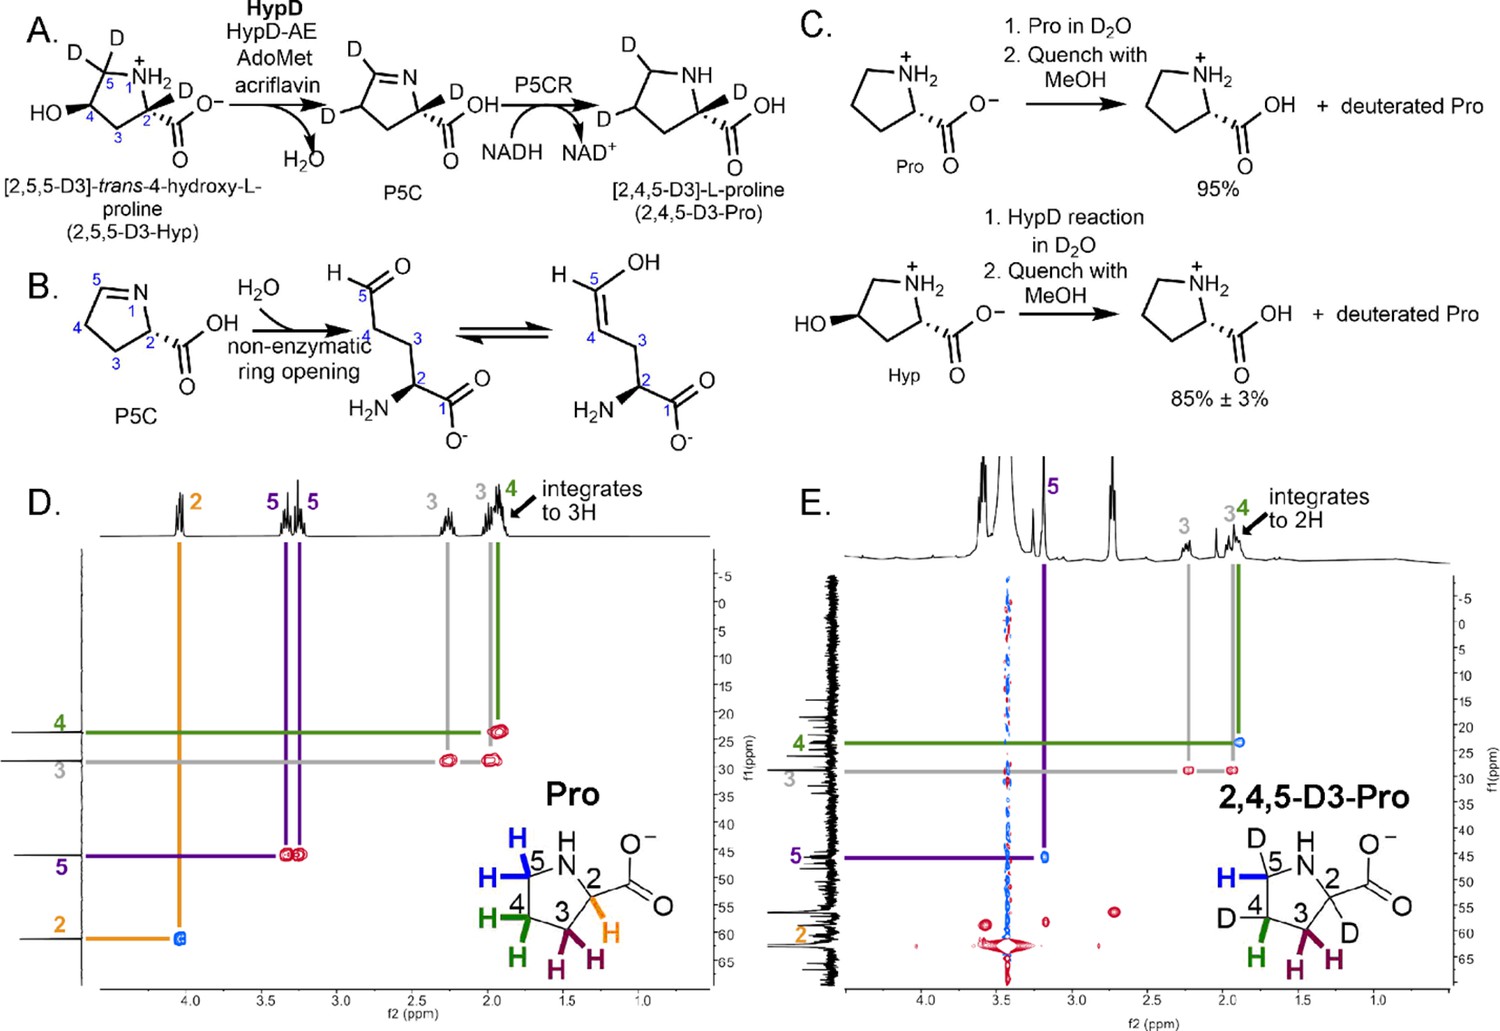
Coupled HypD and P5CR assay with trideuterated substrate 2,5,5-D3-Hyp results in the formation of product 2,4,5-D3-Pro.
(A) Overall reaction scheme for HypD P5CR coupled assay with 2,5,5-D3-Hyp. (B) P5C nonenzymatically hydrolyzes to an aldehyde product that equilibrates between keto and enol tautomers. (C) HypD assays in D2O were performed in triplicate, and products were detected by LC-MS/MS. The percentage of undeuterated Pro is indicated. As a control, LC-MS/MS was also performed on Pro in D2O to determine the extent of deuteration resulting from solvent exchange. (D) 1H-13C HSQC NMR of a commercial standard of Pro. Cross peaks between 13C (f1, y-axis) and 1H (f2, x-axis) are indicated by color-coded lines matching the inset Pro molecule. (E) 1H-13C HSQC NMR of the product of HypD assay using 2,5,5-D3-Hyp as substrate. HSQC spectra were multiplicity edited. Red cross peaks correspond to CH2 signals, and blue cross peaks correspond to CH signals. Notably, compared to panel D, the product shows only one H at position C4, suggesting deuterium incorporation at this position. Furthermore, only one H is bonded to C5 showing that one deuterium atom was lost at this position during catalysis.
-
Figure 6—source data 1
LC-MS/MS data for HypD D2O assay and HypD assay using 2,5,5-D3-Hyp as substrate.
LC-MS/MS and calculated percentages of total ions calculated for commercial standard of Pro diluted in D2O and for HypD coupled assays run in D2O, described in Figure 6. The mass 116.1 corresponds to the precursor undeuterated Pro ion, and the fragment 70.1 corresponds to the mass of Pro ion after fragmentation of the carboxylate group. These data were used to calculate average deuterium incorporation in Pro commercial standard in D2O and Pro generated by HypD reaction run in D2O, both presented in Figure 6C.
- https://cdn.elifesciences.org/articles/51420/elife-51420-fig6-data1-v1.xlsx
Figure 6—figure supplement 1

1H NMR of Pro and HypD coupled assay product 2,4,5-D3-Pro.
1H NMR spectra are shown for (A) a commercial Pro standard and (B) 2,4,5-D3-Pro, the product of the HypD coupled assay. Peaks for carbons are labeled and color-coded according to the inset Pro and 2,4,5-D3-Pro shown.
Figure 6—figure supplement 2
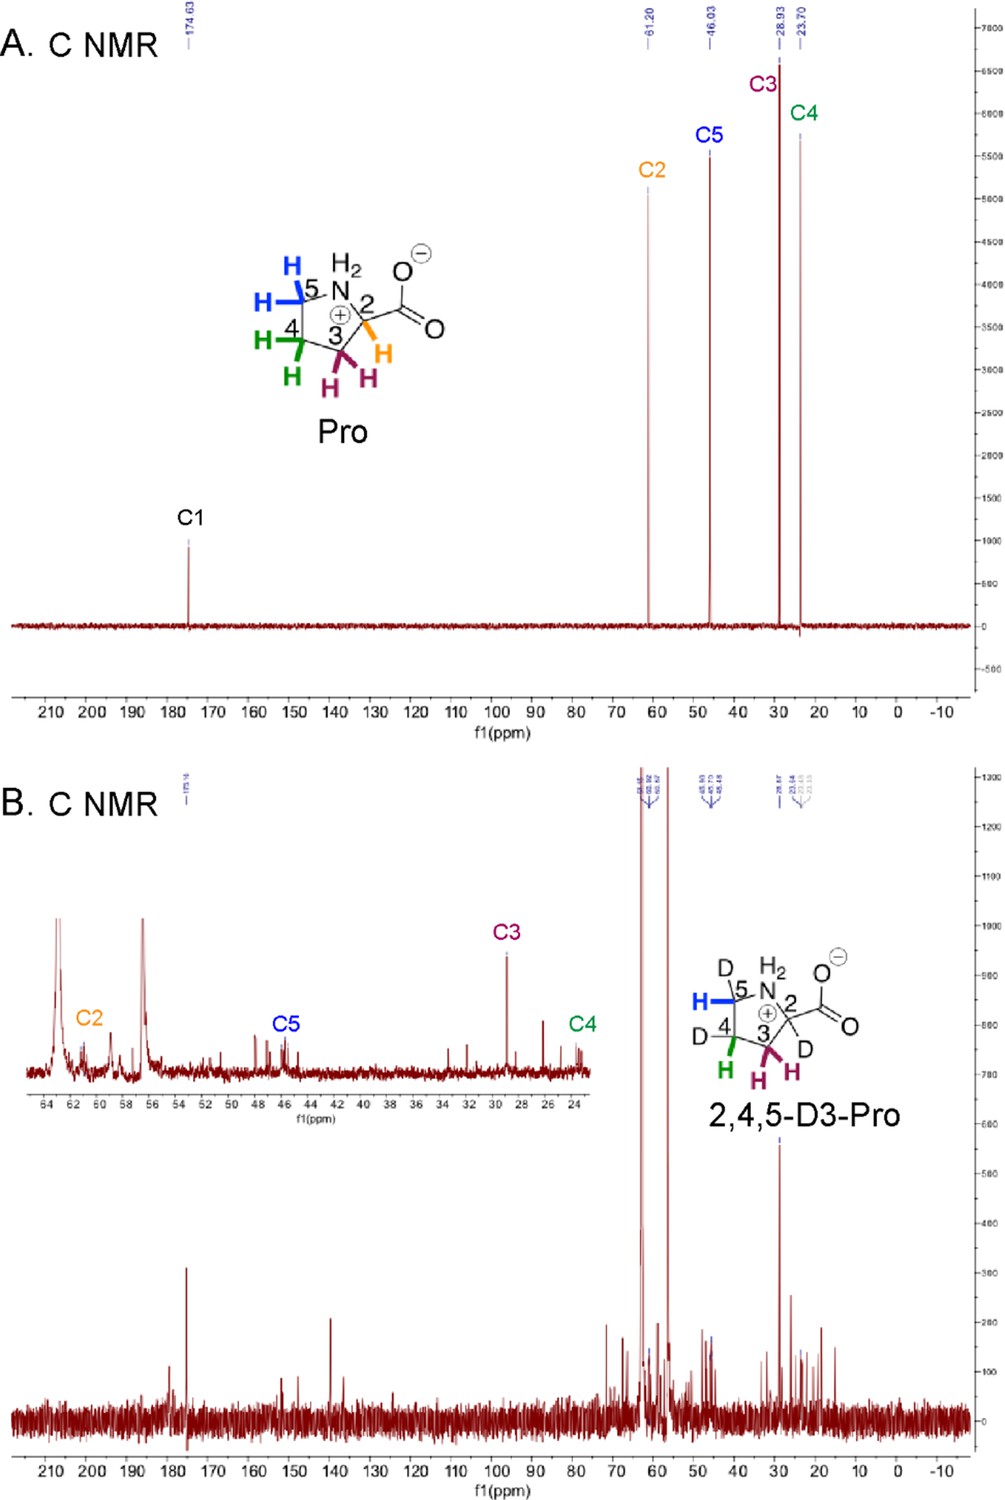
13C NMR of Pro and HypD coupled assay product 2,4,5-D3-Pro.
13C NMR spectra are shown for (A) a commercial Pro standard and (B) 2,4,5-D3-Pro, the product of the HypD coupled assay (including a zoomed in panel in the inset to better view peaks for C2-C5). Peaks for all Pro carbons are consistent with literature values (Spectral Database for Organic Compounds). Triplet peaks for C2, C4 and C5 are observed, as expected. Peaks for carbons are labeled and color-coded according to the inset Pro and 2,4,5-D3-Pro shown.
Figure 6—figure supplement 3

COrrelated SpectroscopY (COSY) NMR of HypD coupled assay product 2,4,5-Pro.
COSY NMR show coupling between vicinal protons on C3 and C4, and between C4 and C5. Peaks for protons are labeled and color-coded according to the inset 2,4,5-D3-Pro shown.
Figure 7

Proposed mechanism for HypD dehydration of deuterated substrate 2,5,5-D3-Hyp.
Figure 8
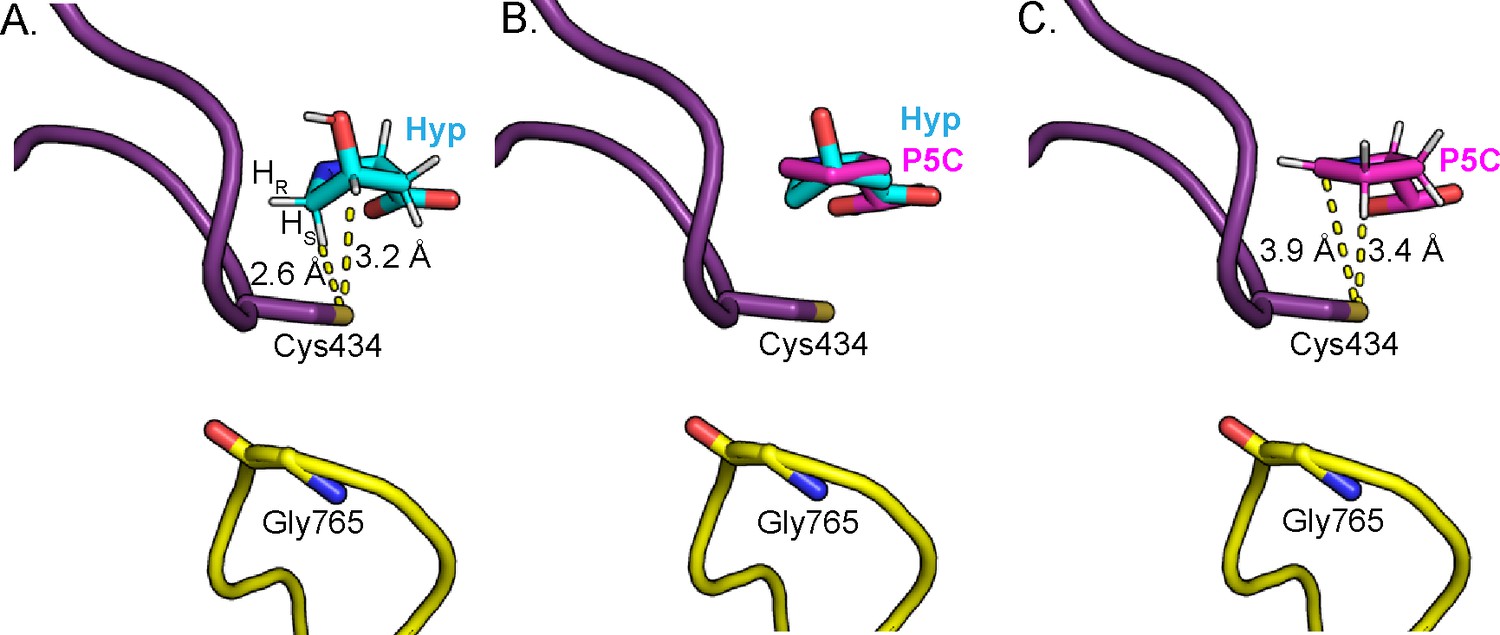
Change in Hyp puckering throughout the mechanism is proposed to play a critical role in radical transfer.
(A) Cγ-exo puckering of Hyp positions the pro-S hydrogen atom of Hyp C5 in closest proximity to Cys434 for hydrogen atom abstraction. (B) The product P5C is modeled into Hyp-bound HypD structure by manual docking, such that carboxylate tails of both P5C and Hyp are anchored in the same location. (C) The pyrroline ring of P5C exhibits a planar structure, positioning C4 closer to Cys434 than C5 for hydrogen abstraction from the thiyl group. .
Tables
Table 1
Data collection and model refinement statistics for crystallography.
Values in parentheses denote highest resolution bin.
| HypD with glycerol bound | HypD with Hyp bound | |
|---|---|---|
| Space group | P21 | P21 |
| Unit cell (Å) | 100.3, 341.7, 122.6, 90.0°, 107.1°, 90.0° | 101.2, 350.2, 124.5, 90.0°, 105.7°, 90.0° |
| Resolution (Å) | 50–2.05 (2.09–2.05) | 50–2.52 (2.59–2.52) |
| Rsym | 16.8 (75.7) | 20.4 (97.5) |
| CC1/2 | 99.0 (58.8) | 99.4 (72.1) |
| <I/σ> | 8.40 (1.82) | 10.75 (2.12) |
| Completeness (%) | 99.0 (98.3) | 99.7 (99.4) |
| Unique reflections | 486251 (24062) | 278476 (44812) |
| Total reflections | 1626596 (168674) | 1944676 (294711) |
| Redundancy | 7.07 (7.01) | 6.98 (6.58) |
| Rwork/Rfree | 0.166/0.193 | 0.186/0.224 |
| RMSD bond length (Å) | 0.007 | 0.008 |
| RMSD bond angles (°) | 0.86 | 0.966 |
| Chains in asymmetric unit | 8 | 8 |
| Number of: | ||
| Total atoms | 54954 | 52103 |
| Protein atoms | 49994 | 49851 |
| Water molecules | 4834 | 2180 |
| Gol/Hyp | 48 | 72 |
| Ramachandran analysis | ||
| Favored (%) | 98.16 | 97.71 |
| Allowed (%) | 1.71 | 1.99 |
| Disallowed (%) | 0.13 | 0.30 |
| Rotamer outliers (%) | 1.46 | 3.27 |
| Average B factors | ||
| Protein (Å2) | 21.0 | 35.8 |
| Water (Å2) | 27.2 | 27.7 |
| Gol/Hyp (Å2) | 22.3 | 31.2 |
Table 2
Glycyl radical quantification, activity, and kinetic parameters for HypD variants.
Mean and SD are displayed for glycyl radical quantification where n = 3 independent experiments for each protein. HypD activity was coupled to P5CR and absorbance at 340 nm was measured to calculate initial rates for NADH consumption. The un-normalized turnover number (kcat) was calculated using the concentration of dimeric HypD in assays. The kcat was normalized by the amount of activated enzyme as determined by EPR spectroscopy. Catalytic efficiency was calculated using normalized kcat values.
| HypD | Radical per monomer (%) | Activity detected by quantification of proline | Km (mM) | Un-normalized kcat (s−1) | Glycyl radical- normalized kcat (s−1) | Catalytic efficiency using normalized kcat (M−1 s−1) |
|---|---|---|---|---|---|---|
| Wildtype (Levin et al., 2017) | 51 ± 1 | Yes | 1.2 ± 0.1 | 46 ± 1 | 45 ± 1 | 3.8 ± 0.3 × 10⁴ |
| G765A | 0 | No | ND | ND | ND | |
| C434S | 34 ± 8 | No | ND | ND | ND | |
| E436Q | 12.4 ± 0.5 | No | ND | ND | ND | |
| H160Q | 4.4 ± 0.8 | No | ND | ND | ND | |
| D278N | 16 ± 4 | No | ND | ND | ND | |
| D339N | 18 ± 8 | No | ND | ND | ND | |
| S334A | 50 ± 19 | No | ND | ND | ND | |
| Y450F | 29 ± 4 | Yes | 19 ± 3 | 0.33 ± 0.01 | 0.57 ± 0.04 | 30 ± 6 |
| T645A | 19 ± 1 | Yes | 4.9 ± 0.4 | 0.75 ± 0.01 | 1.98 ± 0.04 | 400 ± 30 |
| Y450F/T645A | 3.4 ± 0.8 | No | ND | ND | ND | |
| F340A | 23 ± 5 | No | ND | ND | ND |
Table 3
Primers used in site-directed mutagenesis of HypD.
Nucleotides mutated are indicated in small letters.
| Primer | Sequence (5′ to 3′) | Annealing temperature used, °C |
|---|---|---|
| pET28a-CdHypD-G765A-fwd | GACTTAATAGTTAGAGTTGCAGcATATAGTGACCATTTC | 66 |
| pET28a-CdHypD-G765A-rev | CTACTTAAATTATTGAAATGGTCACTATATgCTGCAACTCTAAC | 66 |
| pET28a-CdHypD-C434S-fwd | AACCAGTGGTTcTGTTGAAACTGGATG | 58 |
| pET28a-CdHypD-C434S-rev | CAGTTTCAACAgAACCACTGGTTCCACC | 58 |
| pET28a-CdHypD-E436Q-fwd | CAGTGGTTGTGTTcAAACTGGATGTTTTGG | 60 |
| pET28a-CdHypD-E436Q-rev | ACATCCAGTTTgAACACAACCACTGGTTC | 60 |
| pET28a-CdHypD-H160Q-fwd | AGCCCCAGGACAgACAGTTTGTGGAGATAC | 60 |
| pET28a-CdHypD-H160Q-rev | ACAAACTGTcTGTCCTGGGGCTCTTTGTTC | 60 |
| pET28a-CdHypD-D278N-fwd | GAACTTAATATATGGaATGCTTTTACTCCAGGAAGACTTGACC | 66 |
| pET28a-CdHypD- D278N-rev | CCTGGAGTAAAAGCATtCCATATATTAAGTTCAGTAGTAACCCC | 66 |
| pET28a-CdHypD- F340A-fwd | GAAAGTAGCACATATACAGATgcTGCAAATATAAAC | 54 |
| pET28a-CdHypD- F340A-rev | GATTTATTCCACCAGTGTTTATATTTGCAgcATCTGTATATG | 54 |
| pET28a-CdHypD- Y450F-fwd | GTTTTGGTAAAGAAGCATATGTTCTAACTGGATtTATGAACATTCC | 66 |
| pET28a-CdHypD- Y450F-rev | GTATTTTTGGAATGTTCATAaATCCAGTTAGAACATATGCTTCTTTACC | 66 |
| pET28a-CdHypD- S334A-fwd | GTTGGTATAACATTAAAAGAAgcTAGCACATATACAGATTTTGC | 60 |
| pET28a-CdHypD- S334A-rev | CTGTATATGTGCTAgcTTCTTTTAATGTTATACCAACTTTTGG | 60 |
| pET28a-CdHypD- T645A-fwd | ATGTTACCAgCAACTTGTCATATATACTTTGGAGAAATTATGGG | 66 |
| pET28a-CdHypD- T645A-rev | TATGACAAGTTGcTGGTAACATATCTACTCTGTATTCTCCACC | 66 |
| pET28a-CdHypD- D339N-fwd | CATTAAAAGAAAGTAGCACATATACAaATTTTGCAAATATAAACACTGG | 66 |
| pET28a-CdHypD- D339N-rev | GGATTTATTCCACCAGTGTTTATATTTGCAAAATtTGTATATGTGCTAC | 66 |
Additional files
Download links
A two-part list of links to download the article, or parts of the article, in various formats.
Downloads (link to download the article as PDF)
Open citations (links to open the citations from this article in various online reference manager services)
Cite this article (links to download the citations from this article in formats compatible with various reference manager tools)
Molecular basis for catabolism of the abundant metabolite trans-4-hydroxy-L-proline by a microbial glycyl radical enzyme
eLife 9:e51420.
https://doi.org/10.7554/eLife.51420


