Probe-Seq enables transcriptional profiling of specific cell types from heterogeneous tissue by RNA-based isolation
- Howard Hughes Medical Institute, Harvard Medical School, United States
Figures
Figure 1 with 5 supplements

Isolation and transcriptional profiling of specific BC subtypes from the adult mouse retina.
(a) Schematic of Probe-Seq for the adult mouse retina. The retina was dissociated into single cells, fixed, and permeabilized. Cells were incubated with gene-specific probe sets against Vsx2 and Grik1 and subsequently incubated with fluorescent oligos. Three populations of labeled cells (Vsx2-, Vsx2+/Grik1-, and Vsx2+/Grik1+) were isolated by FACS for downstream RNA sequencing. (b) SABER-FISH signals from an adult mouse retina section using Vsx2 and Grik1 probe sets. (c) Representative FACS plot of all events (top panel) on a Hoechst histogram. The debris is the peak near 0. The first peak after the debris is the single cell 2N peak. 4N doublets and other cell clumps are in the peaks to the right of the single cell peak. Representative FACS plots of all single cells (middle panel) with Vsx2 fluorescence on the y-axis and autofluorescence (561 nm) on the x-axis. The negative population ran along the diagonal. The Vsx2+ population (12.1%) was left shifted, indicating high Vsx2 fluorescence and low autofluorescence. FACS plot of only the Vsx2+ population (bottom panel) with Grik1 fluorescence on the y-axis and autofluorescence (561 nm) on the x-axis. Vsx2+/Grik1+ population (16.7%) displayed strong separation from the Vsx2+/Grik1- population (81.2%). The Grik1MID population was included in the Vsx2+/Grik1+ population. (d) Expected distribution of retinal cell type markers expressed in each isolated population. (e) Images of dissociated mouse retinal cells after the SABER-FISH protocol on dissociated mouse retinal cells before FACS. (f) A heatmap representing relative expression levels of BC subtype markers previously identified by scRNA sequencing that are differentially expressed (adjusted p-value<0.05) between Grik1- and Grik1+ populations. (g) A representative scatter plot of log2 normalized counts of all genes (left panel) or BC2 – BC4 marker genes (right panel) between Live Grik1+ cells and Probe-Seq Grik1+ Cells. Red line indicates a slope of 1. Select cell class-specific markers (Opn1mw (cones), Apoe (MG), and Rho (rods)) are labeled in red. (h) A heatmap of the stain index with varying levels of transcript expression and number of oligos. The boundary indicates a cutoff of SI < 2. (i) Schematic and flow cytometry plots of iterative Probe-Seq. Three gene-specific probe sets (Gad1, Vsx2, and Grm6) were hybridized to dissociated mouse retinal cells, and fluorescent oligos were hybridized only to Gad1 and Vsx2 probe sets to detect subsets of ACs (Gad1+; 3.54%) and BC/MG (Vsx2+; 11.9%). The fluorescent oligos were subsequently stripped with 50% formamide, which abolished the staining based on flow cytometry (middle panel). Fluorescent oligos for Grm6 were then hybridized to label a subset of BCs (right panel; Grm6+; 6.78%). HC, Horizontal Cell; RGC, Retinal Ganglion Cell; AC, Amacrine Cell; BC, Bipolar Cell; MG, Müller Glia; ONL, Outer Nuclear Layer; INL, Inner Nuclear Layer; GCL, Ganglion Cell Layer. Scale bars: 10 µm (b, e).
Figure 1—figure supplement 1
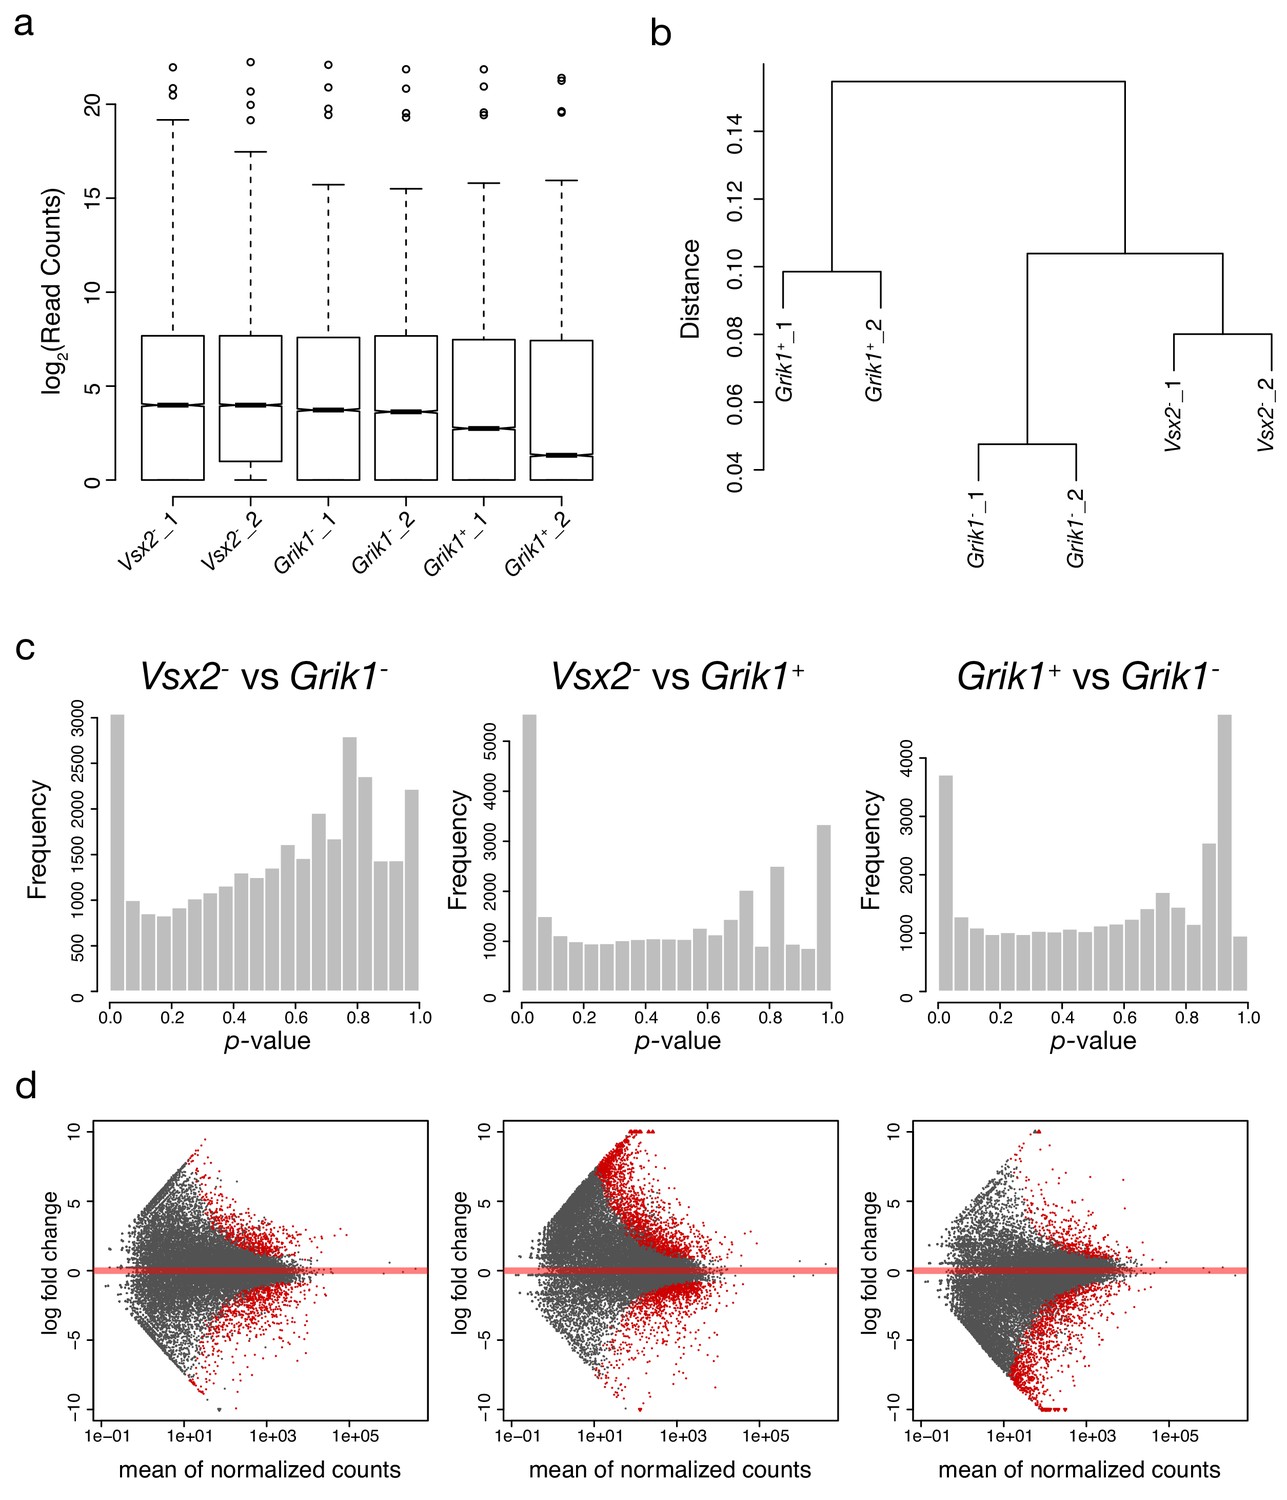
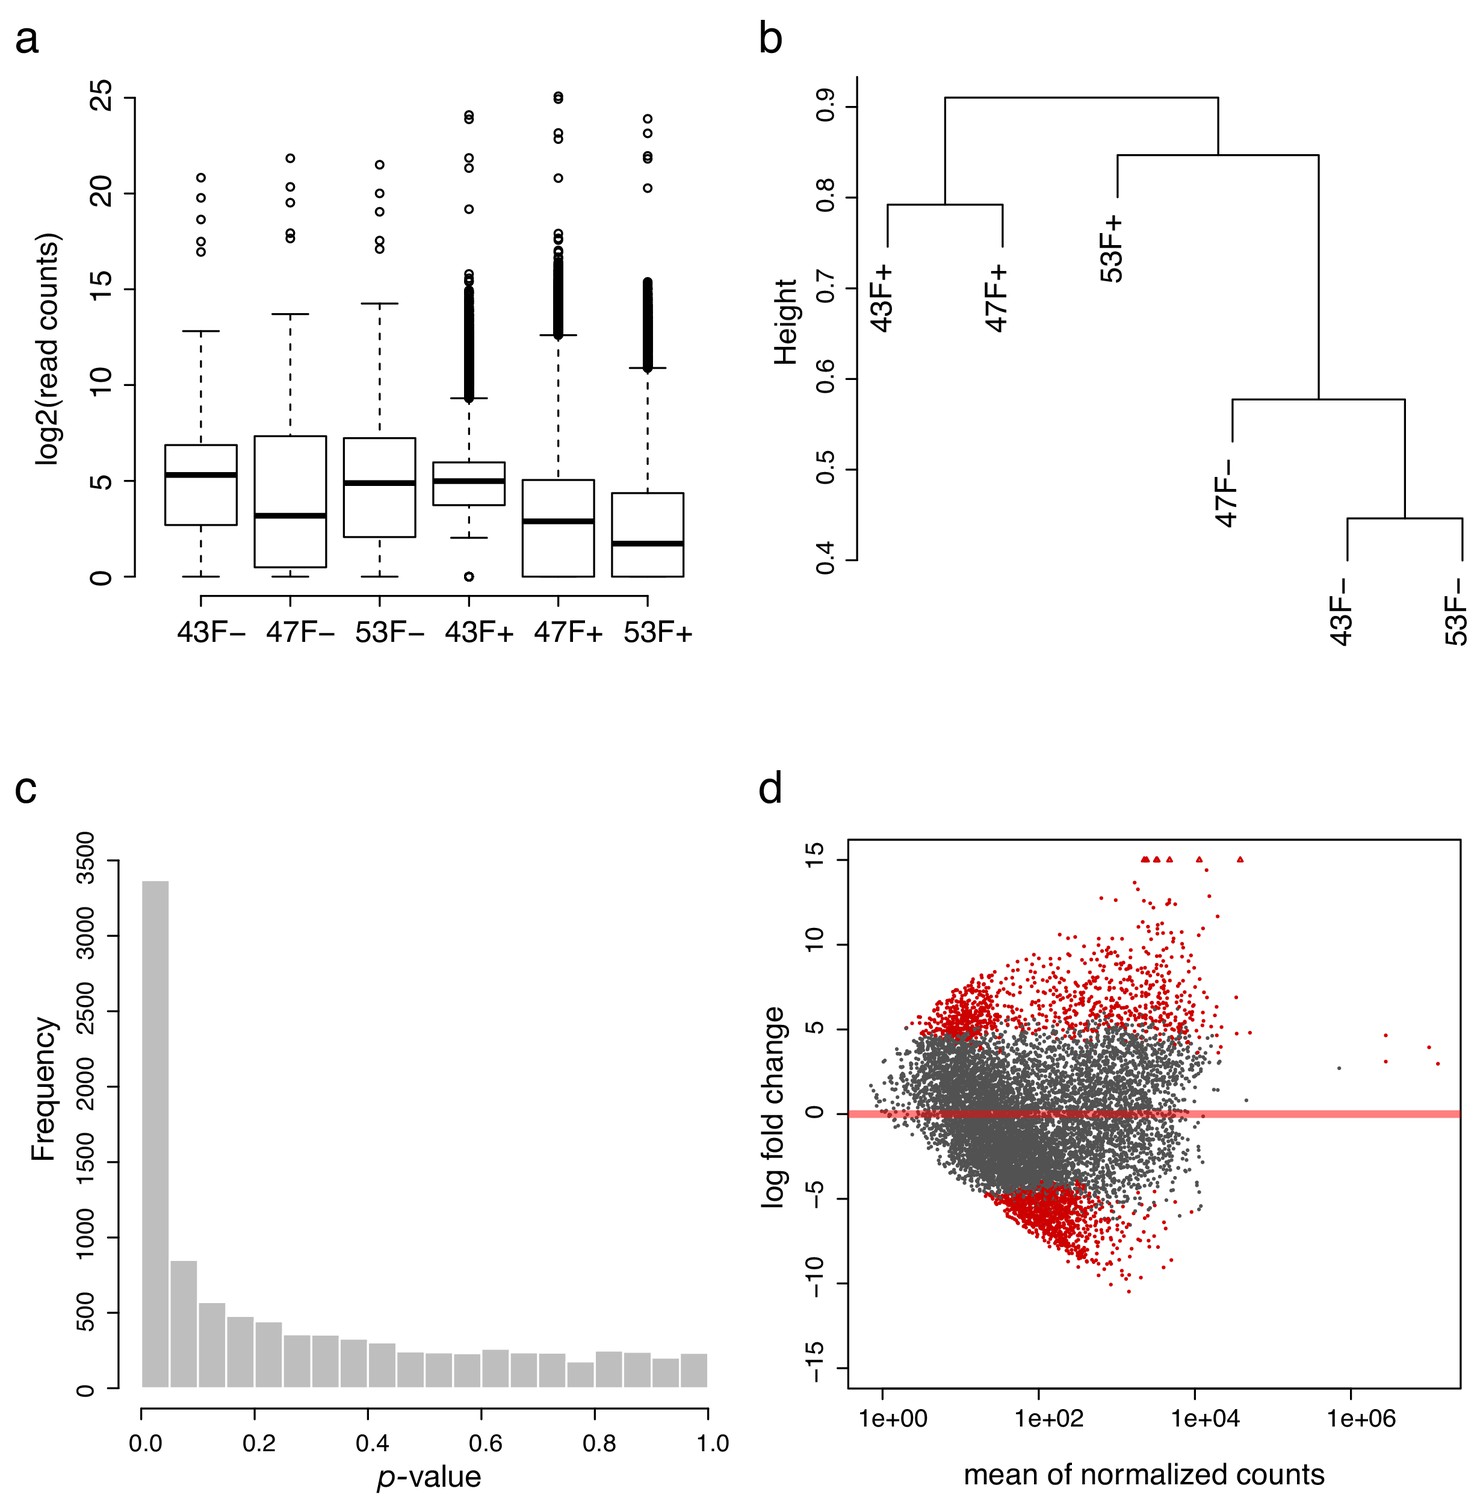
Quality control of mouse Probe-Seq RNA sequencing.
(a) Log2-transformed read distribution plot for sequenced mouse Vsx2/Grik1 Probe-Seq samples. (b) Dendrogram of read counts shows clustering of Vsx2-, Grik1-, and Grik1+ samples. (c) Plots of frequencies of p-values shows an even distribution of null p-values. (d) MA plots of log2 fold change vs. mean of normalized counts. Red dots indicate genes that are differentially expressed.
Figure 1—figure supplement 2
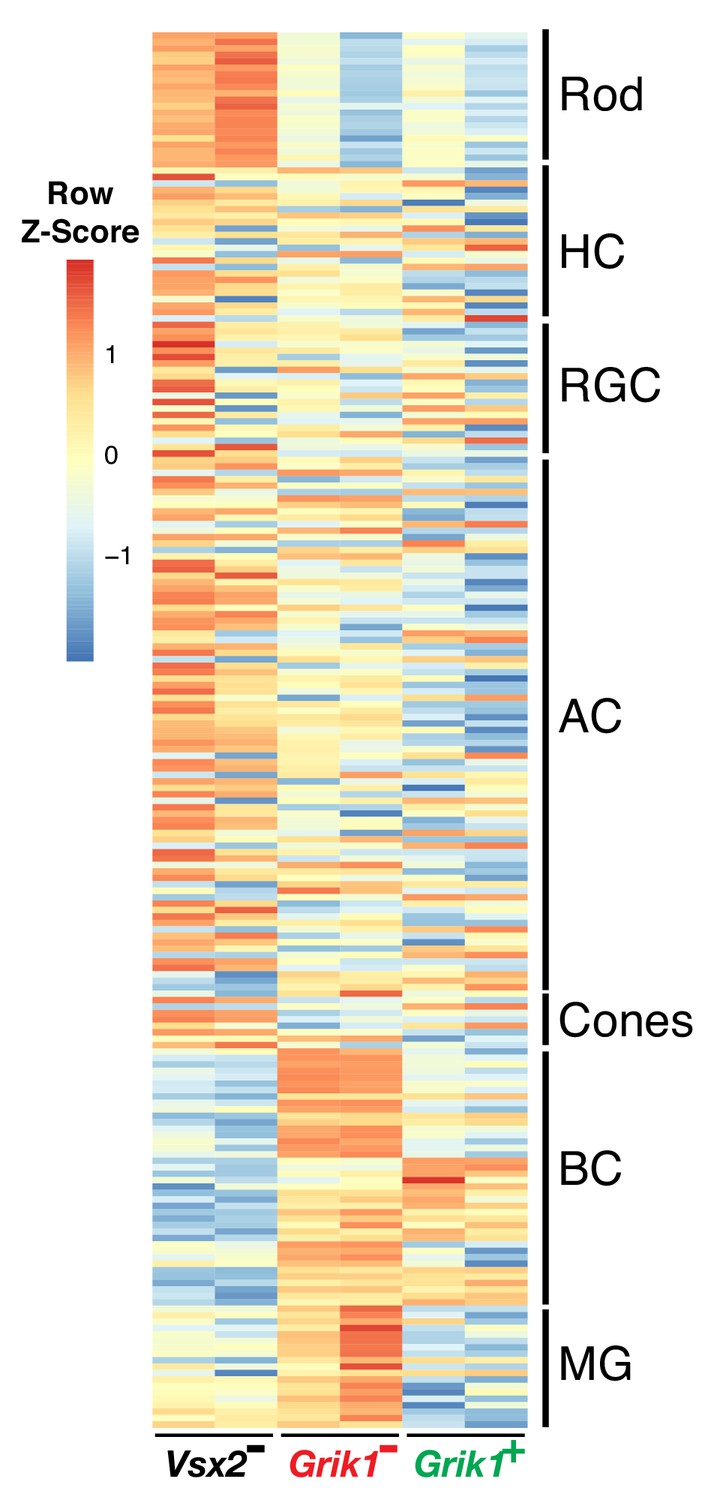
BC markers are enriched in the Vsx2+/Grik1+ and Vsx2+/Grik1- populations.
A heatmap representing relative expression levels of major retinal cell class markers previously identified by scRNA sequencing (Macosko et al., 2015) that are differentially expressed (adjusted p-value<0.05) between Vsx2-, Grik1-, and Grik1+ populations.
Figure 1—figure supplement 3
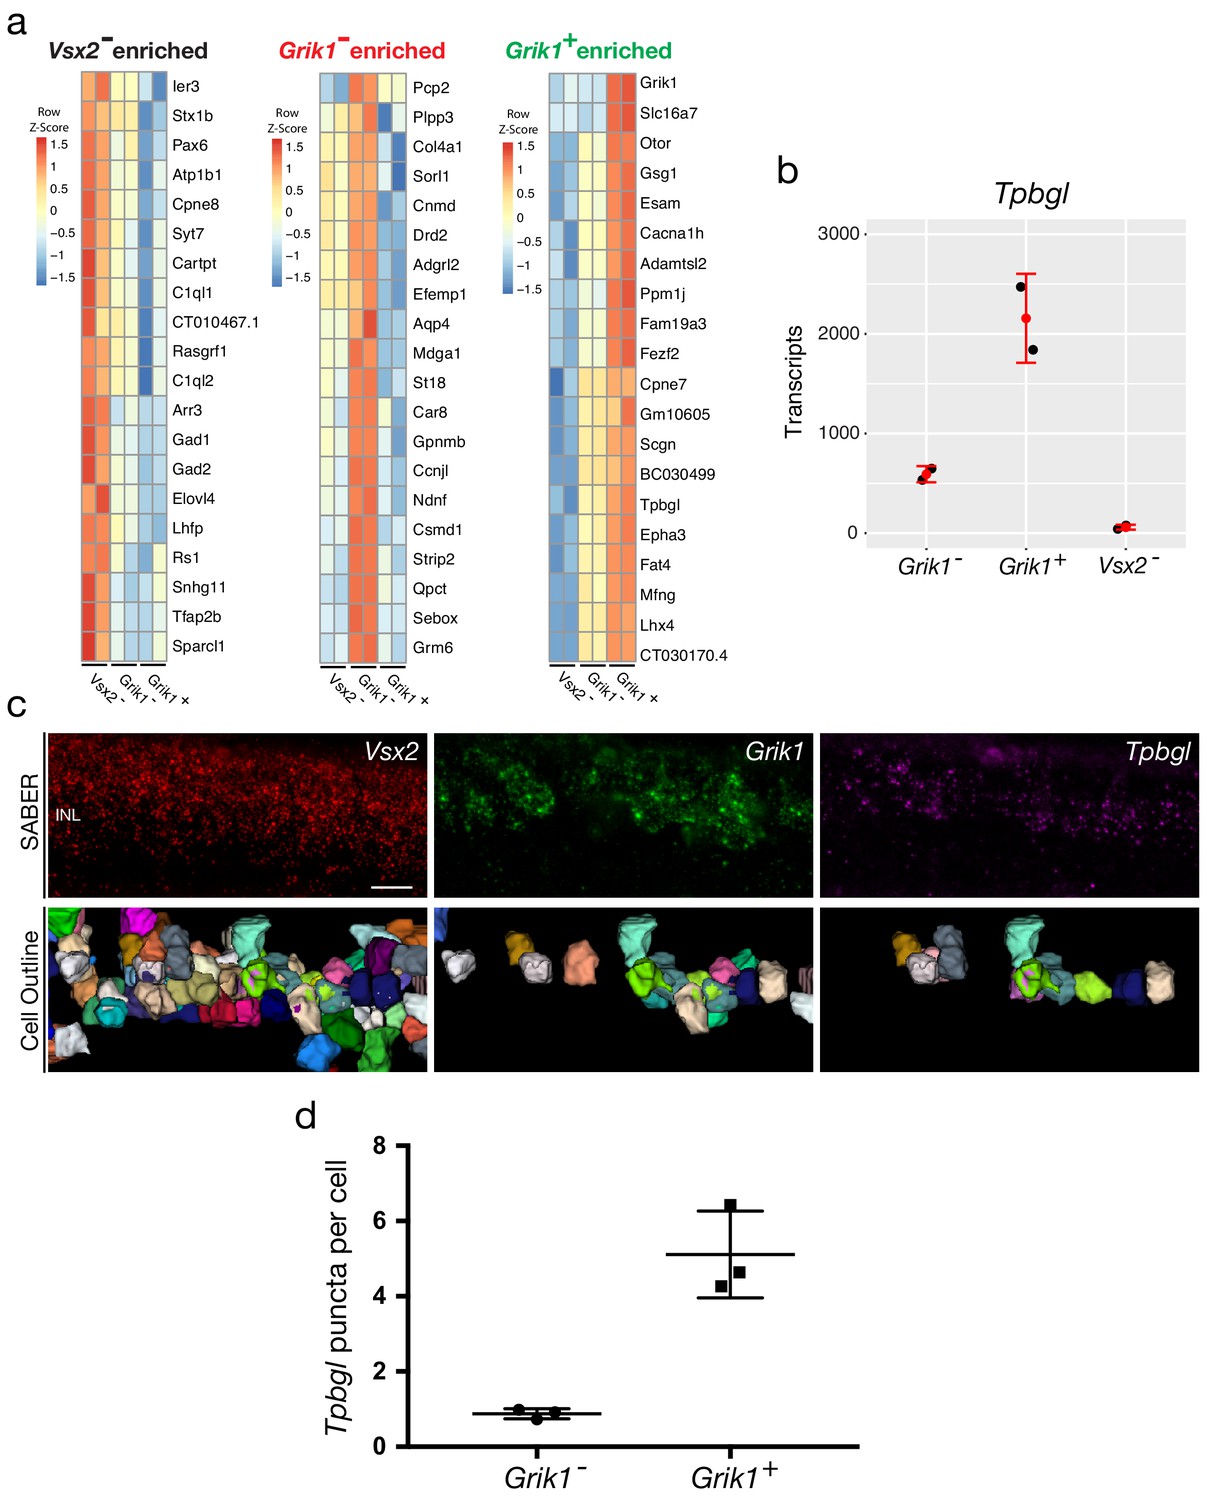
Validation of a Grik1+ population-enriched transcript, Tpbgl, by SABER-FISH.
(a) Heapmaps of unbiased top 20 enriched genes for each population (Vsx2-, left; Grik1-, middle; Grik1+, right). (b) Quantification of Tpbgl transcripts in Vsx2-, Grik1-, Grik1+ populations based on Probe-Seq. (c) Images of a mouse retinal section following the SABER-FISH protocol using gene-specific probe sets for Vsx2, Grik1, and Tpbgl. Reconstruction of cell outlines was carried out using the cell segmentation algorithm described previously (Kishi et al., 2019). (d) Quantification of Tpbgl puncta in Grik1- cells vs Grik1+ cells.
Figure 1—figure supplement 4
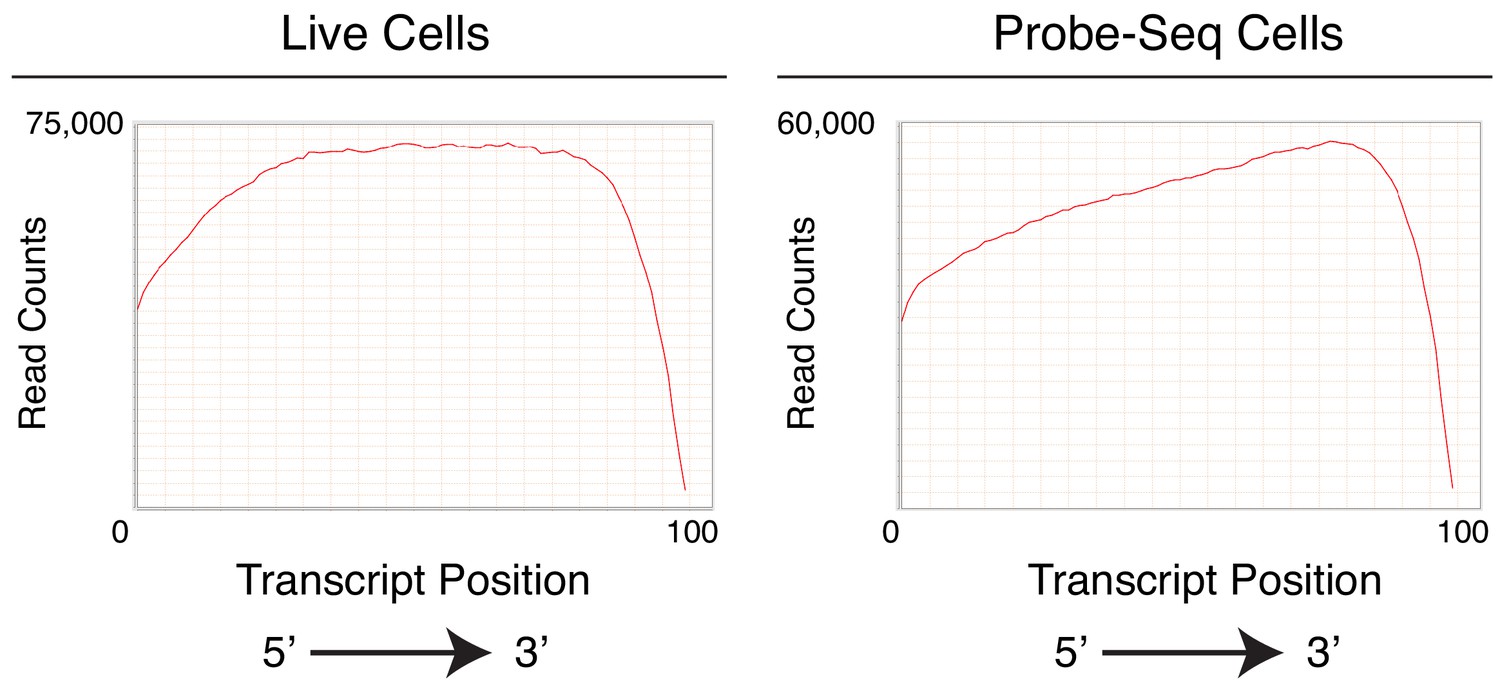
Gene body coverage of Live and Probe-Seq cells show 3’ bias in the Probe-Seq population.
Graphs showing gene body coverage of mapped reads from Live (left panel) and Probe-Seq (right panel) cells. Due to cDNA generation using Oligo(dT), cDNA from degraded RNA is biased towards the 3’ end of a transcript. Compared to the uniform distribution along the gene body seen in the Live cell population, the distribution is right-shifted in the Probe-Seq cell population.
Figure 1—figure supplement 5
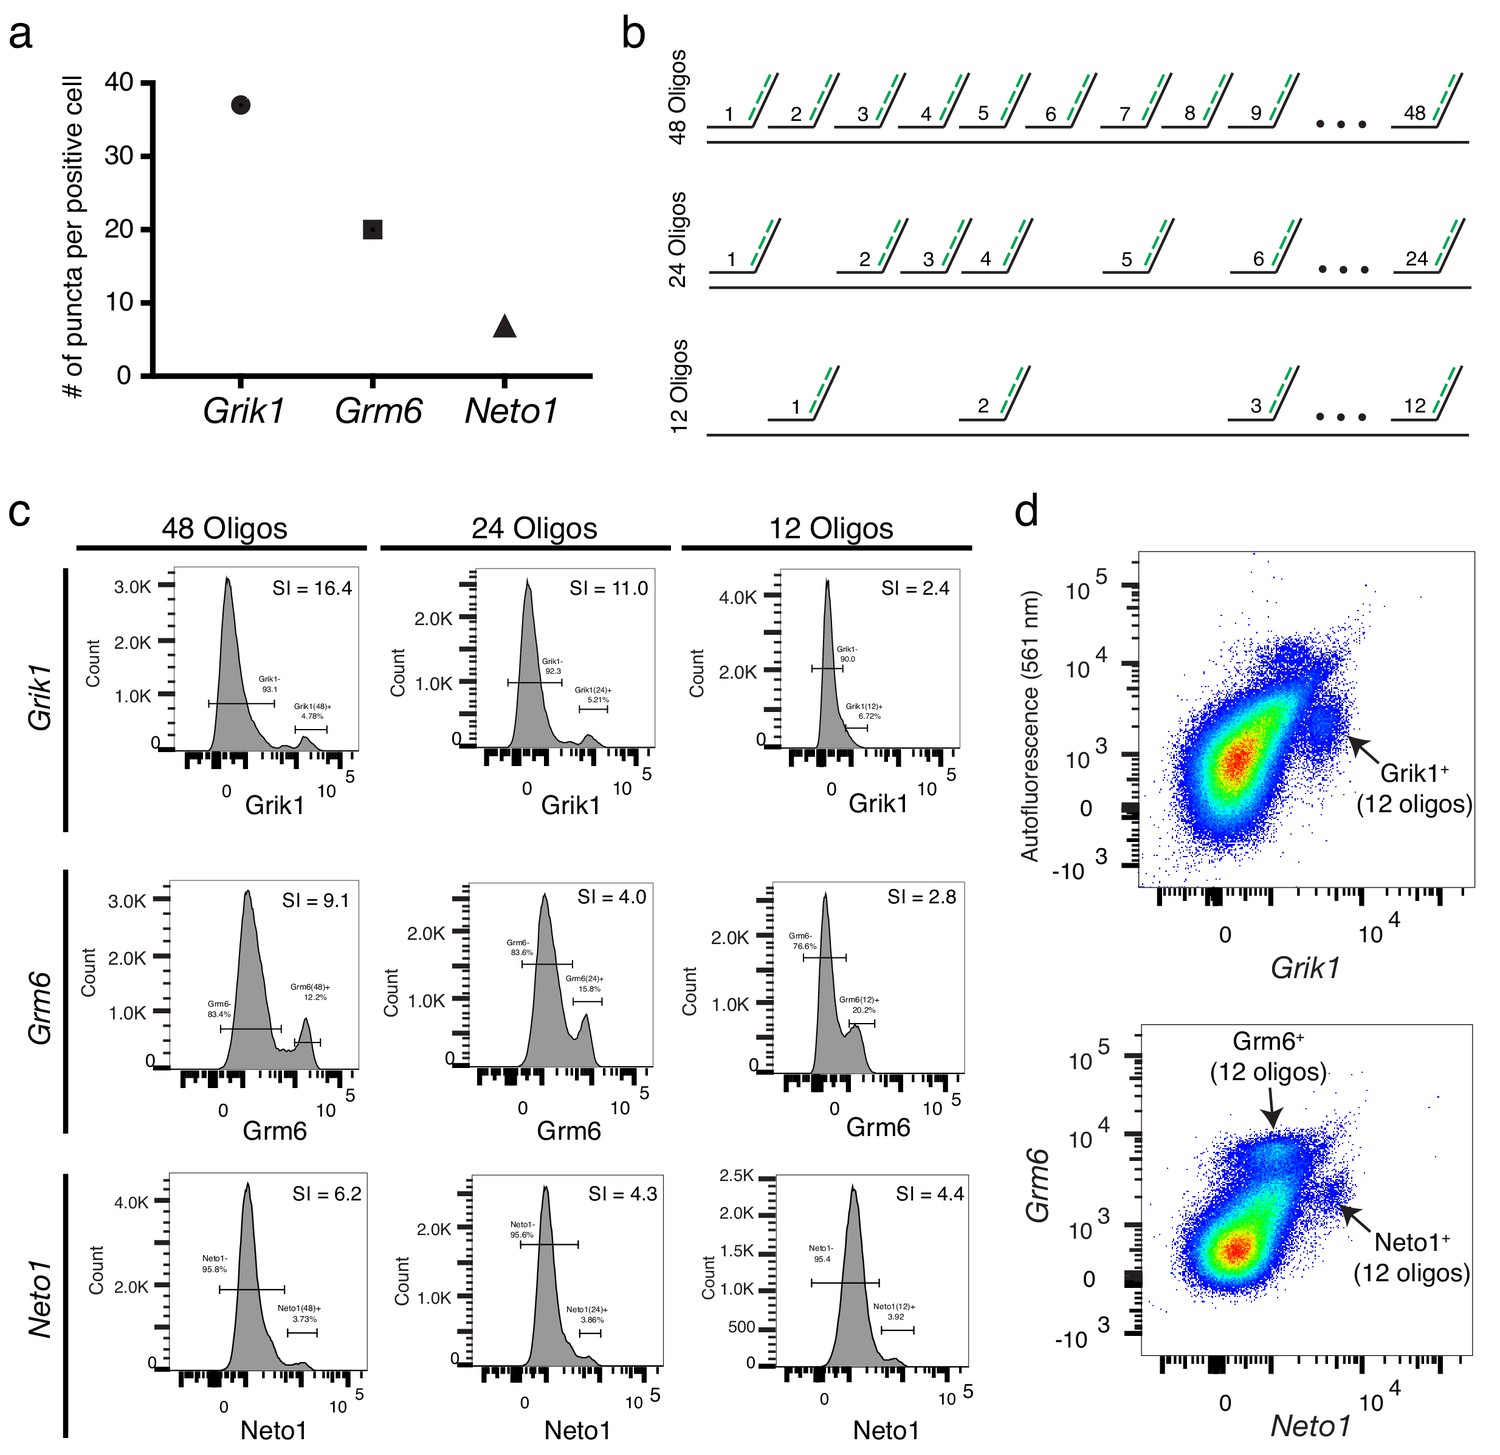
Probe-Seq stain index is correlated with the number of oligos and the expression level.
(a) Quantification of number of puncta per positive cell for Grik1, Grm6, and Neto1 in the mouse retina. (b) Schematic of the experiment. For each gene, 48, 24, or 12 randomly-chosen oligos were pooled for gene-specific probe set synthesis. (c) Flow cytometry histograms of Grik1 (upper row), Grm6 (middle row), and Neto1 (bottom row) with either 48 (left column), 24 (middle column), and 12 (right column) oligos. (d) 2D flow cytometry plot using 12 oligos for Grik1 (upper panel), Neto1, and Grm6 (lower panel). SI, Stain Index.
Figure 2 with 2 supplements
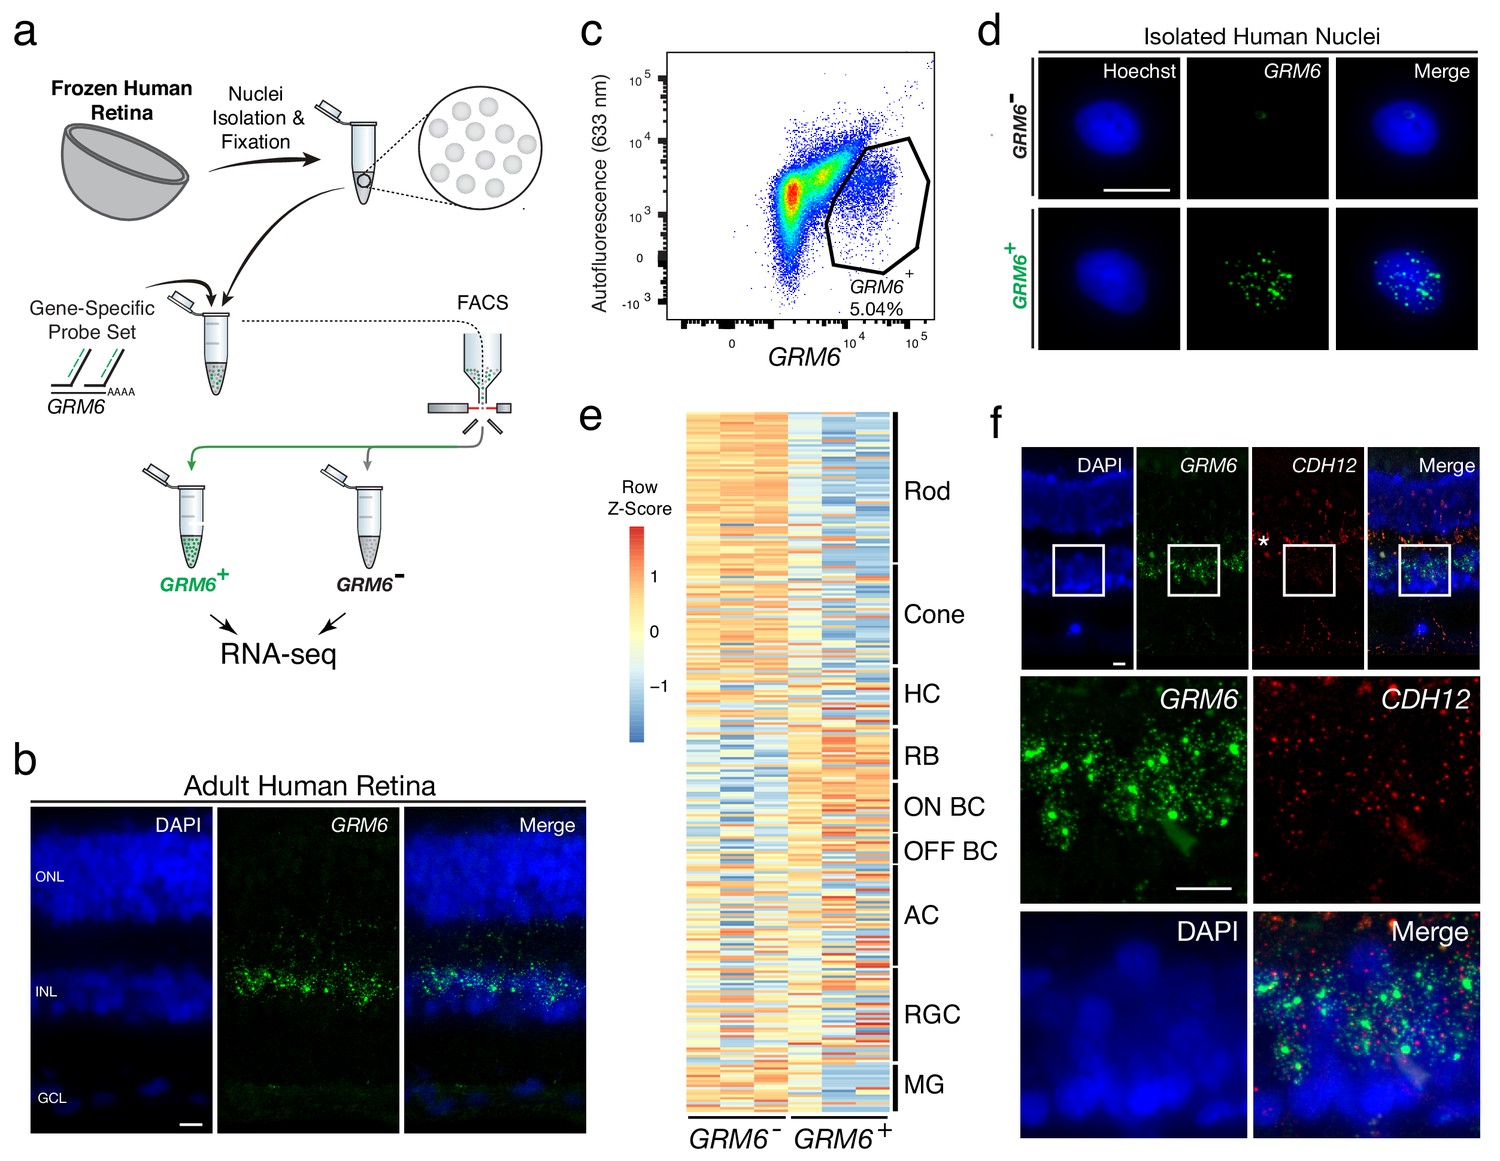
Transcriptional profiling of nuclear RNA isolated from specific BC subtypes from frozen human retina.
(a) Schematic of Probe-Seq for the fresh frozen adult human retina. Single nuclei were prepared and then fixed. Nuclei were incubated with a gene-specific probe set for GRM6 and then incubated with fluorescent oligos. GRM6+ and GRM6- populations were isolated by FACS for downstream RNA sequencing. (b) Image of an adult human retina section probed with a SABER GRM6 probe set. (c) FACS plot of all single nuclei with GRM6 fluorescence on the x-axis and autofluorescence (633 nm) on the y-axis. (d) Images of isolated nuclei processed using SABER-FISH for GRM6. (e) A heatmap representing relative expression levels of human retinal cell type markers previously identified by scRNA sequencing that are differentially expressed (adjusted p-value<0.05) between GRM6-, and GRM6+ populations. (f) High and low magnification images of a human retinal section after the SABER-FISH protocol for CDH12, a highly-enriched transcript in the GRM6+ population. Asterisk indicates high autofluorescence in the OPL. HC, Horizontal Cell; RGC, Retinal Ganglion Cell; AC, Amacrine Cell; ON BC, ON Bipolar Cell; RBC, Rod Bipolar Cell; OFF BC, OFF Bipolar Cell; MG, Müller Glia; ONL, Outer Nuclear Layer; INL, Inner Nuclear Layer; GCL, Ganglion Cell Layer. OPL, Outer Plexiform Layer. Scale bars: 10 µm (b, d, f).
Figure 2—figure supplement 1
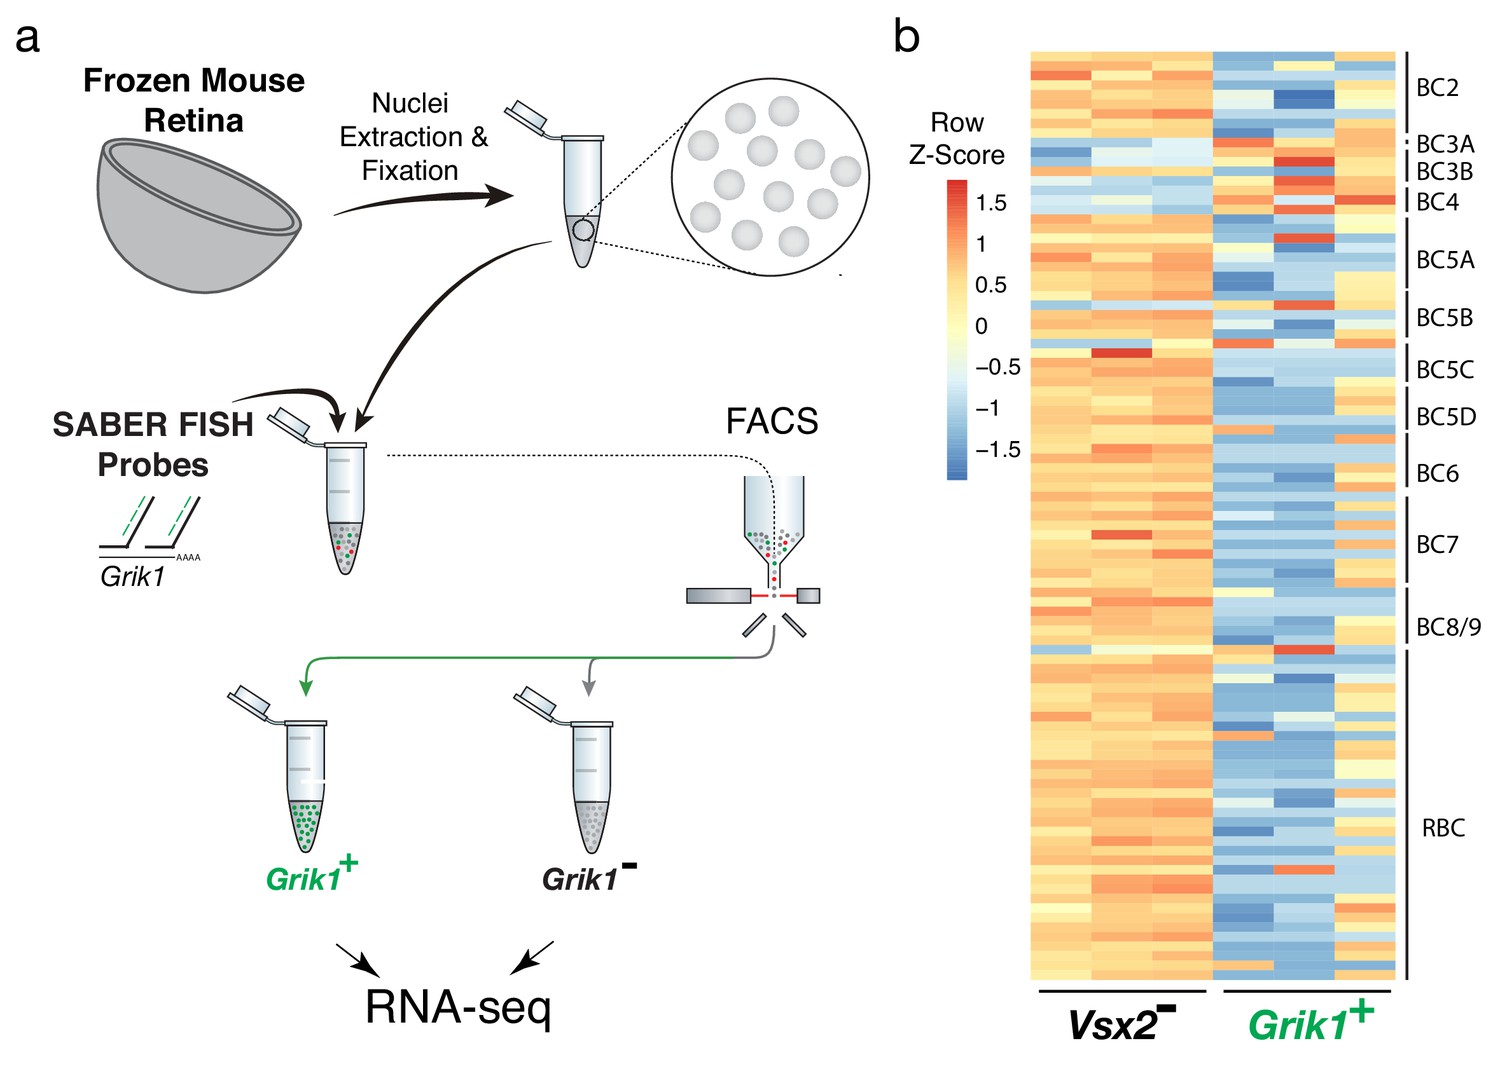
Isolation and transcriptional profiling of specific BC subtypes from the frozen mouse retina.
(a) Schematic of Probe-Seq for the fresh frozen adult mouse retina. Single nuclei were isolated and fixed. Nuclei were incubated with a gene-specific probe set for Grik1 and then incubated with fluorescent oligos. Grik1+ and Grik1- populations were isolated by FACS for downstream RNA sequencing. (b) A heatmap representing relative expression levels of mouse BC subtype markers previously identified by scRNA sequencing (Shekhar et al., 2016) that are differentially expressed (adjusted p-value<0.05) between Grik1-, and Grik1+ populations.
Figure 2—figure supplement 2
Quality control of human nuclear Probe-Seq RNA sequencing.
(a) Log2-transformed read distribution plot for sequenced human GRM6 Probe-Seq samples. (b) Dendrogram of read counts shows clustering of GRM6- and GRM6+ samples. (c) Plot of frequencies of p-values shows an even distribution of null p-values. (d) MA plot of log2 fold change vs. mean of normalized counts. Red dots indicate genes that are differentially expressed between GRM6+ and GRM6- samples.
Figure 3 with 2 supplements
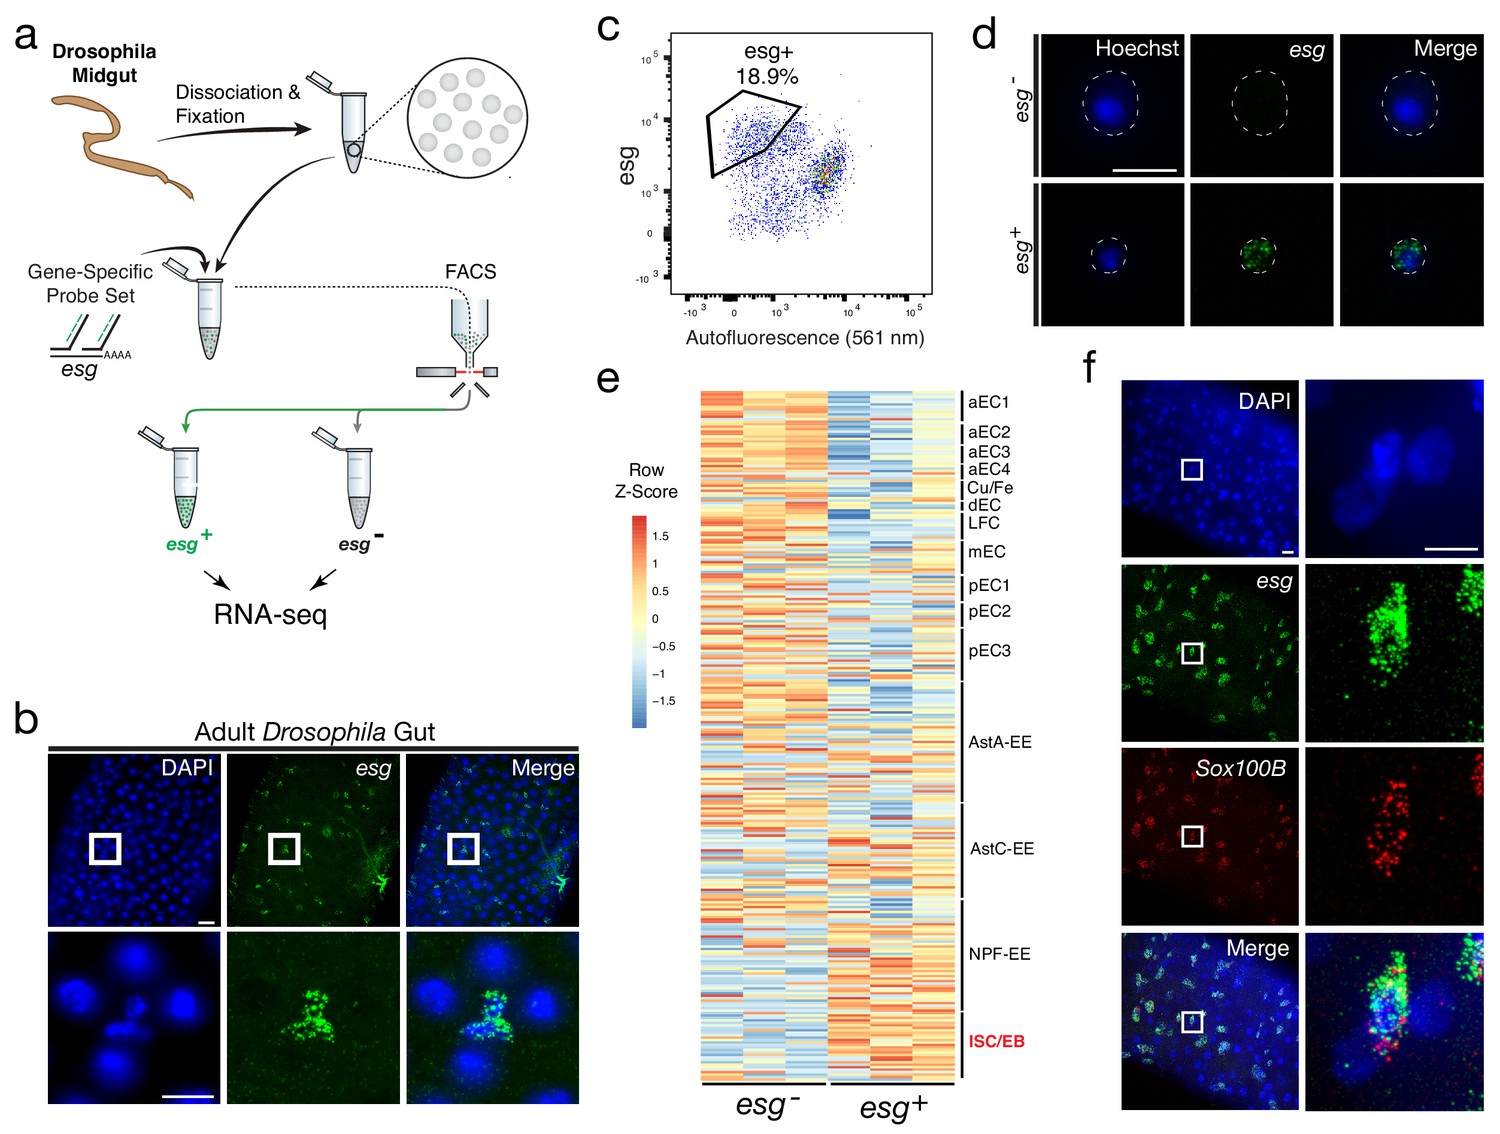
Isolation and transcriptional profiling of ISC/EBs from the adult Drosophila midgut.
(a) Schematic of Probe-Seq for the adult Drosophila midgut. Midguts from 7 to 10 day old female flies were dissociated into single cells and fixed. Cells were incubated with a gene-specific probe set for esg and subsequently incubated with fluorescent oligos. esg+ and esg- populations were isolated by FACS for downstream RNA sequencing. (b) Image of a wholemount adult Drosophila midgut following the SABER-FISH protocol using an esg probe set. (c) FACS plot of all single cells with esg fluorescence on the y-axis and autofluorescence (561 nm) on the x-axis. (d) Images of isolated midgut cells processed using SABER-FISH for esg before FACS. The white dotted lines demarcate cell outlines. (e) A heatmap representing relative expression levels of differentially expressed (adjusted p-value<0.05) genes for Drosophila gut cell type markers previously identified by scRNA sequencing, between esg-, and esg+ populations. esg is expressed in the ISC/EB population (highlighted in red). (f) Images of a Drosophila midgut wholemount after the SABER-FISH protocol for an ISC/EB marker, Sox100B, a highly-enriched transcript in the esg+ population. EC, Enterocyte; ISC, Intestinal Stem Cell; EB, Enteroblast; EE, Enteroendocrine Cell; LFC, Large Flat Cell; Cu/Fe, Copper/Iron Cells. Scale bars: 10 µm (d, f, right panels); 20 µm (b, upper panels f, left panels).
Figure 3—figure supplement 1
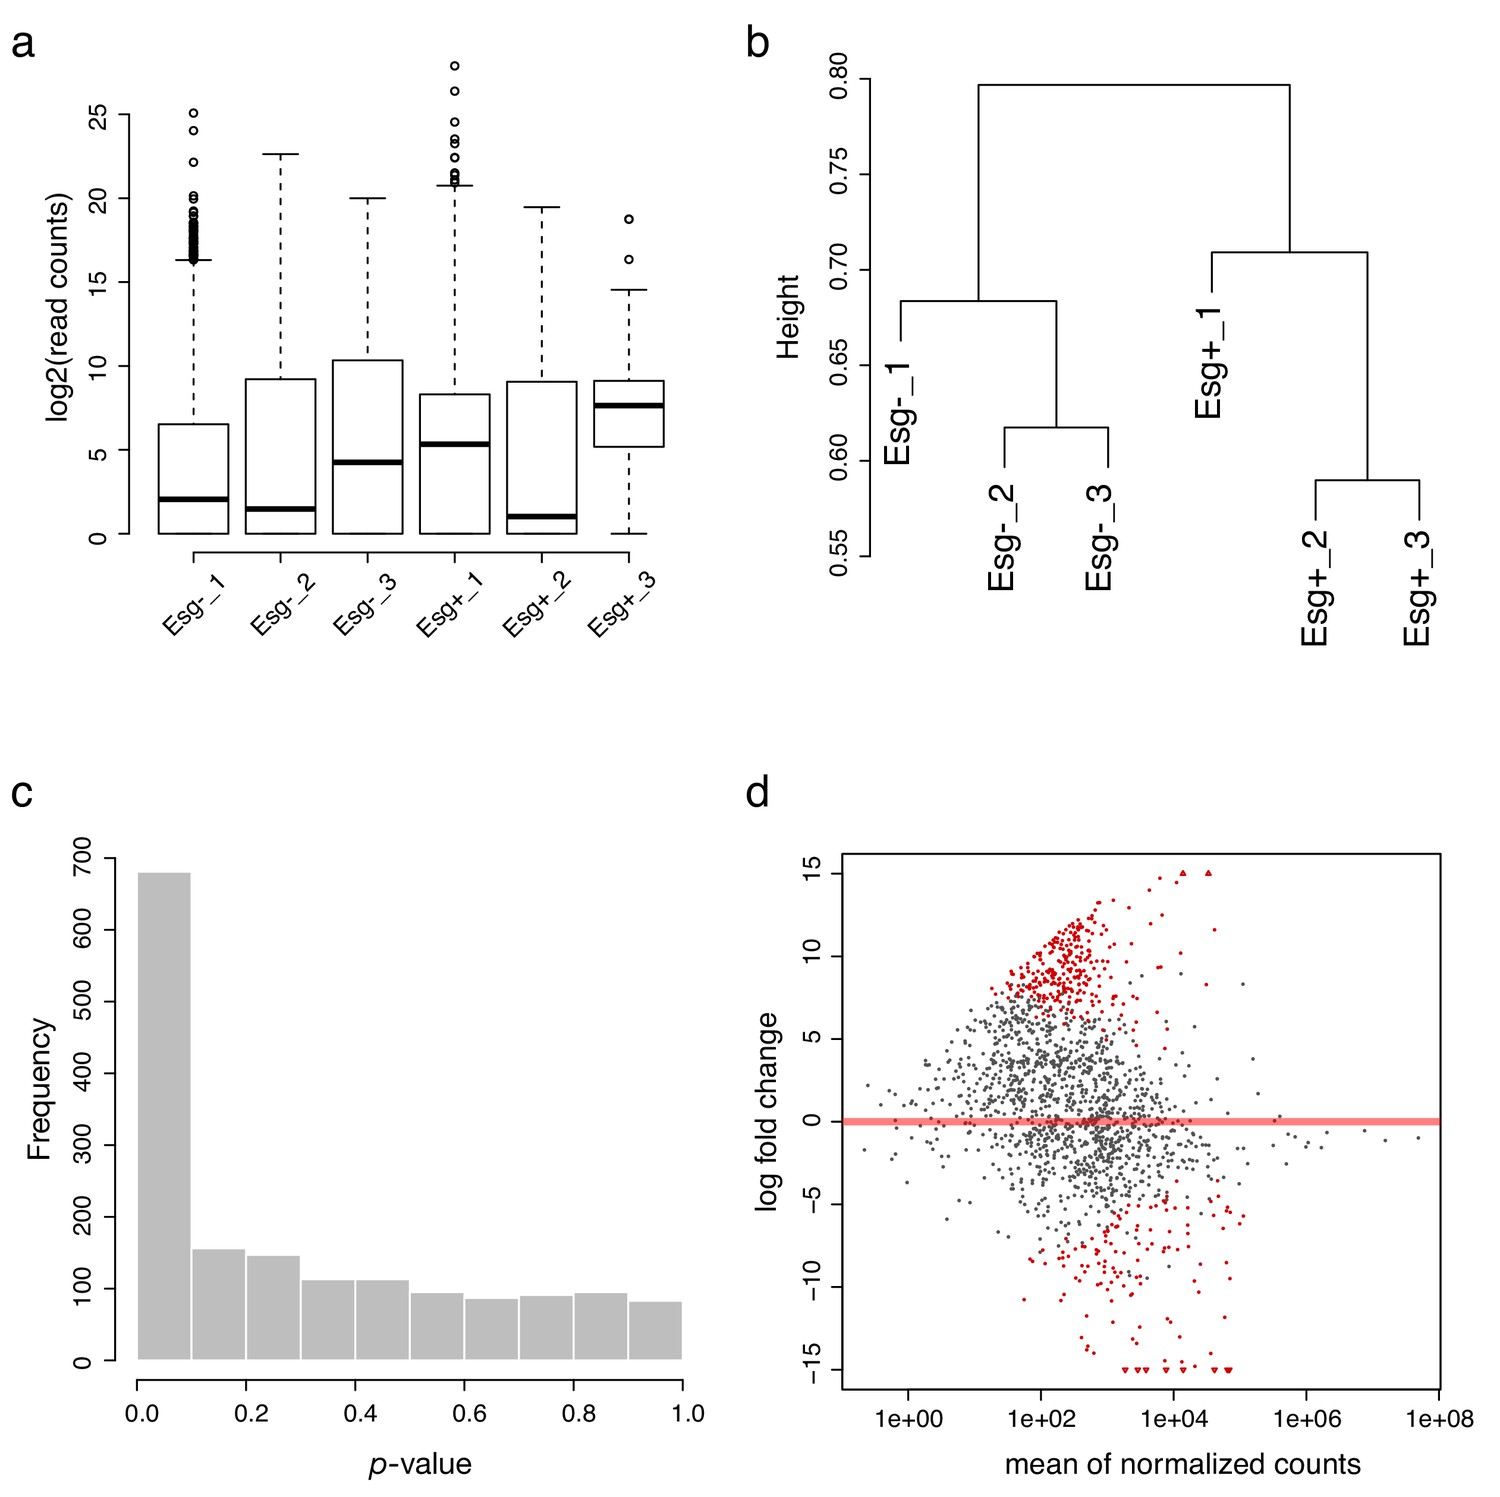
Quality control of Drosophila Probe-Seq RNA sequencing.
(a) Log2-transformed read distribution plot for sequenced Drosophila esg Probe-Seq samples. (b) Dendrogram of read counts shows clustering of esg- and esg+ samples. (c) Plot of frequencies of p-values shows an even distribution of null p-values. (d) MA plot of log2 fold change vs. mean of normalized counts. Red dots indicate genes that are differentially expressed.
Figure 3—figure supplement 2
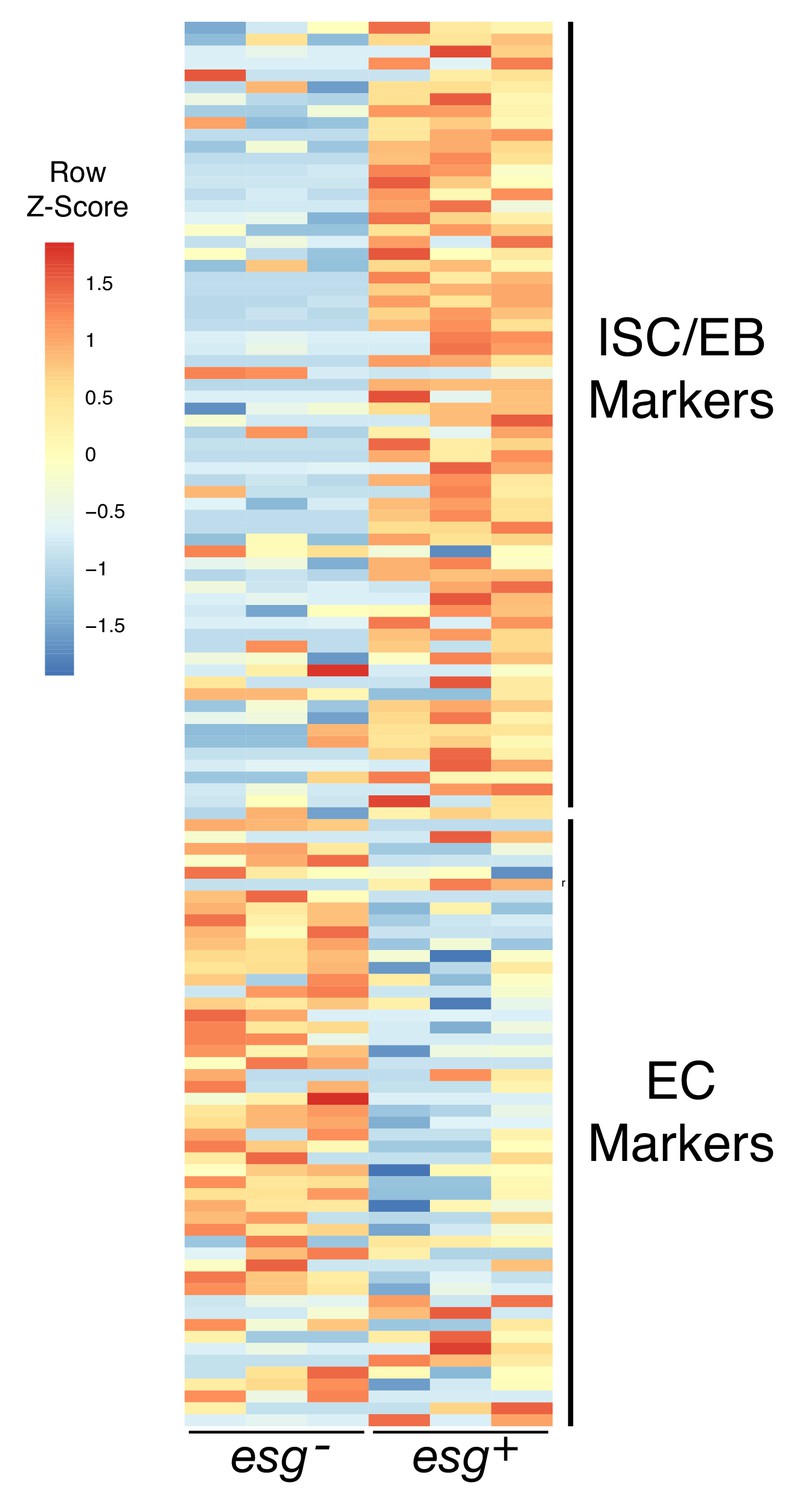
Heatmap of ISC/EB and EC markers based on DamID transcriptional profiling.
A heatmap representing relative expression levels of Drosophila ISC/EB and EC markers previously identified by DamID transcriptional profiling (adjusted p-value<0.05) between esg-, and esg+ populations (Doupé et al., 2018).
Figure 4 with 3 supplements
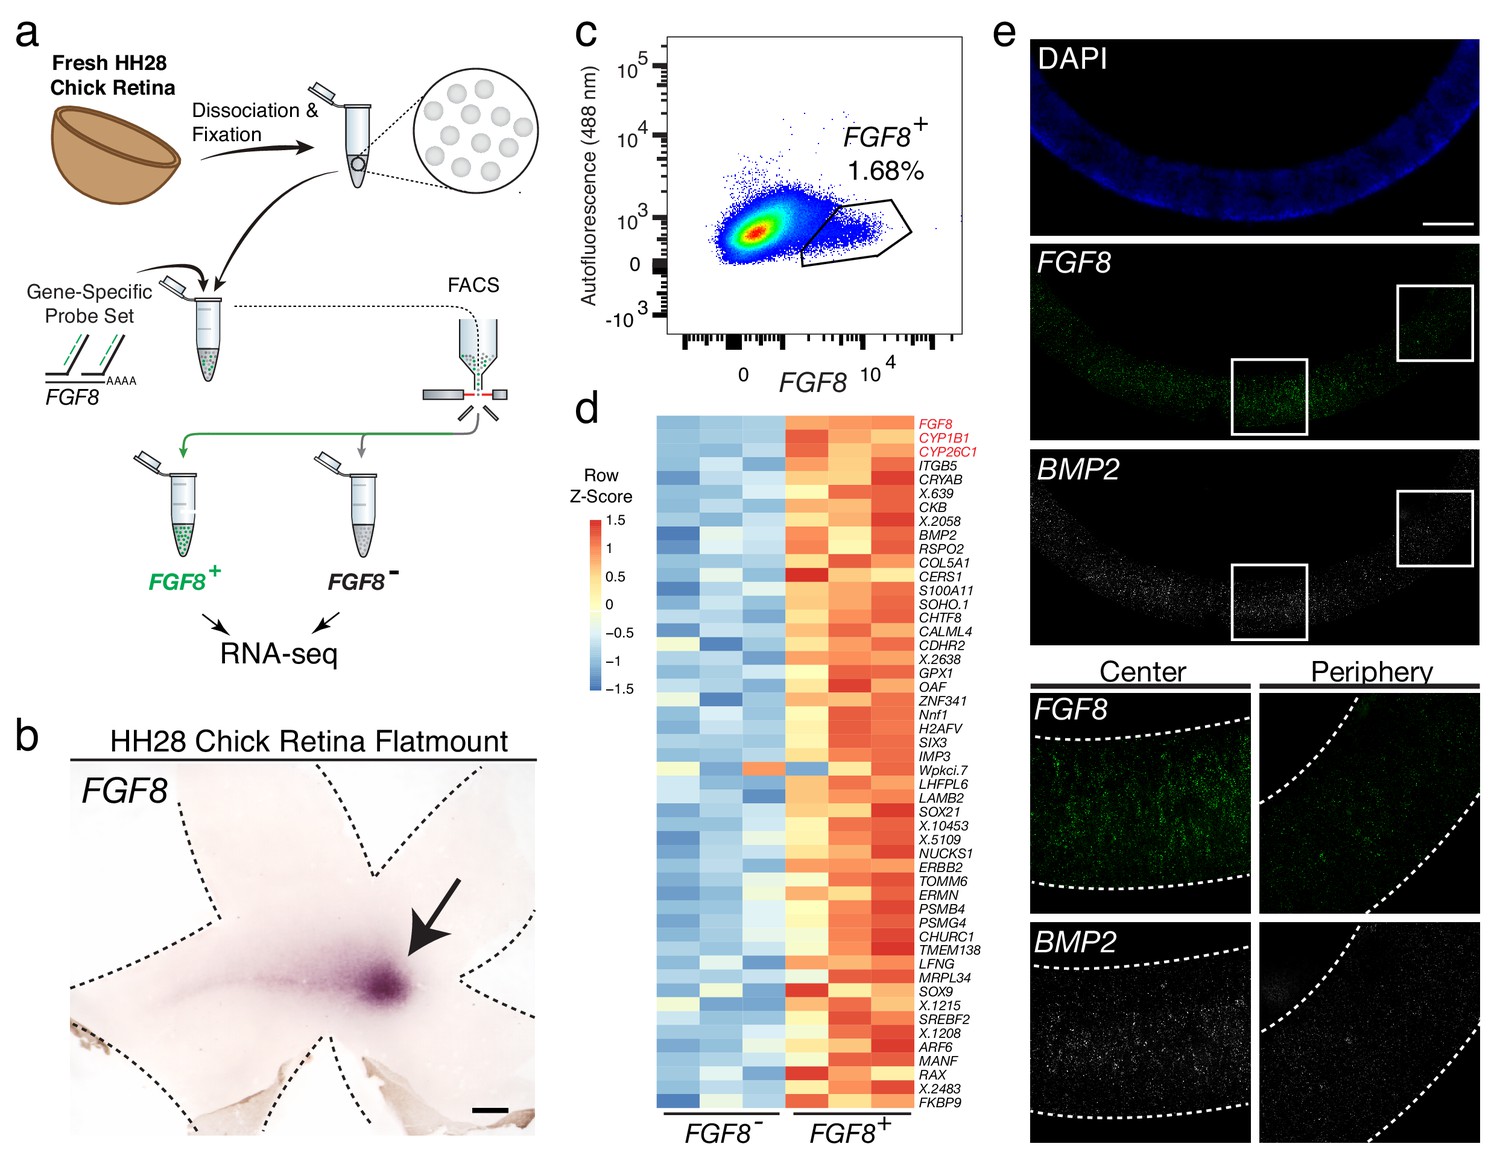
Probe-Seq identifies the transcriptional landscape of chick central retinal progenitor cells that give rise to the high acuity area.
(a) Schematic of Probe-Seq for the developing HH28 chick retina. The chick retina was dissociated into single cells and fixed. Cells were incubated with a gene-specific probe set for FGF8 and subsequently incubated with fluorescent oligos. FGF8+ and FGF8- populations were isolated by FACS for downstream RNA sequencing. (b) In situ hybridization of FGF8 on a HH28 chick retina flatmount. Arrow indicates region of FGF8 expression. Dotted lines demarcate retina outline. (c) FACS plot of all single cells with FGF8 fluorescence on the x-axis and empty autofluorescence (488 nm) on the y-axis. (d) A heatmap of unbiased top 50 genes that were enriched in the FGF8+ population compared to the FGF8- population. (e) Images of a section spanning the central HH28 chick retina after the SABER-FISH protocol for FGF8 and BMP2, a transcript highly enriched in the FGF8+ population, Scale bars: 500 µm (b); 50 µm (e).
Figure 4—figure supplement 1
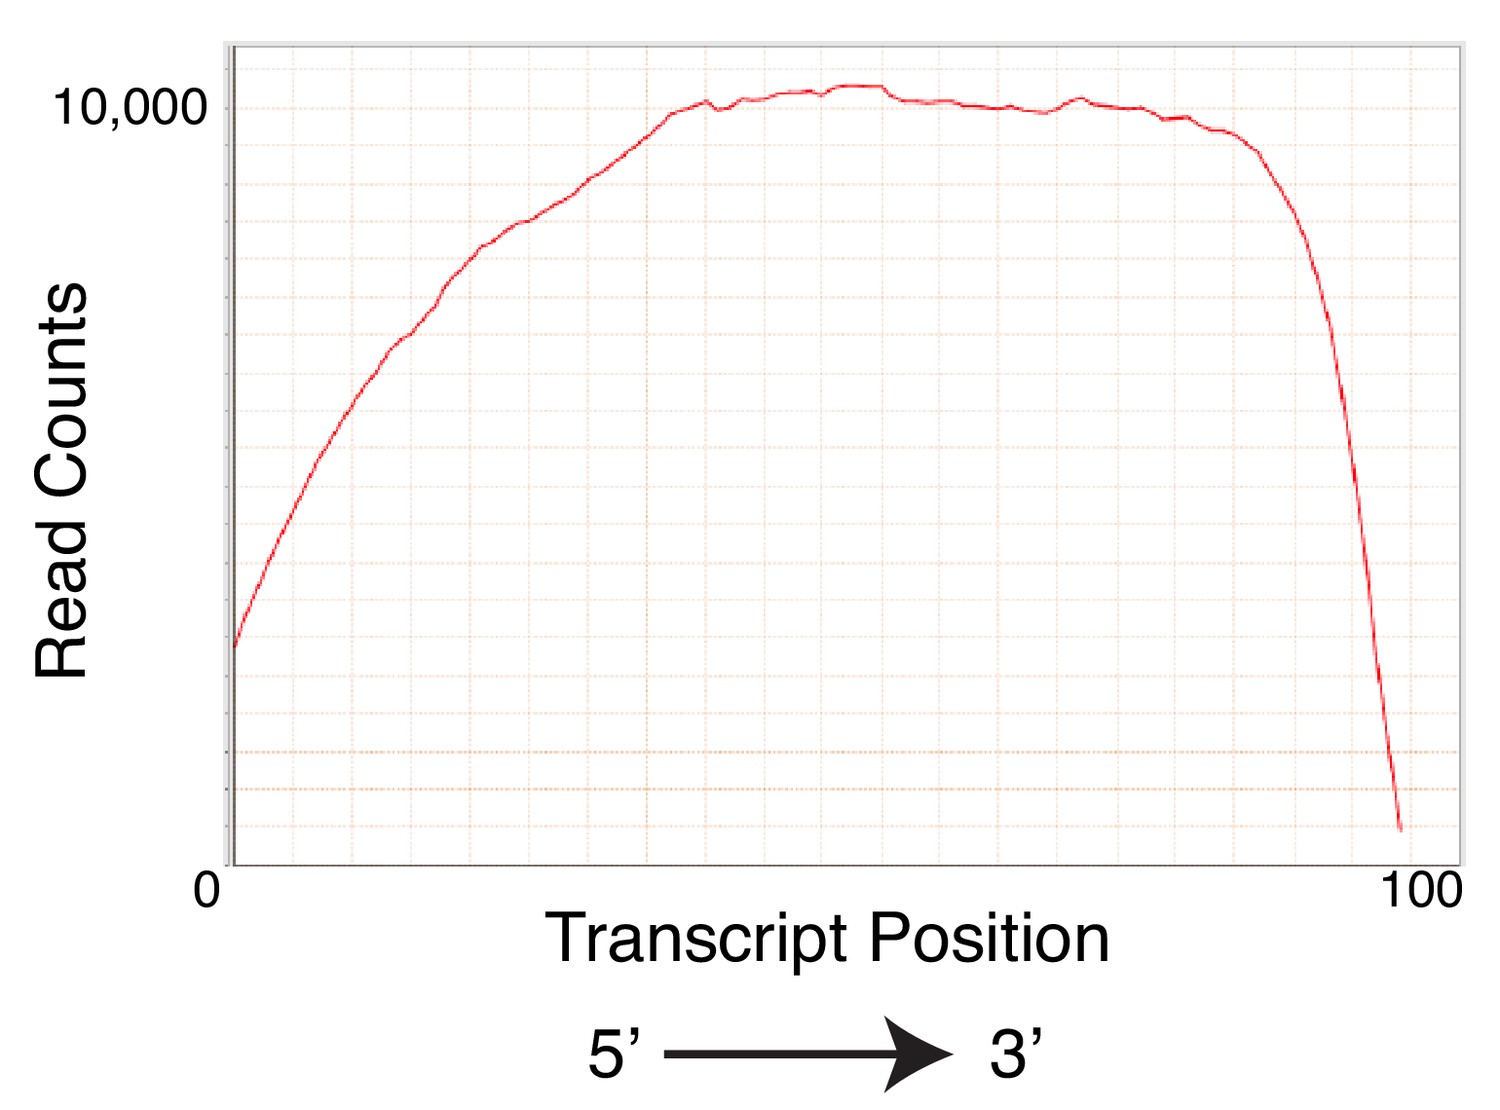
Uniform distribution of mapped reads from embryonic chick Probe-Seq for FGF8.
A representative graph of gene body coverage of mapped reads from chick Probe-Seq.
Figure 4—figure supplement 2
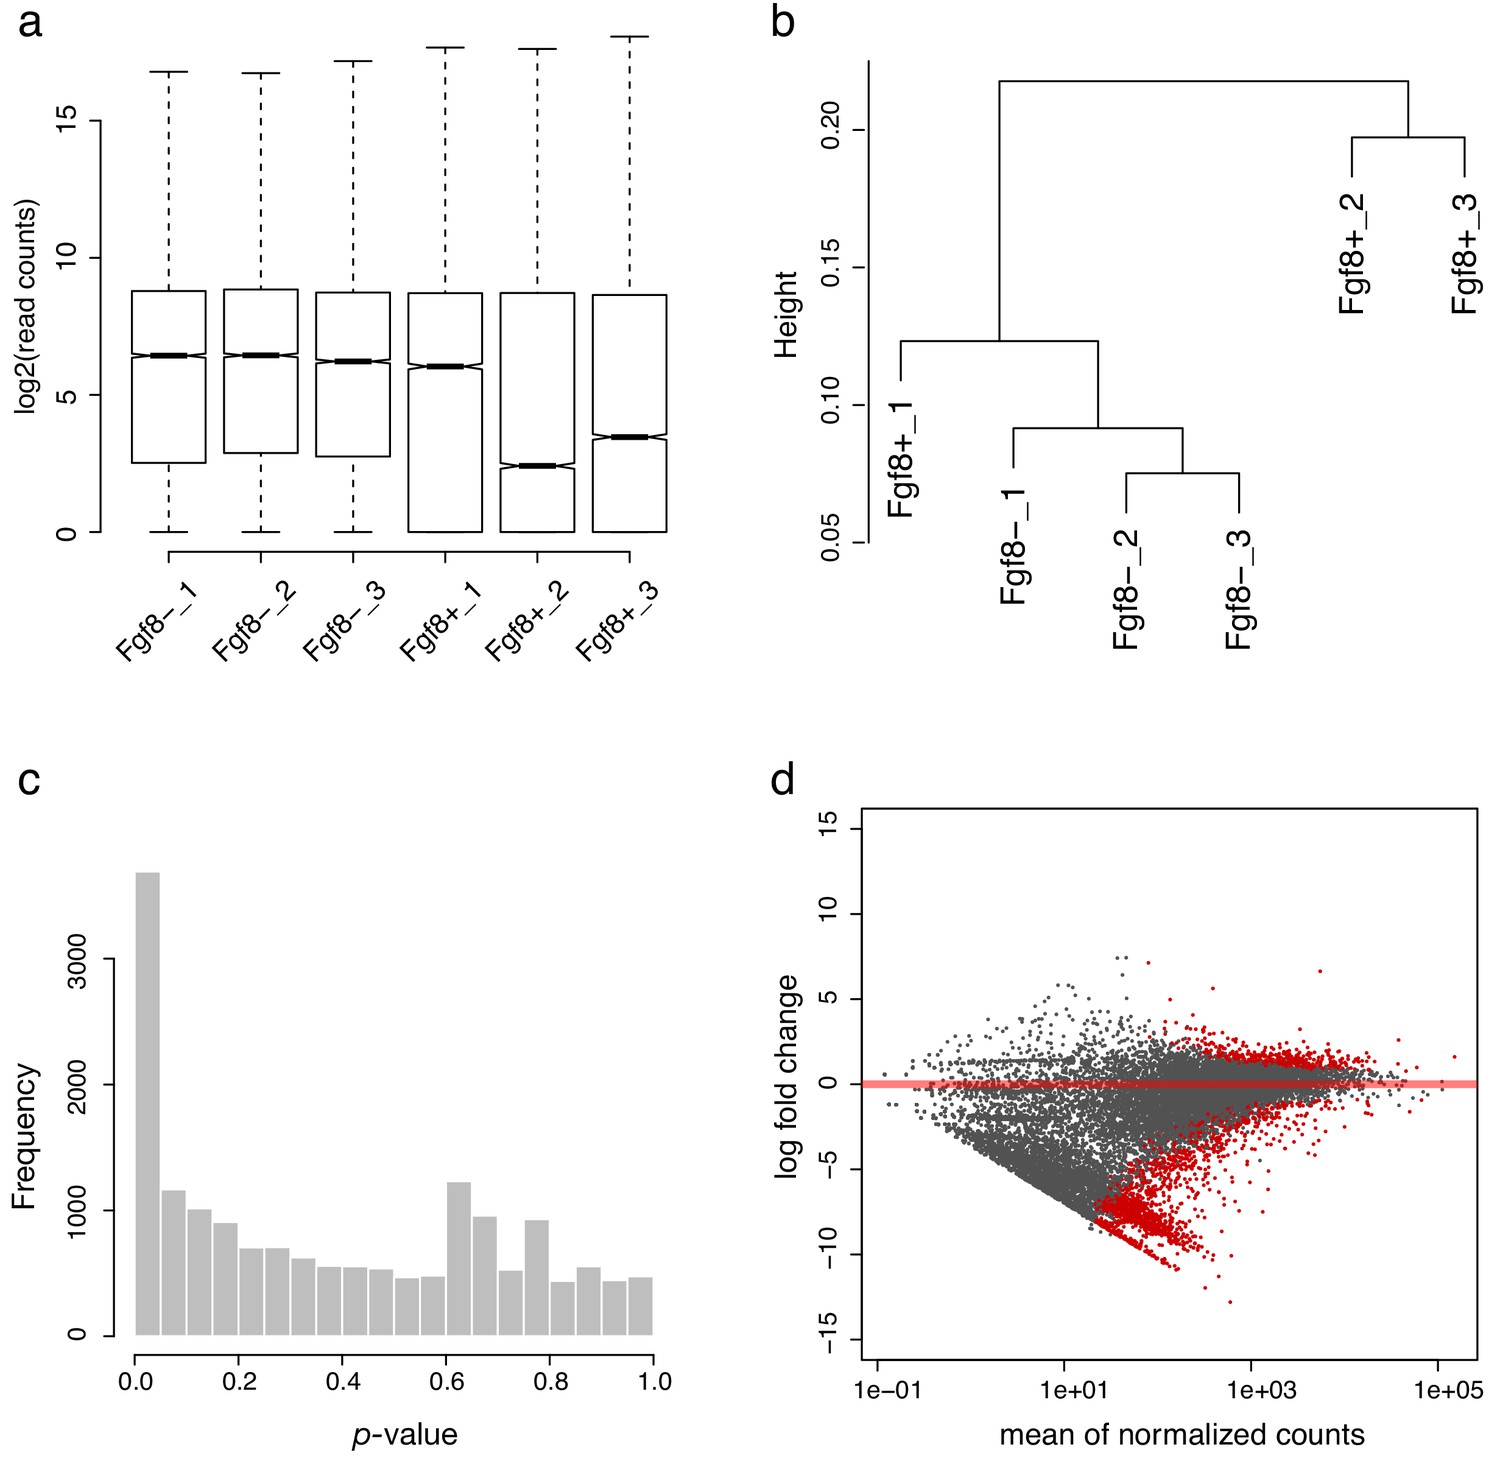
Quality control of developing chick retina Probe-Seq RNA sequencing.
(a) Log2-transformed read distribution plot for sequenced chick Probe-Seq samples. (b) Dendrogram of read counts shows clustering of FGF8- and FGF8+ samples except FGF8+−1. (c) Plot of frequencies of p-values shows an even distribution of null p-values. (d) MA plot of log2 fold change vs. mean of normalized counts. Red dots indicate genes that are differentially expressed.
Figure 4—figure supplement 3

Early differentiation markers are enriched in the FGF8- population.
A heatmap of top 50 unbiased differentially expressed genes between FGF8+ and FGF8- populations in the developing chick retina.
Tables
Key resources table
| Reagent type (species) or resource | Designation | Source or reference | Identifiers | Additional information |
|---|---|---|---|---|
| Gene (Mus musculus) | Vsx2 | Ensembl: ENSMUSG00000021239 | ||
| Gene (Mus musculus) | Grik1 | Ensembl: ENSMUSG00000022935 | ||
| Gene (Mus musculus) | Tpbgl | Ensembl: ENSMUSG00000096606 | ||
| Gene (Mus musculus) | Grm6 | Ensembl: ENSMUSG00000000617 | ||
| Gene (Mus musculus) | Neto1 | Ensembl: ENSMUSG00000050321 | ||
| Gene (Mus musculus) | Gad1 | Ensembl: ENSMUSG00000070880 | ||
| Gene (Homo sapiens) | GRM6 | Ensembl: ENSG00000113262 | ||
| Gene (Homo sapiens) | CDH12 | Ensembl: ENSG00000154162 | ||
| Gene (Drosophila melanogaster) | esg | FlyBaseID: FBgn0001981 | ||
| Gene (Drosophila melanogaster) | Sox100B | FlyBaseID: FBgn0024288 | ||
| Gene (Gallus gallus) | FGF8 | Ensembl: ENSGALG00000007706 | ||
| Gene (Gallus gallus) | BMP2 | Ensembl: ENSGALG00000029301 | ||
| Strain, strain background (Mus musculus) | CD1 | Charles River Laboratories | 022 | |
| Strain, strain background (Drosophila melanogaster) | Oregon-R | |||
| Strain, strain background (Gallus gallus) | White Leghorn | Charles River Laboratories | ||
| Sequence-based reagent | Variable oligos | This Paper | See Supplementary Table for sequences | |
| Commercial assay or kit | RecoverAll Total Nuclear Isolation Kit | Thermo Fisher Scientific | AM1975 | |
| Commercial assay or kit | SMART-Seq v.4 Ultra Low Input RNA kit | Takara Bio | 634890 | |
| Commercial assay or kit | Nextera XT DNA Library Prep Kit | Illumina | FC1311096 |
Additional files
-
Source code 1
R code for differential expression alaysis.
- https://cdn.elifesciences.org/articles/51452/elife-51452-code1-v1.zip
-
Supplementary file 1
List of oligos used to generate gene-specific probe sets, fluorescent oligos, and hairpins.
- https://cdn.elifesciences.org/articles/51452/elife-51452-supp1-v1.xlsx
-
Transparent reporting form
- https://cdn.elifesciences.org/articles/51452/elife-51452-transrepform-v1.docx
Download links
A two-part list of links to download the article, or parts of the article, in various formats.
Downloads (link to download the article as PDF)
Open citations (links to open the citations from this article in various online reference manager services)
Cite this article (links to download the citations from this article in formats compatible with various reference manager tools)
Probe-Seq enables transcriptional profiling of specific cell types from heterogeneous tissue by RNA-based isolation
eLife 8:e51452.
https://doi.org/10.7554/eLife.51452


