Novel insights into breast cancer copy number genetic heterogeneity revealed by single-cell genome sequencing
- Cold Spring Harbor Laboratory, United States
- Department of Molecular and Cellular Biology, Stony Brook University, United States
- Philips Research North America, Biomedical Informatics, United States
- Department of Genetics, Stanford University School of Medicine, United States
- Department of Applied Mathematics and Statistics, Stony Brook University, United States
- Center for Molecular Oncology, Memorial Sloan Kettering Cancer Center, United States
- Department of Surgery, Memorial Sloan Kettering Cancer Center, United States
- Molecular Cytogenetics Core Facility, Memorial Sloan Kettering Cancer Center, United States
- Case Comprehensive Cancer Center, Case Western Reserve University, United States
- House Gordon Software Company LTD, Canada
- Division of Hematology/Oncology, Department of Medicine, Case Western Reserve University School of Medicine, United States
- Seidman Cancer Center, University Hospitals of Case Western, United States
Figures
Figure 1 with 3 supplements

Genetic heterogeneity of immune cells and pseudo-diploid cells in breast cancer biopsies.
(A) Genome-wide copy number view of representative single-cell T-cell genomes illustrating T-Cell Receptor alpha (TCRa) and beta (TCRb) deletions. (B) Genome-wide copy number view of representative single-cell B-cell genomes illustrating light (IGL) and heavy (IGH) immunoglobulin deletions. (C) Bar plot quantification of T-cells, B-cells, pseudo-diploid cells and other non-tumor cells identified in profiled tumor biopsies. (D) Zoomed in views of TCRa deletion breakpoints in single T-cells found in tumors biopsies (P15 and P9), blood purified CD8+/4+ T-cells, and single-leukemic cells derived from a T-cell leukemia. (E) Representative genome-wide copy number plot of a T-cell exhibiting X-chromosome loss. Insert – bar plot quantification of X-loss T-cells in ER+ and ER- tumors. Asterisk denotes statistical significance based on chi-square test (p-value=0.0047). (F) Left panel: Frequency plot of CNAs identified in a panel of 200 breast cancer genomes. Highly recurrent alterations, such as 1q gain and 16 p loss are noted. Right Panel: Representative copy number plots of pseudo-diploid single-cell genomes illustrating the occurrence of recurrent breast cancer CNAs in these cells.
-
Figure 1—source data 1
Patient sample associated metadata.
- https://cdn.elifesciences.org/articles/51480/elife-51480-fig1-data1-v1.xlsx.zip
Figure 1—figure supplement 1
Characteristics of tumor samples profiled in the study.
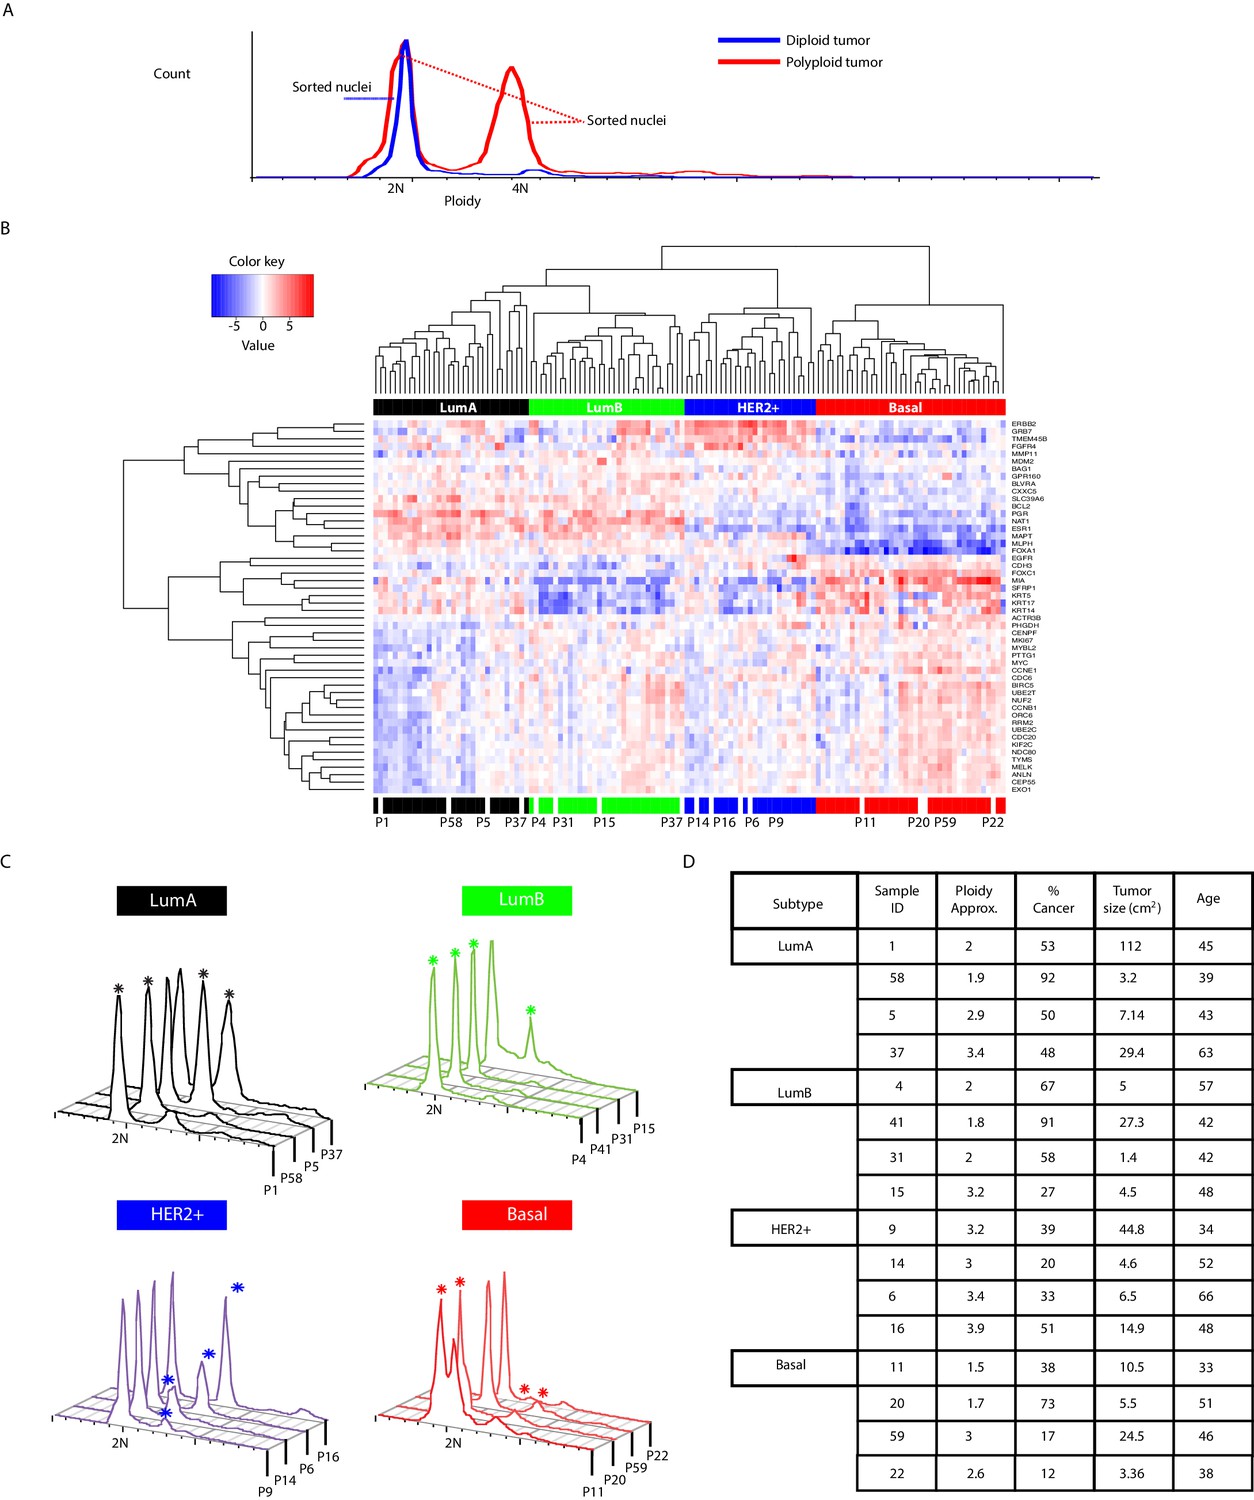
(A) Schematic illustration of single-nuclei sorting strategy employed in the study. (B) Hierarchal clustering heatmap of breast cancer samples illustrating PAM50 subtype information based on differential gene expression analysis. Tumors analyzed in the present study (n = 16) are annotated. (C) Flow cytometric profiles of analyzed tumors illustrating ploidy distributions as measured by DNA content using DAPI staining. Asterisk denotes distribution/ploidy peak where cancer cells were detected in the single-nuclei sequencing data. (D) Illustration of summary statistics: approximate ploidy, tumor cellularity (% cancer), tumor size, and patient age of analyzed tumor samples. Ploidy and cellularity statistics are based on flow cytometry and single-nuclei sequencing data.
Figure 1—figure supplement 2
Single-cell sequencing analysis of T-cells retrieved from purified lymphocytes and T-cells identified in breast cancer tissue biopsies.
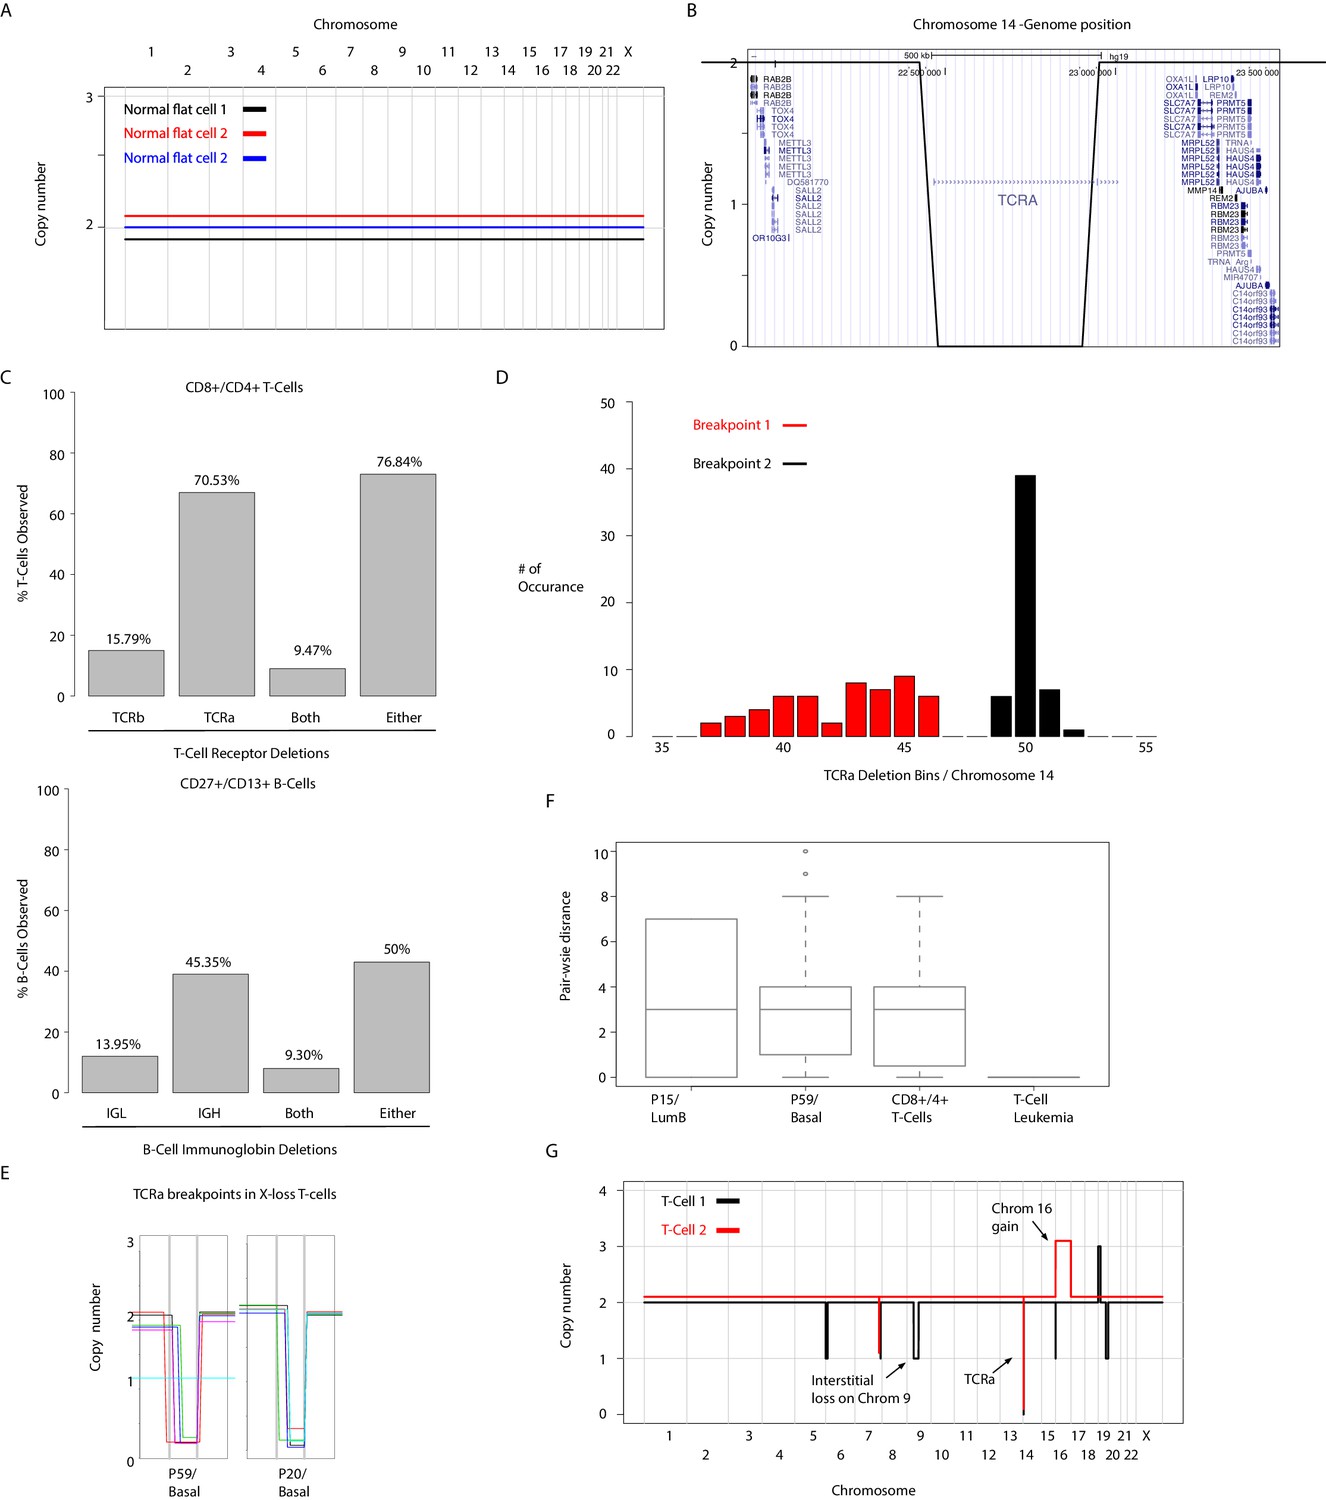
(A) Representative genome-wide copy number profiles of normal cells showing non-rearranged ‘flat’ genomes. (B) Zoom-in-view of deletion genomic coordinates at the TCRalpha locus of a representative single T-cell genome. (C) Left panel, bar plot quantification of TCRalpha (TCRa) and TCRbeta (TCRb) deletion frequencies observed in 95 sequenced single CD4+/CD8+ T-cells. Right panel, bar plot illustration of light chain (IGL) and heavy chain (IGH) deletion detection frequencies derived from single-cell sequencing of 93 CD27+/CD13+ B-cells. (D) Breakpoint analysis of TCRa deletions in CD4+/CD8+ T-cells illustrating the heterogeneity of breakpoint occurrence in genomic bins. (E) Zoom-in-view of the heterogeneity of TCRa deletion breakpoints found in X-loss T-cells identified from two representative patients tumors. (F) Pair-wise distances of genomic bins within TCRa deletion breakpoints in single T-cells found in tumors biopsies (P15 and P59), blood purified CD8+/4+ T-cells, and single-leukemic cells derived from T-cell leukemia. (G) Representative genome-wide copy number profiles of T-cells with karyotypic abnormalities. Examples shown are: gain on chromosome 16 and an interstitial deletion on chromosome nine in two different T-cells genomes.
Figure 1—figure supplement 3
Copy number alterations in pseudo-diploid cells identified in tumor samples.
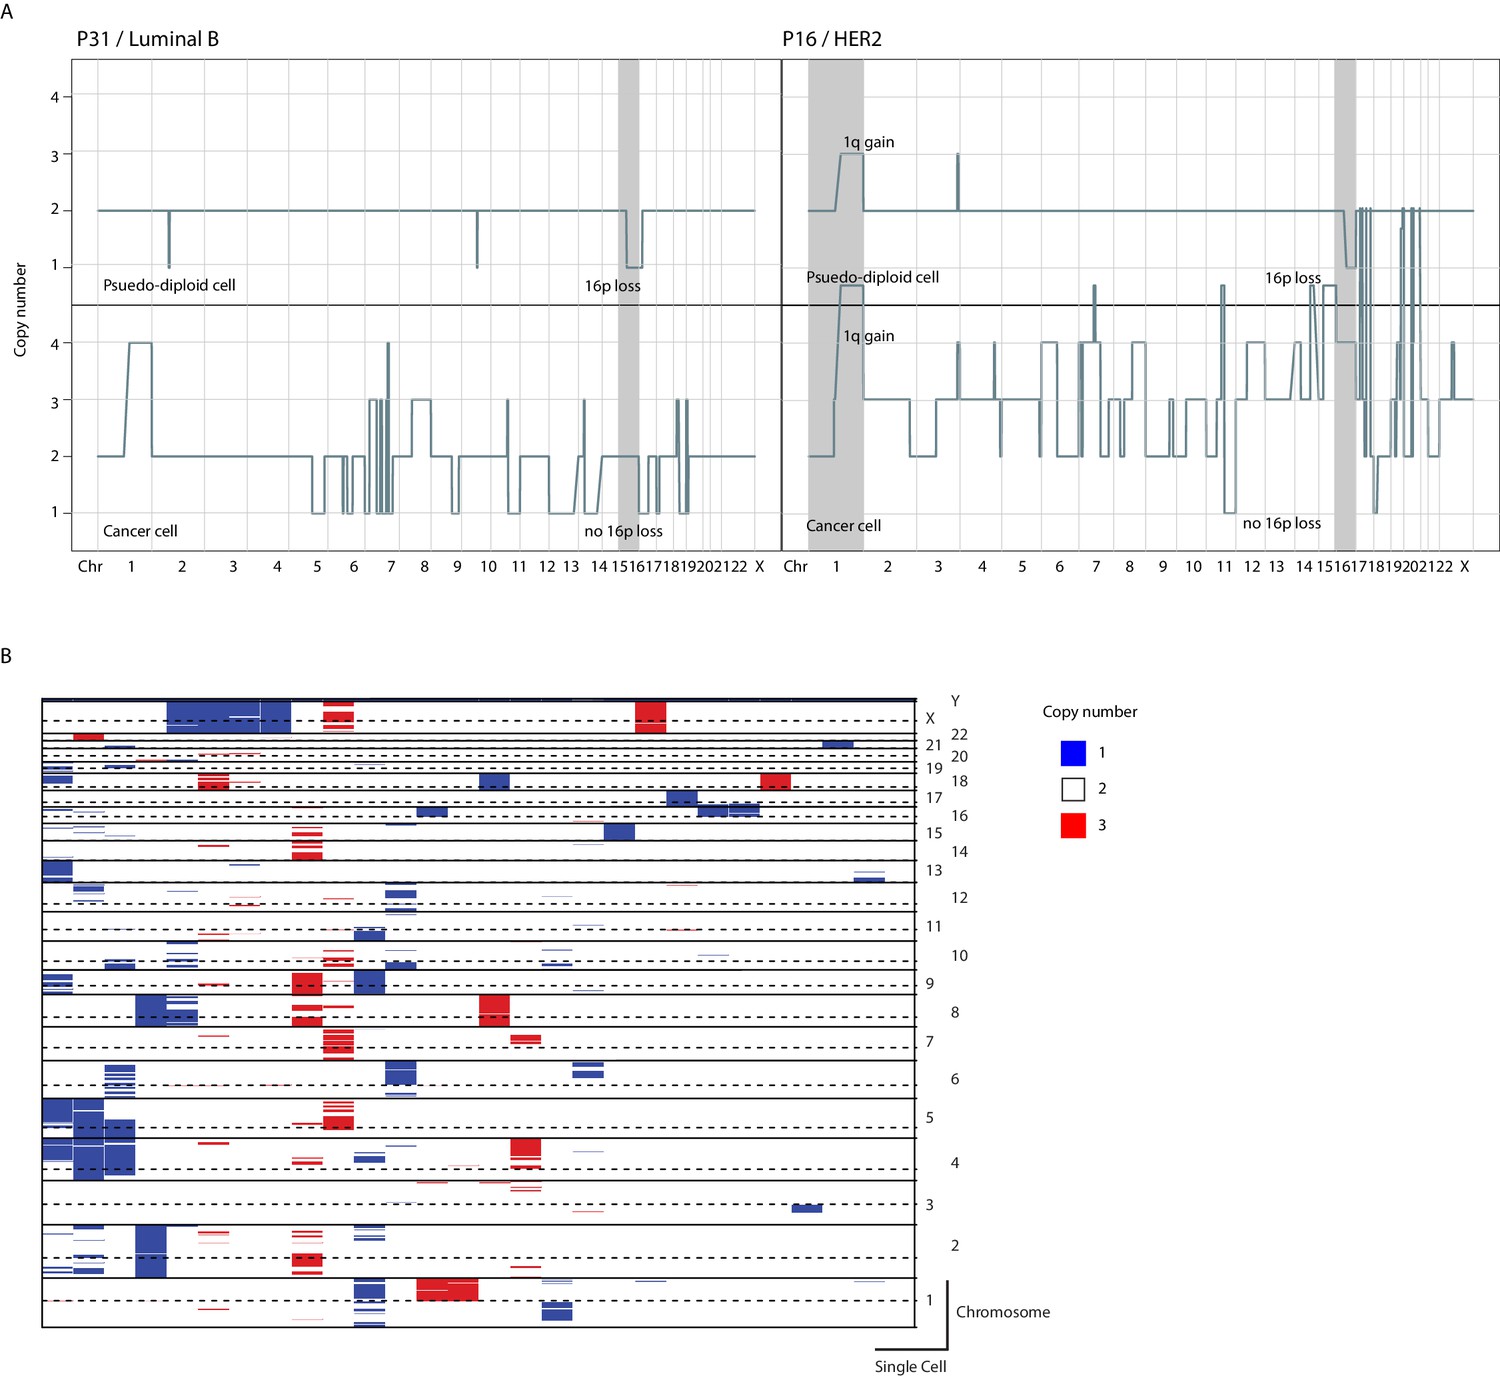
(A) Representative genome-wide copy number profiles of patient matched pseudo-diploid and cancer cells from two patients. Shaded in gray are chromosomes where pseudo-diploid CNAs are identified. (B) Heatmap illustration of copy number profiles of all identified (n = 28) pseudo-diploid single cells in analyzed tumor samples.
Figure 2 with 2 supplements

Copy number heterogeneity impacts a significant proportion of breast cancer genomes and occurs at regions in the genome that are biologically and clinically important.
(A) Schematic illustration of CNA heterogeneity in tumor P5. Single-cell genomes (n = 131) are plotted on the same copy number diagram. Heterogeneous/sub-clonal regions can be identified by the presence of multiple copy number states (ex: 1q and chromosome 13). Red arrows point to representative clonal alterations. Blue arrows point to representative sub-clonal alterations. (B) Quantification of copy number heterogeneity as fraction (%) of the genome found to be sub-clonal across all sequenced biopsies. (C–H) Representative chromosome wide views of identified sub-clonal CNAs affecting: regions recurrently altered in breast cancer genomes by CNAs (C), regions containing genes of therapeutic relevance (D), regions containing genes known to be affected by somatic SNVs (E), regions with experimental evidence of involvement in breast cancer metastasis (F), regions found at three or more different copy number states (G). Gray vertical bars denote the location of genes or CNAs. (H) Distant relapse-free survival curves for cases with 1q and 8q gains that are ER+ and HER2- (n = 428). Cases are stratified based on their level of 1q or 8q gain (low vs. high).
-
Figure 2—source data 1
Inferred integer copy number values of all single cancer nuclei sequenced for all patients.
- https://cdn.elifesciences.org/articles/51480/elife-51480-fig2-data1-v1.zip
Figure 2—figure supplement 1
Copy number heterogeneity variably affects the genomes of breast cancers.
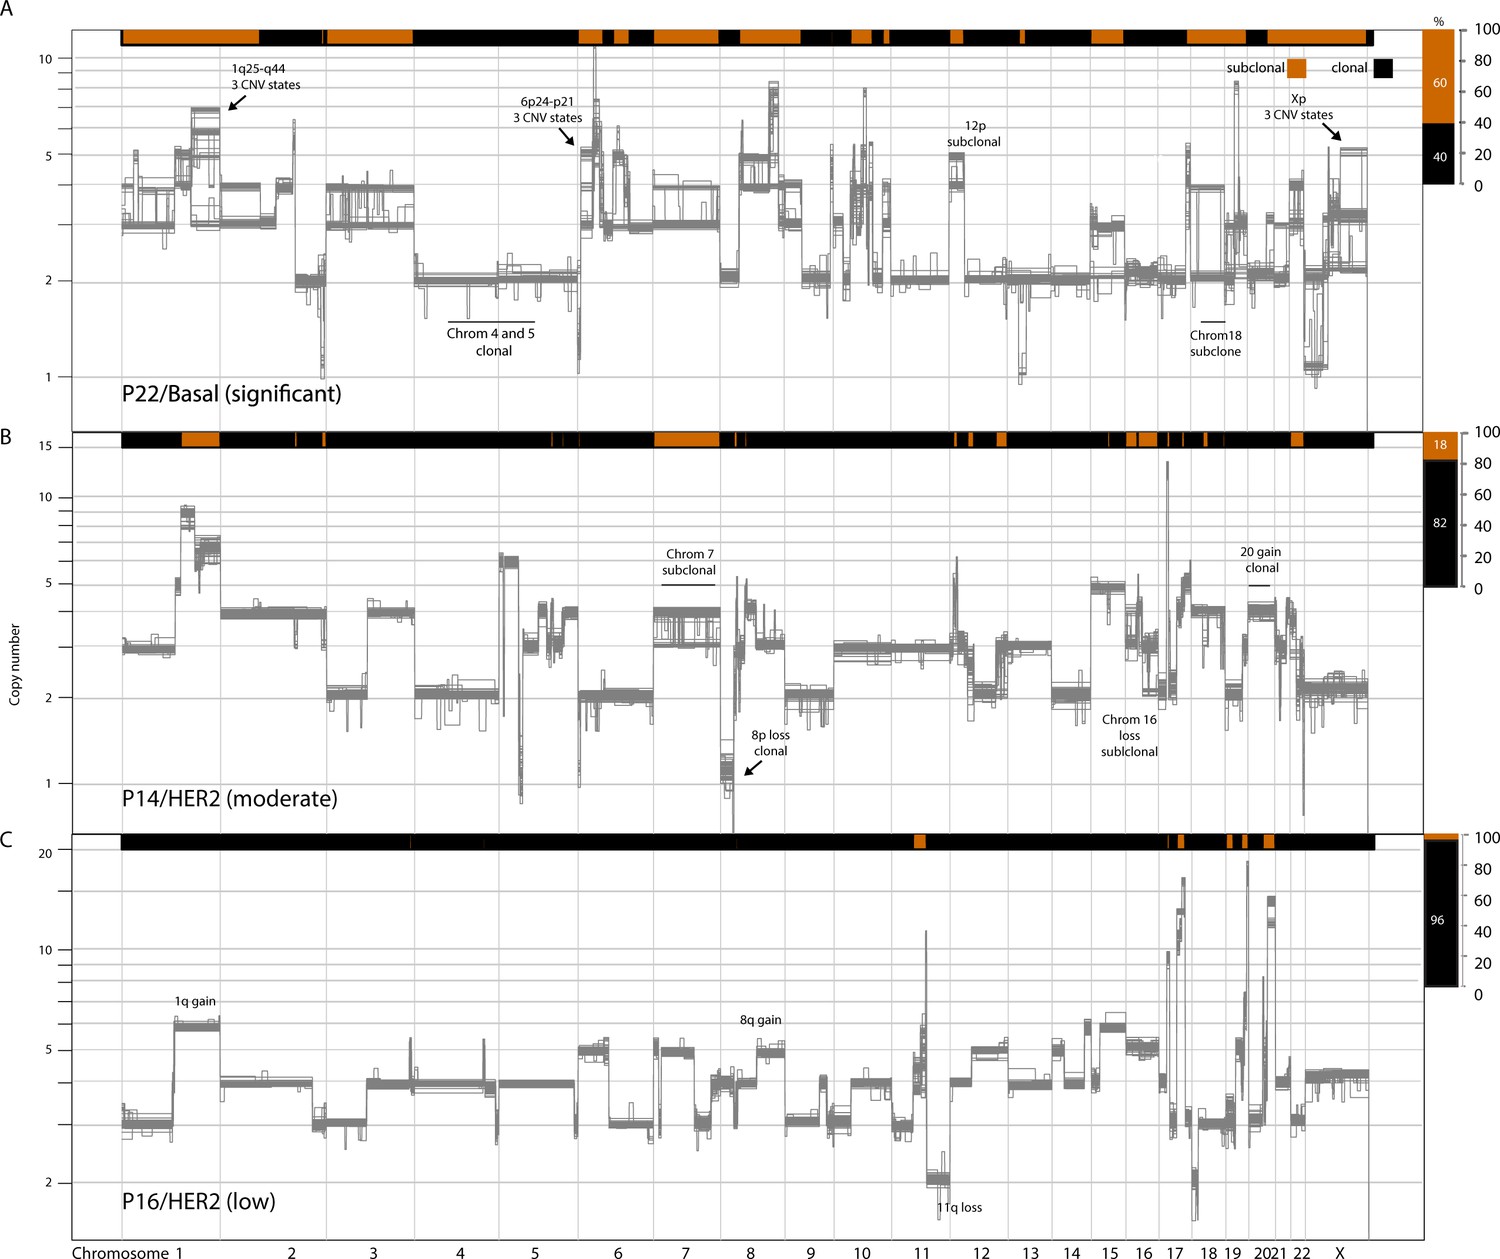
Schematic illustration of representative tumors with varying levels of copy number heterogeneity found in the analyzed tumor cohort: significant (A), moderate (B), and low (C).
Figure 2—figure supplement 2

Copy number heterogeneity occurs in regions of the genome that are important and harbor biologically relevant breast cancer genes.
(A) Chromosome zoom-in-views of regions affected by copy number heterogeneity that are important in breast cancer genomes. Categories are: regions recurrently altered by CNA, regions harboring therapeutically relevant genes, regions harboring genes known to be recurrently altered by SNV, and regions harboring genes for which experimental evidence exists for importance in the metastatic process. (B) DNA-FISH validation of a selected subset of heterogeneous CNAs. The selected alterations are: Chromosome 16q and 16 p sub-clonality seen in HER2+ tumor P14 (left panel) and PIK3CA sub-clonality in a LumA tumor, P5 (right panel). (C) Distant relapse-free survival curves for all METABRIC cases with 1q/8q gains(n = 446). Within the cohort that was ER+/HER2-, survival curves are also shown for patients that are lymph node positive (LN+, n = 192) and lymph node negative (LN-, n = 236). (D) Contingency table summarizing the relationship between high- vs. low-level 1q/8q amplification and IntClust (IC) subtype1 for all METABRIC cases with 1q/8q amplification. Among high risk ER+/HER2- groups (IC 1,2,6,9)2, IC9 has the highest rate of high level 1q/8q amplifications. A t-test for proportions between IC 9 (high risk) vs IC 3 (lower risk) shows that high-level 1q/8q amplifications are statistically significantly more likely to occur in IC9 (p-value=3.021e-07).
Figure 3 with 2 supplements
Different forms of genetic heterogeneity in chromosomal amplifications.
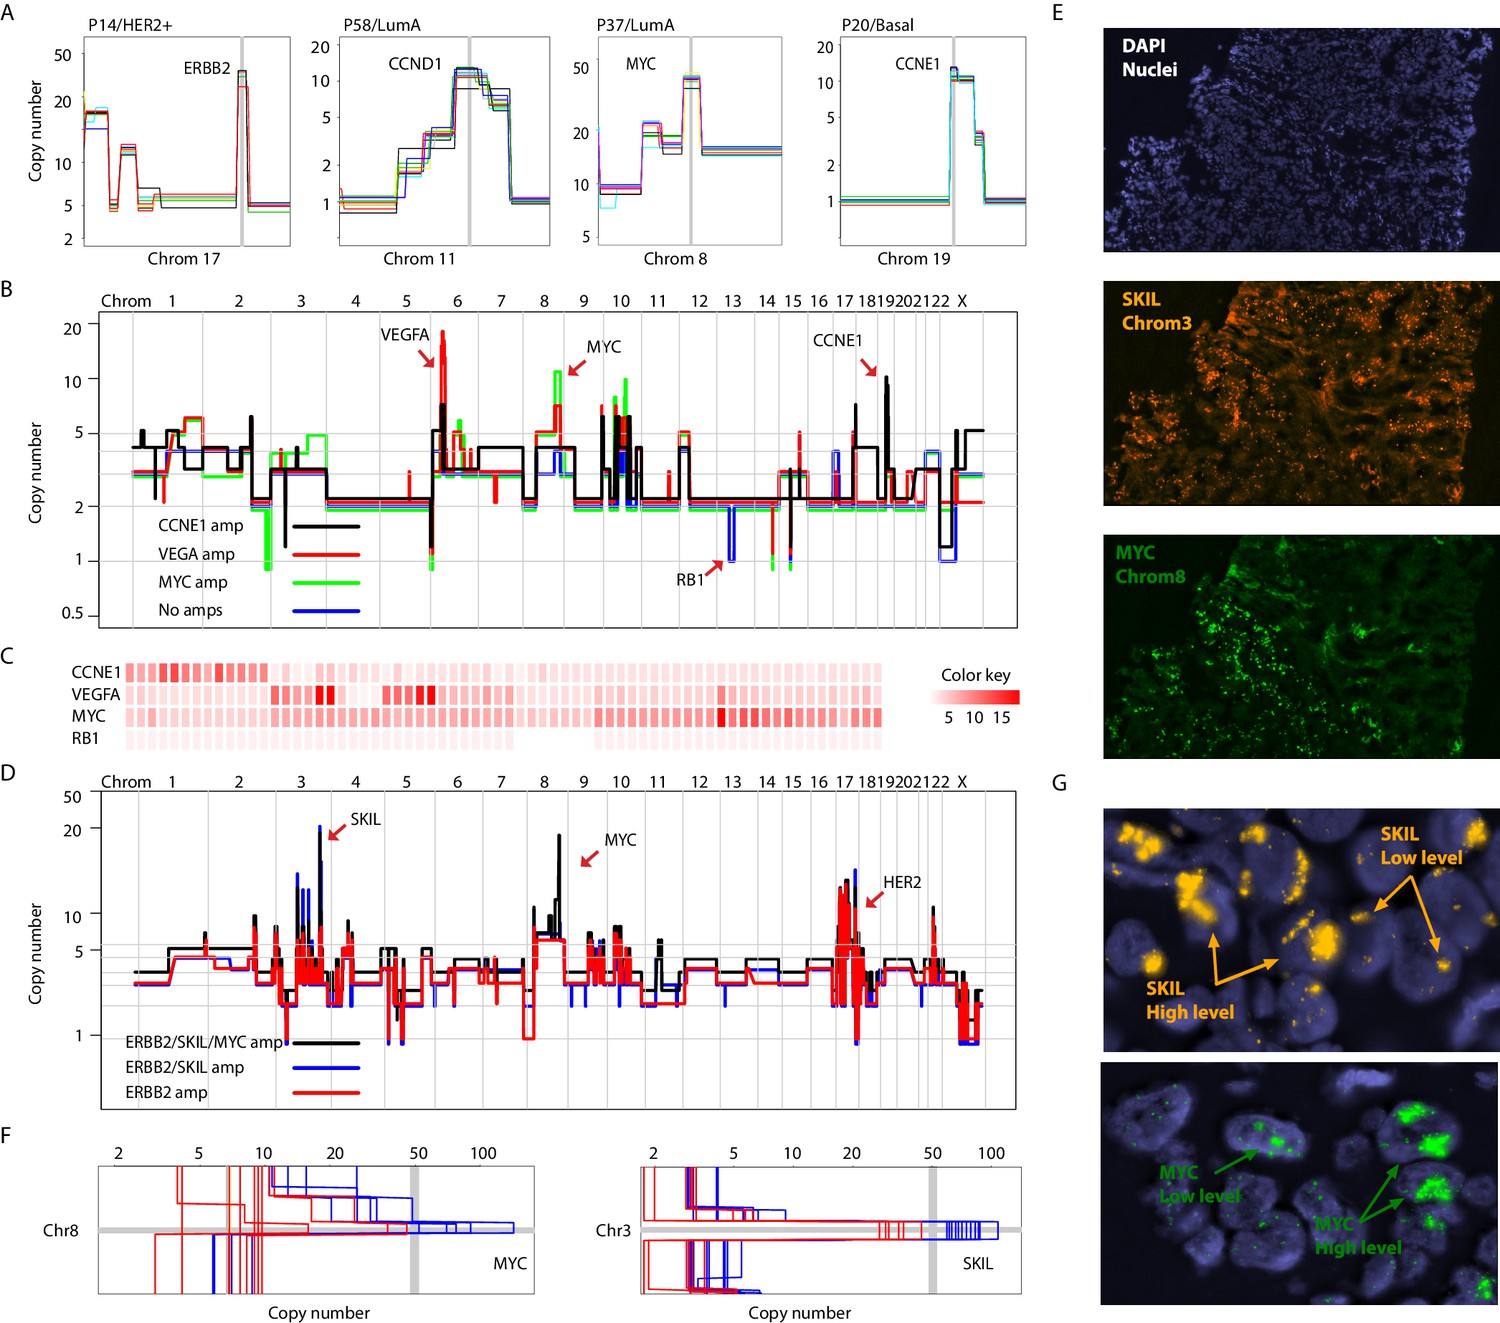
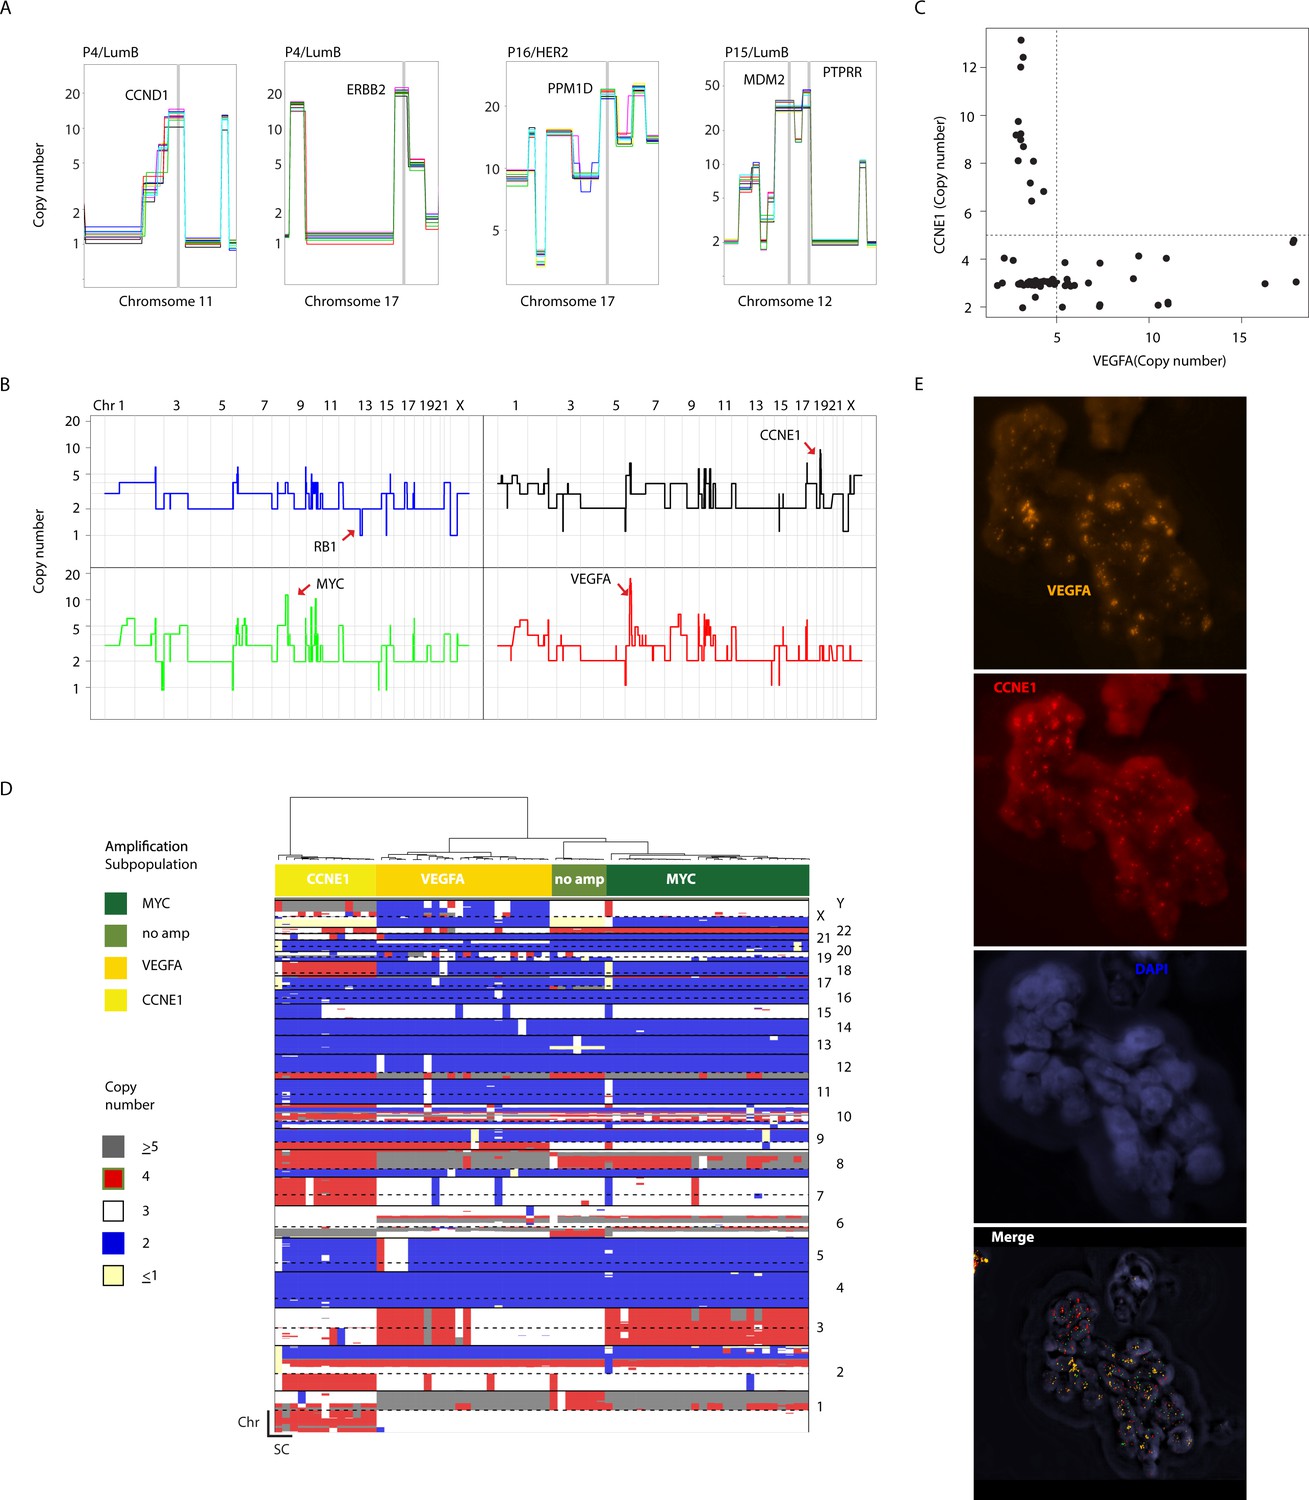
(A) Representative zoom-in chromosome views of clonal prototypical breast cancer amplicons such as ERBB2 and CCND1 identified in patient samples. (B) Genome-wide copy number profiles of representative (n = 4) single-cell genomes illustrating heterogeneous amplifications in tumor P22. Profiles are annotated with distinguishing amplicons. A representative profile of a single nucleus with no amplifications, but deleted for the RB1 gene, is also noted. (C) Heatmap illustration of P22 amplicon copy number heterogeneity and the mutually exclusive nature of the CCNE1 and VEGFA amplicons - statistical significance based on Fisher’s Exact Test (p-value=0.0032, Odds ratio = 0, 95% confidence interval 0–0.44). Single-nuclei are ordered according to hierarchal clustering as illustrated in Figure 3—figure supplement 1D. Color key is according to increasing copy number states. (D) Genome-wide copy number profiles of representative single-cell genomes illustrating heterogeneous amplifications in tumor P6. Profiles with distinguishing amplifications are annotated on the figure. (E) DNA-FISH validation of somatic mosaicism of the SKIL and MYC amplicons in tumor P6. DNA-FISH data also illustrate the geographic demarcation of the amplification in the field of view. (F) Zoom-in-views of the SKIL and MYC amplicons in representative single-cells illustrating the heterogeneity in the level of chromosomal amplification in tumor P6. (G) DNA-FISH validation of low level/high-level amplification of SKIL and MYC loci inferred based on fluorescence signal intensity.
Figure 3—figure supplement 1
Clonal and sub-clonal Chromosomal amplicons are detectable using single-cell copy number profiling.
(A) Representative illustration of clonal, non-heterogeneous chromosomal amplifications found in analyzed patient samples. (B) Genome-wide copy number plots of representative single-cells showing heterogeneous amplifications in tumor P22. Top-left panel illustrates a cell without chromosomal amplifications having lost an additional copy of the RB1 gene via a focal deletion. Top-right panel illustrates a single cell with CCNE1 amplification. Bottom-left panel illustrates a single-cell with a MYC amplification. Bottom-right panel illustrates a single-cell amplified for the VEGFA locus. (C) Scatter plot illustration of the mutual exclusivity of the CCNE1 and VEGFA amplicons in P22. (D) Hierarchal clustering tree based on copy number alterations illustrating the association of the mosaic amplicons identified in P22 (Basal) with different, genetically distinct sub-clonal populations. (E) DNA-FISH validation of the mosaicism and mutual exclusivity of VEGFA and CCNE1 amplicons in P22.
Figure 3—figure supplement 2
Examples of somatic mosaicism and differential dosage of chromosomal amplifications identified in analyzed breast cancers biopsies and identification of clonal homozygous deletions in analyzed samples.
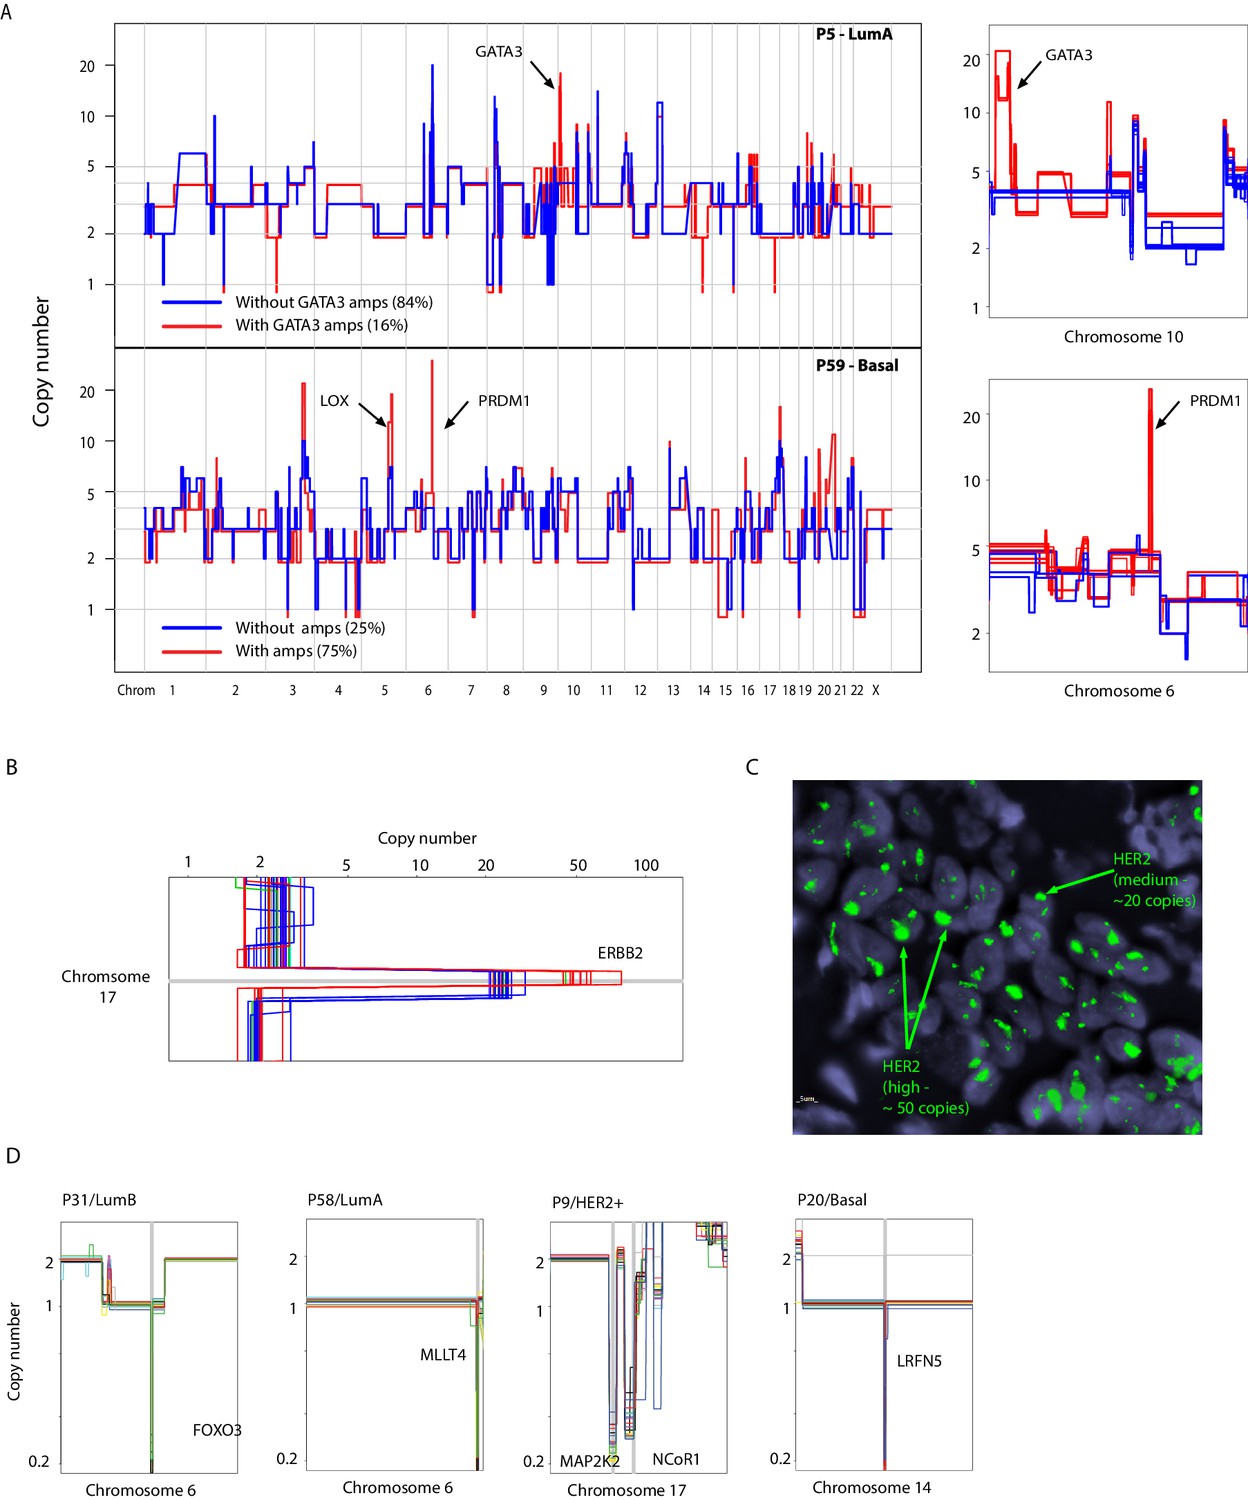
(A) Genome-wide and chromosomal zoom-in plots of representative single cells derived from tumors (P5 and P59) harboring somatically mosaic amplicons. Mosaic amplicons are annotated on the plots. (B) Zoom in chromosomal view of the heterogeneity of HER2 level of amplification/dosage identified in single-cells from P9, a HER2+ tumor. (C) DNA-FISH validation of the varying levels of HER2 amplification in P9. Heterogeneity is inferred from probe intensity. Low level and high level amplification are noted. (D) Zoom-in-views of clonal homozygous deletions identified in a subset of breast cancer genomes.
Figure 4 with 1 supplement
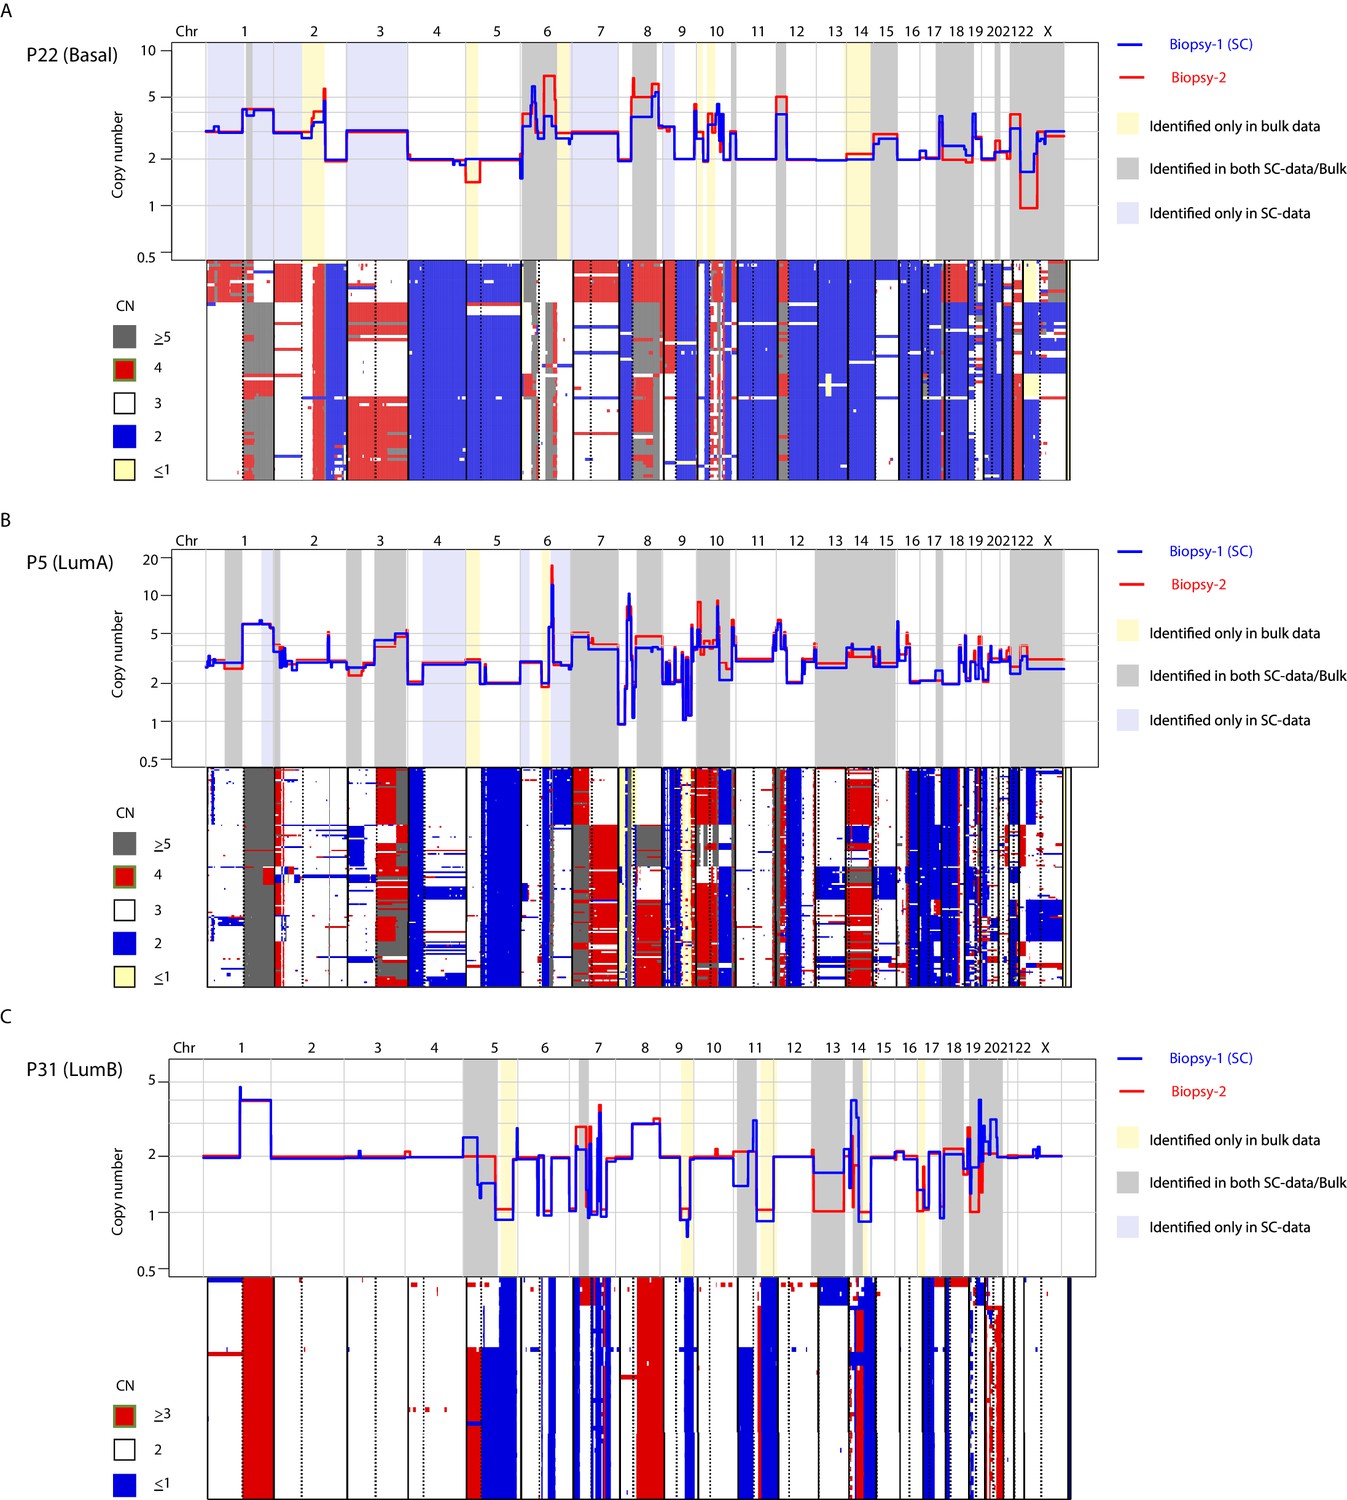
A substantial amount of copy number variation observed between spatially resolved biopsies identified in bulk sequencing data is captured at the single-cell level in one of the biopsies.
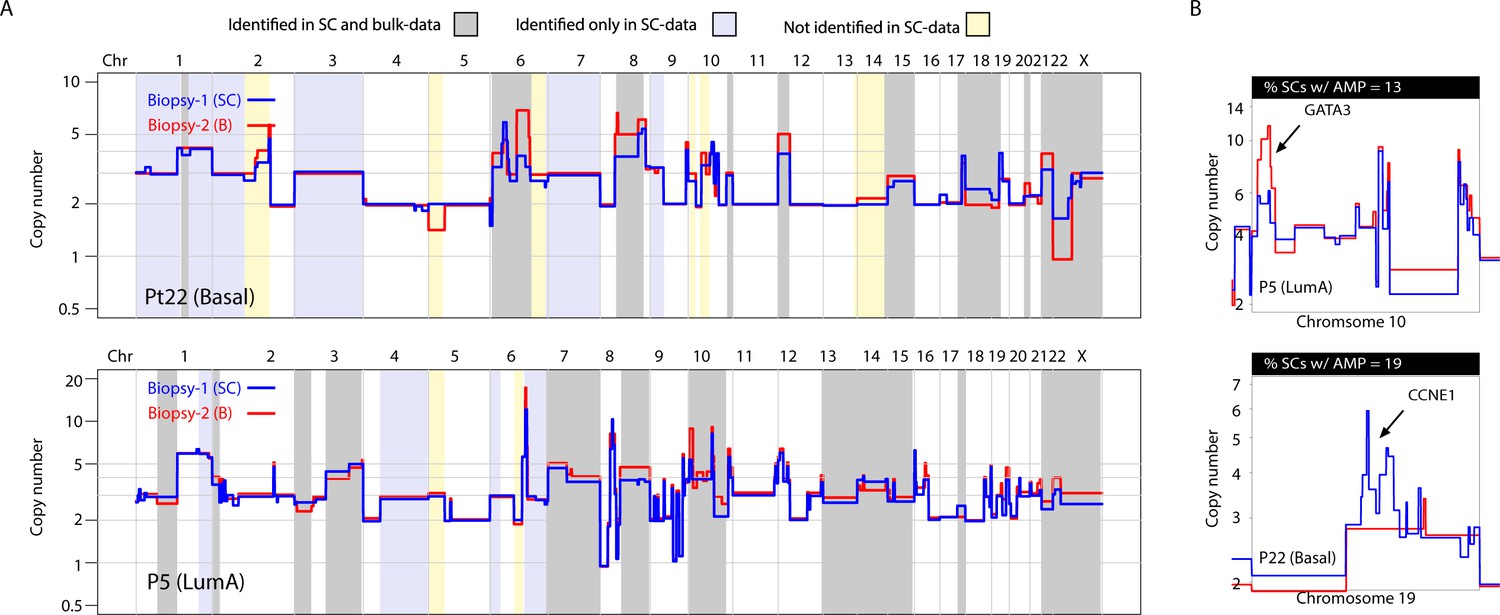
(A) Genome-wide copy number view of bulk copy number profiles from two different geographic biopsies (blue – biopsy analyzed at bulk and single cell level, red – biopsy analyzed only in bulk) from tumor P5 (top panel) and tumor P22 (bottom panel). Gray shading denotes variation identified at bulk level between the spatially resolved biopsies and captured in single-cell data. Yellow shading indicates variation not seen in single-cell data but found in the bulk comparison. Lavender shading indicates variation observed only at the single-cell level. (B) Chromosomal view of representative examples of spatial variation of chromosomal amplicons found heterogeneously at bulk and single-cell level. Top panel indicates % of single-cells with the respective chromosomal amplification in single-cell data.
Figure 4—figure supplement 1
CNA heterogeneity identified from the analysis of two spatially resolved tumor biopsies from the same patient is commonly identified in the single-cell copy number data from one of the biopsies.
(A) Top-panel: overlay copy number profiles of two different biopsies from P22 illustrating heterogeneous CNAs (i.e. non-overlapping segments). Gray shading denotes heterogeneity between two different bulk profiles that is also captured in the single-cell data of one of the biopsies. Yellow shading denotes CNA heterogeneity identified between different bulk profiles and not detected in single-cell data. Lavender shading denotes CNA heterogeneity found only in the single-nuclei data. Lower-panel: Copy number heatmap of single-cells from P22 illustrating heterogeneity of CNA from sequenced single-cells. Cells are ordered according to copy number hierarchal clustering using Manhattan distance function and Ward’s clustering method. Top and lower panels are aligned at chromosome boundaries to allow visualization and comparison of single-cell and bulk copy number data. Heatmap color schema is illustrated to the left of the heatmap. (B and C) Same as in (a) but for tumors P5 (b) and P31 (c).
Figure 5 with 2 supplements

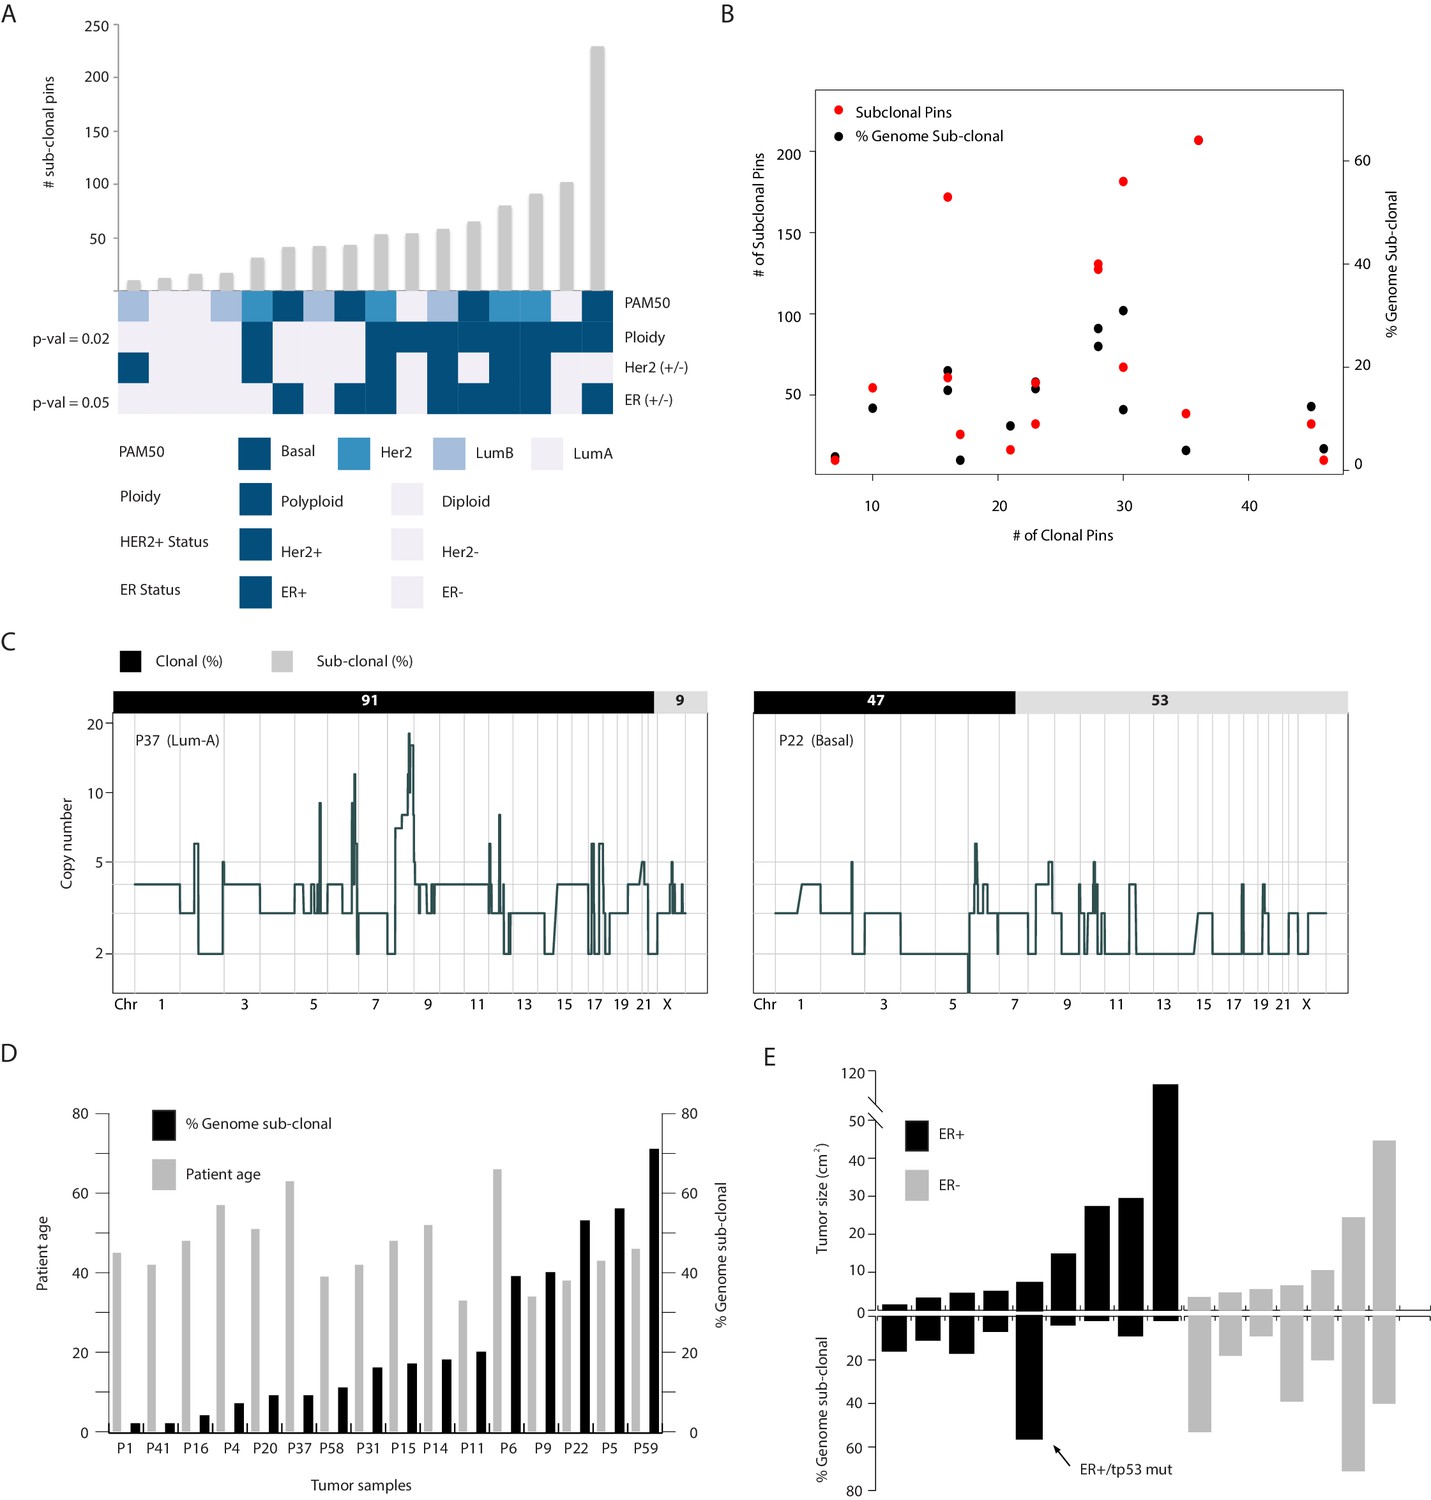
Copy number heterogeneity is associated with biological and clinical parameters and tumors can be classified according to clonal composition.
(A) Bar plot with rank order illustrating CNA heterogeneity as measured by fraction (%) of the genome found to be sub-clonal. Each tumor is denoted at the top of each bar with values of fraction (%) genome sub-clonal also annotated. Categories for association analyses are depicted in panel below. Asterisks denote categories with statistically significant associations based on Wilcoxon rank order tests (p-value=0.0229 and 0.0164 for ER- and polyploidy categories respectively). p-values were rounded and annotated in the figure panel. (B) A representative illustration of a Sanger sequencing trace of DNA from a single normal and single cancer cell from tumor P5, an ER+ tumor. Traces illustrate a G to A transition at position 7578500 of chromosome 17 resulting in a non-sense mutation in the TP53 gene. (C) Correlation analysis between fraction (%) of genome sub-clonal and the log of the tumor size (cm2) as measured by MRI. Pearson’s rank correlation p-value=0.01912. Log of the size was used given the assumption of exponential tumor growth. P5, an ER+, TP53 mutant outlier is excluded from the analysis. (D) Representative MRI images of two patient tumors analyzed in this study illustrating the inverse correlation of tumor size and fraction of genome sub-clonal in ER+ tumors. Red colored ellipses denote tumor positions. (E) Heatmap illustration of three representative tumors displaying different clonal composition patterns. Patterns are: homogenous (P16), heterogeneous with a dominant clone (P14), and heterogeneous without a dominant clone (P5). Top bar denotes tumor identity with bottom bar depicting sub-clones. Heatmap color scheme is provided to the right of the heatmap. (F) Quantification and bar plot illustration of clonal composition as explained in E.
Figure 5—figure supplement 1
Copy number heterogeneity is associated with polyploidy and estrogen receptor negative status and these associations are not directly related to the amount of rearrangements found in the cancer genomes of analyzed samples.
(A) Bar plot representation (with rank order) of the number of sub-clonal breakpoints and their association with different biological and clinical parameters (bottom heatmap panel). p-values for associations are rounded and displayed on the figure and are based on Wilcoxon rank order testing. None rounded values are 0.0549 and 0.0241 for ER- and polyploidy categories respectively. (B) Dot plot analysis of the relationship between CNA heterogeneity (quantified using two metrics: fraction (%) genome sub-clonal and the number of sub-clonal breakpoints) and genome rearrangement (number of clonal breakpoints). Not significant relationship is found. (C) Representative illustration of the lack of relationship between sub-clonality (% genome sub-clonal – top bar) and clonal genetic rearrangements (genome-wide copy number profiles). Both tumors are highly re-arranged with one displaying high heterogeneity (P22–53% of genome sub-clonal) while the other displays low heterogeneity (P37–9% subclonal). (D) Bar plot quantification of CNA heterogeneity and patient age of the samples analyzed in this study. No significant relationship is found. (E) Bar plot illustration of the relationship between tumor size and % genome sub-clonal. No significant association is observed when analyzing all tumor biopsies analyzed in the study. A significant-inverse correlation is found when restricting the analysis to ER+ tumors and removing the ER+/TP53 mutant tumor noted in the text. The ER+/TP53 mutant tumor is also denoted in the figure.
Figure 5—figure supplement 2
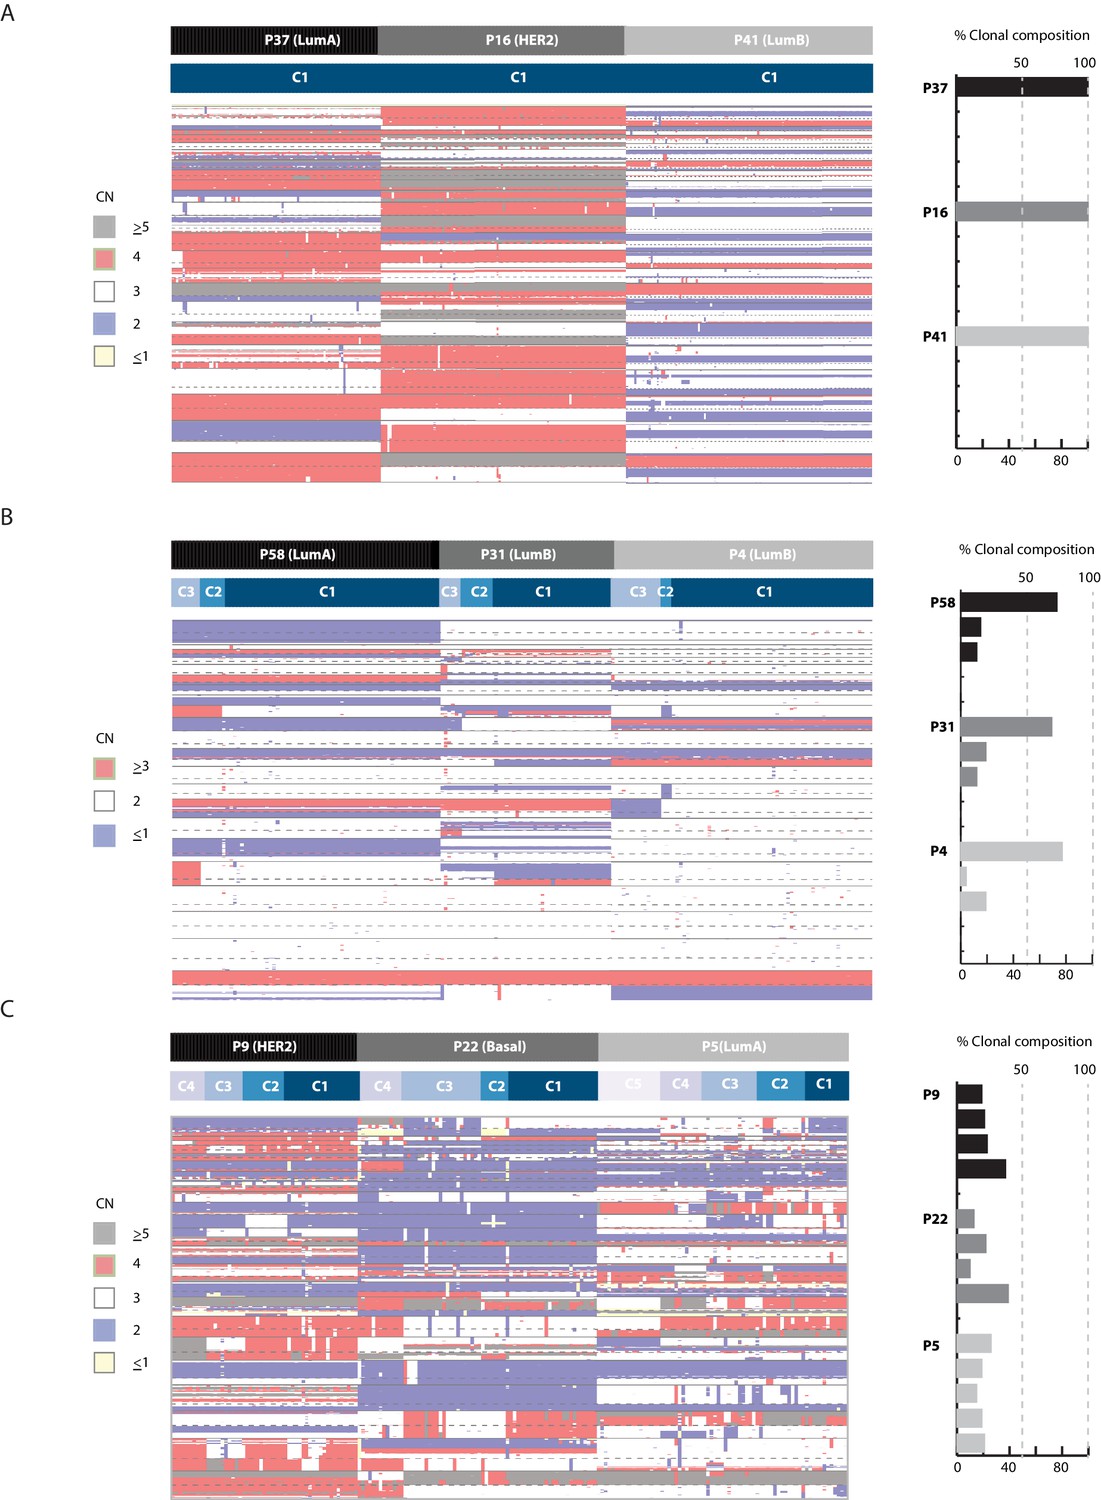
Clonal composition is variable in breast cancer biopsies and can be used in the classification of tumors.
Heatmap illustration (left panel) and bar plot quantification (right panel) of clonal composition in representative breast tumors illustrating: (A) homogenous tumors with one dominant clone, (B) heterogeneous tumors with multiple sub-clones but with one clone dominant over others (dominant = representative of over 50% of cancer cells), and (C) heterogeneous tumors where many sub-clones exit with none being dominant in composition. Top bar denotes tumor. Bottom bar denotes clone.
Additional files
-
Source code 1
R Source code for the calculation of % of genome sub-clonal.
- https://cdn.elifesciences.org/articles/51480/elife-51480-code1-v1.r
-
Transparent reporting form
- https://cdn.elifesciences.org/articles/51480/elife-51480-transrepform-v1.pdf
Download links
A two-part list of links to download the article, or parts of the article, in various formats.
Downloads (link to download the article as PDF)
Open citations (links to open the citations from this article in various online reference manager services)
Cite this article (links to download the citations from this article in formats compatible with various reference manager tools)
Novel insights into breast cancer copy number genetic heterogeneity revealed by single-cell genome sequencing
eLife 9:e51480.
https://doi.org/10.7554/eLife.51480


