Imp/IGF2BP levels modulate individual neural stem cell growth and division through myc mRNA stability
- The University of Oxford, United Kingdom
- University College, United Kingdom
Figures
Figure 1 with 1 supplement
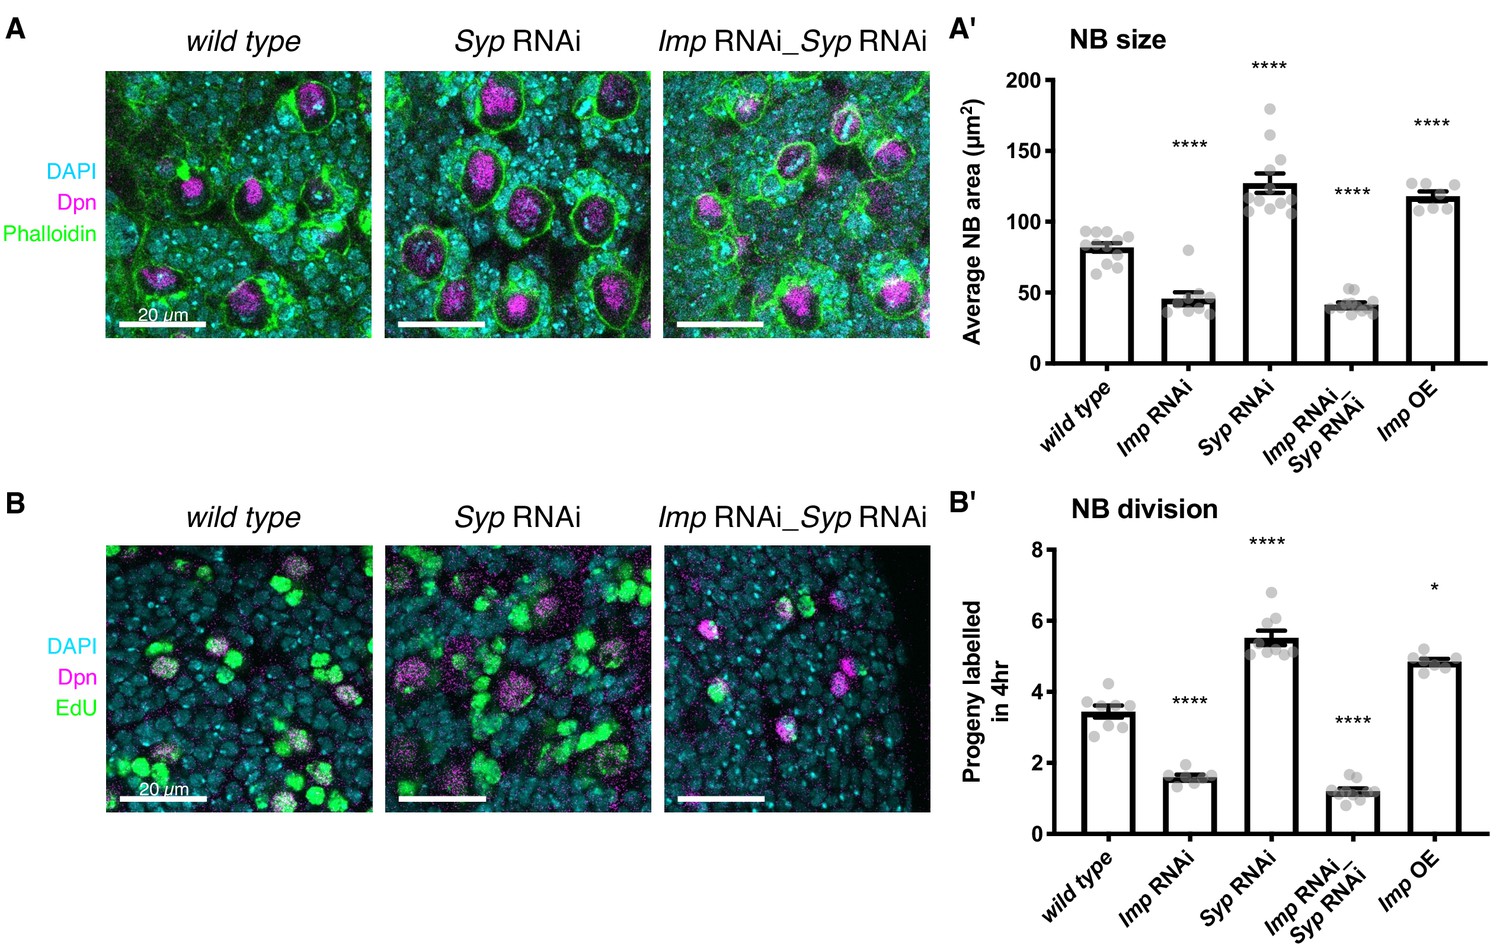
Elevated Imp levels increase NB proliferation and size.
(A) Phalloidin was used to stain F-actin, marking the perimeter of each type I NB in the central brain (the largest cells, identified with Deadpan (Dpn) immunofluorescence (IF)). The area of each NB was measured at its largest point, and the average NB size per brain is plotted in (A’). NBs with diffuse Dpn (indicating nuclear envelope breakdown during mitosis) were excluded. (B) Larval brains were cultivated ex vivo with 25 μM EdU for four hours. All cells that underwent DNA synthesis in S phase are labelled with EdU. Dpn IF labels type I NBs. The number of progeny produced by each NB in the central brain was compared in wild type, Imp RNAi, Syp RNAi, double Imp Syp RNAi and Imp overexpression (OE) brains. The average number of progeny per NB in each brain is plotted in (B’). In A’) and B’), significance was calculated using a one-way ANOVA and Dunnett’s multiple comparisons test, with comparison to wild type. **p<0.01, ***p<0.001, ****p<0.0001. Each grey point represents one wL3 brain and for each genotype at least seven brains were measured, from three experimental replicates.
Figure 1—figure supplement 1
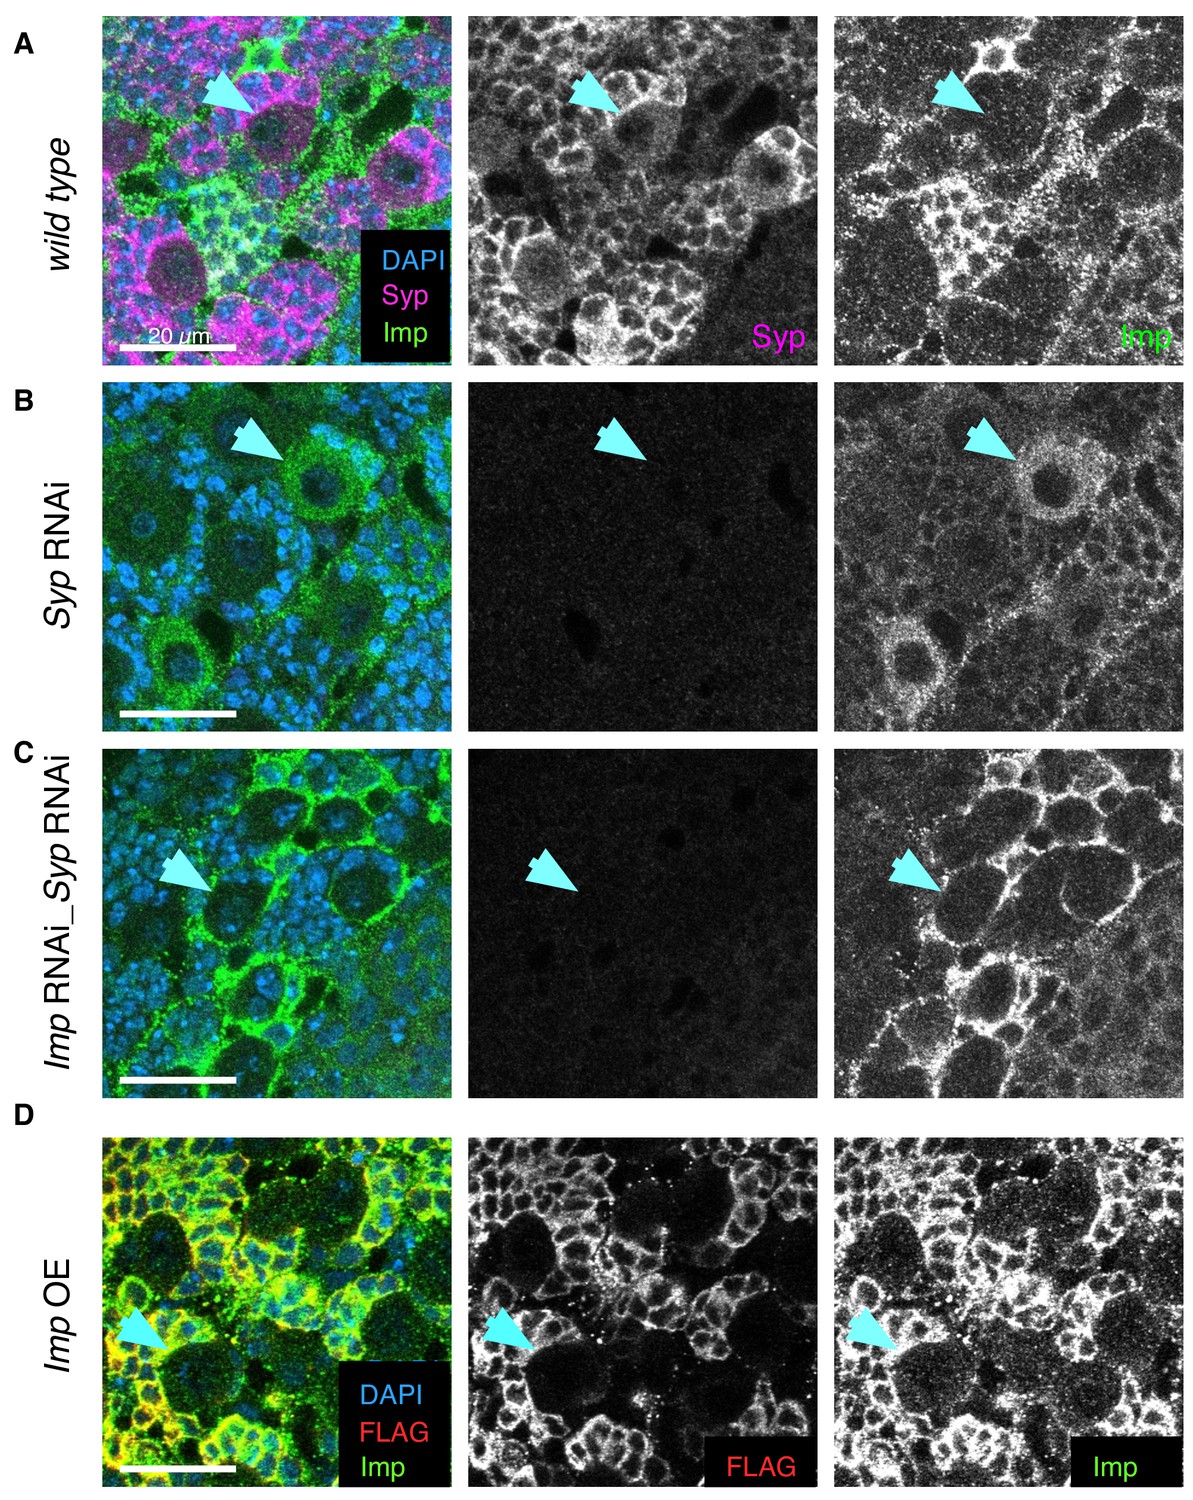
Syp RNAi and double Imp Syp RNAi distinguishes the roles of Imp and Syp.
Immunofluorescence (IF) staining against Syp and Imp in wL3 brains. Overexpression and knockdown UAS constructs driven with insc-GAL4. (A) At the wL3 stage, wild type type I NBs express high Syp and low Imp levels. (B) Syp knockdown depletes Syp expression, which relieves the repression of Imp, so Imp level in the NB increases. The phenotype may be due to the depletion of Syp or the consequent upregulation of Imp. (C) Imp Syp double knockdown additionally depletes Imp from the NB and is therefore used to distinguish the effects of Syp depletion and Imp upregulation. Imp protein is not knocked down in all brain cells so some Imp expression remains, perhaps in the glial cells surrounding the NB niche. (D) Imp overexpression with a UAS-Imp::FLAG construct (Liu et al., 2015) shows minimal Imp upregulation in the NB using IF against FLAG and Imp. Blue arrow indicates an example type I NB in each genotype.
Figure 2 with 1 supplement
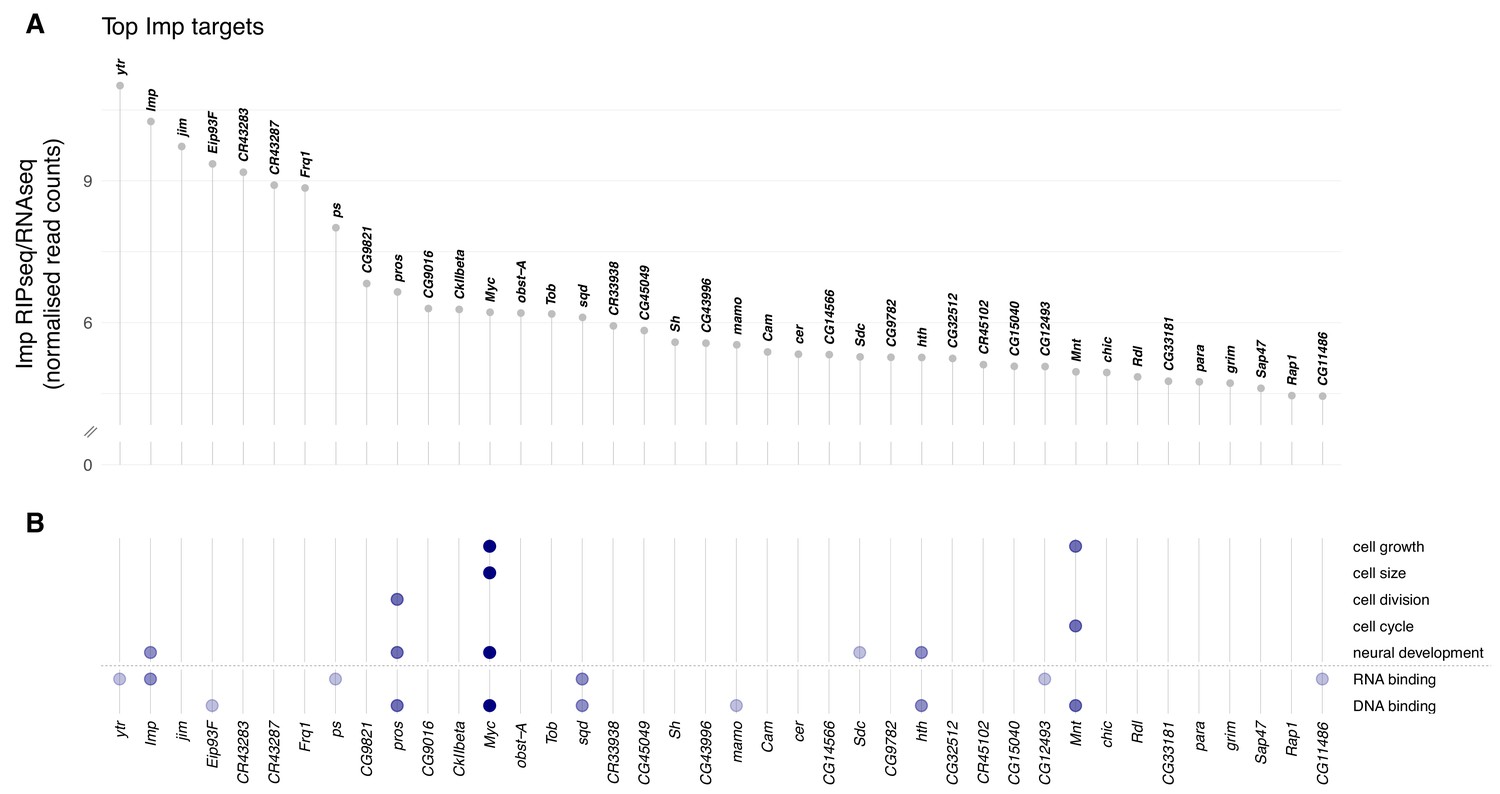
Imp RNA targets in the D. melanogaster wL3 brain.
(A) Ranked top 40 Imp RIPseq targets relative to baseline RNA expression as measured by RNAseq. Non-coding RNAs that overlap other genes are excluded. (B) Genes in panel A mapped to gene ontology (GO) terms related to cellular growth and division, neural development, and regulatory functions RNA- and DNA-binding. Each dot indicates the gene is annotated to one or more GO terms in that category. The colour of the dots reflects the total number of GO categories each gene maps to, out of the seven investigated.
Figure 2—figure supplement 1
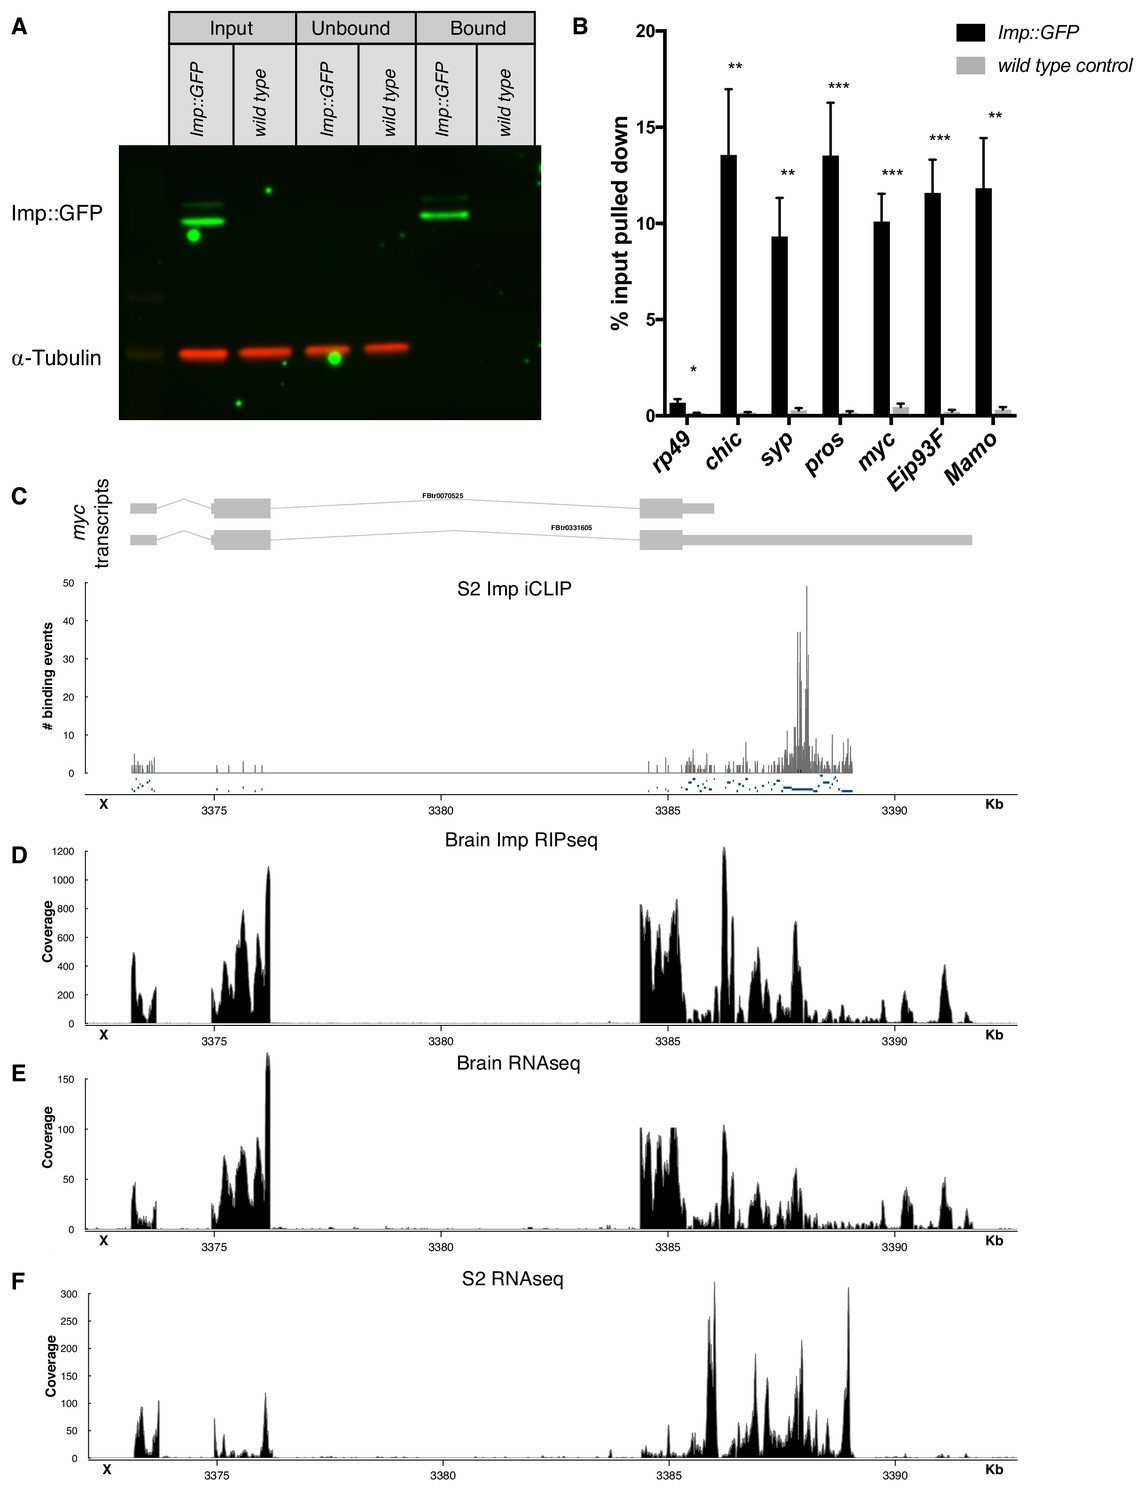
Imp RIPseq identifies mRNA targets of Imp in the brain.
(A) Imp::GFP was pulled down from brain lysates using GFP-trap beads (see Materials and methods). Western blot shows that Imp::GFP is enriched in the bound fraction, while α-Tubulin is depleted. (B) Targets of interest were validated with RIP-qPCR, comparing pulldown in the Imp::GFP brain lysate to a wild type untagged lysate. Statistical significance was calculated compared to the wild type control for each gene, using t-tests with correction for multiple comparisons using a False Discovery Rate allowance of 5%. *p<0.05, **p<0.01, ***p<0.001 C Reanalysis of previously published Imp iCLIP data in S2 cells (Hansen et al., 2015) showed Imp binding sites in the myc UTRs, particularly in the UTR extension of the long mRNA isoform. (D) Our Imp RIPseq in the wL3 brain also shows reads in the UTR extension. The full long isoform of myc is expressed in the brain RNAseq, (E), but is truncated in RNAseq from S2 cells, (F). One representative replicate is shown in each trace.
Figure 3 with 1 supplement
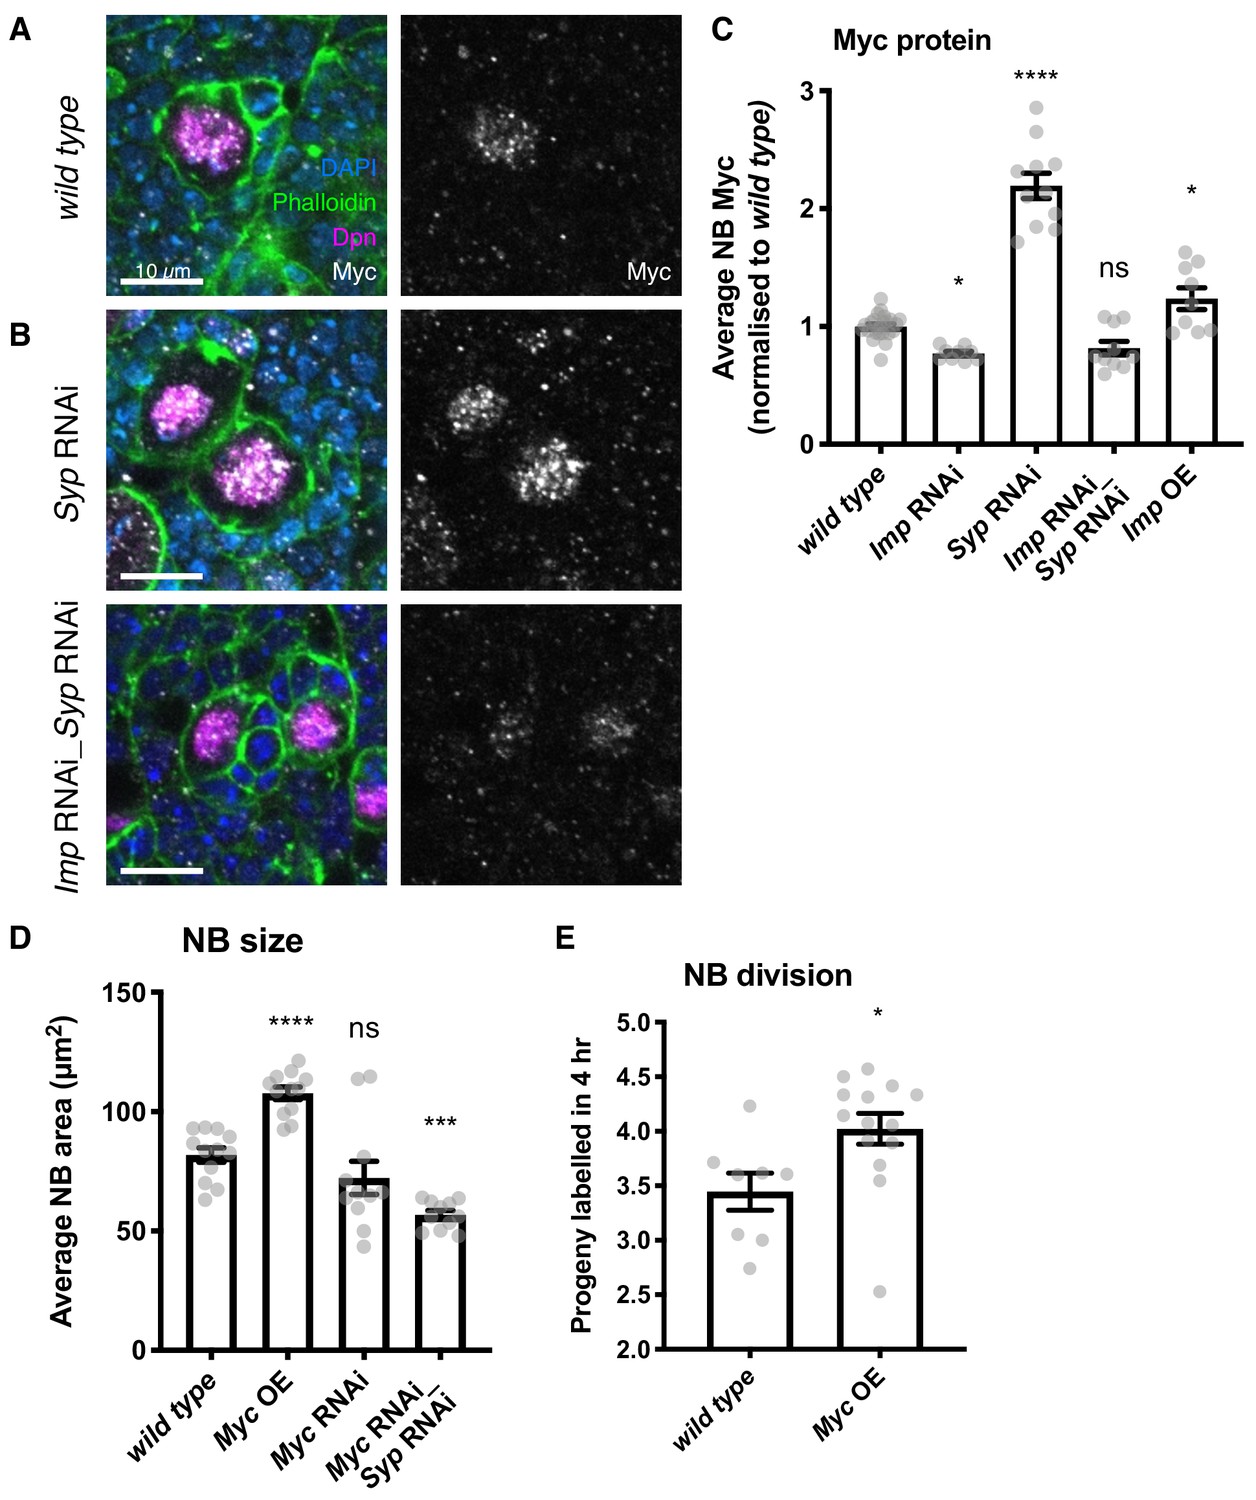
Imp upregulates Myc protein expression, which in turn determines NB division rate and size.
(A) Antibody staining against Myc protein, with NBs labelled with Dpn. Myc protein is restricted to the NB in the wild type type I lineage. (B) In the Syp knockdown, Myc protein is increased in the NB, but this increase is lost in the Imp Syp double knockdown. The average Myc IF signal in NBs per brain is quantitated in C. D) Myc overexpression increases NB size, measured as NB area at the widest point. Myc RNAi results in a non-significant decrease in NB size. Myc Syp double knockdown reverses the phenotype of Syp single knockdown, resulting in small NBs compared to wild type. (E) EdU staining to count progeny produced in a 4 hr incubation shows that overexpression of Myc increases NB proliferation. Significance was calculated using a one-way ANOVA and Dunnett’s multiple comparisons test, with comparison to wild type. ns non significant, *p<0.05, ***p<0.001, ****p<0.0001 Each grey point represents one wL3 brain and for each genotype at least eight brains were measured, from three experimental replicates.
Figure 3—figure supplement 1
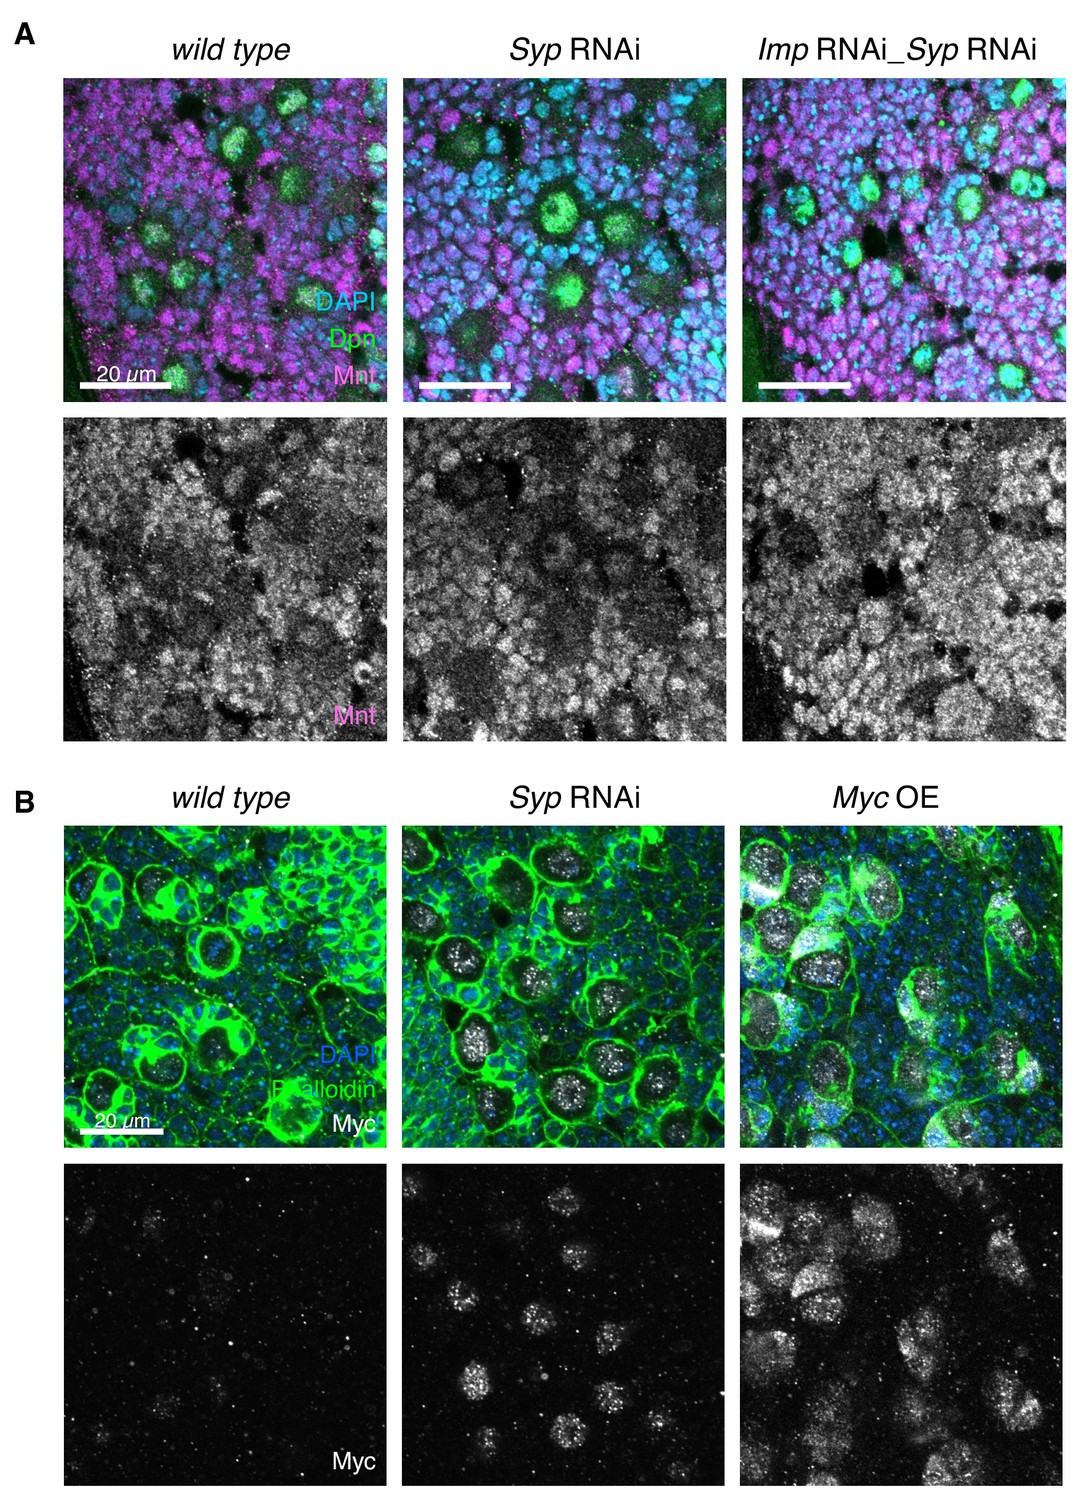
mnt and myc are targets of Imp.
(A) IF shows that Mnt is expressed in the type I NB and progeny cells in wL3 brains (Dpn marks the NBs). Mnt level is unchanged in Syp or Imp Syp double knockdown. (B) Overexpression of Myc (UAS-MycORF, FlyORF collection, Materials and methods) using the insc-GAL4 driver increases Myc expression in the NB and immature progeny cells. Phalloidin staining is used to mark the perimeter of the NBs.
Figure 4 with 1 supplement
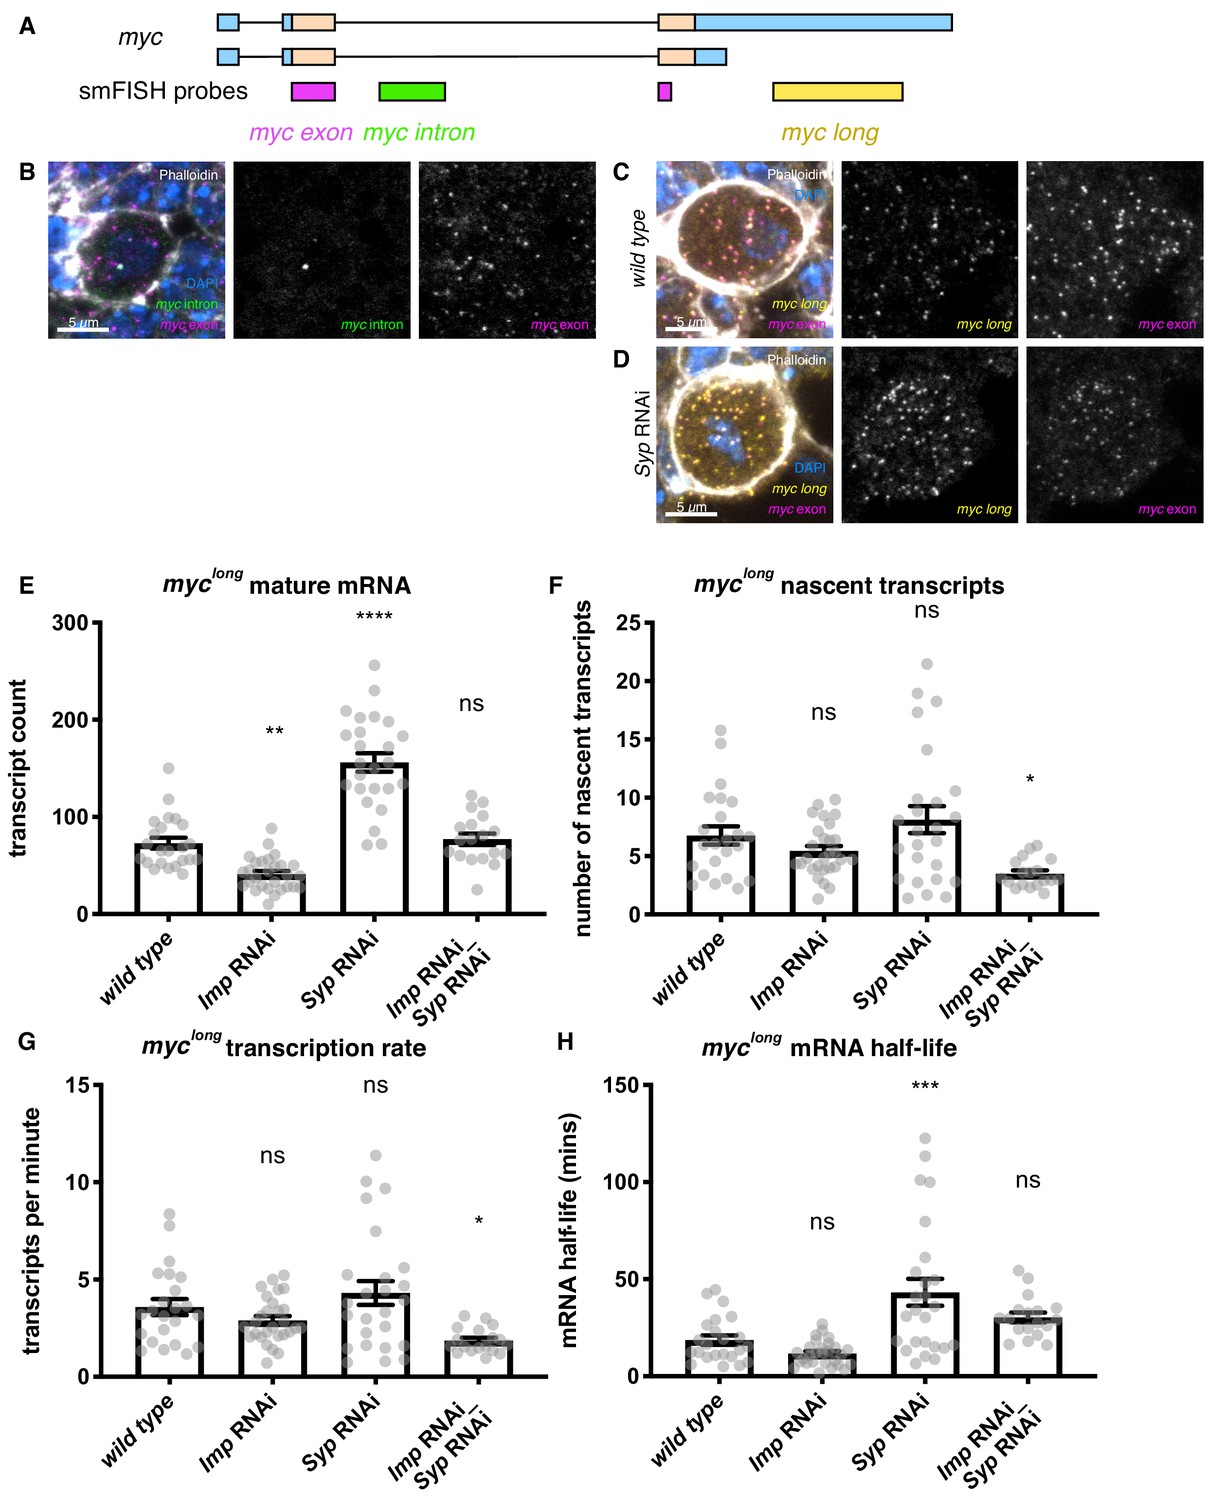
Imp stabilises myc mRNA.
(A) We designed smFISH probes targeting the common exon (spanning the exon junction due to insufficiently long single exons), the intron, and the extended 3’ UTR. (B) smFISH against the myc exon and the intron shows that myc is transcribed in type I NBs. (C) smFISH using probes against the common exon and the 3’ UTR extension of myc shows that the long isoform of myc is expressed in the type I NBs. (D) myc transcript number is increased in the Syp knockdown. Z projection of 5 z planes. (E) The number of myclong transcripts was counted in individual NBs. The transcript number increased in the Syp RNAi but was unchanged in the double Imp and Syp RNAi. (F) The number of nascent transcripts was calculated using the integrated intensity from the transcription foci spot. The number of nascent transcripts was not significantly changed between genotypes. The counts of nascent and mature transcripts were then used to calculate myclong half-life and transcription rate (Bahar Halpern and Itzkovitz, 2016). (G) The myclong transcription rate is reduced in the Imp Syp double knockdown. (H) myclong mRNA is stabilised in the Syp RNAi but the half-life is unchanged in the Imp Syp double knockdown. Significance calculated by ANOVA and Dunnett’s multiple comparisons test, with comparison to wild type. ns = non significant, *p<0.05, **p<0.01, ***p<0.001, ****p<0.0001. error bars represent s.e.m. Each grey point represents one NB and for each genotype wL3 brains were analysed from three experimental replicates.
Figure 4—figure supplement 1
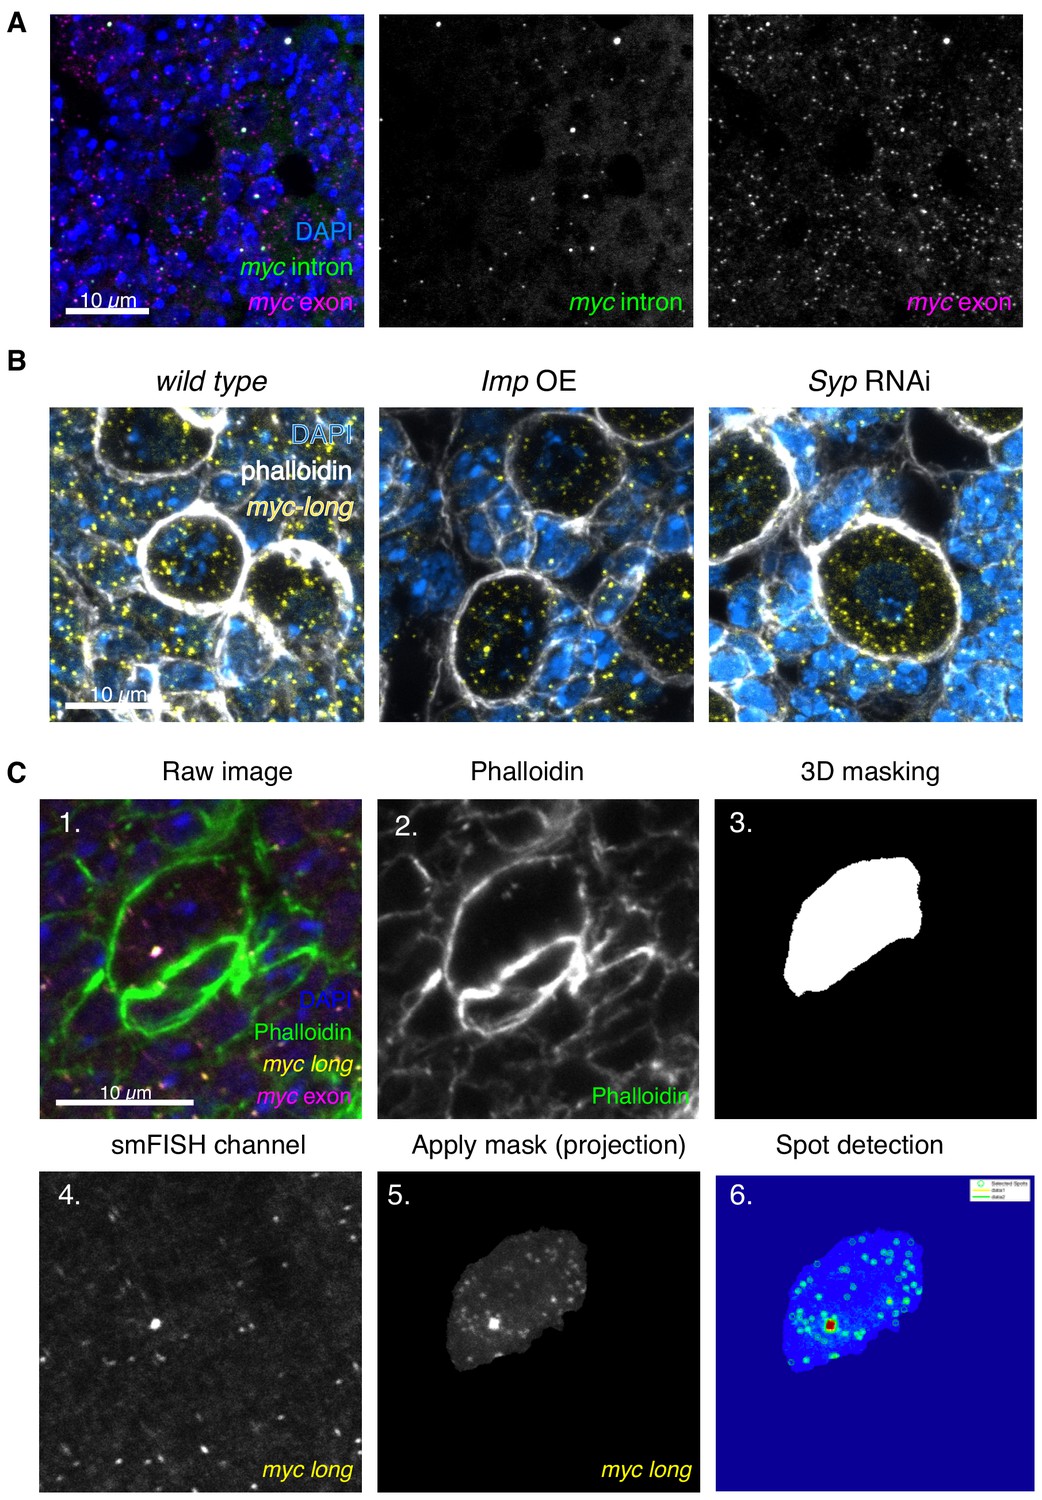
Workflow of transcript counting in NBs.
(A) myc mRNA is expressed in the NB and progeny cells. Z-projection of 9 z slices, 200 nm each. (B) smFISH against myc-long in Imp overexpression brains shows minimal differences between Imp overexpression and wild type NBs, compared to the increased myc-long signal observed in the Syp RNAi, which results in a much greater upregulation of Imp. (C) The raw images for smFISH quantitation are four colours marking DNA (DAPI), cell boundaries (Phalloidin), and mRNA (smFISH for myc exon and myc-long). The phalloidin channel is extracted to produce a 3D mask of the NB, using the FIJI plugin MorphoLibJ. This mask is applied to the myc-long smFISH channel for quantitation to exclude all signal from outside the NB (image shown as a projection). FISHquant is then used to identify spots in this cell and measure the intensity of the outlined transcription focus.
Figure 5
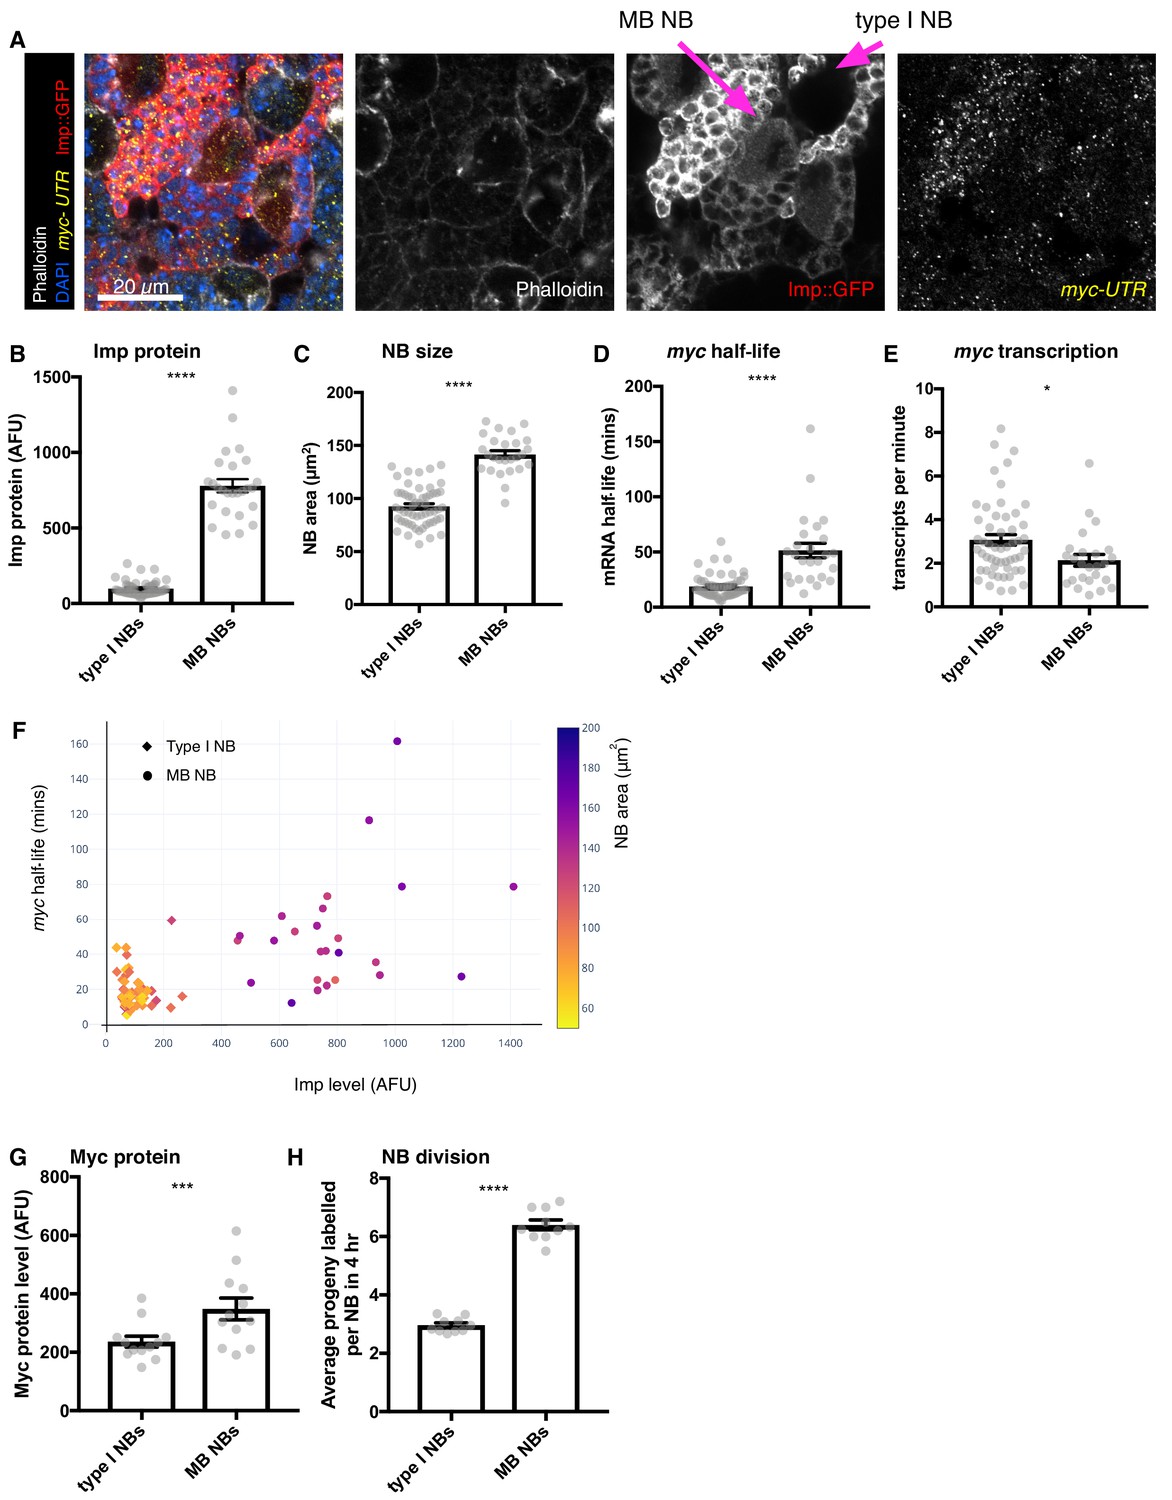
Higher Imp level in MB NBs leads to more stable myc mRNA.
(A) wL3 brains expressing Imp::GFP and stained with myclong smFISH probes and phalloidin were used to measure Imp level, NB size, myclong transcription rate and half-life in individual NBs. MB NBs are identified by their higher Imp expression compared to type I NBs. (B–D) Each grey point represents one NB and for each NB type, brains were analysed from three experimental replicates. (B) MB NBs express higher Imp than type I NBs. The average intensity of cytoplasmic Imp signal is shown in arbitrary fluorescent units. (C) MB NBs are significantly larger than type I NBs, comparing NB area at the largest plane. (D) myc mRNA half-life is increased in MB NBs compared to type I NBs. (E) myc transcription rate is slightly lower in MB NBs than in type I NBs. (F) Plotting multiple measurements for each NB (Imp level against myc mRNA half-life, with NB size indicated by the colour scale) shows the differences between type I NBs (diamond point - low Imp, low myc mRNA stability, small) and MB NBs (circle point - high Imp, high myc mRNA stability, large). Imp level correlates with myc half-life. (G–H) Each grey point represents one brain and for each NB type, brains were analysed from three experimental replicates. (G) Myc protein is increased in MB NBs compared to type I NBs. (H) MB NBs produce more progeny in a four hour EdU incubation compared to type I NBs. Significance for each measurement was calculated using unpaired t-test, except for G) which uses a paired t-test. *p<0.01, ***p<0.001, ****p<0.0001.
Figure 6 with 1 supplement
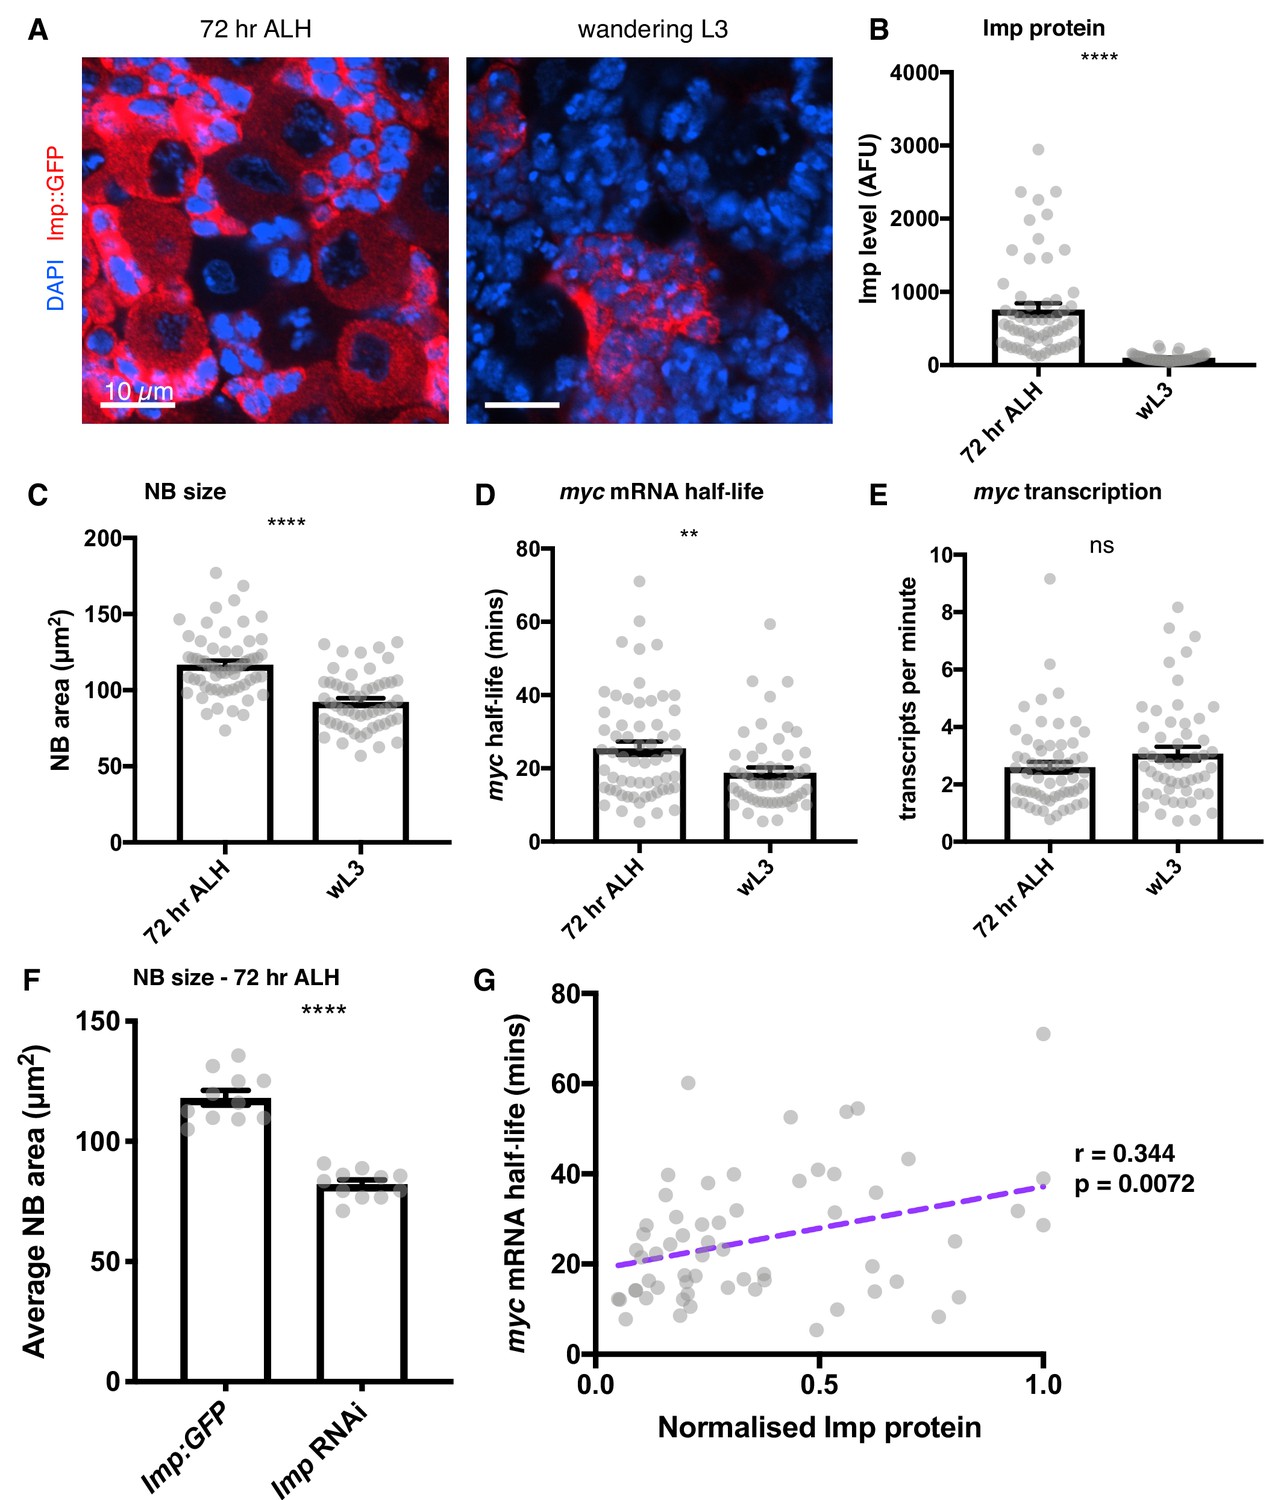
Imp stabilises myc mRNA throughout larval development.
(A) Imp level (measured with endogenous Imp::GFP) is higher in NBs at 72 hr ALH compared to the wL3 stage, and is more variable between different type I NBs. Imp is very highly expressed in the progeny cells so the image is contrasted to show the Imp levels in the NBs. (B) Imp level quantitated in 72 hr ALH and wL3 type I NBs. (C) NBs are larger at 72 hr ALH compared to wL3. (D) myc mRNA half-life is longer in 72 hr ALH NBs compared to wL3. (E) The transcription rate of myc is not significantly different between 72 hr and wL3 NBs. Significance was calculated using unpaired t test. ns = not significant, **p<0.01, ****p<0.0001 F Measuring the size of type I NBs at 72 hr ALH shows wild type (imp::GFP) NBs are larger than Imp knockdown NBs. (G) In individual NBs at 72 hr ALH, increased Imp expression correlates with increased myc mRNA half-life. Imp level is normalised to the highest expressing NB from each imaging session. Each grey point represents one NB and for each stage, brains were analysed from three experimental replicates.
Figure 6—figure supplement 1

Imp regulates myc half-life in individual NBs at 72 hr ALH.
In each NB, five measurements were taken: Imp level, myc transcription rate, myc mRNA half-life, number of myc transcripts and NB size. A correlation matrix examines the relationship between these variables. Imp level correlates with myc mRNA half-life but not with the number of myc transcripts or the NB size. However the number of myc transcripts does correlate with NB size, suggesting additional layers of regulation. For each correlation, the Pearson r value and significance p value are shown. Significant correlations are highlighted in yellow.
Figure 7
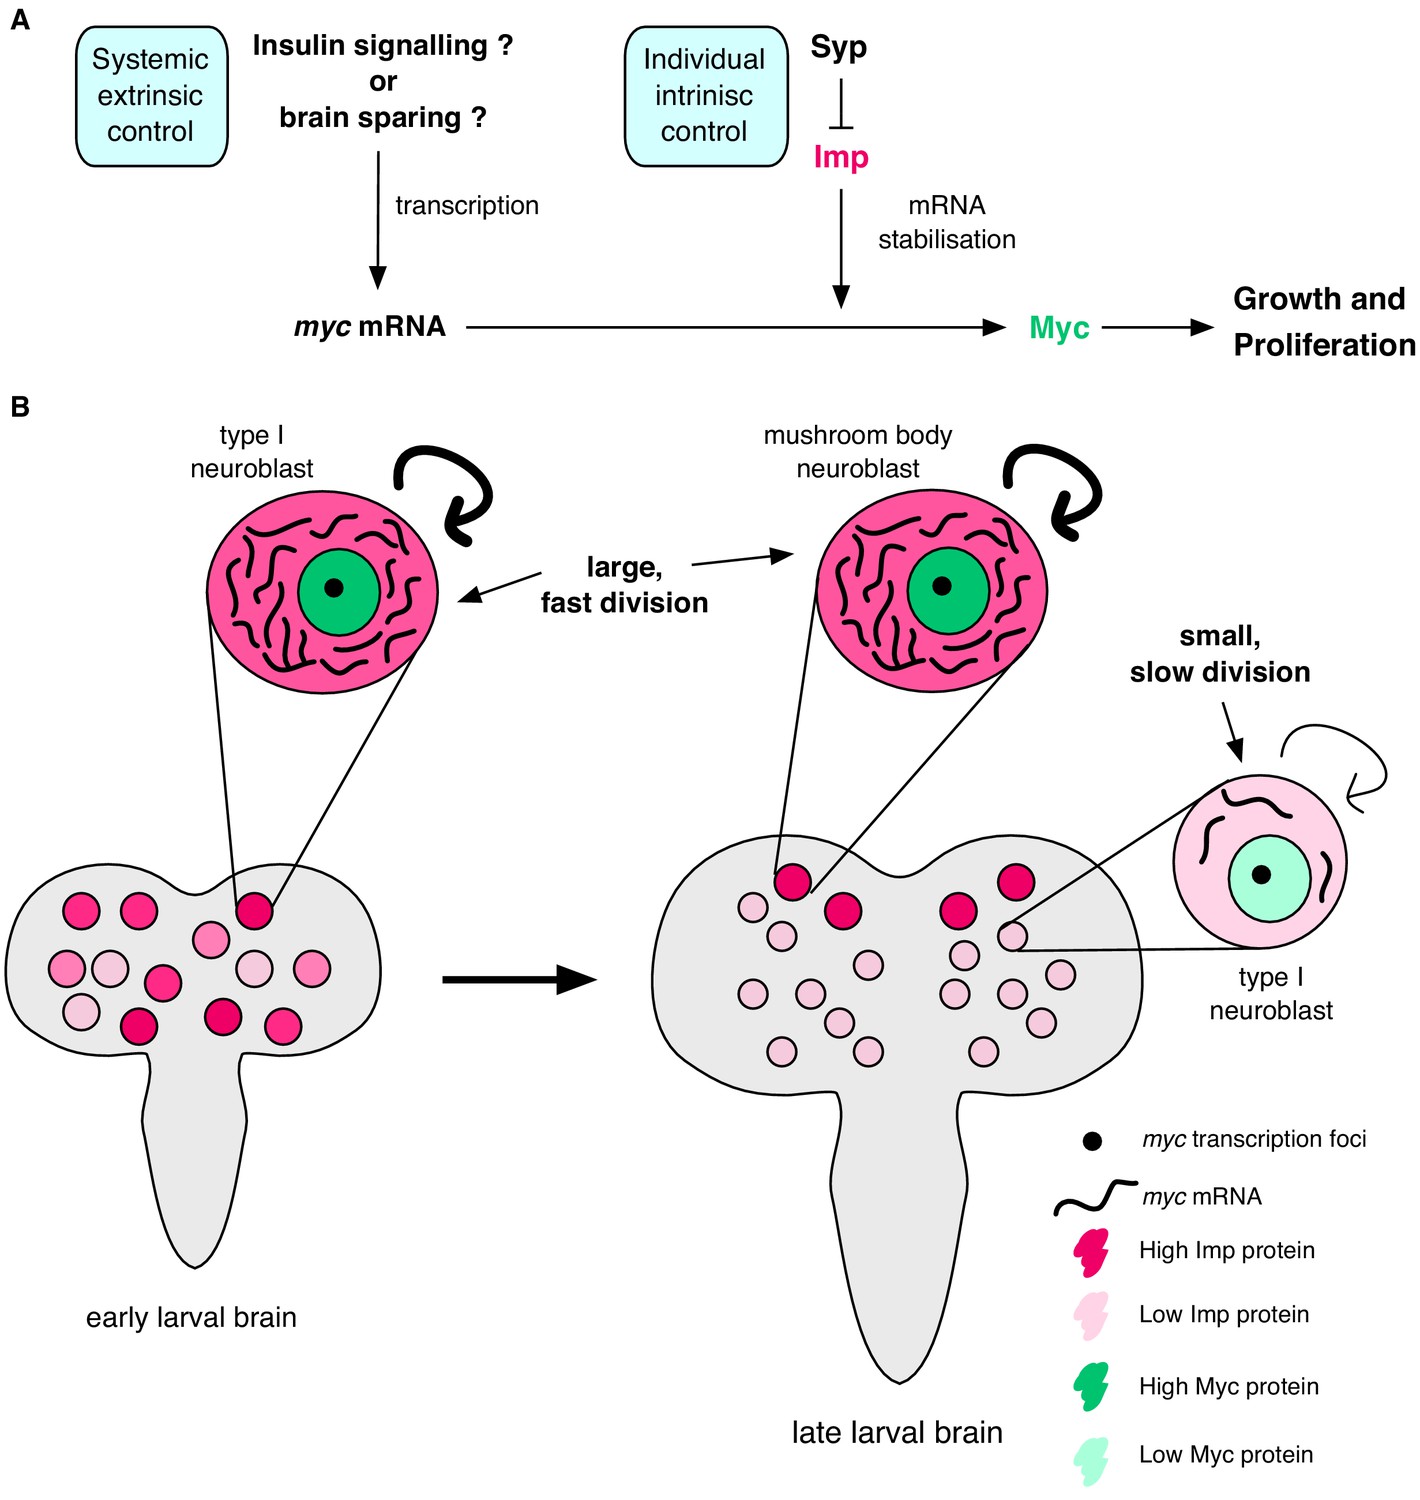
Imp stabilises myc mRNA to promote NB growth and division.
(A) Myc drives growth and proliferation in NBs. We show that Myc level is regulated by intrinsic levels of Imp through increased myc mRNA half-life. Syp negatively regulates Imp to affect Myc levels indirectly. In our model, the post-transcriptional regulation of myc by Imp overlays potential extrinsic growth signals (labelled with a ‘?’), activating myc transcription. Multiple layers of regulation control growth and proliferation in each NB through development. (B) In early larval brains, Imp level is high, myc mRNA is relatively more stable and NBs are large. In individual NBs Imp level correlates with myc mRNA half-life. At the wandering larval stage Imp level is low in type I NBs, myc mRNA is unstable and NBs are small and divide slowly. This is in contrast to the MB NBs which maintain higher Imp levels, have more stable myc mRNA, and are larger and faster dividing.
Tables
Key resources table
| Reagent type or resource | Designation | Source or reference | Identifiers | Additional information |
|---|---|---|---|---|
| Gene (Drosophila melanogaster) | Syncrip (Syp) | FBgn0038826 | ||
| Gene (Drosophila melanogaster) | IGF-II mRNA-binding protein (Imp) | FBgn0285926 | ||
| Gene (Drosophila melanogaster) | Myc | FBgn0262656 | ||
| Gene (Drosophila melanogaster) | Mnt | FBgn0023215 | ||
| Genetic reagent (D. melanogaster) | wild type OregonR | Bloomington | ||
| Genetic reagent (D. melanogaster) | Syp RNAi | VDRC | VDRC 33011 | ;P(GD9477)v33011 |
| Genetic reagent (D. melanogaster) | Imp RNAi line | Bloomington | BL 34977 | y(1) sc[*] v(1); P{y[+t7.7] v[+t1.8]=TRiP.HMS01168}attP2 |
| Genetic reagent (D. melanogaster) | Imp OE line UAS-Imp-RM-FLAG | Liu et al., 2015 | ||
| Genetic reagent (D. melanogaster) | Myc OE line | FLY-ORF collection | F001801 | M{UAS-Myc.ORF.3xHA.GW} |
| Genetic reagent (D. melanogaster) | Myc RNAi | Bloomington | BL 54154 | y(1) v(1); P{y[+t7.7] v[+t1.8]=TRiP.HMC03189}attP40 |
| Genetic reagent (D. melanogaster) | Imp::GFP | Toledano et al., 2012 | Imp[CB04573] | |
| Genetic reagent (D. melanogaster) | insc-GAL4 | Betschinger et al., 2006 | ||
| Antibody | α-Syncrip (guinea pig, polyclonal) | McDermott et al., 2014 | 1:2000 WB,1:500 IF | |
| Antibody | α-GFP (rat, monoclonal) | Chromotek | 3H9 RRID:AB_10773374 | 1:1000 WB |
| Antibody | α-αTubulin (mouse, monoclonal) | Sigma | 1:500 WB | |
| Antibody | α-Imp (rabbit, polyclonal) | Gift from P. M. Macdonald | 1:600 IF | |
| Antibody | α-Deadpan (rat, monoclonal) | abcam | 11D1BC7 RRID:AB_2687586 | 1:200 IF |
| Antibody | α-Myc (mouse, monoclonal) | Gift from R. N. Eisenman and DSHB | P4C4-B10 | 1:100 IF |
| Antibody | α-Mnt (mouse, monoclonal) | Gift from R. N. Eisenman | 1:100 IF | |
| Commercial assay, kit | GFP-trap agarose beads | Chromotek | gta-20 | |
| Commercial assay, kit | Stellaris DNA probes | Stellaris | ||
| Commercial assay, kit | Phalloidin | Sigma | ||
| Commercial assay, kit | RNAspin Mini kit | GE Healthcare | ||
| Commercial assay, kit | NEBNext Poly(A) mRNA Magnetic Isolation Module | NEB | ||
| Commercial assay, kit | Ion Total RNA-Seq Kit v2 for Whole Transcriptome Libraries | Life Technologies | ||
| Commercial assay, kit | Agilent High Sensitivity DNA Kit | Agilent | ||
| Commercial assay, kit | Click-iT EdU Alexa Fluor 488/594 Imaging Kit | Invitrogen | ||
| Software, algorithm | GraphPad Prism version 7 | GraphPad Software | ||
| Software, algorithm | ImageJ version 2.0.0 | Fiji | ||
| Software, algorithm | FISHquant | Mueller et al., 2013 | ||
| Software, algorithm | Transquant | Bahar Halpern and Itzkovitz, 2016 |
Table 1
qPCR primers.
| Gene | Forward | Reverse |
|---|---|---|
| rp49 | GCTAAGCTGTCGCACAAA | TCCGGTGGGCAGCATGTG |
| pros | TATGCACGACAAGCTGTCACC | CGACCACGAAGCGGAAATTC |
| chic | CTGCATGAAGACAACACAAGC | CAAGTTTCTCTACCACGGAAGC |
| syp | TATGTGCGAAATCTTACCCAGGA | CGTTCCACTTTTCCGTATTGCTC |
| myc | CGGCAGCGATAGCATAAAAT | ACCTCGTCGGTAAGACTGTGA |
| Eip93F | cgatgtgaagtccgtcagag | gatttccgggcatctagctt |
| mamo | ccatcagagcccataaggtg | caaaacggacgtccttcaat |
Additional files
-
Source code 1
Analysis of Imp targets in the D. melanogaster larval brain.
Details and code used for the bioinformatic analysis of the Imp RIPseq and RNAseq data presented in Figure 2 and Figure 2—figure supplement 1.
- https://cdn.elifesciences.org/articles/51529/elife-51529-code1-v2.pdf
-
Supplementary file 1
Imp targets and GO terms used for categorisation.
Table of Imp RIPseq targets: including read counts from three Imp RIPseq libraries and three RNAseq libraries, differential expression and GO analysis. GO terms falling under the following categories are listed: cell growth, cell size, cell division, cell cycle, neural development, RNA binding, DNA binding.
- https://cdn.elifesciences.org/articles/51529/elife-51529-supp1-v2.xlsx
-
Supplementary file 2
Stellaris Probes.
- https://cdn.elifesciences.org/articles/51529/elife-51529-supp2-v2.docx
-
Transparent reporting form
- https://cdn.elifesciences.org/articles/51529/elife-51529-transrepform-v2.docx
Download links
A two-part list of links to download the article, or parts of the article, in various formats.
Downloads (link to download the article as PDF)
Open citations (links to open the citations from this article in various online reference manager services)
Cite this article (links to download the citations from this article in formats compatible with various reference manager tools)
Imp/IGF2BP levels modulate individual neural stem cell growth and division through myc mRNA stability
eLife 9:e51529.
https://doi.org/10.7554/eLife.51529


