Plasmodium-infected erythrocytes induce secretion of IGFBP7 to form type II rosettes and escape phagocytosis
- Agency for Science, Technology and Research (A*STAR), Singapore
- University of Otago, New Zealand
- Institute of Medical Biology (IMB) Agency for Science, Technology and Research (A*STAR), Singapore
- Australian National University, Australia
- Université de Paris, Biologie Intégrée du Globule Rouge, UMR_S1134, BIGR, INSERM, France
- Institut National de la Transfusion Sanguine, France
- Faculty of Medicine, University of Malaya, Malaysia
- National University of Singapore, Singapore
- Mahidol University, Thailand
- University of Oxford, United Kingdom
Figures
Figure 1
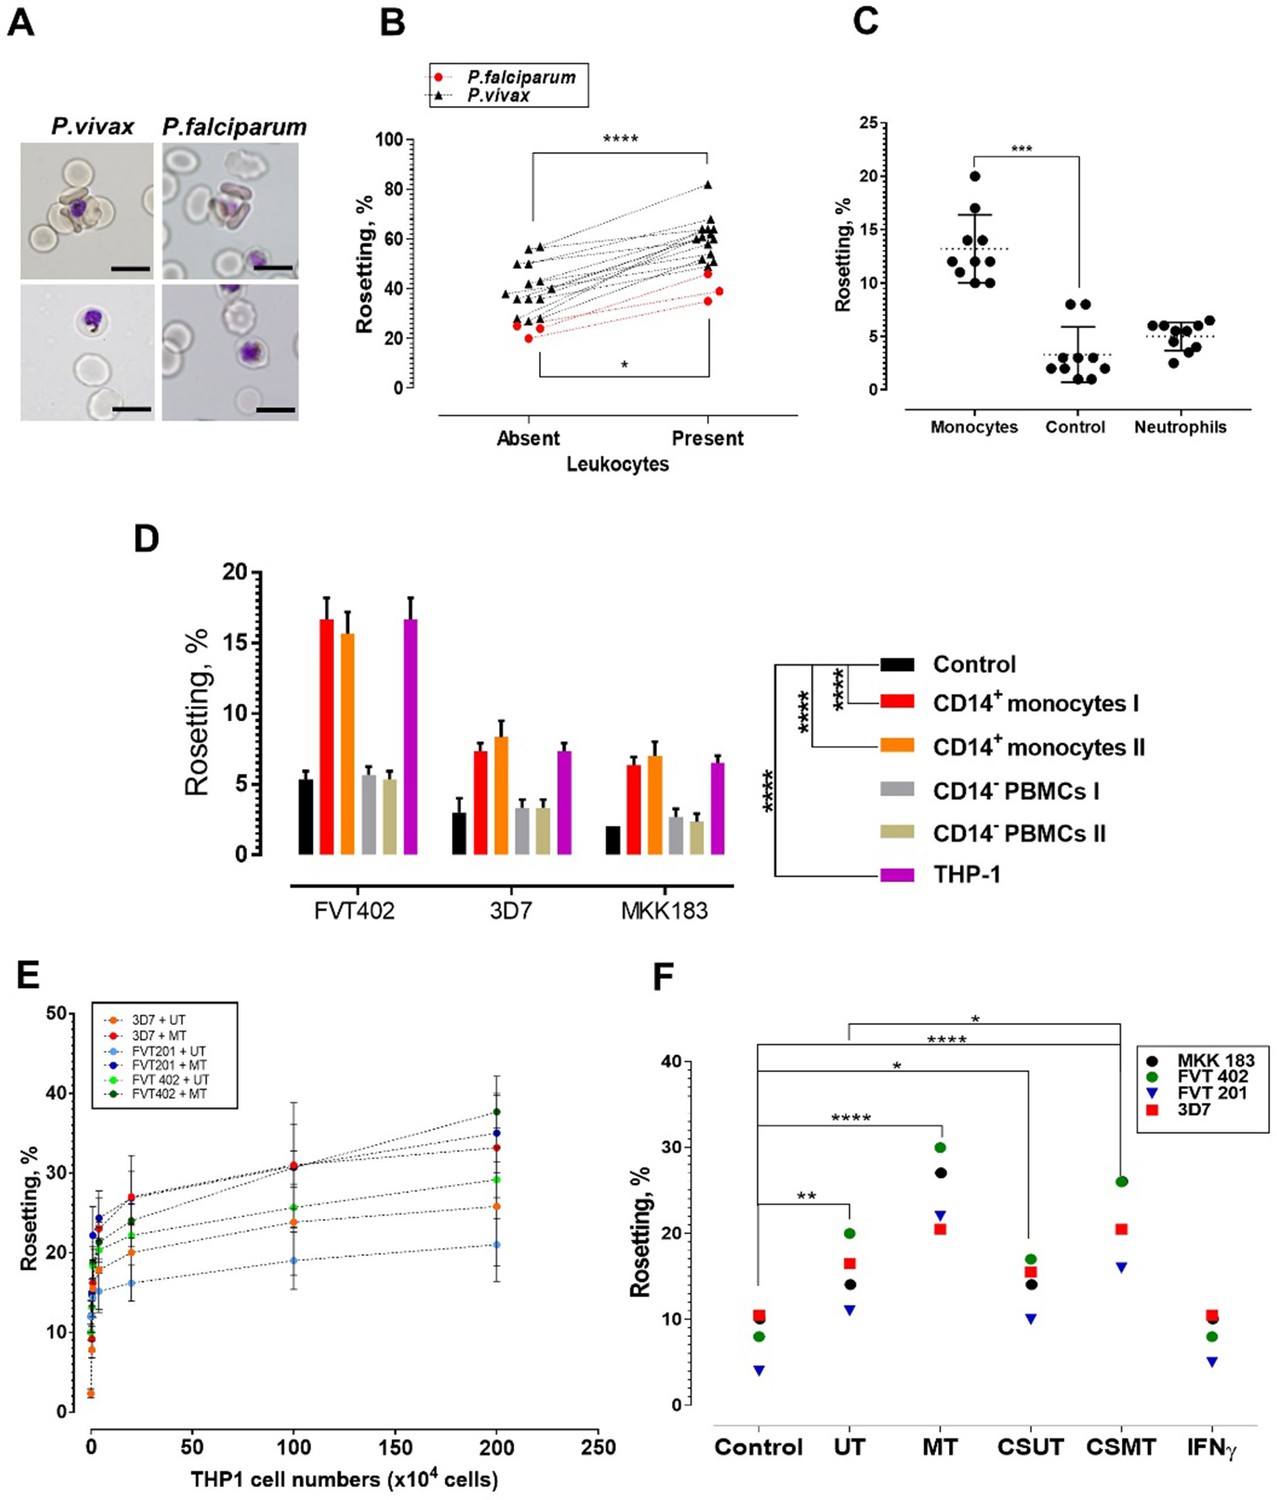
Deciphering the leukocyte subpopulation that influences rosetting.
(A) Rosette (above) and non-rosetting (bottom) IRBC in culture medium for respective species. Scale bars represent 10 µm; oil immersion (1000×) magnification. Pictures taken with microscope camera Olympus DP21 on light microscope Olympus BX43. (B) Effect of autologous leukocytes on rosetting [P. falciparum (Pf, n = 3) (paired t-test p=0.0115) and P. vivax (Pv, n = 14) (paired t-test p<0.0001)]. (C) Comparison of effects of monocytes and neutrophils from different healthy individuals (n = 3) on Pf (n = 4) rosetting, Friedman test with Dunn’s multiple comparison test p=0.0003 for comparison between control and monocytes; p=0.7422 between control and neutrophils. (D) Rosetting rates of lab-adapted Pf lines under different experimental conditions (co-incubated with 1 × 10⁵ purified CD14+ peripheral monocytes and CD14− PBMC fractions from two healthy individuals, 1 × 10⁵ THP-1s, and control without co-incubation with WBCs). Means and SD of triplicate (three biological replicates) experiments shown. Two-way ANOVA with Tukey’s multiple comparison test: adjusted p<0.0001 in control vs. both CD14+ and control vs. THP-1 for all parasite lines. No significant difference found in THP-1 vs. CD14+ (p>0.5 for all parasite lines), and control vs. CD14− (p>0.5 for all parasite lines). (E) Plot showing changes of rosetting rates of three laboratory-adapted P. falciparum lines when incubated with different numbers of UT and MT separately. Means and SD of triplicate experiments shown. (F) Rosetting of lab-adapted Pf lines under different experiment conditions [control, with UT, MT, and with culture supernatant of UT (CSUT) and MT (CSMT)]. One-way ANOVA with Tukey’s multiple comparison test: control vs. UT: p=0.0072; control vs. MT: p<0.0001; control vs. CSUT: p=0.0293; control vs. CSMT: p<0.0001; control vs. IFNγ: p>0.9999; UT vs. CSUT: p=0.1411; MT vs. CSMT: p=0.1397. UT vs. CSMT: p=0.033; df = 3. *p<0.05, **p<0.01, ***p<0.001, ****p<0.0001.
-
Figure 1—source data 1
Raw data (rosetting rates, %) for the data set presented in the bar graph (Figure 1D).
R = biological replicate (same parasite line, but different flasks of cultures, using the same URBCs and culture media).
- https://cdn.elifesciences.org/articles/51546/elife-51546-fig1-data1-v2.docx
Figure 2
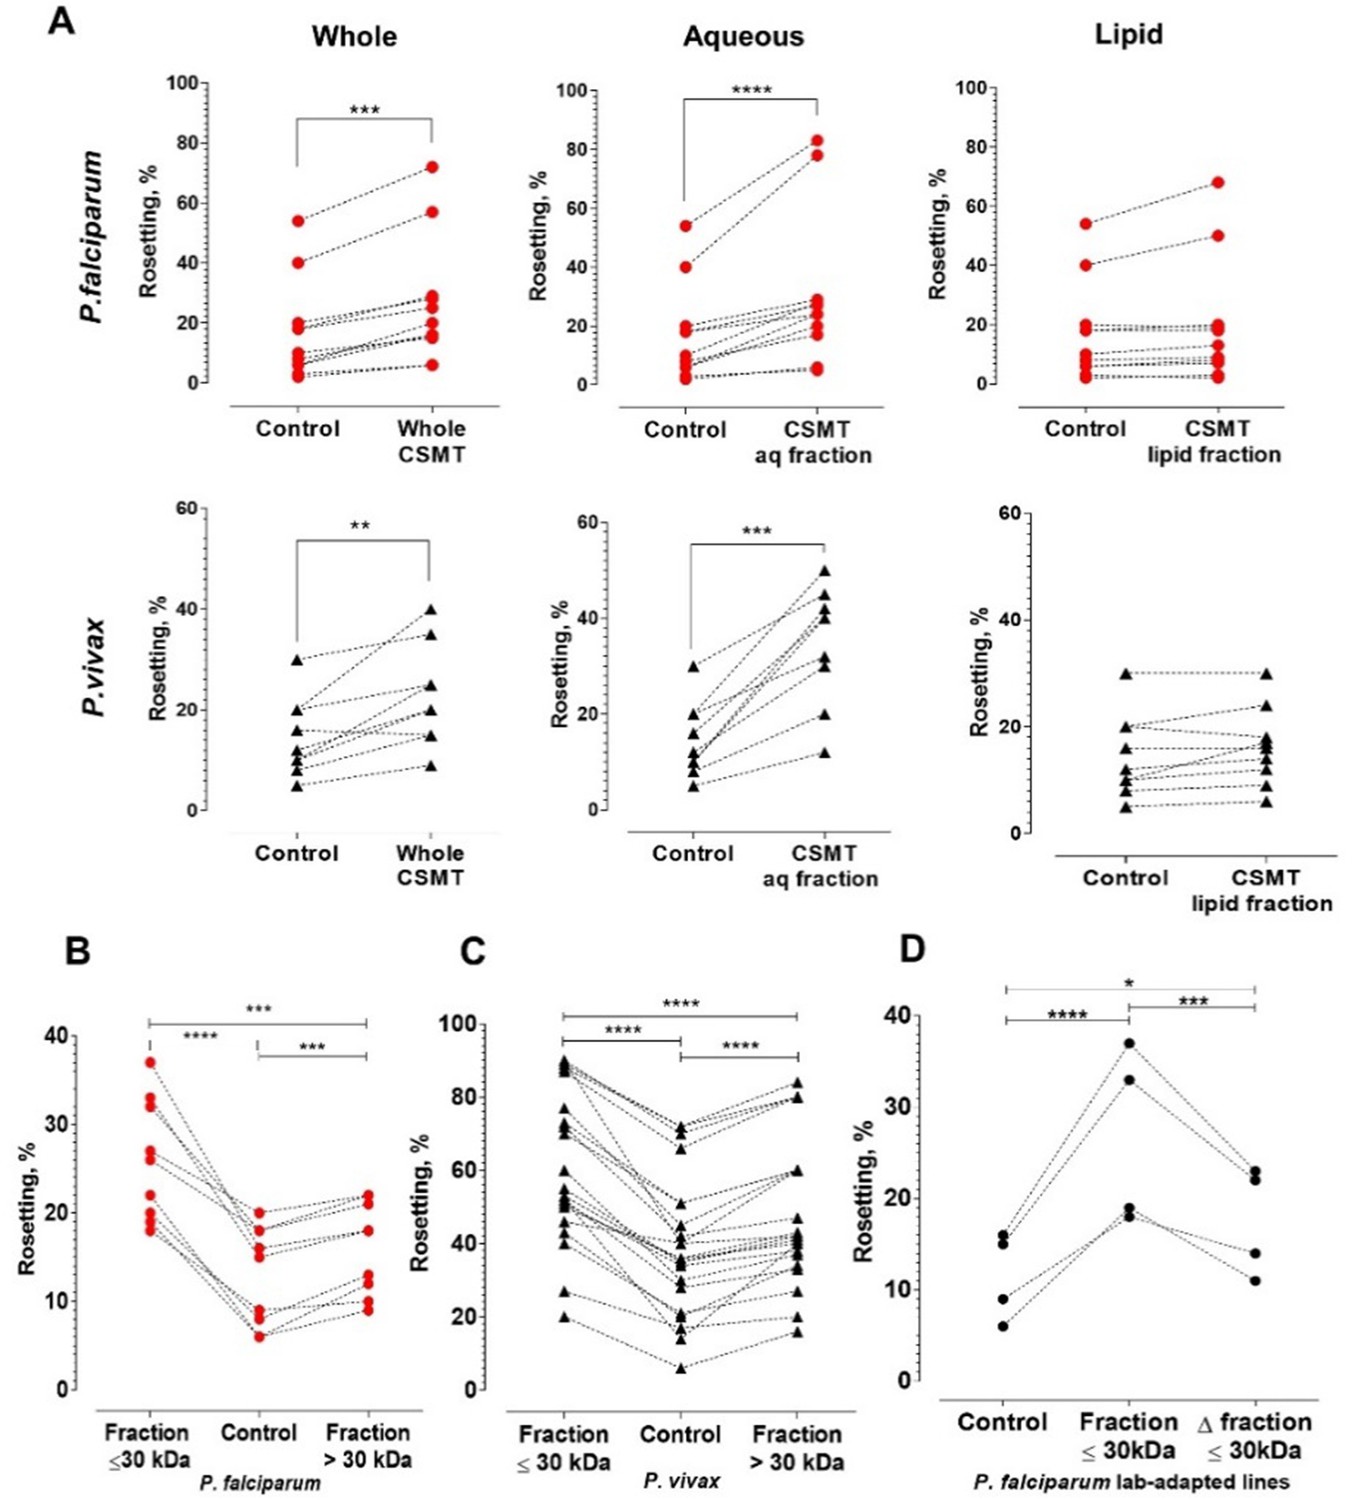
Characterization of the secreted rosette-stimulating factors.
(A) Rosetting of clinical isolates (Pf: n = 11, Pv: n = 9) post-incubation with whole CSMT (paired t-test Pf: p=0.0001; Pv: p=0.0017) and its aqueous (Pf: p<0.0001; Pv: p=0.0002) and lipid (Pf: p=0.0954; Pv: p=0.0905) fractions. (B, C) Pf (n = 9) and Pv (n = 22) rosetting post-incubation with CMST aqueous fractions of different sizes. From one-way ANOVA with Tukey’s test, both smaller-size (Pf: p<0.0001; Pv: p<0.0001) and larger-size (Pf: p=0.0007; Pv: p<0.0001) fractions significantly stimulated rosetting, with the smaller-size fraction exerting higher rosette-stimulation than the larger-size fraction (Pf: p=0.0005; Pv: p<0.0001). (D) Effect of heating on rosette-stimulation by the CMST aqueous ≤30 kDa fraction. The experiment was conducted with laboratory-adapted P. falciparum (n = 4). One-way ANOVA with Tukey’s test: the unheated (p<0.0001) and heat-denatured (Δ) fractions (p=0.0236) stimulated rosetting, with the unheated fraction exerting higher stimulation than the heated fraction (p=0.0009). *p<0.05, **p<0.01, ***p<0.001, ****p<0.0001.
Figure 3
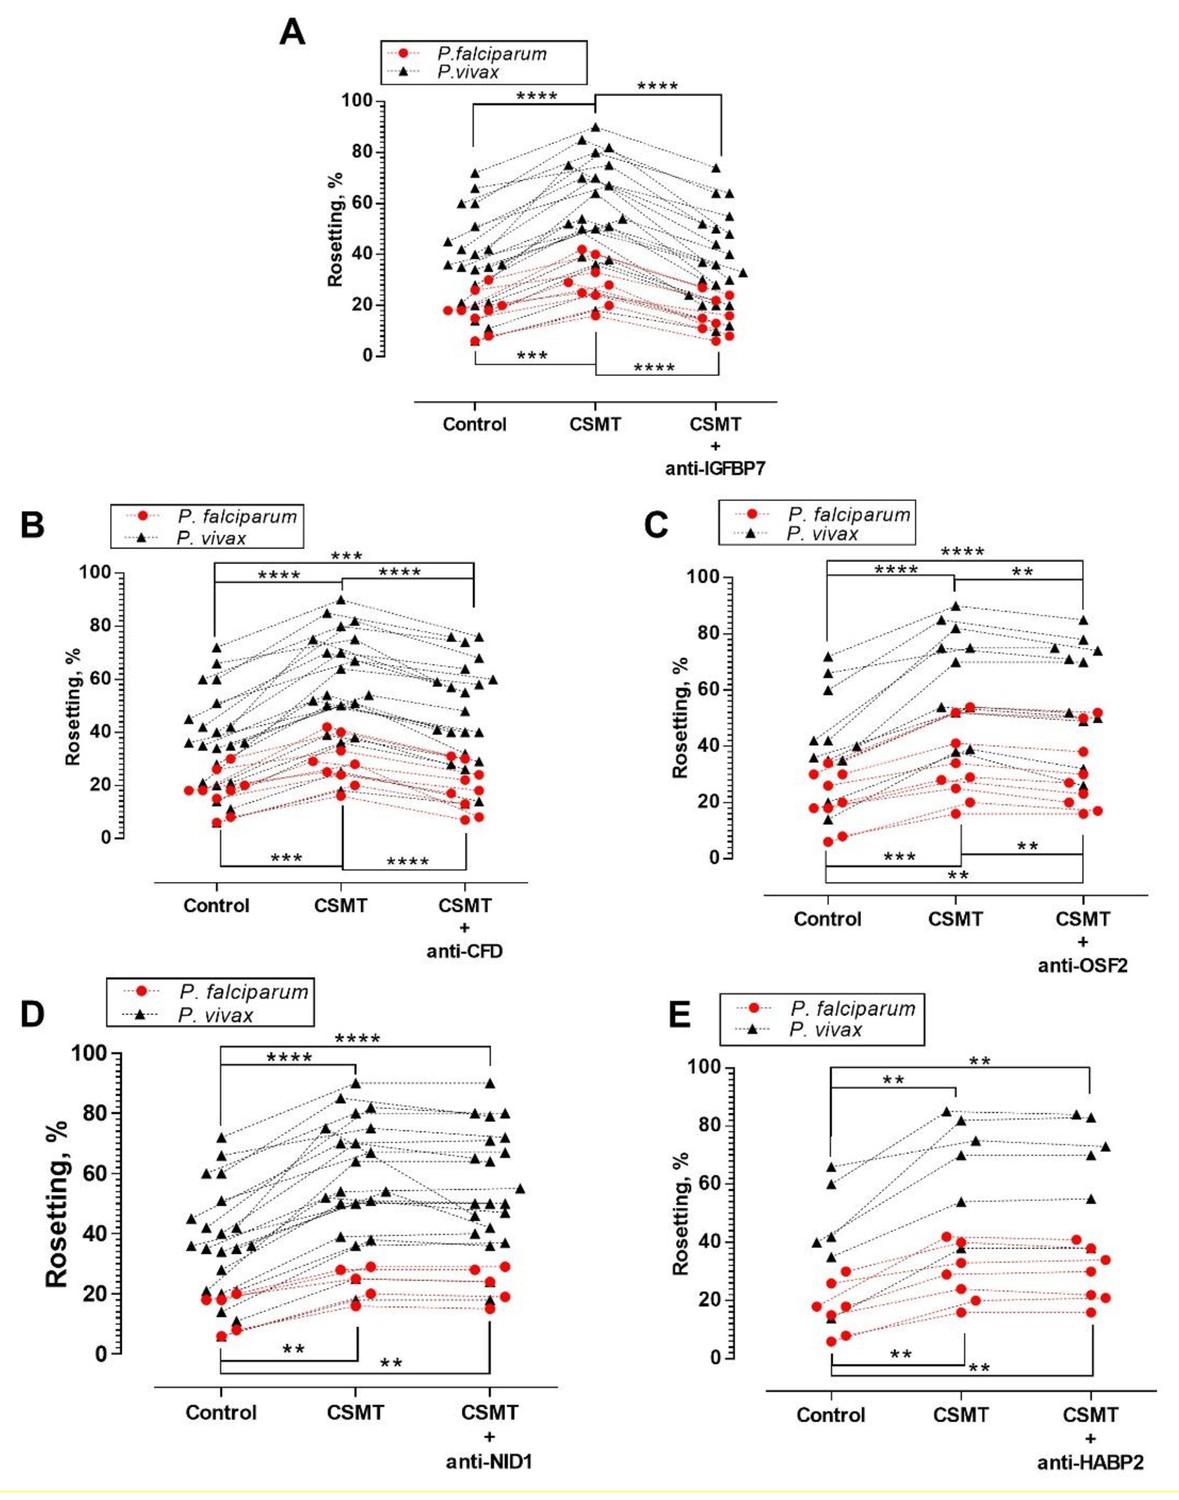
Antibody blocking assay.
One-way ANOVA with Tukey’s test was conducted to compare the rosetting rates between the control, CSMT and CSMT + antibodies against proteins of interest. (A) Rosetting rates were significantly increased by CSMT [Pf (n = 9): p=0.0008; Pv (n = 21): p<0.0001]. Anti-IGFBP7 significantly reduced the CSMT-mediated rosette-stimulation [Pf: p<0.0001; Pv: p<0.0001]. No significant difference was found between the control and CSMT + anti-IGFBP7 groups [Pf: p=0.5498; Pv: p=0.8724]. (B) Significant rosette-stimulation was found between control and CSMT [Pf (n = 9): p=0.0008; Pv (n = 21): p<0.0001]. Anti-CFD significantly reduced CSMT-mediated rosette-stimulation [Pf: p=0.0003; Pv: p<0.0001]. A significant difference was detected between control and CSMT + anti-CFD groups for Pv (p=0.0002), but not in Pf (p=0.8494). (C) Rosetting rates were significantly increased by CSMT [Pf (n = 9): p=0.0004; Pv (n = 11): p<0.0001]. Anti-OSF2 significantly reduced the CSMT-mediated rosette-stimulation [Pf: p=0.0017; Pv: p=0.0038]. A significant difference was detected between control and CSMT + anti-OSF2 groups for Pf (p=0.0058) and Pv (p<0.0001). (D) Rosetting rates were significantly increased by CSMT [Pf (n = 5): p=0.0038; Pv (n = 21): p<0.0001]. Anti-NID1 did not significantly alter CSMT-mediated rosette-stimulation [Pf: p=0.1432; Pv: p=0.1369]. A significant difference was found between control and CSMT + anti-NID1[Pf: p=0.0051; Pv: p<0.0001]. (E) Rosetting rates were significantly increased by CSMT [Pf (n = 7): p=0.0040; Pv (n = 6): p=0.0051]. Anti-HABP2 did not significantly alter CSMT-mediated rosette-stimulation [Pf: p=0.8514; Pv: p=0.9358]. A significant difference was found between control and CSMT + anti-HABP2 [Pf: p=0.0045; Pv: p=0.0073]. Of note, anti-human NID1 IgG was of the same subclass and raised in the same animal species as the antibodies used against IGFBP7, CFD, and OSF2 (Supplementary file 1). Hence, it also acted as a negative control in this set of experiments .* p<0.05, **p<0.01, ***p<0.001, ****p<0.0001.
Figure 4 with 1 supplement
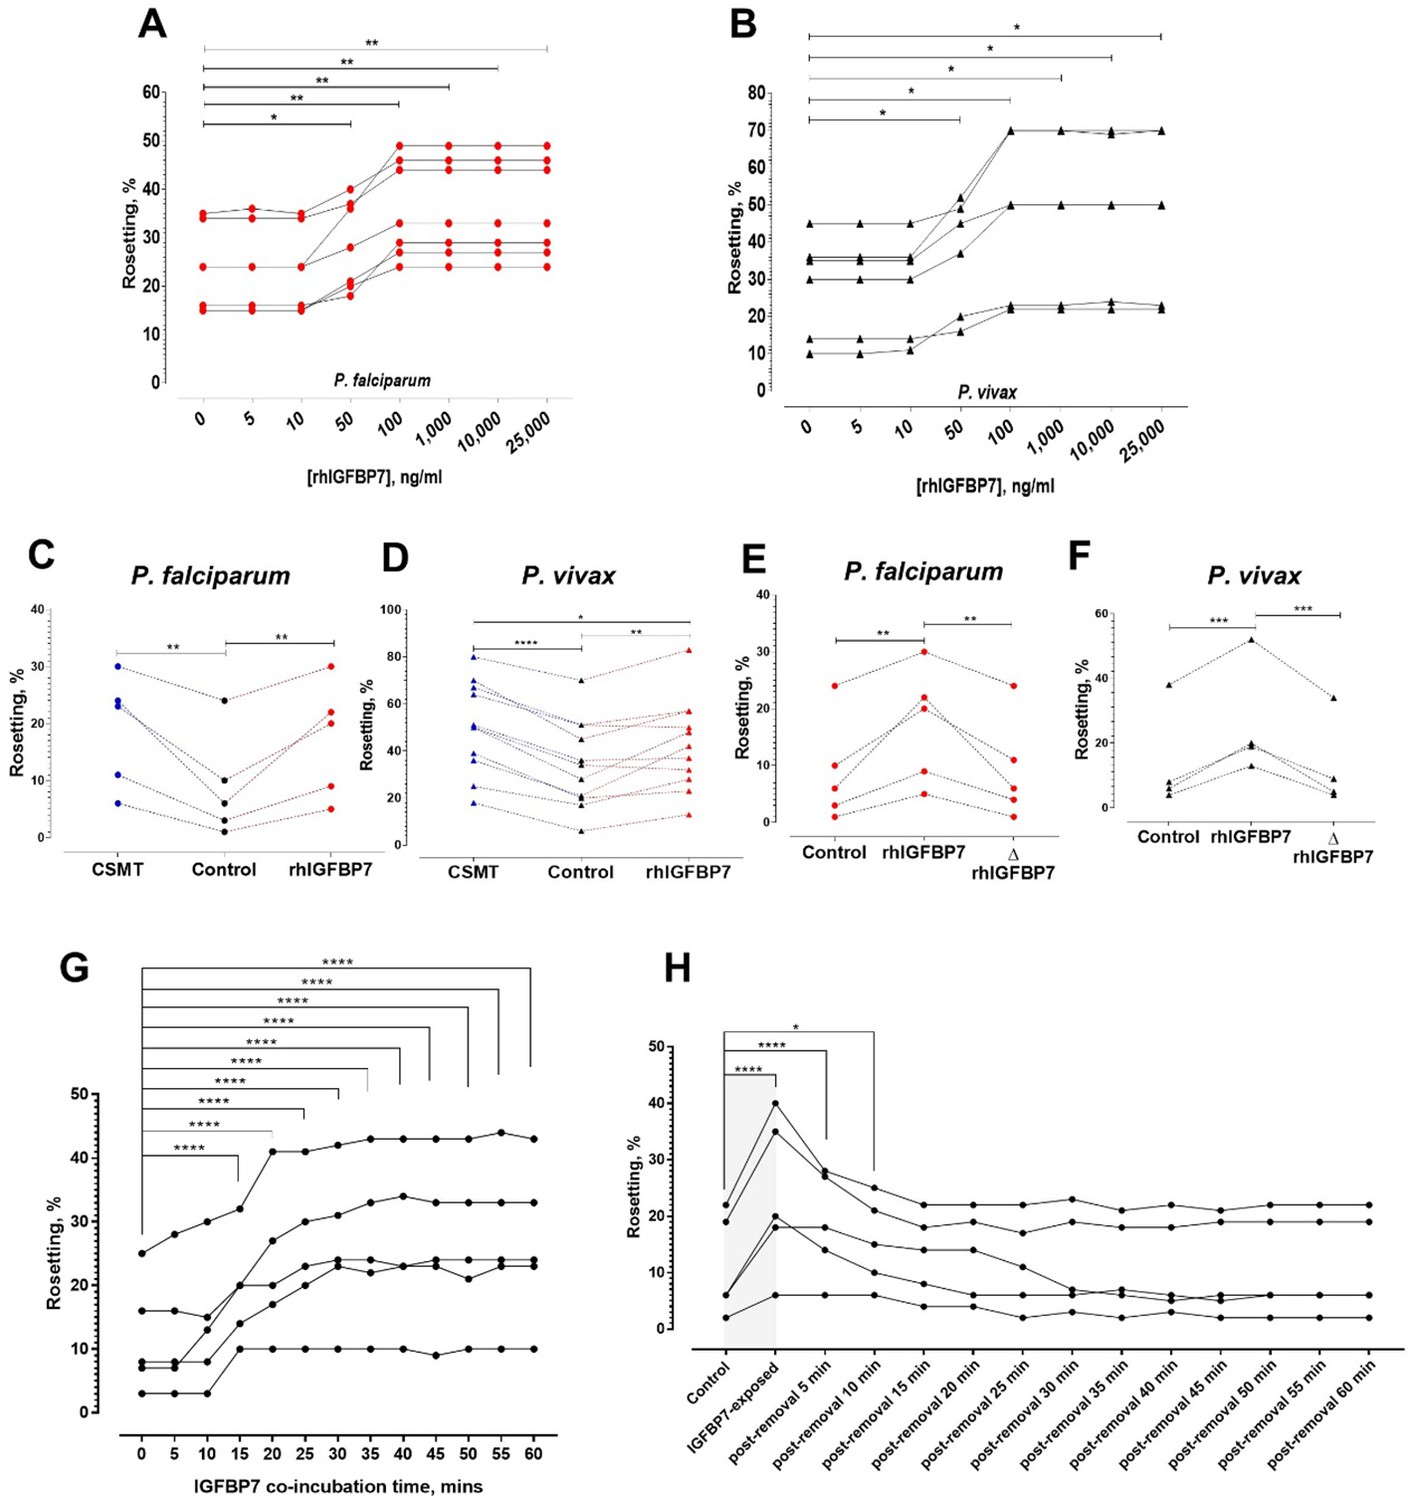
Characterization of IGFBP7-mediated rosetting.
(A, B) Rosetting rates post-rhIGFBP7-incubation. Significant rosette-stimulation was noted at 50 ng/ml rhIGFBP7 (one-way ANOVA with Dunnett’s test: Pf (n = 7): p=0.0224; Pv (n = 7): p=0.0419) and a plateau was reached after 100 ng/ml (Pf: p=0.0045; Pv: p=0.0168). (C, D) Comparison of rosette-stimulatory effects between the CSMT and rhIGFBP7 in P. falciparum (n = 5) (one-way ANOVA with Tukey’s test: control vs. CMST: p=0.0019; control vs. rhIGFBP7: p=0.0054; CMST vs. rhIGFBP7: p=0.6866) (C) and P. vivax (n = 11) (one-way ANOVA with Tukey’s test: control vs. CMST: p<0.0001; control vs. rhIGFBP7: p=0.0039; CMST vs. rhIGFBP7: p=0.0108) (D). (E, F) Impact of heat denaturation on rosette-stimulatory effect of rhIGFBP7 in P. falciparum (n = 5) (E) (one-way ANOVA with Tukey’s test: control vs. rhIGFBP7: p=0.0036; control vs. ΔrhIGFBP7: p=0.9721; rhIGFBP7 vs. ΔrhIGFBP7: p=0.0048) and P. vivax (n = 4) (F) (one-way ANOVA with Tukey’s test: control vs. rhIGFBP7: p=0.0006; Control vs. ΔrhIGFBP7: p=0.8008; rhIGFBP7 vs. ΔrhIGFBP7: p=0.0004). (G) Changes in lab-adapted Pf (n = 5) rosetting rates after incubation with IGFBP7 up till the 60th minute (one-way ANOVA with Dunnett’s test: significant increment was detected as fast as the 15th minute (and onwards): p=0.0001). (H) Changes in rosetting rates of lab-adapted Pf (n = 5) after IGFBP7-exposure (covered by the gray box), followed by removal of IGFBP7 from the system in the span of 60 min (one-way ANOVA with Dunnett’s test: significant rosetting rate increment was seen after IGFBP7 exposure: p=0.0001). The rosetting rates were still significantly higher than the baseline (control) 5 min (p=0.0001) and 10 min (p=0.0265) after IGFBP7-removal. From the 15th to the 60th minute post-IGFBP7 removal, the rosetting rates dropped to levels that were of no significant difference with the baseline values.
Figure 4—figure supplement 1

IRBC, URBC, and IGFBP7.
URBC, IRBC, and URBC+ IRBC exposed to IGFBP7 visualized with unstained, acridine orange and Giemsa wet mounts, which are the common techniques for rosetting assay. Pictures taken with Nikon Eclipse E200 light microscope. Scale bars represent 10 µm.
Figure 5
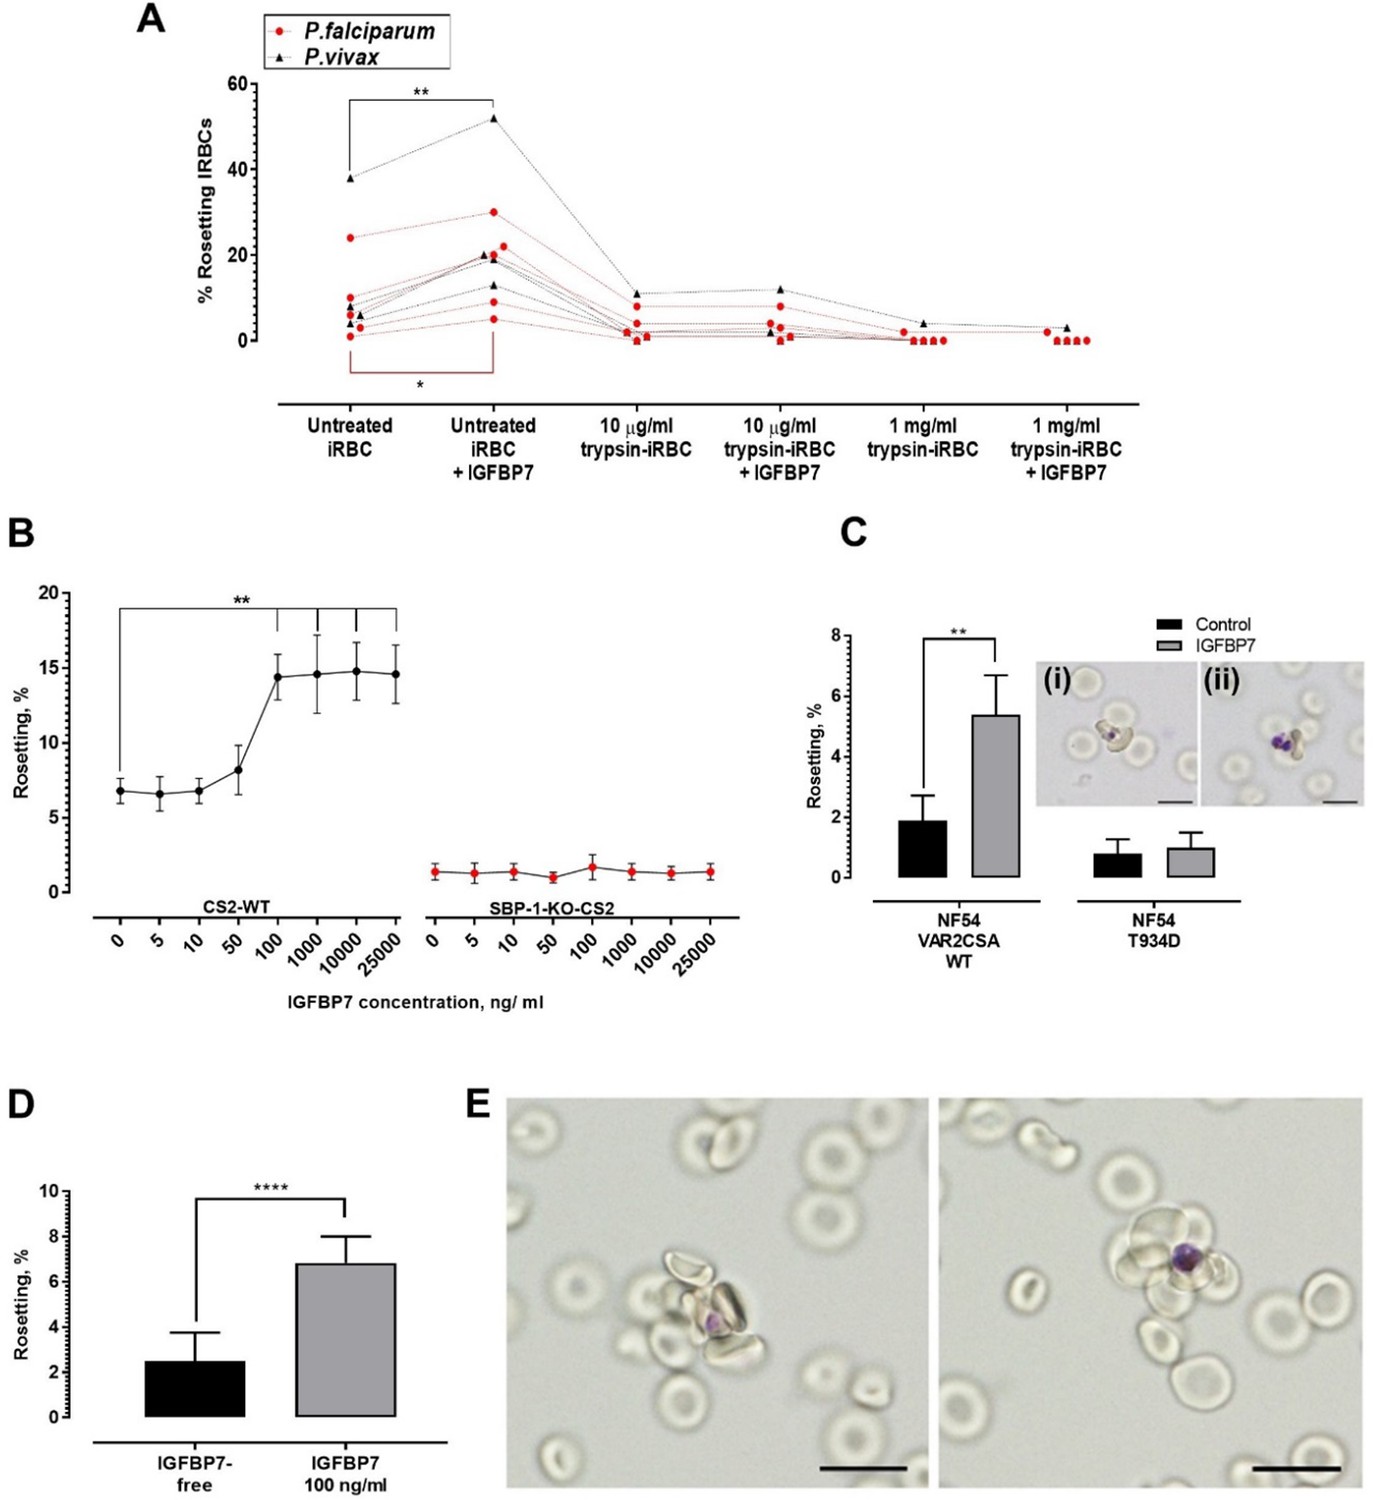
Deciphering rosetting ligands involved in IGFBP7-mediated rosetting.
(A) IRBC-trypsin treatments on IGFBP7-mediated rosetting. Dotted lines demonstrate data collected from same isolates. IGFBP7 increased rosetting in the untreated settings (paired t-test Pf (n = 5): p=0.0171; Pv (n = 4): p=0.0023) but did not significantly alter rosetting in groups treated with 10 µg/ml trypsin (Pf: p=0.3739; Pv: p=0.3910) and 1 mg/ml trypsin (Pf: same values; Pv: p=0.3910). (B) Rosetting rates (mean and SD from quintuplicate experiment repeats shown) along rhIGFBP7 concentrations for PfCS2-WT and PfSBP1-KO-CS2. Significant CS2-WT rosette-stimulation was noted from rhIGFBP7 of 100 ng/ml (Friedman with Dunn’s test: p=0.0230). No significant changes noted for SBP1-KO-CS2 across the range of IGFBP7 concentrations studied (Friedman with Dunn’s test: p>0.9999). (C) Effect of IGFBP7 on rosetting rates of NF54_VAR2CSA_WT and NF54_T934D (mean and SD from quintuplicate experiment repeats shown). The Mann-Whitney test was conducted. For NF54_VAR2CSA_WT, IGFBP7 significantly increased the rosetting rates (p=0.0079). For NF54 VAR2CSAT934D, IGFBP7 did not cause any significant change to the rosetting rates of the parasite (p=0.7619). The rosettes formed by NF54_VAR2CSA_WT (i) and NF54_VAR2CSA_T934D (ii) are small. (D) Rosetting rates of the late ring forms (means and SD of nine replicates shown) under IGFBP7-free and IGFBP7-supplied conditions. The Mann-Whitney test was conducted. Rosetting rates were significantly higher in the IGFBP7-supplied group (p<0.0001). (E) Rosettes formed by the late ring stage (left) and late trophozoite stage (right) of P. falciparum. Scale bar: 10 µm.
-
Figure 5—source data 1
Raw data (rosetting rates, %) for the data set presented in the bar graph (Figure 5C).
R = biological replicate (same parasite line, but different flasks of cultures using the same URBCs and culture media).
- https://cdn.elifesciences.org/articles/51546/elife-51546-fig5-data1-v2.docx
-
Figure 5—source data 2
Raw data (rosetting rates, %) for the data set presented in the bar graph (Figure 5D).
R = biological replicate (same lab-adapted parasite, but conducted on three cycles of ring stages from three different flasks of cultures using the same batch of URBCs and culture media). F = flask, C = cycle.
- https://cdn.elifesciences.org/articles/51546/elife-51546-fig5-data2-v2.docx
Figure 6
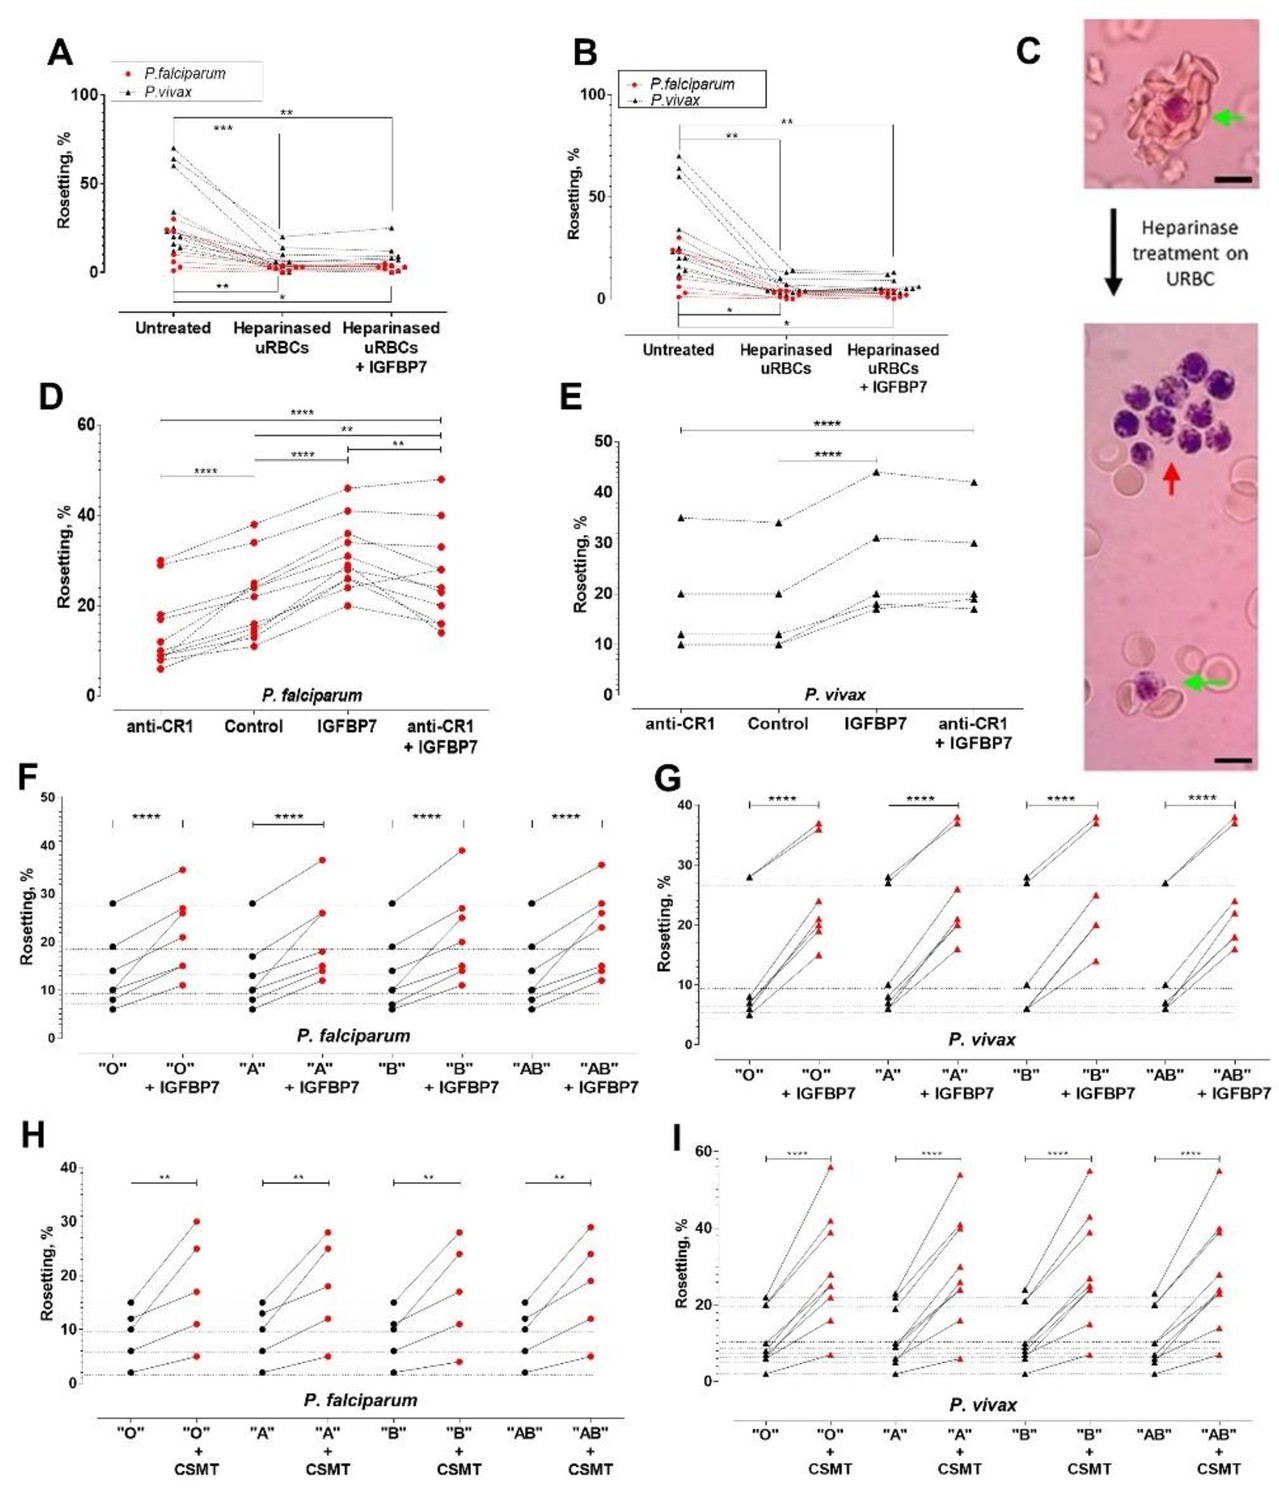
Deciphering rosetting receptors involved in IGFBP7-mediated rosetting.
(A) Heparinase (hep) I treatment (represented as "heparinased" in graph) on URBC hampered IGFBP7-mediated rosetting. Friedman with Dunn’s test: Pf (n = 7): untreated vs. hep: p=0.0063; hep vs. hep + IGFBP7: p>0.9999; untreated vs. hep + IGFBP7: p=0.0334. Pv (n = 11): untreated vs. hep: p=0.0004; hep vs. hep + IGFBP7: p>0.9999; untreated vs. hep + IGFBP7: p=0.0042. (B) Hep III treatment (represented as "heparinased" in graph) on U RBC hampered IGFBP7-mediated rosetting. Friedman with Dunn’s test Pf (n = 7): untreated vs. hep: p=0.0150; hep vs. hep + IGFBP7: p>0.9999; untreated vs. hep + IGFBP7: p=0.0485. Pv (n = 11): untreated vs. hep: p=0.0013; hep vs. hep + IGFBP7: p>0.9999; untreated vs. hep + IGFBP7: p=0.0013. (C) Rosette size difference between the untreated (left) and heparinase-treated (right) settings of a P. vivax isolate. Rosettes are indicated by green arrows, and IRBC- autoagglutination-like clustering is indicated by the red arrow. Pictures taken with Samsung Galaxy W phone camera on Nikon Eclipse E200 light microscope. Scale bars represent 10 µm. (D) Anti-CR1 reduced Pf (n = 11) rosetting (one-way ANOVA with Tukey’s test: p<0.0001). With CR1-blockade, IGFBP7 still managed to induced significant rosette-stimulation (p=0.0057), albeit to a lower degree than Ab-free setting (p=0.0095). (E) Anti-CR1 did not inhibit Pv (n = 5) rosetting [one-way ANOVA with Tukey’s test: p=0.9947]. IGFBP7 increased rosetting (p<0.0001). No significant difference was found between IGFBP7 and anti-CR1+IGFBP7 groups (p=0.9612). Effect of different ABO blood groups on IGFBP7-mediated rosetting for Pf (n = 7) (F) and Pv (n = 7) (G). Dotted horizontal lines in these plots matched the same isolates used in each of the different ABO blood group experiments. IGFBP7 significantly increased rosetting rates regardless of the blood groups [one-way ANOVA with Tukey’s test: (Pf: p<0.0001 for all groups); (Pv: p<0.0001 for all groups)]. No significant differences in rosetting rates (control and IGFBP7-supplied) across all blood groups for both species. The degree of rosette stimulation by CSMT on Pf (n = 5) (H) and Pv (n = 9) (I) with URBC of different ABO blood groups. Dotted lines in these plots matched the same isolates used in each of the different blood group experiments. CSMT increased rosetting regardless of the blood groups [one-way ANOVA with Tukey’s test: (Pf: Group O: p=0.0014; Group A: p=0.0018; Group B: p=0.0033; Group AB: p=0.0010); (Pv: p<0.0001 for all blood groups)]. No significant differences were found in rosetting rates (control and CMST-supplied) across all groups for both species.
Figure 7 with 1 supplement
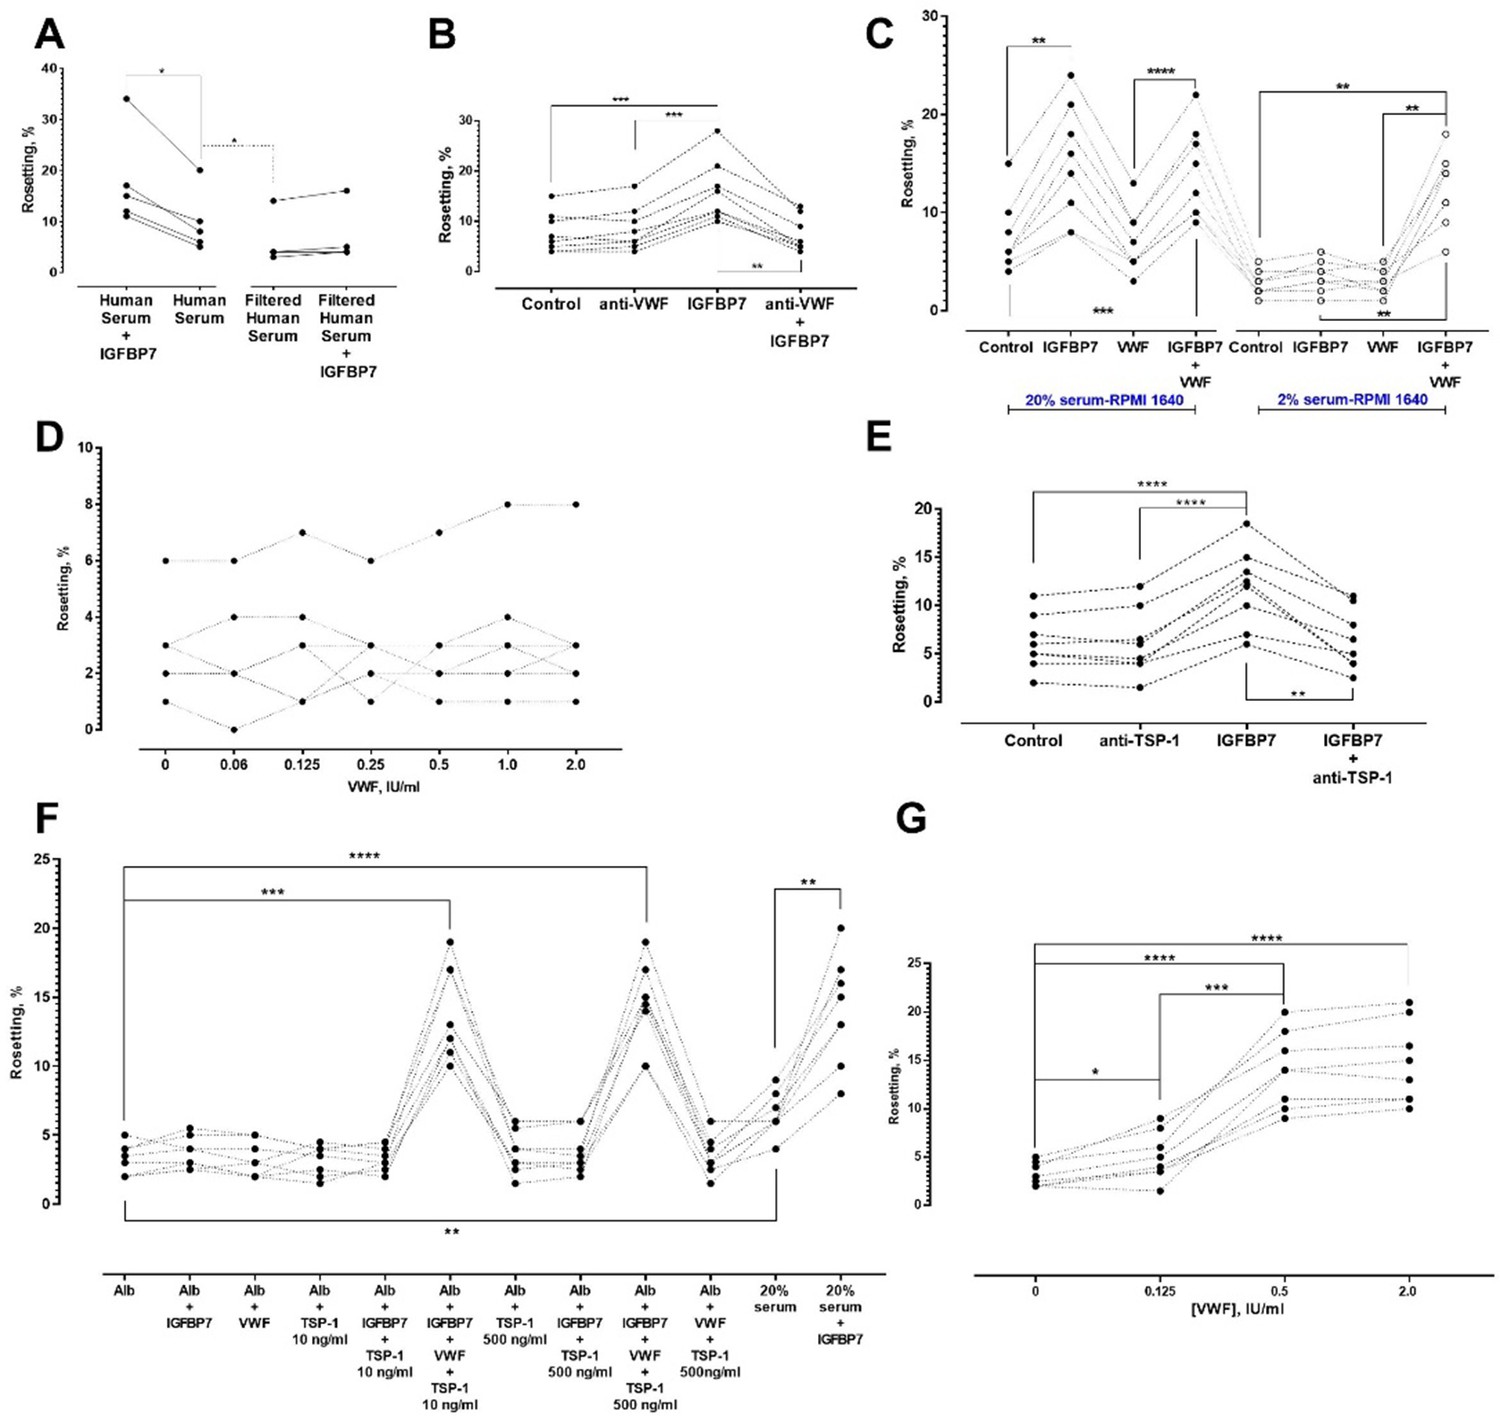
Identification of other serum factors involved in IGFBP7-mediated rosetting using lab-adapted P. falciparum.
(A) Rosetting rates in filtered human serum (HS) were lower than those of complete HS (one-way ANOVA with Tukey’s test: p=0.0368; n = 5). IGFBP7 stimulated rosetting in HS-supplied environment (p=0.0276). IGFBP7 did not alter rosetting in filtered HS (p=0.0664). (B) IGFBP7 stimulated rosetting (p=0.0002; n = 8), whereas anti-VWF IgG did not significantly alter rosetting (p=0.3039). No significant changes were found in ‘anti-VWF IgG+IGFBP7’ (p=0.9096). (C) In 20% HS-enriched medium (20% HSM), ‘IGFBP7 and IGFBP7+VWF’ showed higher rosetting than the control (one-way ANOVA with Tukey’s test: p=0.003 for both comparisons; n = 8). VWF did not alter rosetting (p=0.8652). No significant difference was found between ‘IGFBP7’ and ‘IGFBP7+VWF’ (p=0.7853). Rosetting in ‘IGFBP7’ was higher than in ‘VWF’ (p<0.0001). In 2% HSM, ‘IGFBP7’ (p=0.1832) and ‘VWF’ (p=0.9876) did not significantly alter rosetting. Rosetting in ‘IGFBP7+VWF’ was increased (p=0.0014), and was higher than ‘IGFBP7’ and ‘VWF’ (p=0.0030 for both comparisons). No significant difference was found between ‘VWF+IGFBP7’ from both serum settings (p=0.2861). (D) Rosetting (n = 7) in 0.25% Albumax-enriched medium (Alb) supplied with 100 ng/ml IGFBP7 and different concentrations of VWF. No significant difference was found across the VWF concentrations tested (one-way ANOVA with Dunnett’s test: p>0.3 for all comparisons with ‘VWF-free’). (E) In 20% HSM, there was no significant difference between control and ‘anti-TSP-1’ (one-way ANOVA with Tukey’s test: p=0.9961, n = 8). A significant difference was recorded between control and ‘IGFBP7’ (p<0.0001), but not between control and ‘anti-TSP-1 + IGFBP7’ (p=0.9125). A significant difference was found in ‘anti-TSP-1’ vs. ‘IGFBP7’ (p<0.0001), and ‘IGFBP7’ vs. ‘IGFBP7 + anti-TSP-1’ (p=0.0022). (F) Rosetting (n = 8) in Alb was lower than in 20% HSM (p=0.0047). In HSM, IGFBP7 increased rosetting (p=0.0097). No significant changes were seen in comparisons of Alb-control with: IGFBP7 (p=0.7499), VWF (p>0.9999), TSP-1 10 ng/ml (p>0.9999), TSP-1 500 ng/ml (p=0.9491), IGFBP7 + TSP-1 10 ng/ml (p>0.9999), and IGFBP7 + TSP-1 500 ng/ml (p=0.9341). Rosette-stimulation was noted in ‘IGFBP7 + VWF + TSP-1 10 ng/ml’ (p=0.0002) and ‘IGFBP7 + VWF + TSP-1 500 ng/ml’ (p<0.0001). No significant difference was noted between ‘IGFBP7 + VWF + TSP-1 10 ng/ml’ and ‘IGFBP7 + VWF + TSP-1 500 ng/ml’ (p=0.9998), and ‘IGFBP7 + VWF + TSP-1 10 ng/ml’ vs. ‘20%HSM + IGFBP7’ (p>0.9999). ‘IGFBP7 + VWF + TSP-1 500 ng/ml’ was not significantly different from ‘HSM + IGFBP7’ (p=0.9997). (G) In 0.25% Alb supplied with 100 ng/ml IGFBP7, 10 ng/ml TSP-1 and 0.125 IU/ml VWF, rosette-stimulation was noted, as compared to a VWF-free group (one-way ANOVA with Tukey’s test: p=0.0421, n = 8). Rosetting increased with VWF concentrations (p<0.0001 for 0.5 and 2.0 IU/ml compared to VWF-free). No significant difference was seen in rosetting rates between VWF of 0.5 IU/ml and 2.0 IU/ml (p=0.2126).
Figure 7—figure supplement 1
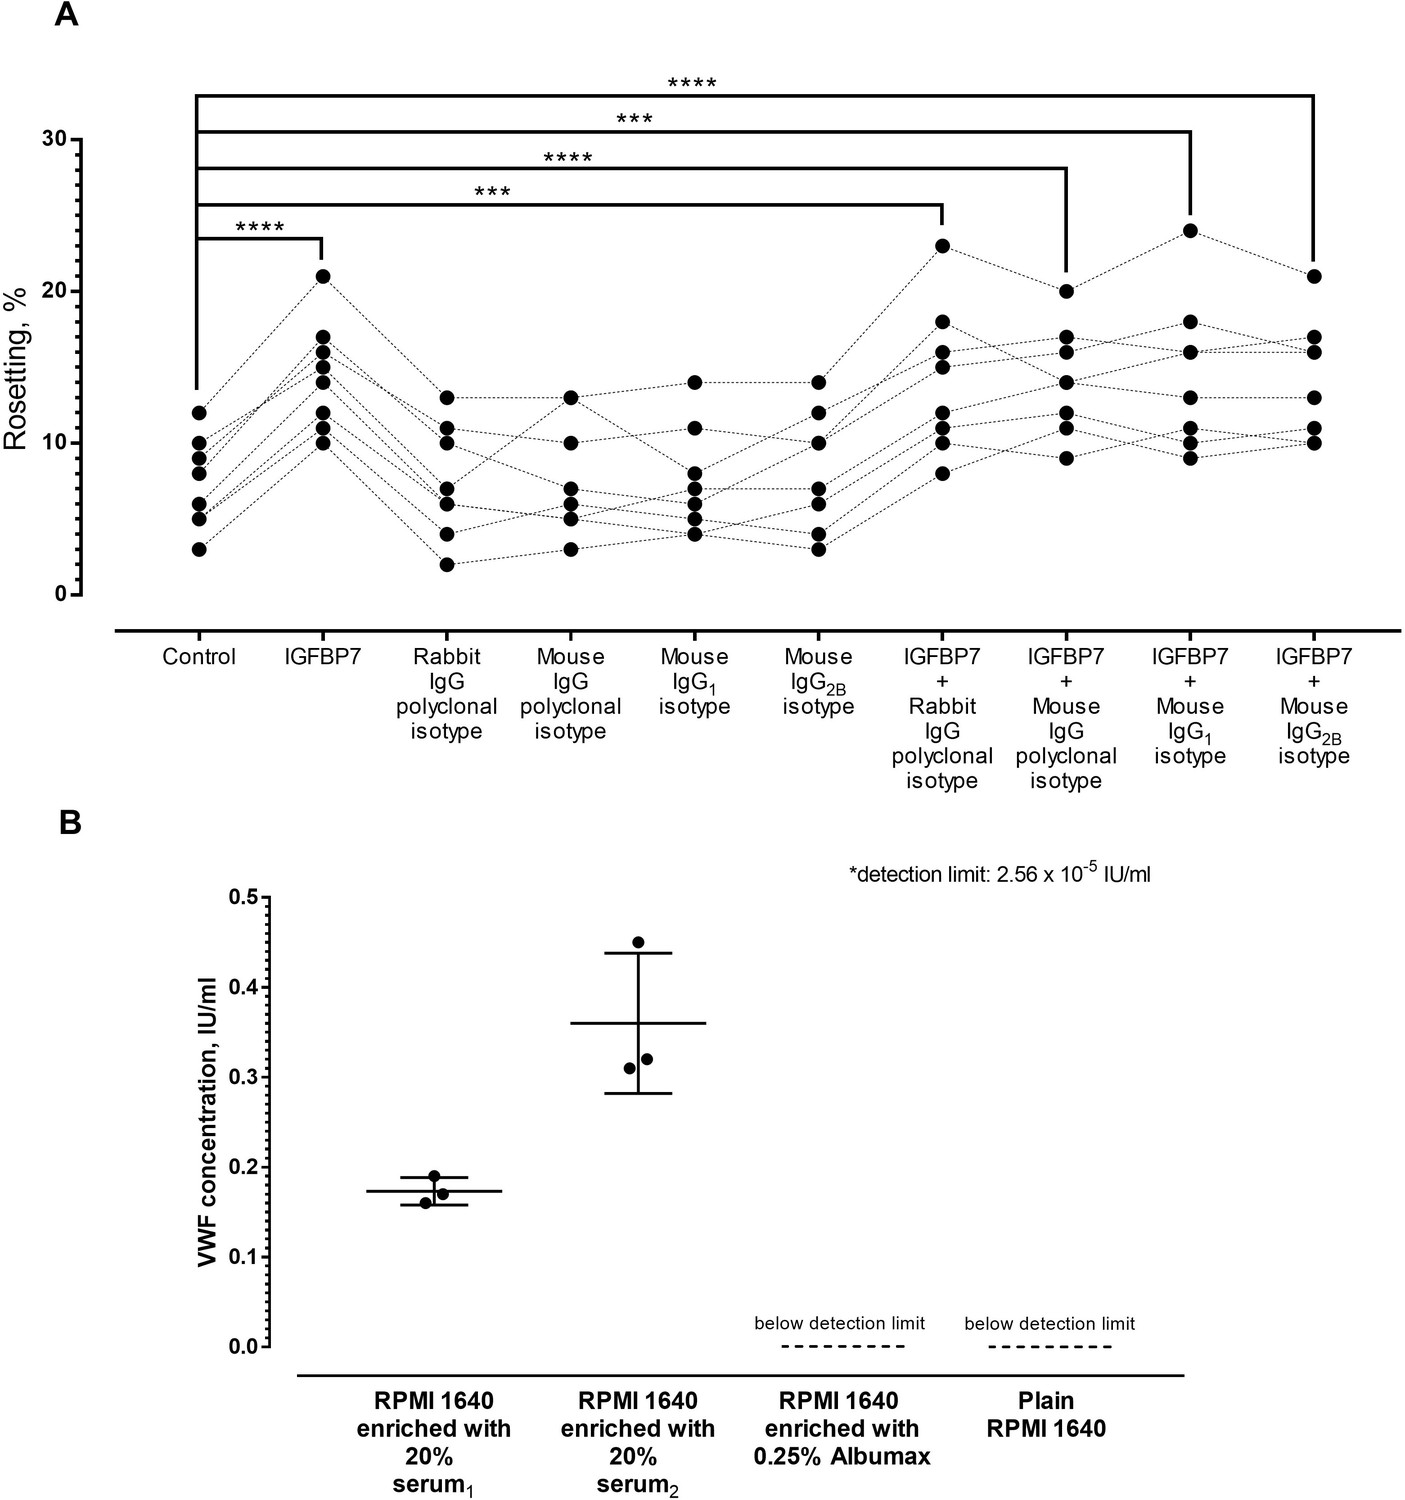
Control experiments.
(A) Rosetting of P. falciparum lines (n = 8) under different conditions. One-way ANOVA with Tukey’s test was conducted. IGFBP7 stimulated rosetting (p<0.0001). No significant difference was found between the control and rabbit IgG polyclonal isotype (p>0.9999), mouse IgG polyclonal isotype (p=0.9721), mouse IgG1 isotype (p>0.9999), and mouse IgG2B isotype (p=0.3379). The rosette-stimulatory effect by IGFBP7 was not hampered by these antibody isotypes when compared with the rosetting from the control group (p=0.0007 for IGFBP7+ rabbit IgG polyclonal isotype; p<0.0001 for IGFBP7 + mouse IgG polyclonal isotype, p=0.001 for IGFBP7 + mouse IgG1 isotype, and p<0.0001 for IGFBP7 + mouse IgG2B isotype). (B) Quantitation of VWF in media used in this study. Media enriched with human AB sera from two major sources for our research, Albumax II and plain medium control were recruited for ELISA (triplicates done on each group, mean and SD shown). Media enriched with serum1 showed a VWF level of 0.1733 IU/ml (SD 0.0153), whereas media enriched with serum2 had 0.36 IU/ml (SD 0.0781) VWF. VWF levels of Albumax II-enriched medium and plain medium were below detection limit of the ELISA system used.
Figure 8 with 2 supplements
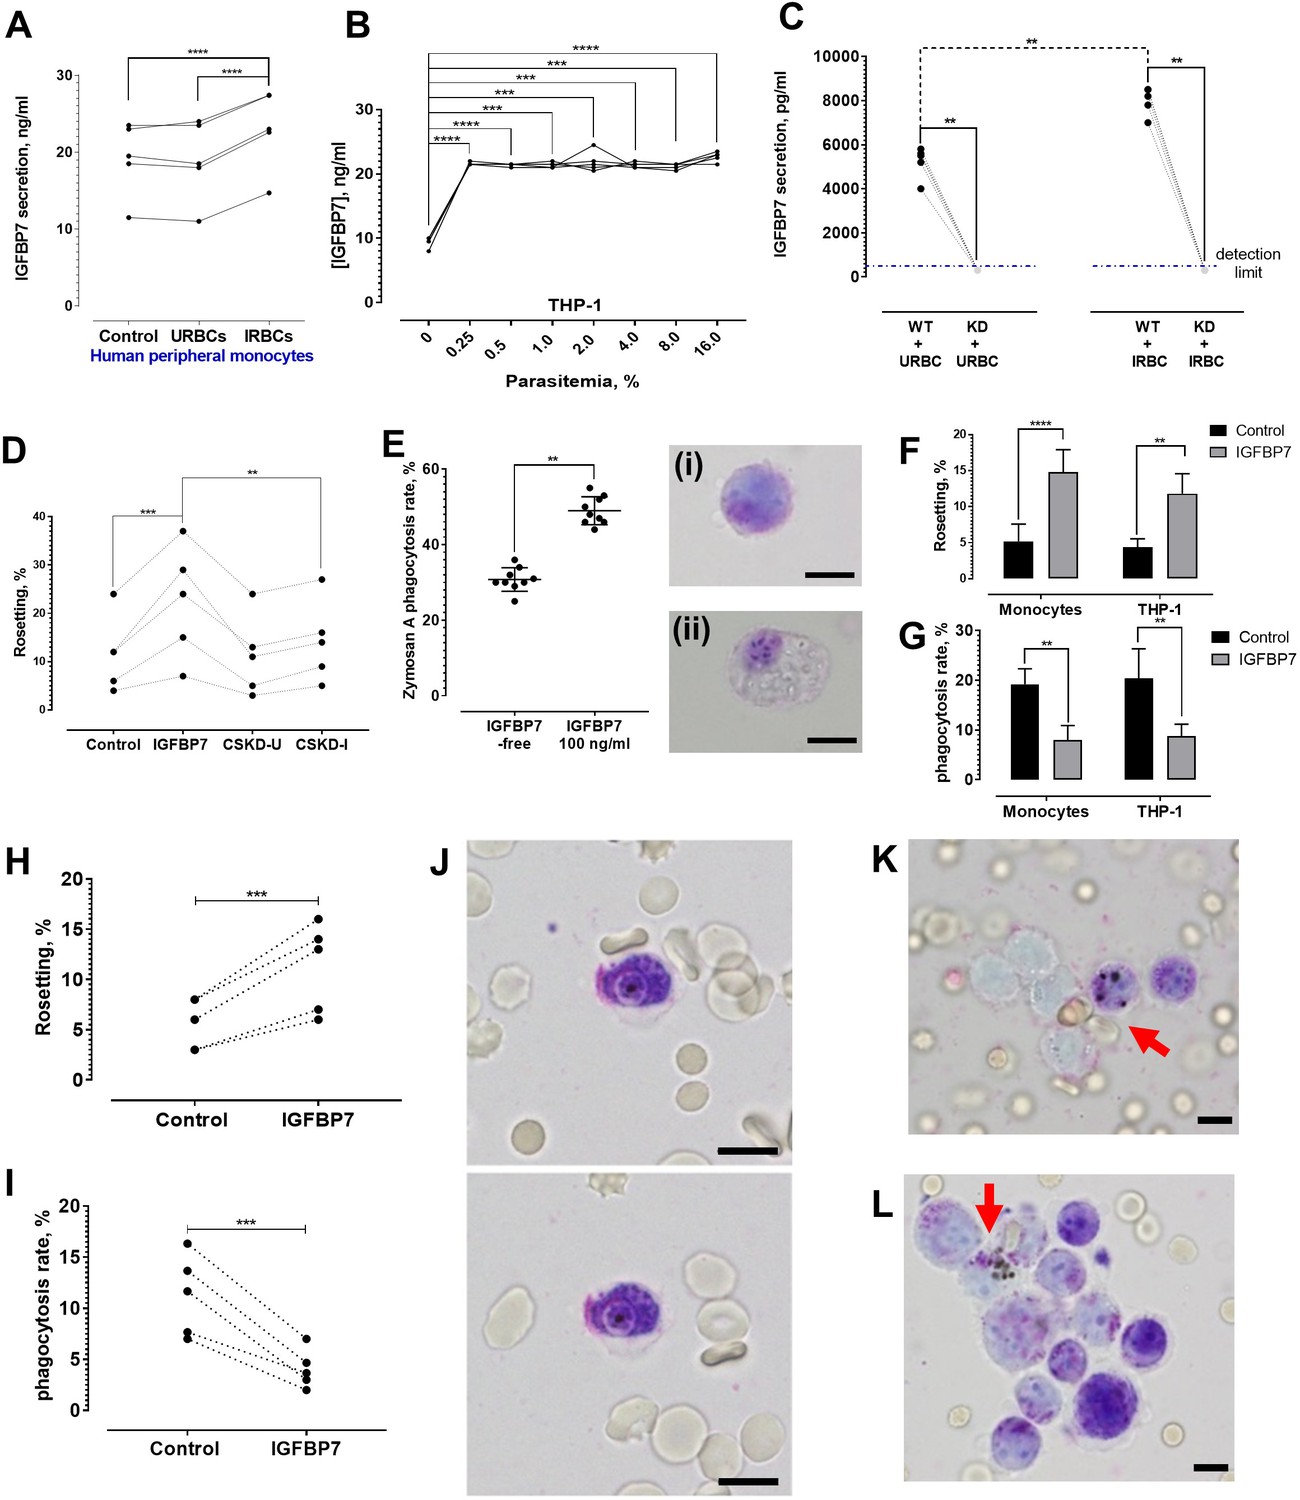
IGFBP7 secretion upon parasite exposure and phagocytosis assessment.
(A) Parasite (lab-adapted P. falciparum strain 3D7) exposure increased IGFBP7 secretions by human peripheral monocytes (from five donors) [paired t-test control vs. IRBC: p<0.0001; URBC vs. IRBC: p<0.0001]. (B) Secretion of IGFBP7 by THP-1 upon exposure to different parasite lines (n = 5) at different parasite density. Parasite exposure yielded significantly higher readings than the parasite-free control (one-way ANOVA with Dunnett’s test: p=0.0001). (C) IGFBP7 secretion by WT_THP-1 (WT) and IGFBP7-KD_THP1 (KD) exposed to URBC and IRBC for 18 h. The blue dotted line shows the detection limit (400 pg/ml). For control groups (incubated with URBC), WT showed significantly higher IGFBP7 secretion than the KD (Mann-Whitney test: p=0.0079, n = 5). For the IRBC-exposed groups, WT also showed significantly higher IGFBP7 secretion than the KD (p=0.0079, n = 5). IGFBP7 secretion by WT post-IRBC exposure was significantly higher than its control (p=0.0079, n = 5). No significant difference was found in IGFBP7 secretion in the KD between the IRBC-exposed and control settings (p>0.9999, n = 5). (D) A significant difference in rosetting (n = 5) was found: control vs. IGFBP7 (one-way ANOVA with Tukey’s test: p=0.0001), and IGFBP7 vs. CSKD-I (p=0.0014). No significant difference was found: control vs. CSKD-U (p=0.9944), control vs. CSKD-I (p=0.4118), and CSKD-U vs. CSKD-I (p=0.2977). (E) A control experiment (n = 9) to assess effect of IGFBP7 on phagocytosis ability of THP-1 using zymosan A, with insets showing THP-1 before (i) and after (ii) engulfing zymosan A, in Giemsa-wet mount, 1000× magnification; scale bars: 10 µm. IGFBP7 enhanced phagocytosis of THP-1 (Wilcoxon matched pair-signed rank test p=0.0039). (F) Rosetting rates of Pf co-incubated with monocytes and THP-1 under IGFBP7-free and IGFBP7-supplied conditions (means and SD of quintuplicates shown). From two-way ANOVA with Sidak’s multiple comparison test, IGFBP7 increased rosetting rates (p<0.0001 and p=0.0013 for monocyte and THP-1, respectively). No significant difference was found between the controls (IGFBP7-free) (p=0.9968), as well as between the IGFBP7-supplied conditions of the two groups (p=0.3465). (G) IRBC-phagocytosis rates of monocytes and THP-1 under IGFBP7-free and IGFBP7-supplied conditions (means and SD of quintuplicates shown). From two-way ANOVA with Sidak’s multiple comparison test, phagocytosis rates were lower in the IGFBP7-supplied group (p=0.0015 and 0.0011 for monocyte and THP1, respectively). No significant difference was found between the controls (IGFBP7-free) (p=0.9595), as well as between the IGFBP7-supplied conditions of the two groups (p=0.9873). (H, I) IGFBP7-exposure affects laboratory-adapted pf IRBC rosetting (n = 5) (paired t-test p=0.0001, t = 14.88, df = 4) (H) and phagocytosis (paired t-test p=0.0009, t = 8.98, df = 4) (I). (J) Engulfment of a non-rosette-forming IRBC by a peripheral monocyte. Pictures taken 10 s apart. (K, L) Phagocytosis (arrow) of rosettes, in Giemsa-wet mount, 1000× magnification, using an Olympus BX43 light microscope with built-in camera; scale bars: 10 µm.
-
Figure 8—source data 1
Raw data (rosetting rates, %) for the data set presented in bar graph (8F).
R = biological replicate (same parasite, but different batches of cultures grown with different batches of URBCs).
- https://cdn.elifesciences.org/articles/51546/elife-51546-fig8-data1-v2.docx
-
Figure 8—source data 2
Raw data (phagocytosis rates, %) for the data set presented in bar graph (8G).
R = biological replicate (same parasite, but different batches of cultures grown with different batches of URBCs).
- https://cdn.elifesciences.org/articles/51546/elife-51546-fig8-data2-v2.docx
Figure 8—figure supplement 1
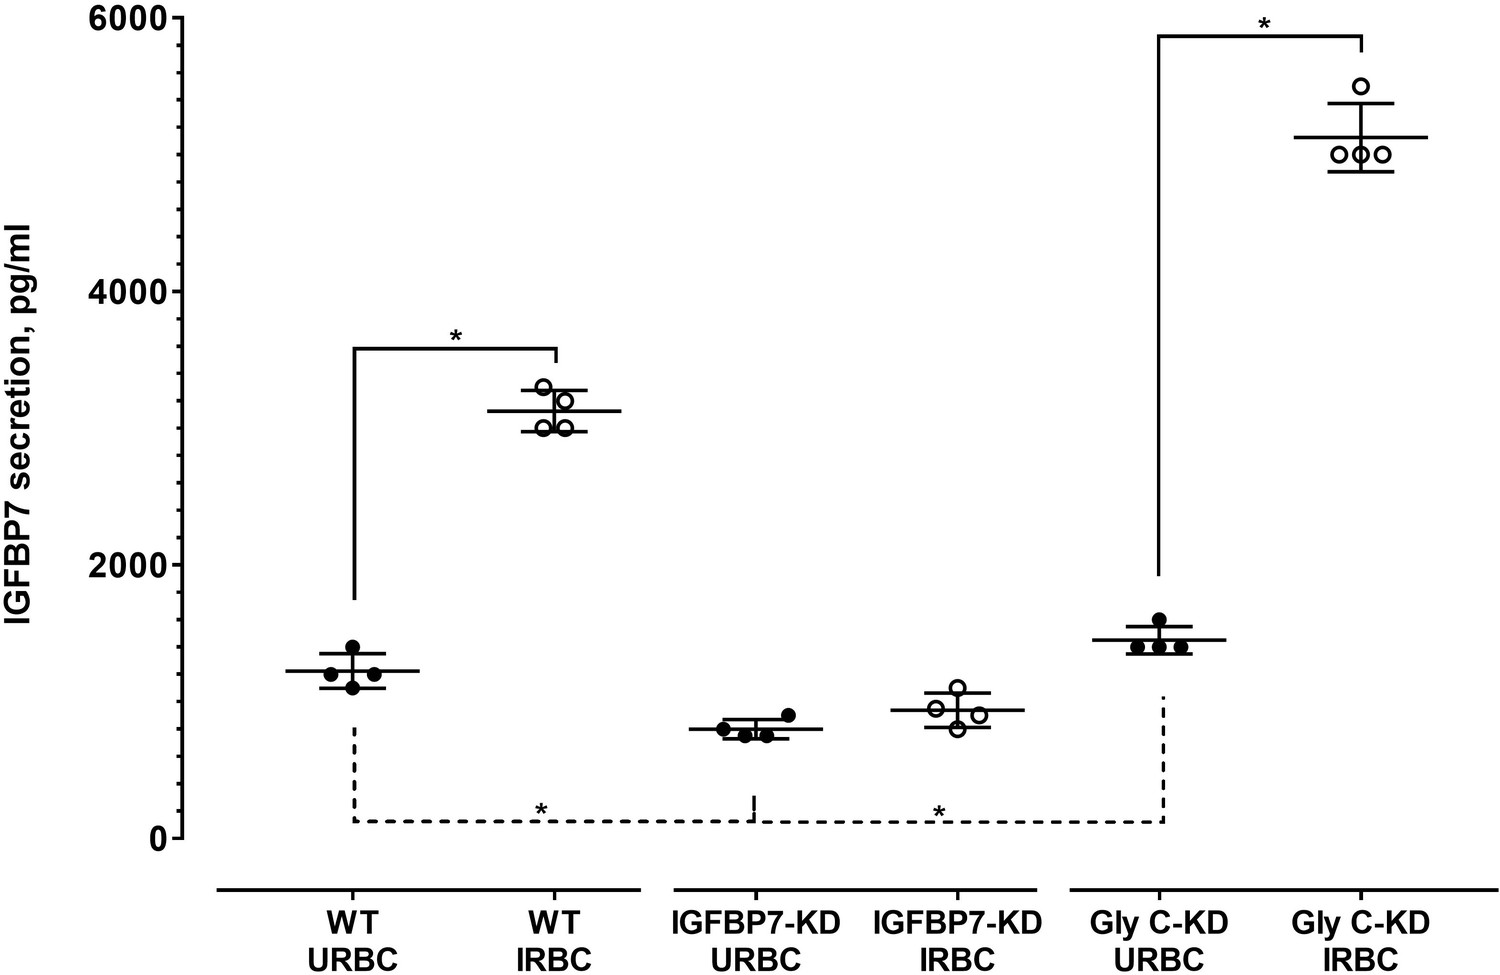
IGFBP7 secretion by THP-1 of different transduction status.
Levels of secreted IGFBP7 by THP-1 (1 × 10⁴ cells) of different transduction status 18 h post-incubation with either URBC or P. falciparum 3D7 IRBC. The Mann-Whitney test was used to compare changes between the same cell types, whereas the Kruskal-Wallis test was used for cross-cell type-group comparison. THP-1-WT and GlyC-KD THP-1 showed higher IGFBP7 secretion after IRBC exposure, relative to their URBC-exposed counterparts (p=0.0286 for both groups). IGFBP7-KD THP-1 did not show any significant difference in their IGFBP7 secretion between the URBC-exposed and IRBC-exposed groups (p=0.1429). Among cells exposed to URBC (controls), IGFBP7-KD THP-1 recorded lower values than WT (p=0.0286) and GlyC-KD (p=0.0022). No significant difference was found between WT_URBC and GlyC-KD_URBC (p=0.1928).
Figure 8—figure supplement 2
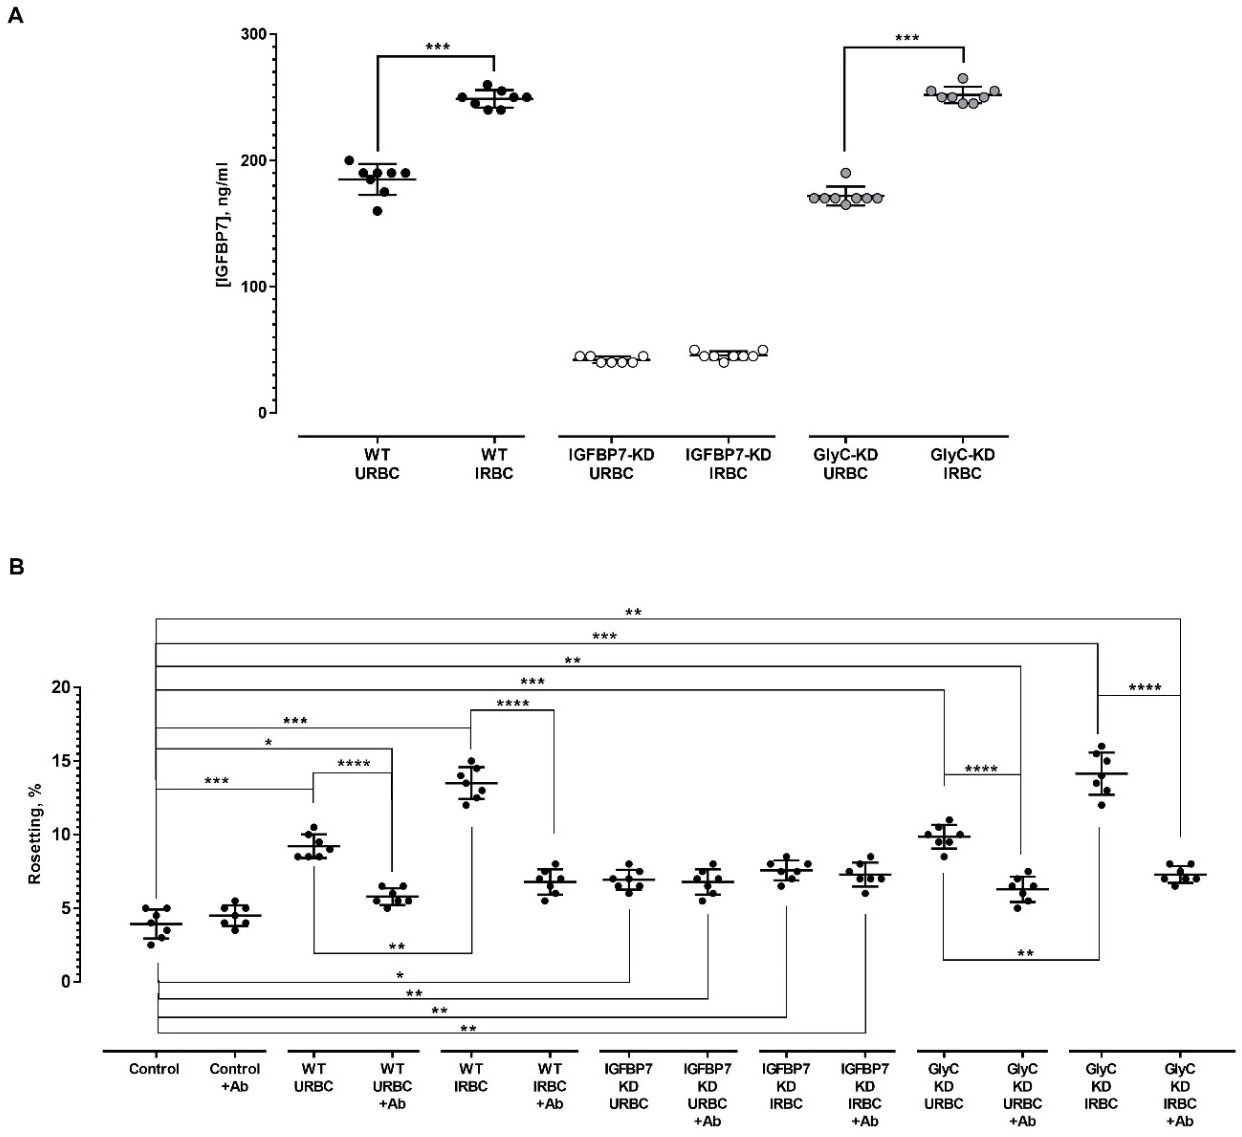
THP-1-derived IGFBP7 and its effect on rosette-stimulation.
(A) IGFBP7 secretion level of THP-1 cells of different gene knockdown (KD) status (cell numbers = 3×10⁶). The Mann-Whitney test was used to compare the difference in IGFBP7 secretion levels between URBC- and IRBC-exposed settings for each cell type. For the non-transduced wild type (WT), the IRBC-exposed group secreted more IGFBP7 than their URBC-exposed counterpart (control) (p=0.0002). For the IGFBP7-KD group, exposure to IRBC did not significantly alter the IGFBP7 secretion by the cells, compared to those exposed to URBC (p=0.0678). For the GlyC-KD group, exposure to IRBC also significantly increased the IGFBP7 secretion level by the cells (p=0.0002). A Kruskal-Wallis test was also performed for cross-group comparison. There was no significant difference in level of IGFBP7 secretion between the URBC-exposed WT and GlyC-KD groups (p=0.0624), as well as between IRBC-exposed WT and GlyC-KD groups (p>0.9999). (B) Rosetting challenge assay using culture supernatant of the THP-1 cells (equivalent to that of 1 × 10⁶ cells) with different gene knockdown status. Within each of the seven groups of experimental settings, Welch’s unpaired t-test was conducted to compare the effect of anti-IGFBP7 on rosetting rates. The antibody did not exert significant alteration to the rosetting rates in groups control (exposed to 1XPBS) (p=0.2358), IGFBP7-KD_URBC (p=0.7354), and IGFBP7-KD_IRBC (p=0.4867). The antibody significantly reduced rosetting in groups WT_URBC (p<0.0001), WT_IRBC (p<0.0001), GlyC-KD_URBC (p<0.0001), and GlyC-KD_IRBC (p<0.0001). Cross-group comparison was performed using one-Way ANOVA with Tukey’s test. Relative to the control, higher rosetting rates were recorded in WT_URBC (p=0.0004), WT_URBC+Ab (p=0.0409), WT_IRBC (p=0.0001), IGFBP7-KD_URBC (p=0.0105), IGFBP7-KD_URBC+Ab (p=0.0074), IGFBP7-KD_IRBC (p=0.0016), IGFBP7-KD_IRBC+Ab (p=0.0088), GlyC-KD_URBC (p=0.0007), GlyC-KD_URBC+ Ab (p=0.0038), GlyC-KD_IRBC (p=0.0003), and GlyC-KD_IRBC+Ab (p=0.0047), but not in group WT-IRBC+Ab (p=0.0709).
Figure 9
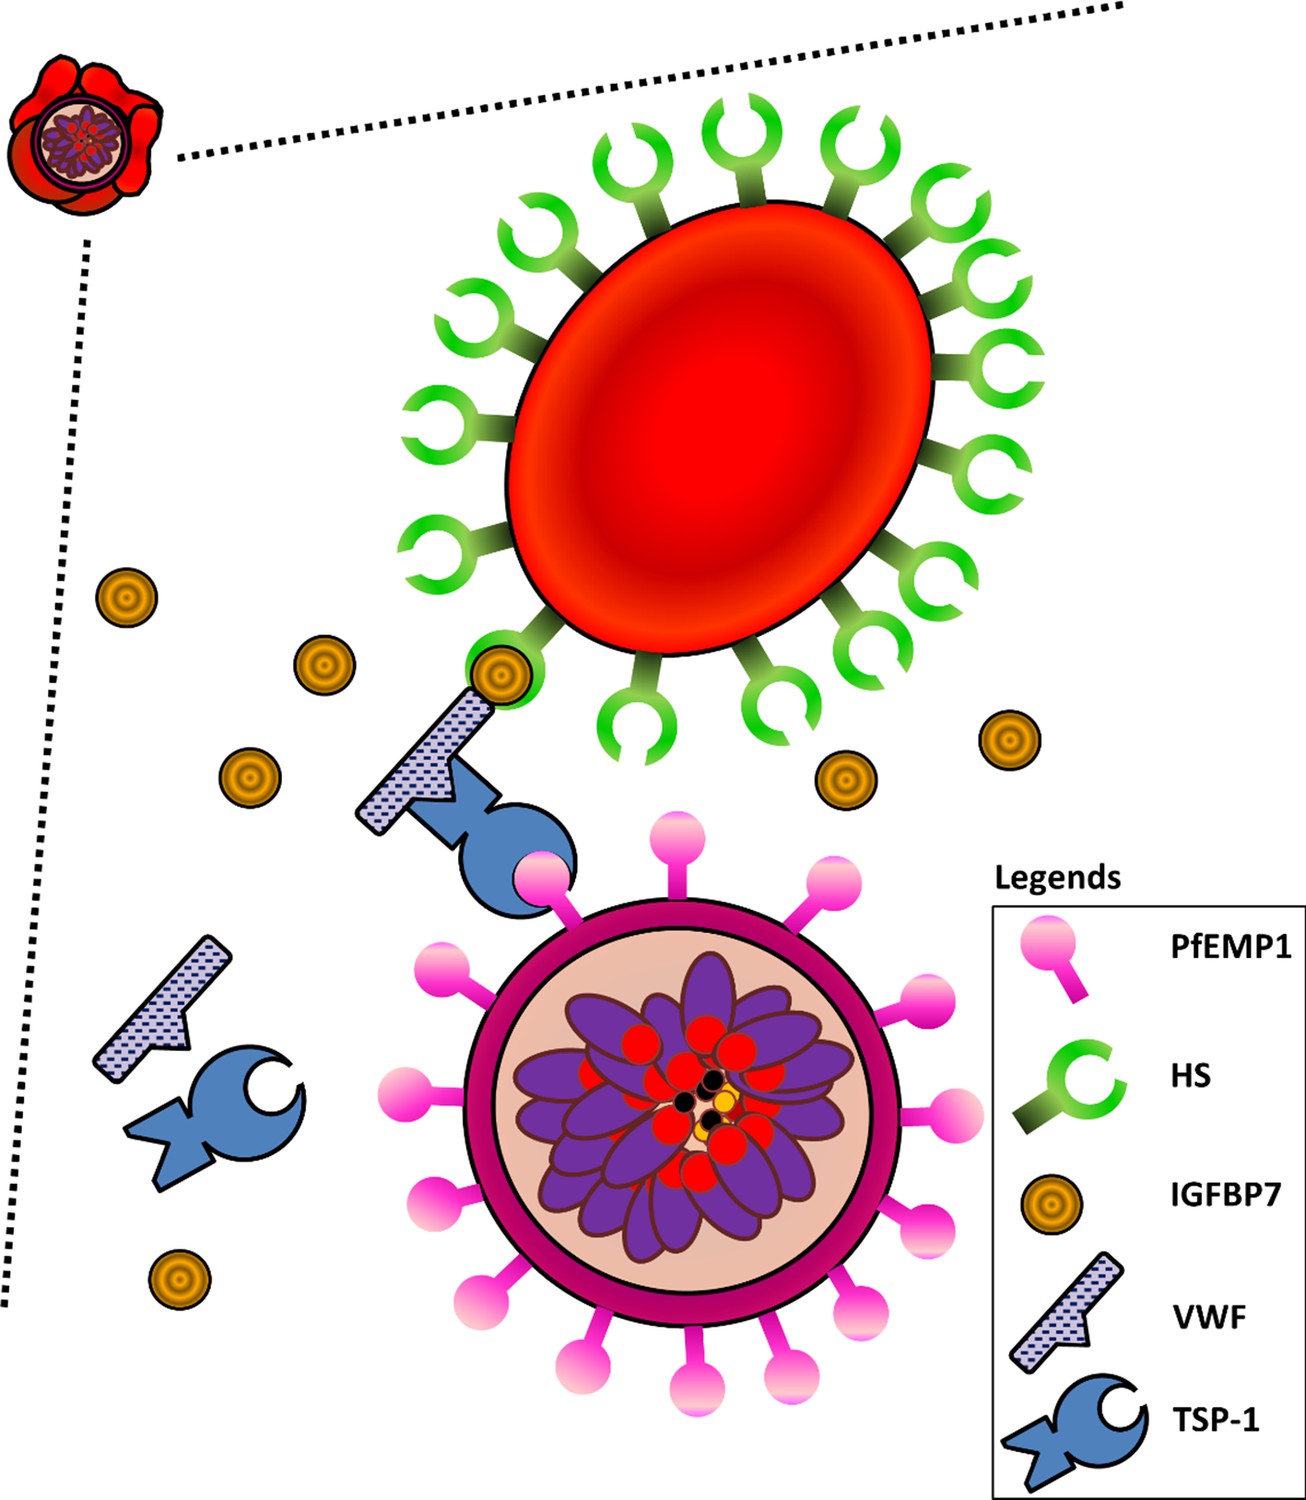
Schematic diagram illustrating interactions of HS on URBCs, IGFBP7, VWF, TSP-1, and PfEMP1 on IRBCs.
IGFBP7 binds to HS on the surface of URBCs. IGFBP7 also interacts with VWF. VWF can interact with PfEMP1 on the IRBC via TSP1. Without sufficient amounts of all components involved in the system, this IGFBP7-mediated rosetting will not occur.
Author response image 1

Additional files
-
Supplementary file 1
Key resources table.
- https://cdn.elifesciences.org/articles/51546/elife-51546-supp1-v2.docx
-
Supplementary file 2
694 components yielded from mass spectrometry on the aqueous fraction (molecular size ≤30 kDa) of CSMT.
- https://cdn.elifesciences.org/articles/51546/elife-51546-supp2-v2.xlsx
-
Supplementary file 3
Shortlisted candidates from a list of 694 compounds identified by mass spectrometry.
- https://cdn.elifesciences.org/articles/51546/elife-51546-supp3-v2.docx
-
Supplementary file 4
Recruited P. falciparum clinical isolates from the Thai-Burmese Border.
- https://cdn.elifesciences.org/articles/51546/elife-51546-supp4-v2.docx
-
Supplementary file 5
Recruited P. vivax clinical isolates from the Thai-Burmese Border.
- https://cdn.elifesciences.org/articles/51546/elife-51546-supp5-v2.docx
-
Supplementary file 6
Experiment flow.
Flow chart showing the experiments done in the project, along with the number of samples recruited for each experiment.
- https://cdn.elifesciences.org/articles/51546/elife-51546-supp6-v2.docx
-
Supplementary file 7
Method comparison for rosetting assay.
(A) Plot of rosetting rates obtained from recruited P. falciparum lines (n = 5) using different wet mount methods, with insets underneath the x-axis showing rosettes visualized by respective methods [immersion oil (1000×) magnification, scale bars represent 10 µm]. Pictures of unstained and Giemsa-wet mounts were taken using a light microscope Olympus BX43, whereas pictures of the acridine orange-wet mount were taken on an epifluorescence microscope Nikon TS100. One-way ANOVA with Tukey’s test: unstained vs. Giemsa: p=0.9517. Acridine orange vs. unstained p>0.9999. Acridine orange vs. Giemsa: p=0.9809. (B) Changes of rosetting rates by IGFBP7 collected using different rosetting assays. Dotted lines were used to show read ups collected from different methods on the same sample. Dataset Giemsa did not pass normality test (Shapiro-Wilk normality test). Friedman with Dunn’s test: unstained vs. Giemsa: p=0.3415; unstained vs. acridine orange: p=0.6177; Giemsa vs. acridine orange: p>0.9999, that is there was no significant difference between the methods used. n.s. not significant.
- https://cdn.elifesciences.org/articles/51546/elife-51546-supp7-v2.docx
-
Supplementary file 8
Profiling of THP-1 cell population prior to green fluorescent protein (GFP)-based sorting post-shRNA transduction.
This is the profile of THP-1_WT as GFP-free control for cell sorting.
- https://cdn.elifesciences.org/articles/51546/elife-51546-supp8-v2.docx
-
Supplementary file 9
Profiling of IGFBP-KD THP-1 cell population prior to green fluorescent protein (GFP)-based sorting post-shRNA transduction.
- https://cdn.elifesciences.org/articles/51546/elife-51546-supp9-v2.docx
-
Supplementary file 10
Profiling of GlyC-KD THP-1 cell population prior to green fluorescent protein (GFP)-based sorting post-shRNA transduction.
- https://cdn.elifesciences.org/articles/51546/elife-51546-supp10-v2.docx
-
Transparent reporting form
- https://cdn.elifesciences.org/articles/51546/elife-51546-transrepform-v2.docx
Download links
A two-part list of links to download the article, or parts of the article, in various formats.
Downloads (link to download the article as PDF)
Open citations (links to open the citations from this article in various online reference manager services)
Cite this article (links to download the citations from this article in formats compatible with various reference manager tools)
Plasmodium-infected erythrocytes induce secretion of IGFBP7 to form type II rosettes and escape phagocytosis
eLife 9:e51546.
https://doi.org/10.7554/eLife.51546


