Mitochondrial fusion is required for spermatogonial differentiation and meiosis
- California Institute of Technology, United States
Figures
Figure 1 with 3 supplements
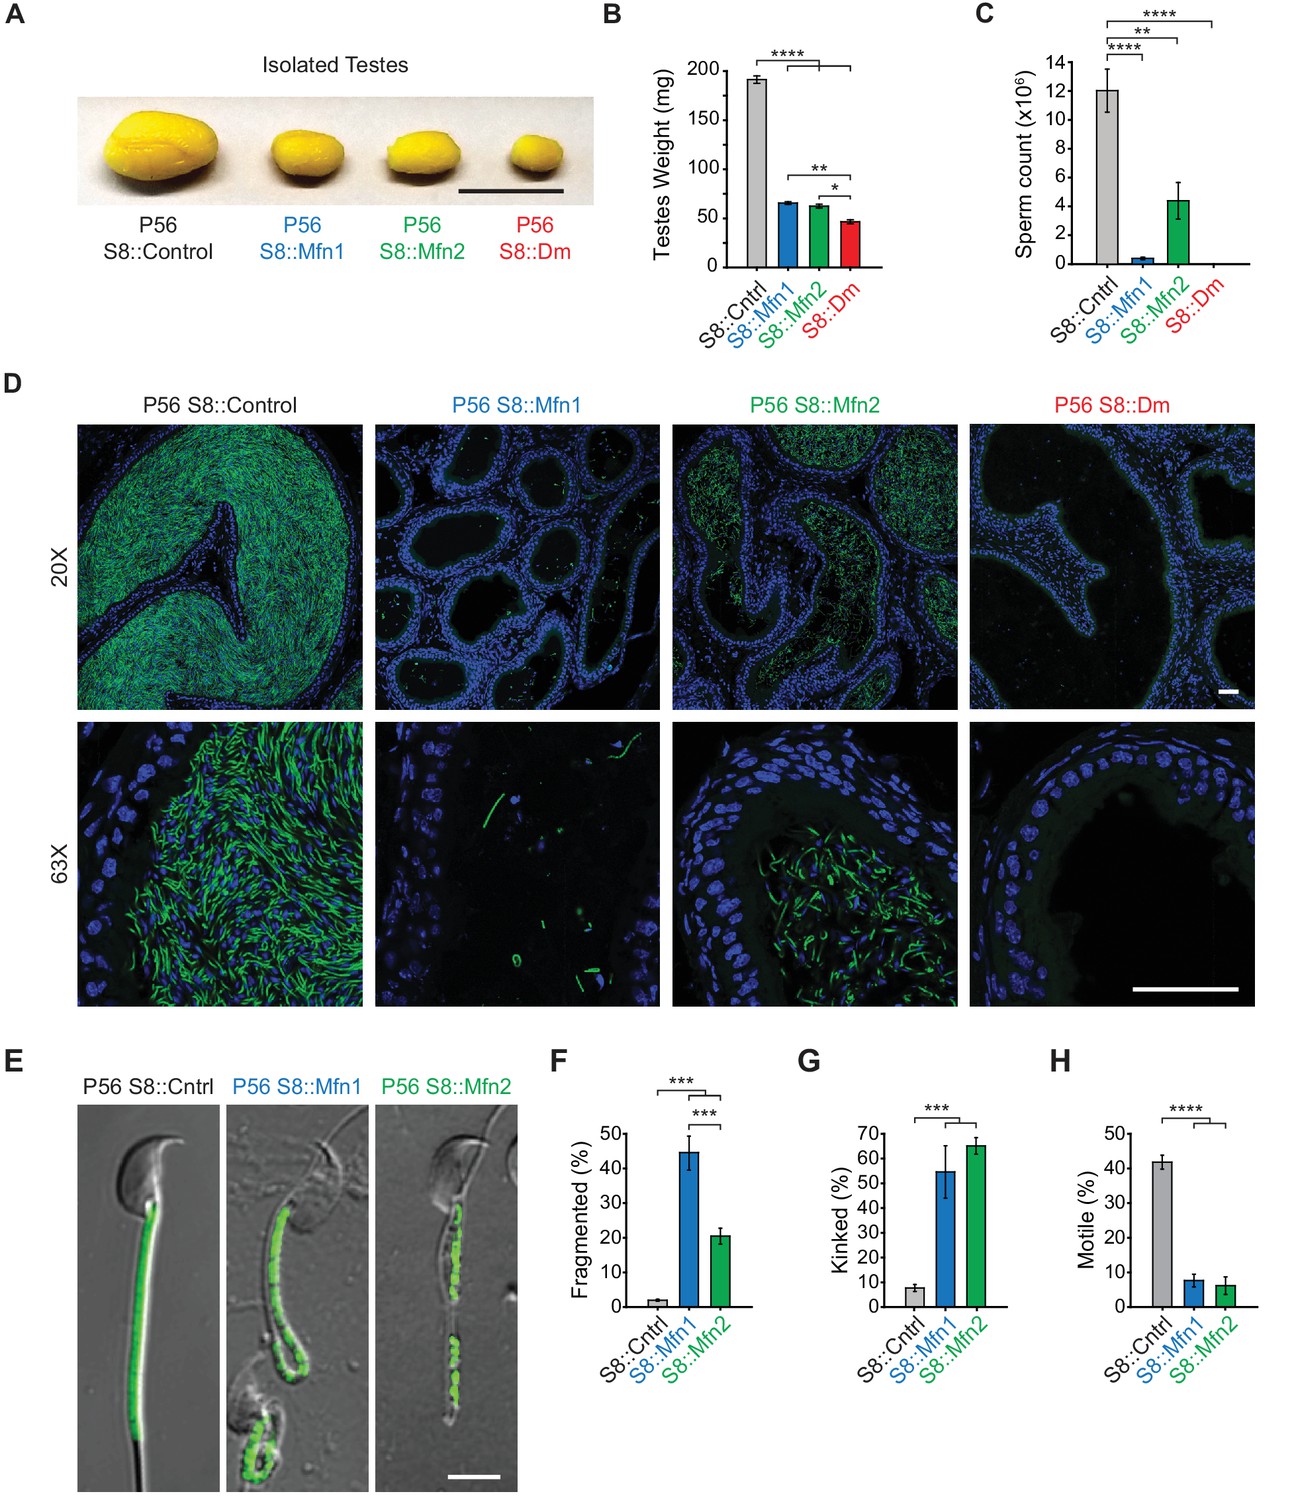
Mitofusins are essential for mammalian spermatogenesis.
(A) Comparison of testicular size in mice of the indicated genotype. Tissues have been fixed with Bouin’s solution, which gives them the yellow appearance. Scale bar, 0.5 cm. (B) Testes weight measurements from adult P56 mice. Both organs were used. N ≥ 7. (C) Epididymal sperm count. Note that S8::Dm mice do not produce any sperm. N ≥ 6. (D) Histological analysis of sperm in cauda epididymis sections. Mature sperm are identified by the rod-like mito-Dendra2 (Dn) signal (green) in the midpiece. Nuclei are labeled with DAPI (blue). Scale bars, 50 µm. (E) Morphological comparison of isolated caudal spermatozoa. Mitochondria are labeled with mito-Dendra2. Note that mutant sperm have patchy, fragmented mitochondria and sharp kinking near or in the midpiece. Scale bar, 5 µm. (F–H) Quantification of mitochondrial morphology (F), sperm morphology (G), and motility (H). N ≥ 3. For more information on motility, see Videos 1–3. All data are from adult P56 mice. Data are represented as mean ± SEM. ****p≤0.0001; ***p≤0.001; **p≤0.01; *p≤0.05. For statistical tests used, see Material and Methods section.
Figure 1—figure supplement 1
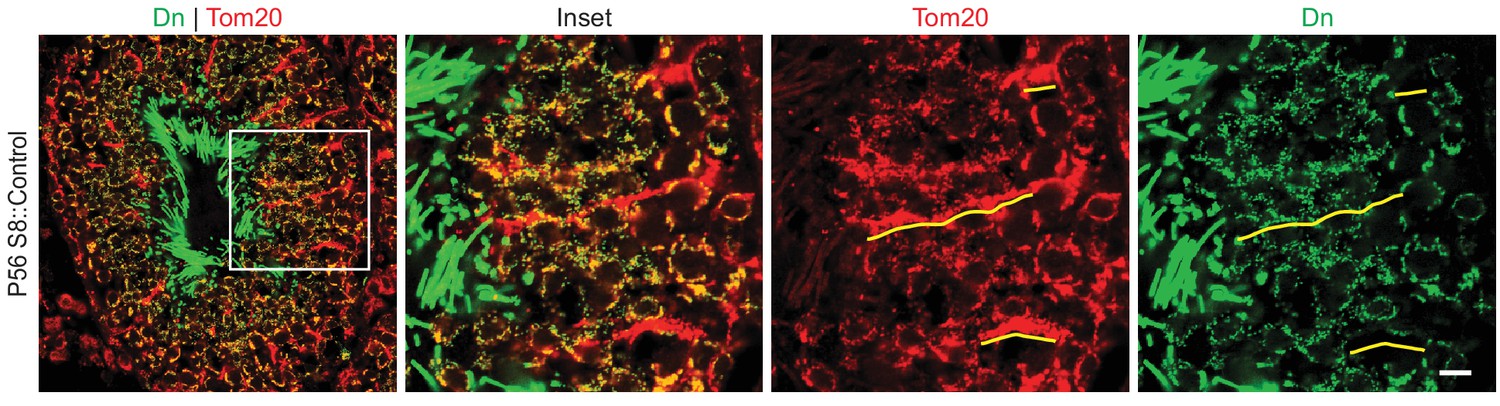
mito-Dendra2 (Dn) expression in testis sections.
Note that the classical Sertoli cell projections contain Tom20 (a marker of the mitochondrial outer membrane), but not the germ cell-specific mito-Dendra2. Some of these projections are underlined in yellow. Scale bar, 20 µm.
Figure 1—figure supplement 2
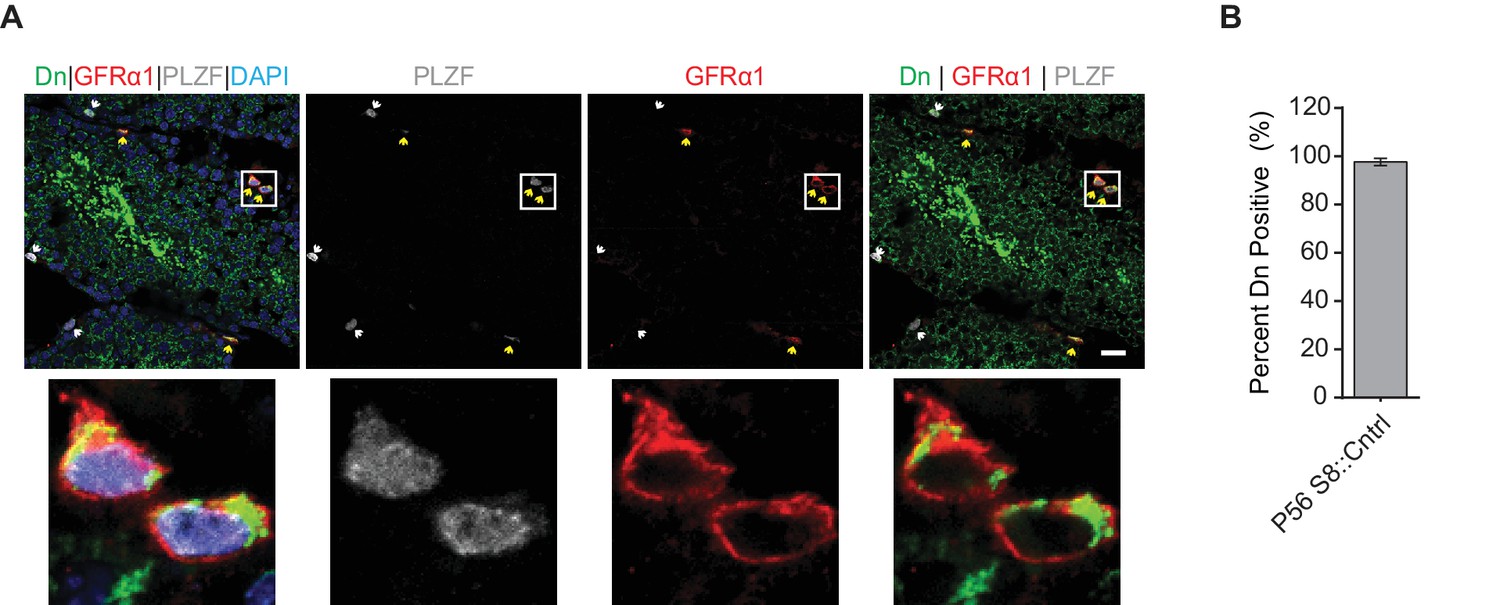
Stra8-Cre is expressed in GFRα1-expressing spermatogonia.
(A) Cre activity in undifferentiated spermatogonia.Mitochondria are labeled with mito-Dendra2 (Dn) (green); total undifferentiated spermatogonia are labeled with an antibody against PLZF (white); stem-like spermatogonia are labeled with an antibody against GFRα1 (red); and nuclei are labeled with DAPI (blue). The mito-Dendra2 allele requires Stra8-Cre-mediated excision for expression. Scale bar, 20 µm. (B) Quantitation of Stra8-Cre/Dn expression in GFRα1 stem-like spermatogonia from testis sections. N = 3. A total of 150 cells were counted. Data are represented as mean ± SEM. For statistical tests used, see the Materials and methods section.
Figure 1—figure supplement 3
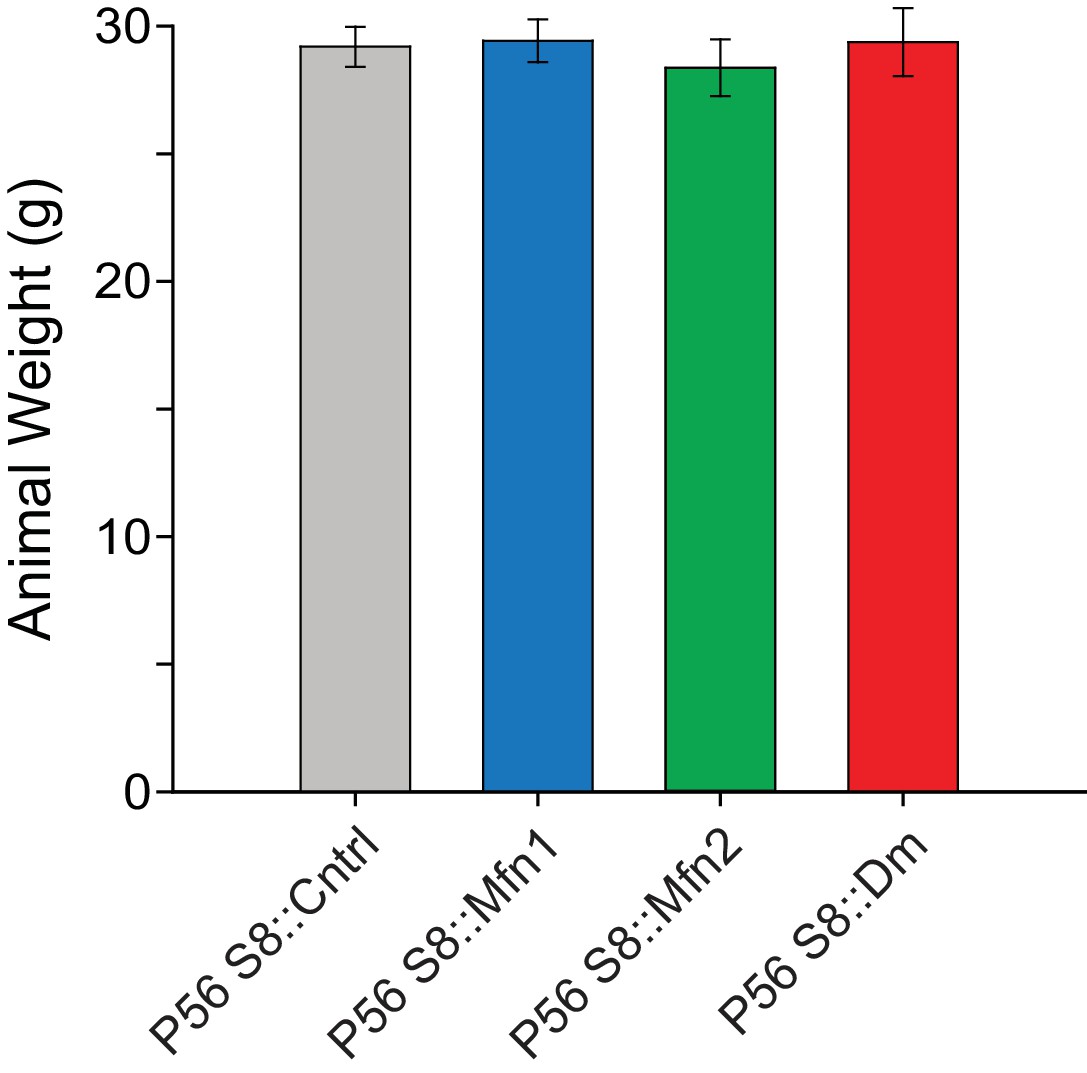
Quantification of animal weight from the indicated mouse lines.
N ≥ 7. All data are from P56 mice. Data are represented as mean ± SEM. For statistical tests used, see the Materials and methods section.
Figure 2 with 2 supplements
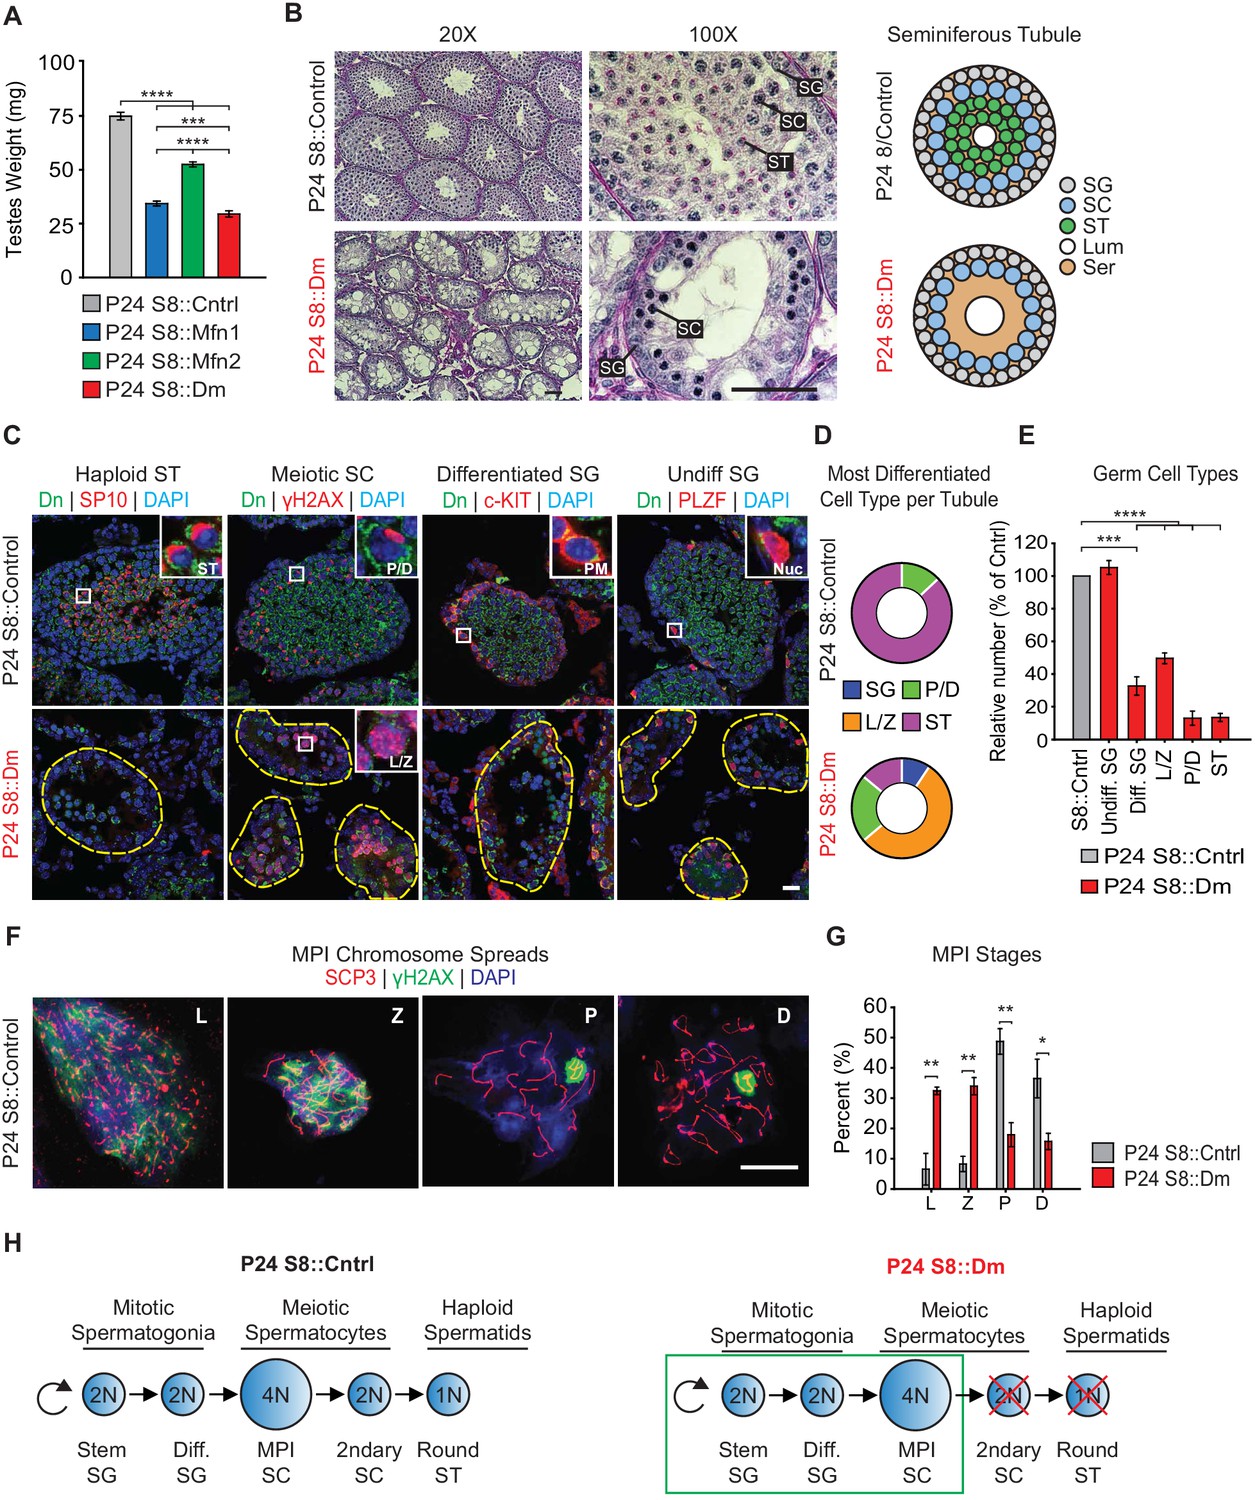
Mitofusins are required for meiosis.
(A) Testes weight measurements from juvenile P24 mice. N ≥ 3. (B) Periodic Acid-Schiff (PAS) histology testis sections. Note the absence of post-meiotic spermatids in S8::Dm tubules. Scale bars, 50 µm. On the right are stylized depictions of the 100X panels. SG, spermatogonium; SC, spermatocyte; ST, spermatid, Lum, lumen; Ser, Sertoli cell cytoplasm. (C) Analysis of the major germ cell types in WT and mutant testis sections. For clarity, the borders of mutant seminiferous tubules are outlined by dashed lines. The markers used are indicated. Scale bar, 20 µm. Dn, mito-Dendra2. (D) Doughnut graphs tabulating the most differentiated cell type found in seminiferous tubule cross sections. For p-values, see Figure 2—figure supplement 1, which shows the same data displayed as bar charts. N = 4. (E) Quantification of germ cells in seminiferous tubule cross sections. Mutant values are plotted relative to control, which is set at 100% and indicated by the gray bar. There is an upward trend from differentiated spermatogonia to the leptotene/zygotene stage, but this difference was not statistically significant. N = 4. (F) Representative images of chromosomal spreads from WT spermatocytes in meiotic prophase I (MPI). Mutant meiotic spreads had no obvious chromosomal abnormalities. Scale bar, 20 µm. (G) Quantification of MPI substages from chromosomal spreads. In the mutant, note the bottleneck at the zygotene-to-pachytene transition. N = 4. (H) Schematic of normal spermatogenesis (left), and the meiotic defect in mutants (right). ST, spermatid; MPI, Meiotic Prophase I; SC, spermatocyte; P/D, pachytene/diplotene; L/Z, leptotene/zygotene; SG, spermatogonium. All data are from P24 juvenile mice. Data are represented as mean ± SEM. ****p≤0.0001; ***p≤0.001; **p≤0.01; *p≤0.05. For statistical tests used, see the Materials and methods section.
Figure 2—figure supplement 1
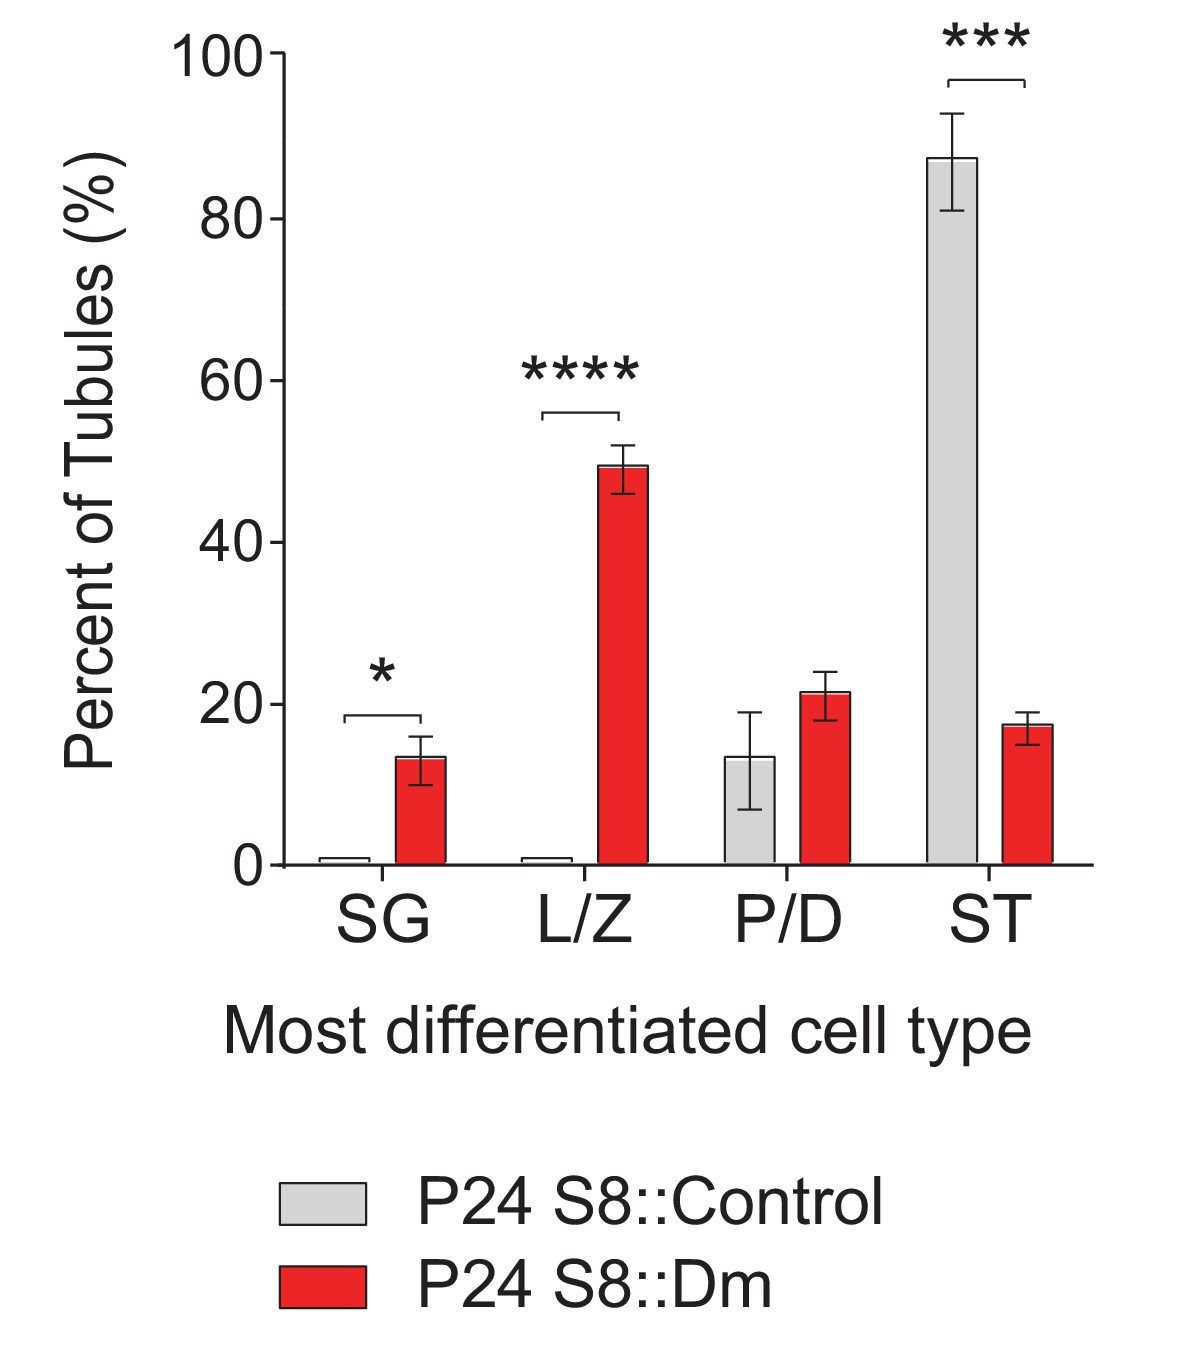
Same data as in Figure 2D but displayed as bar charts to indicate.
statistical significance.ST, spermatid; P/D, pachytene/diplotene; L/Z, leptotene/zygotene; SG, spermatogonium. N = 4. Data are represented as mean ± SEM. ****p≤0.0001; ***p≤0.001; *p≤0.05. For statistical tests used, see the Materials and methods section.
Figure 2—figure supplement 2
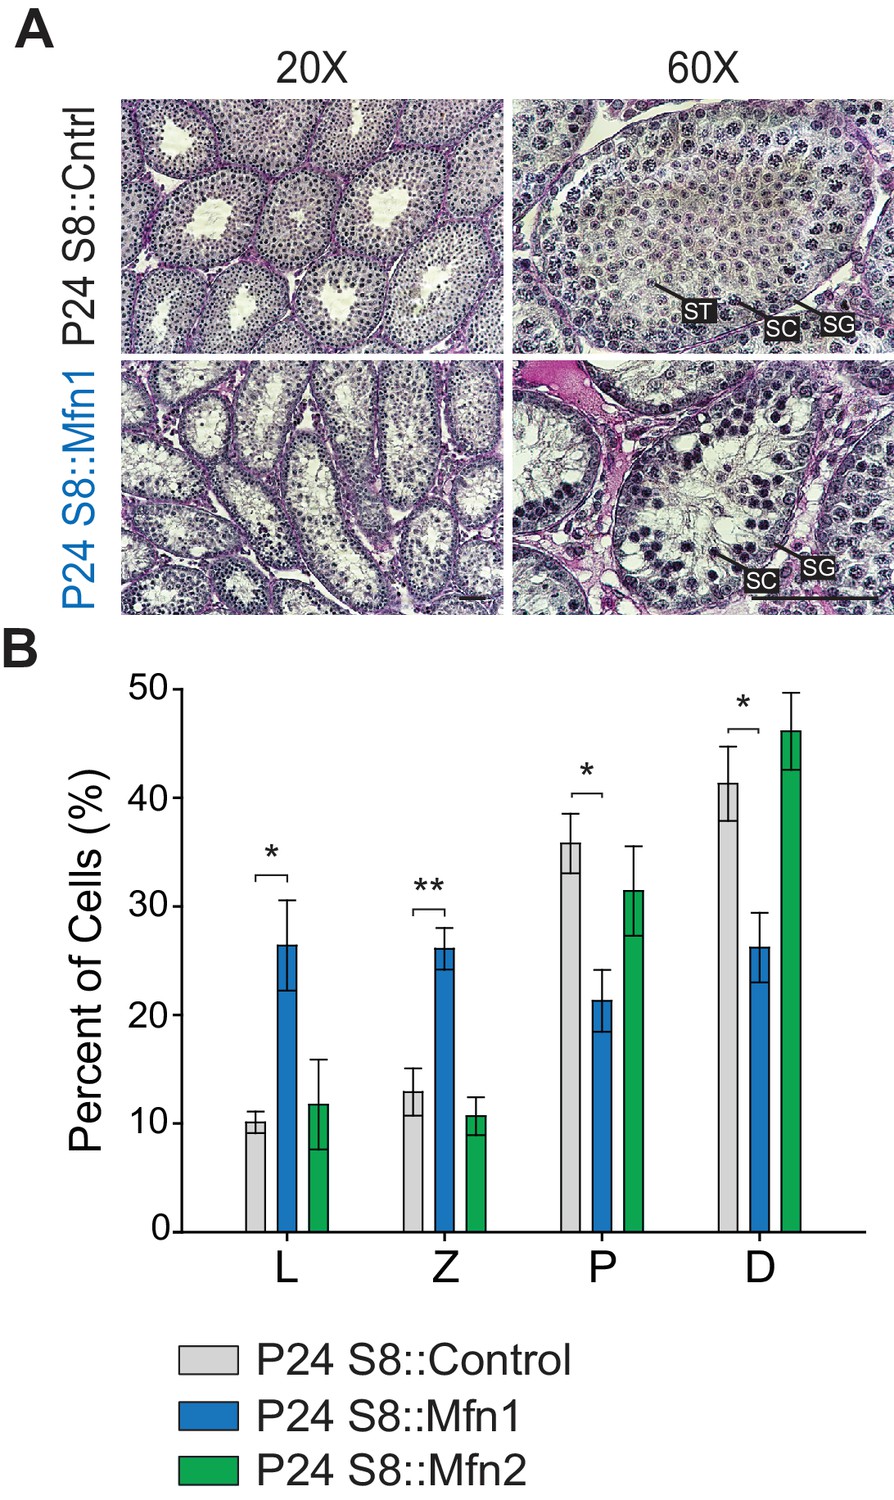
Mfn1, but not Mfn2, is required for meiosis.
(A) PAS-stained testis sections from the indicated genotypes. Note the absence of spermatids in S8::Mfn1 tubules. Scale bar, 50 µm. (B) Chromosome spread analysis in the indicated genotypes. Note the meiotic block in S8::Mfn1 but not S8::Mfn2 mice. N = 6. Data are represented as mean ± SEM. **p≤0.01; *p≤0.05. For statistical tests used, see the Materials and methods section.
Figure 3 with 2 supplements
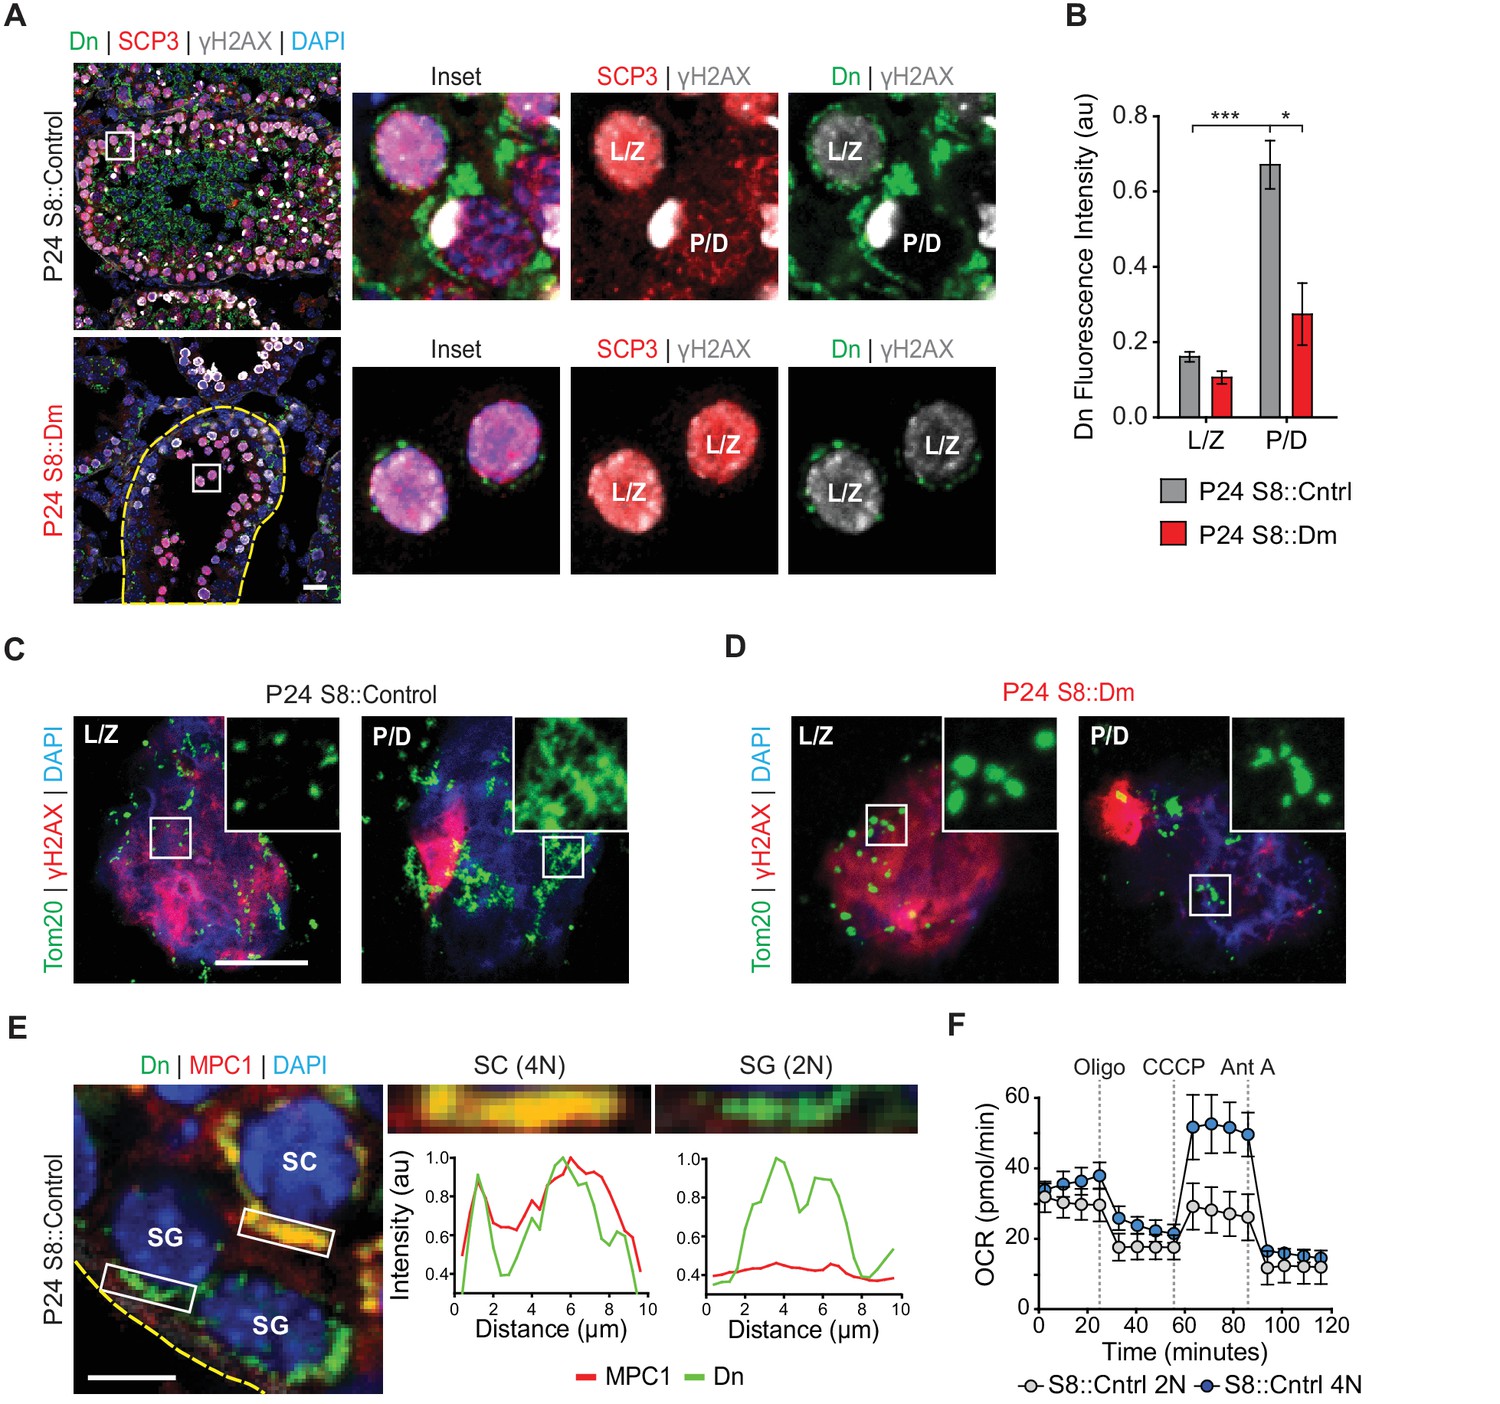
Spermatocytes undergo a metabolic shift during meiosis.
(A) Analysis of mitochondrial content in MPI spermatocytes from testis sections. Mitochondria were visualized by mito-Dendra2 (Dn). γH2AX staining was used to distinguish pachytene/diplotene spermatocytes from leptotene/zygotene spermatocytes, as in Figure 2C. For clarity, the border of the mutant seminiferous tubule is outlined by a dashed line. Scale bar, 20 µm. (B) Quantification of mito-Dendra2 fluorescence in spermatocytes in testis sections. N = 4. (C) Analysis of mitochondrial morphology from meiotic spreads in WT spermatocytes. Mitochondria were visualized with the outer mitochondrial membrane marker, Tom20, and the stages of meiosis were distinguished by γH2AX staining. Note the clustering and elongation in Pachytene/Diplotene spermatocytes. Scale bar, 10 µm. (D) Analysis of mitochondrial morphology in S8::Dm spermatocytes. Note the fragmented mitochondrial morphology in Pachytene/Diplotene. Scale bar, 10 µm. (E) Selective expression of the mitochondrial pyruvate carrier, MPC1, in WT spermatocytes. The basement membrane at the tubule periphery is indicated by the yellow dashed line. The fluorescence of mitochondria within the boxed region were analyzed by line scanning (right). Arbitrary units, au. Scale bar, 10 µm. (F) Comparison of oxygen consumption rates (OCR) from diploid versus tetraploid germ cells from WT adult testes (2–3 months). Germ cells were isolated by FACS and oxygen consumption analyzed with a Seahorse extracellular flux analyzer. 2N, diploid; 4N, tetraploid; Oligo, Oligomycin; CCCP, Carbonyl cyanide m-chlorophenyl hydrazine; Ant A, Antimycin A. The average values from three separate experiments are plotted. SC, spermatocyte; P/D, pachytene/diplotene; L/Z, leptotene/zygotene; SG, spermatogonium. All data are from P24 mice unless otherwise noted. All data are from P24 mice. Data are represented as mean ± SEM. ***p≤0.001; *p≤0.05. For statistical tests used, see Material and methods section.
Figure 3—figure supplement 1
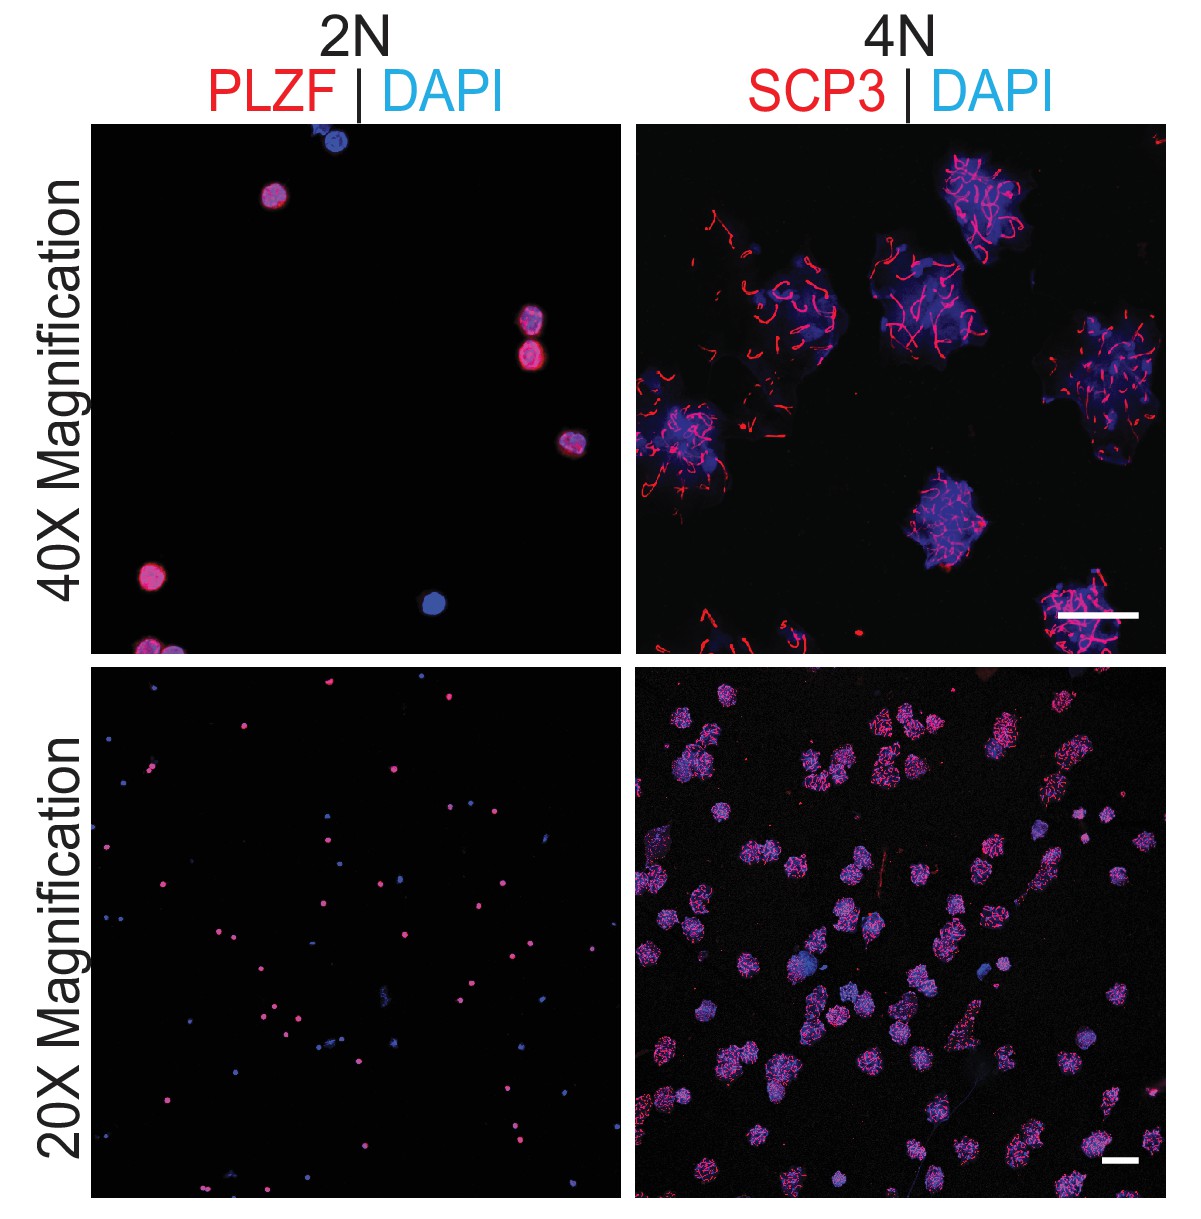
Analysis of sorted germ cells by immunostaining with specific markers.
Scale bars, 20 µm.
Figure 3—figure supplement 2
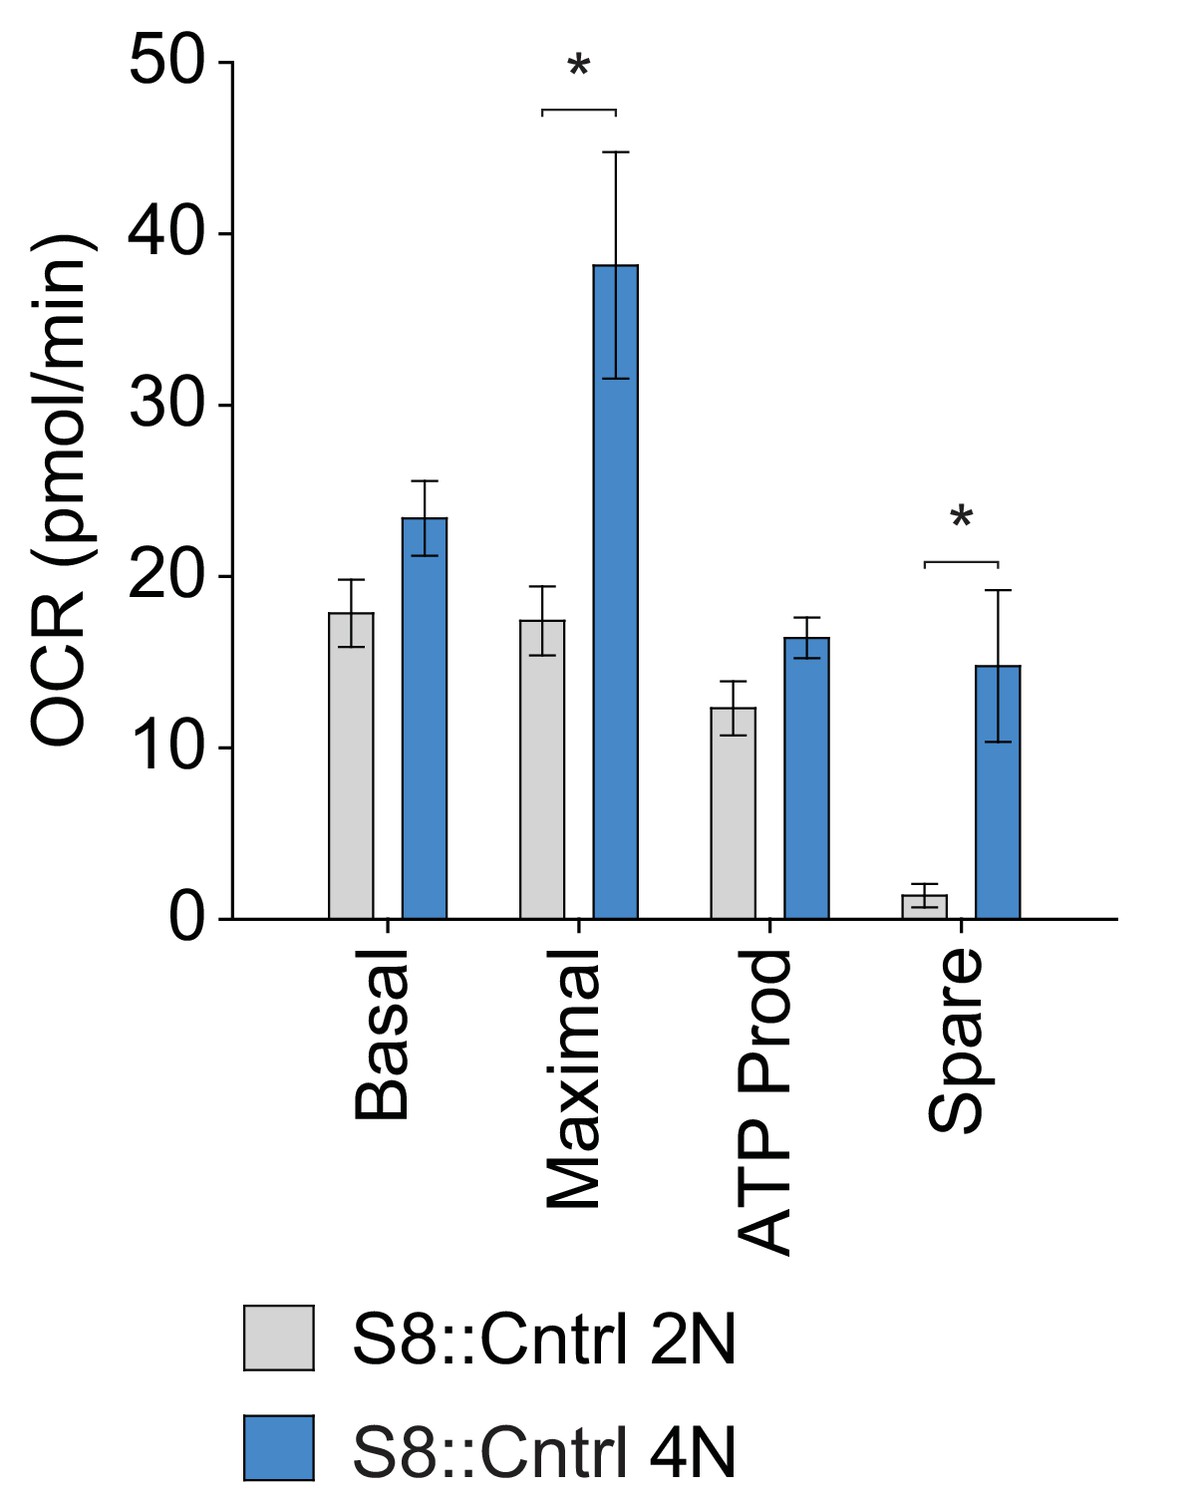
Quantification of OXPHOS parameters from Figure 3F.
The average values from three independent experiments are plotted. Data are represented as mean ± SEM. *p≤0.05. For statistical tests used, see the Materials and methods section.
Figure 4 with 4 supplements

Long-term mitofusin loss results in depletion of all differentiated germ cell types.
(A) PAS histology in P56 testis sections. Scale bar, 50 µm. On the right are stylized depictions of the 100X panels. SG, spermatogonium; SC, spermatocyte; ST, spermatid, Lum, lumen; Ser, Sertoli cell cytoplasm. (B) FACS analysis of germ cells in WT and mutant testes. Testes were dissociated and FACS was used to quantify the number of mito-Dendra2-positive germ cells. Dendra fluorescence (x-axis) is shown in arbitrary units (au). The histograms were normalized by plotting the same number of somatic (mito-Dendra2-negative) cells between S8::Control and S8::Dm samples. (C) Quantification of the results from (B). N = 5. (D) Immunolabeling of the major germ cell types in WT and mutant animals. Scale bar, 20 µm. (E) Doughnut graphs indicating germ cell types in seminiferous tubule cross sections. Each seminiferous tubule cross section was scored for its most advanced germ cell type. Note that in WT tubules, all seminiferous tubules contain spermatids. For p-values, see Figure 4—figure supplement 1. N = 4. (F) Quantification of germ cell types per tubule cross section. Mutant values are plotted relative to control, which is set to 100% and indicated by the gray bar. N = 4. (G) Immunolabeling of stem-like spermatogonia. PLZF marks all undifferentiated spermatogonia and GFRα1 marks stem-like spermatogonia. Note that all GFRα1 spermatogonia express PLZF, but not vice versa. Scale bar, 20 µm. (H) Immunolabeling of the proliferation marker Ki-67 in GFRα1-expressing spermatogonia in testis section. Scale bar, 20 µm. (I) Percent of GFRα1-expressing spermatogonia that are positive for the proliferation marker Ki67. N = 4. (J) Schematic of normal spermatogenesis (left) and the defect in P56 S8::Dm mice (right). SPZ, spermatozoon; ST, spermatid; MPI; Meiotic Prophase I; SC, spermatocyte; P/D, pachytene/diplotene; L/Z, leptotene/zygotene; SG, spermatogonium. Ac, acrosome, XY, sex body; PM, plasma membrane; Nuc, nucleus. N ≥ 4, unless otherwise indicated. Data are represented as mean ± SEM. ****p≤0.0001; ***p≤0.001. For statistical tests used, see the Materials and methods section.
Figure 4—figure supplement 1
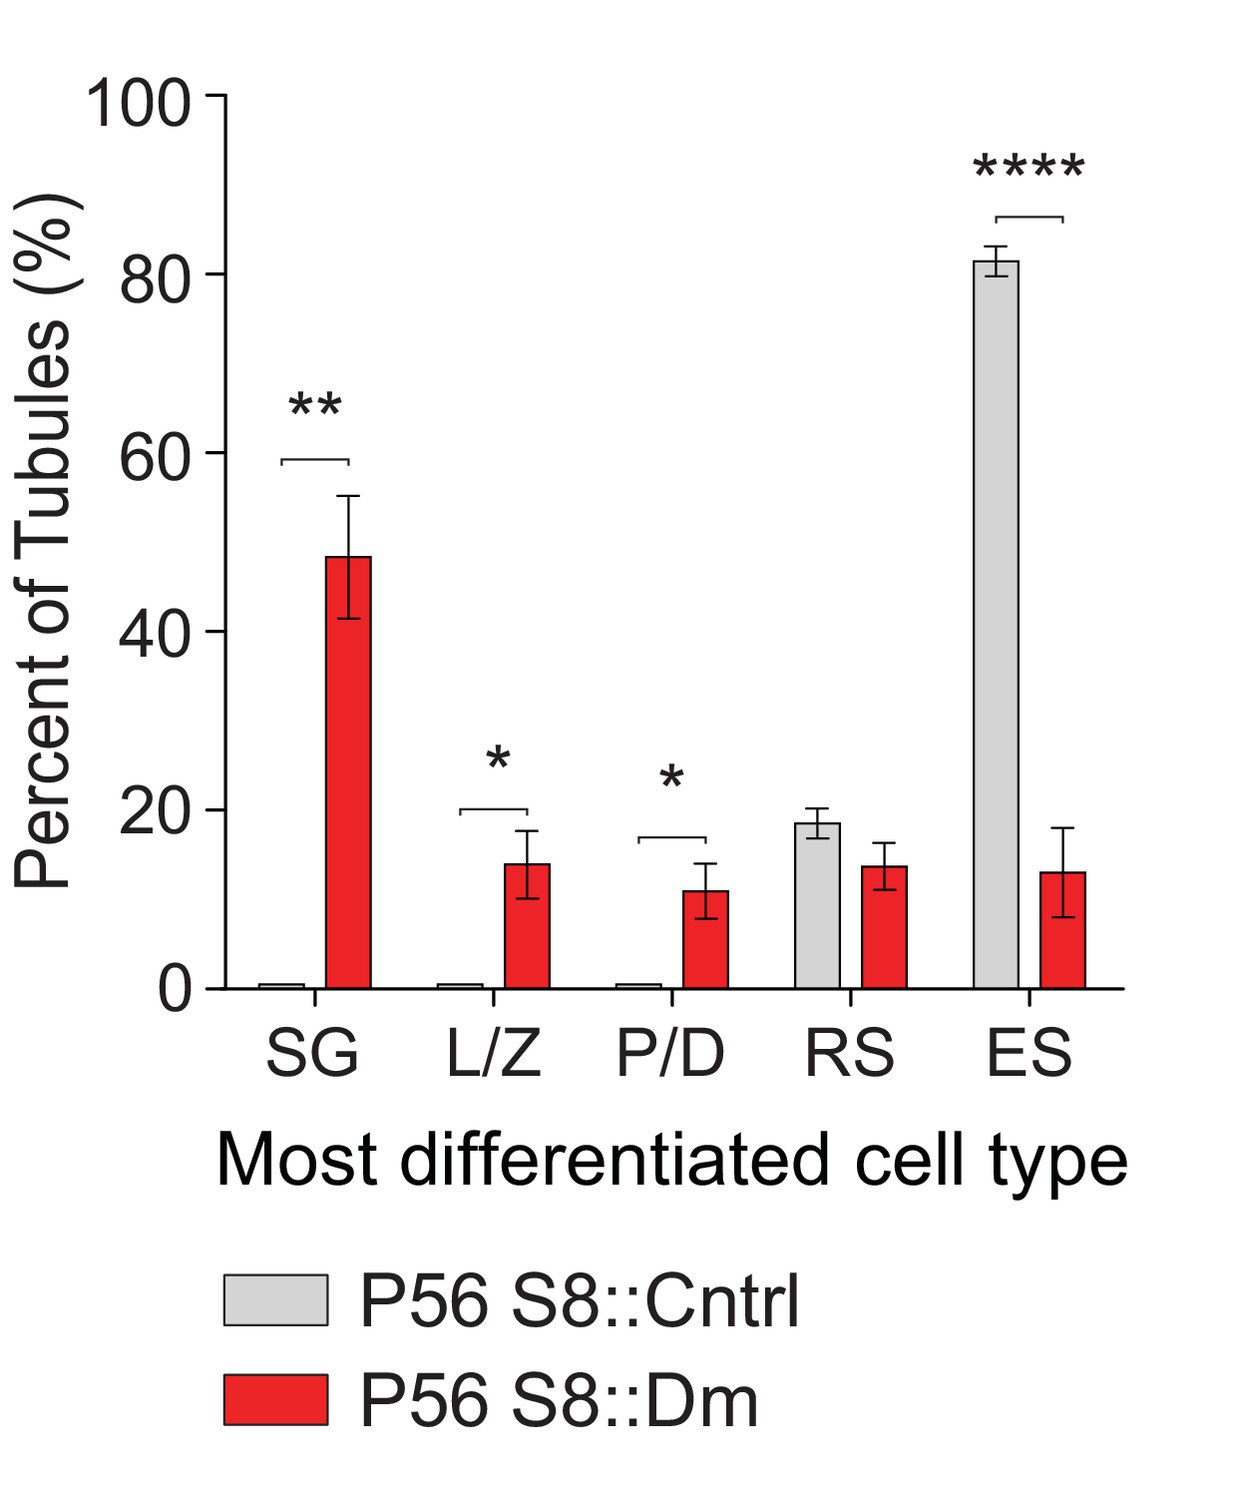
Plot of the most differentiated cell type found in seminiferous tubules.
Same data as in Figure 4E but displayed as bar charts to indicate statistical significance. N = 4. Data are represented as mean ± SEM. ****p≤0.0001; **p≤0.01; *p≤0.05. For statistical tests used, see the Materials and methods section.
Figure 4—figure supplement 2
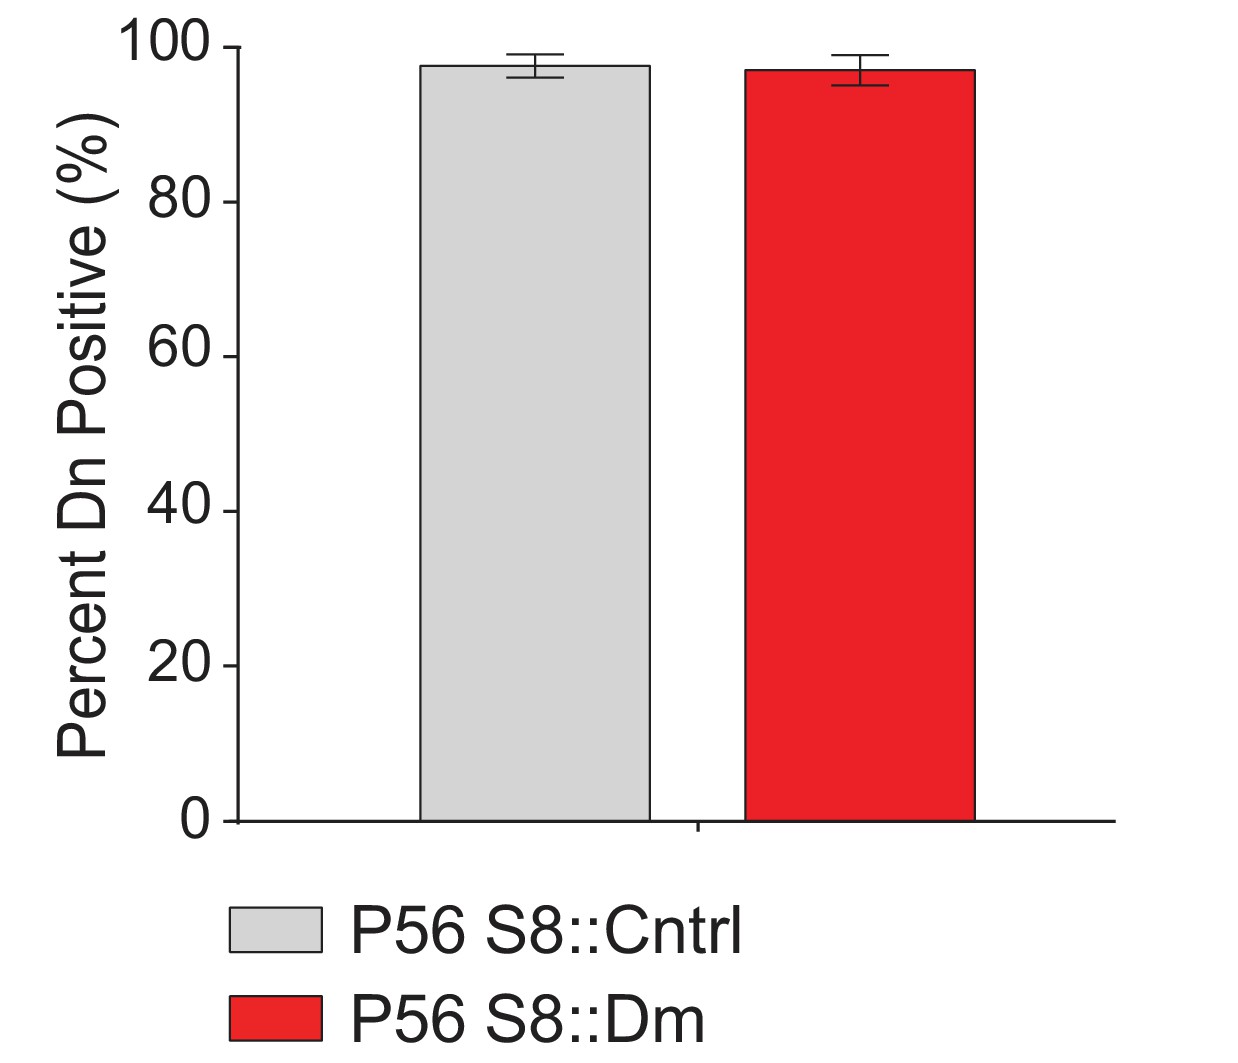
Quantification of Stra8-Cre/Dn expression in stem-like GFRα1-expressing spermatogonia.
N = 3. 150 cells were counted from each genotype. For statistical tests used, see the Materials and methods section.
Figure 4—figure supplement 3
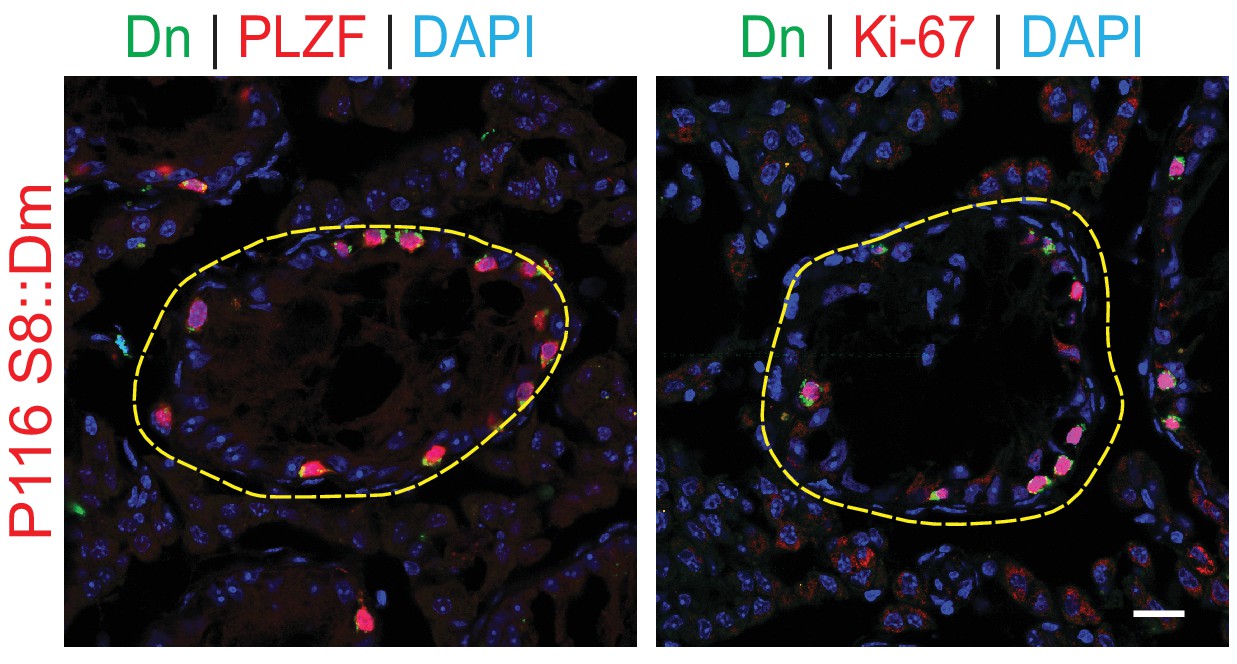
Testis sections from 4-months-old S8::Dm mice stained with PLZF or Ki-67.
Scale bar, 20 µm.
Figure 4—figure supplement 4
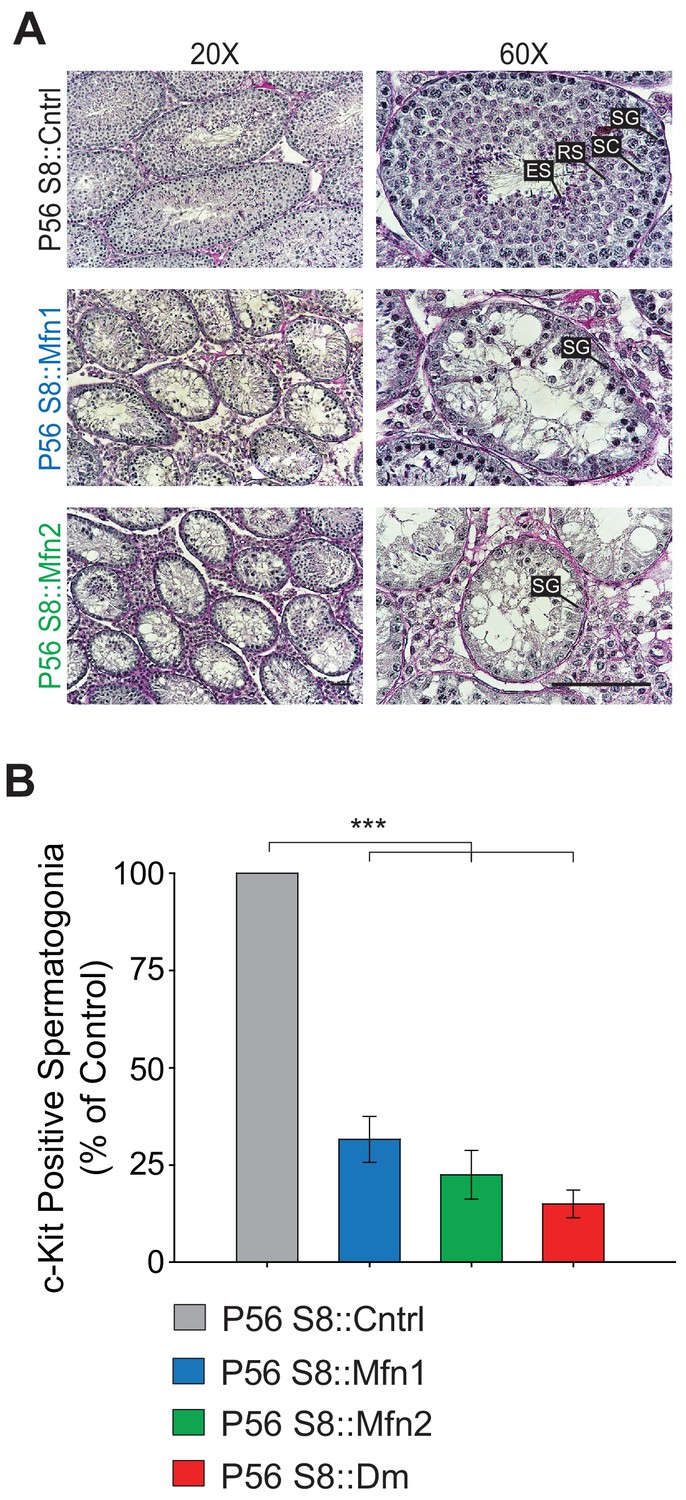
Both Mfn1 and Mfn2 are required for spermatogonial differentiation.
(A) PAS-stained testis histology of the indicated genotypes. Note the loss of germ cells from the center of the tubules in both S8::Mfn1 and S8::Mfn2 mice. Scale bars, 50 µm. (B) Quantification of c-Kit expressing spermatogonia in the indicated genotypes. N = 4. Data are represented as mean ± SEM. ***p≤0.001. For statistical tests used, see the Materials and methods section.
Figure 5 with 1 supplement

Mitofusin-deficient germ cells have increased apoptosis.
(A) EM tomograms from adult P56 testis sections highlighting mitochondrial cristae morphology. The following pseudocolors are used: mitochondrial matrix, blue; cristae lumen, pink; nucleus, green. Nuc, nucleus. (B) Quantification of mitochondrial cristae morphology from EM tomograms. At least 70 cristae junctions were quantified from at least four different EM tomograms from a single mouse from each genotype. (C) EM tomograms from testis sections highlighting cristae junctions. Mitochondrial matrices are colored blue, and mitochondrial intermembrane spaces and cristae are colored pink. (D) Quantification of cristae junction diameters from EM tomograms. (E) TUNEL staining of PFA-fixed testis sections. Cells were labeled for TUNEL, mito-Dendra2 (Dn), and nuclei (DAPI). Scale bars, 20 µm. (F) Quantification showing the percentage of seminiferous tubule cross-sections containing TUNEL-positive cells. N = 3. Data are represented as mean ± SEM. ****p≤0.0001; ***p≤0.001; **p≤0.01; *p≤0.05. For statistical tests used, see the Materials and methods section.
Figure 5—figure supplement 1
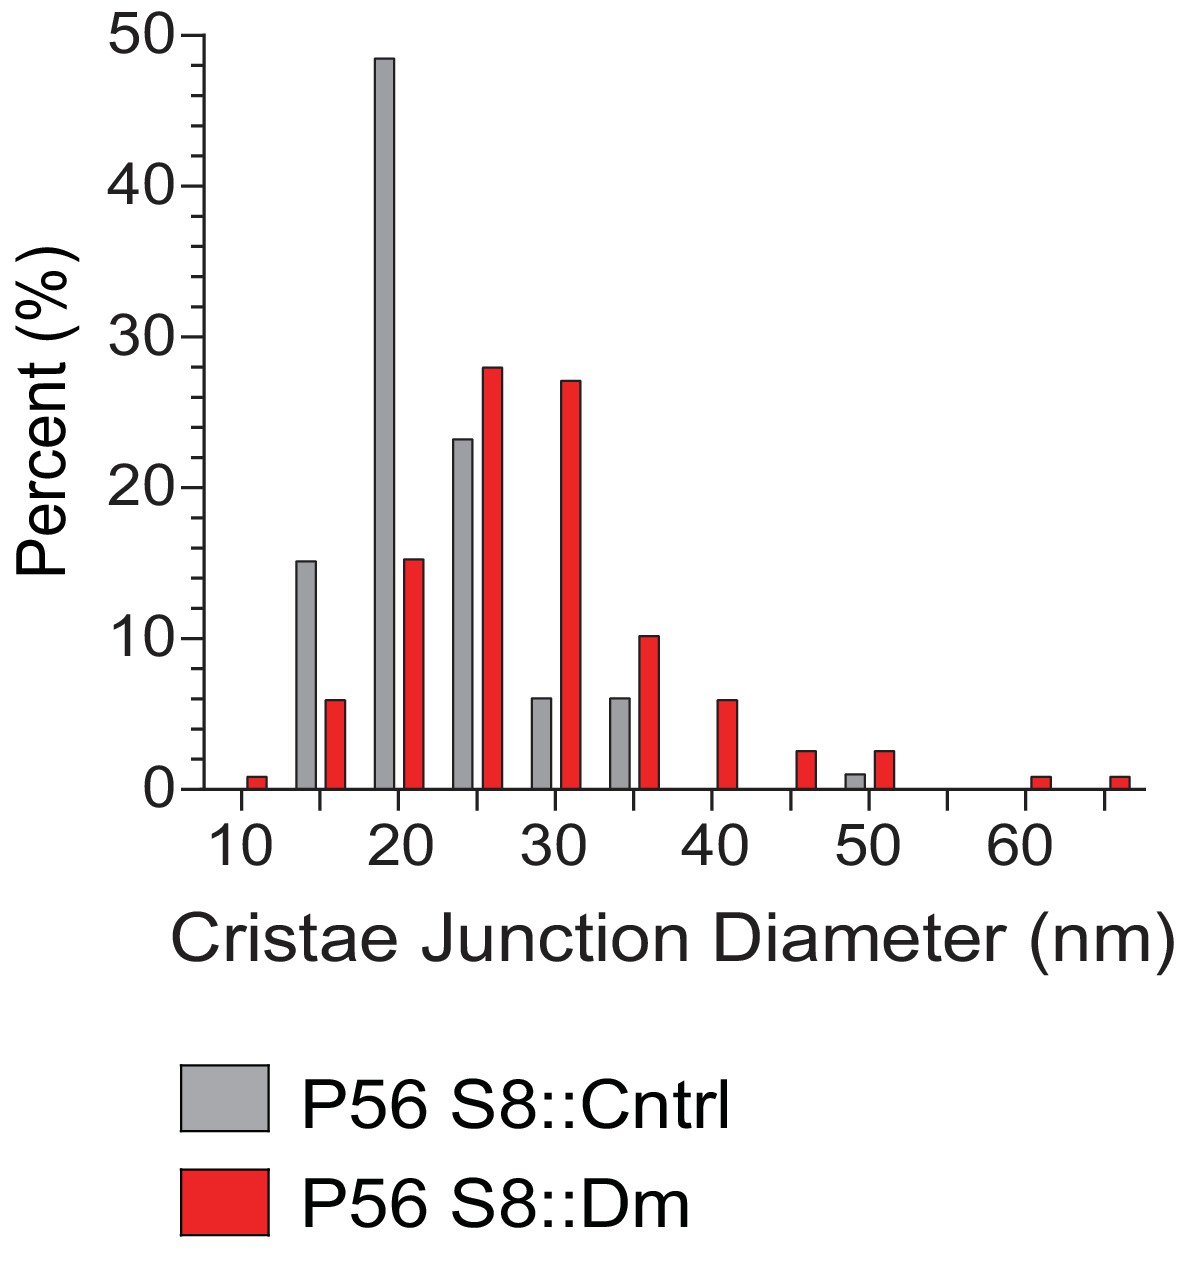
Size distribution of cristae junction diameters in spermatocytes from Figure 5C and D.
99 CJs were measured from control and 118 from mutant.
Figure 6 with 1 supplement
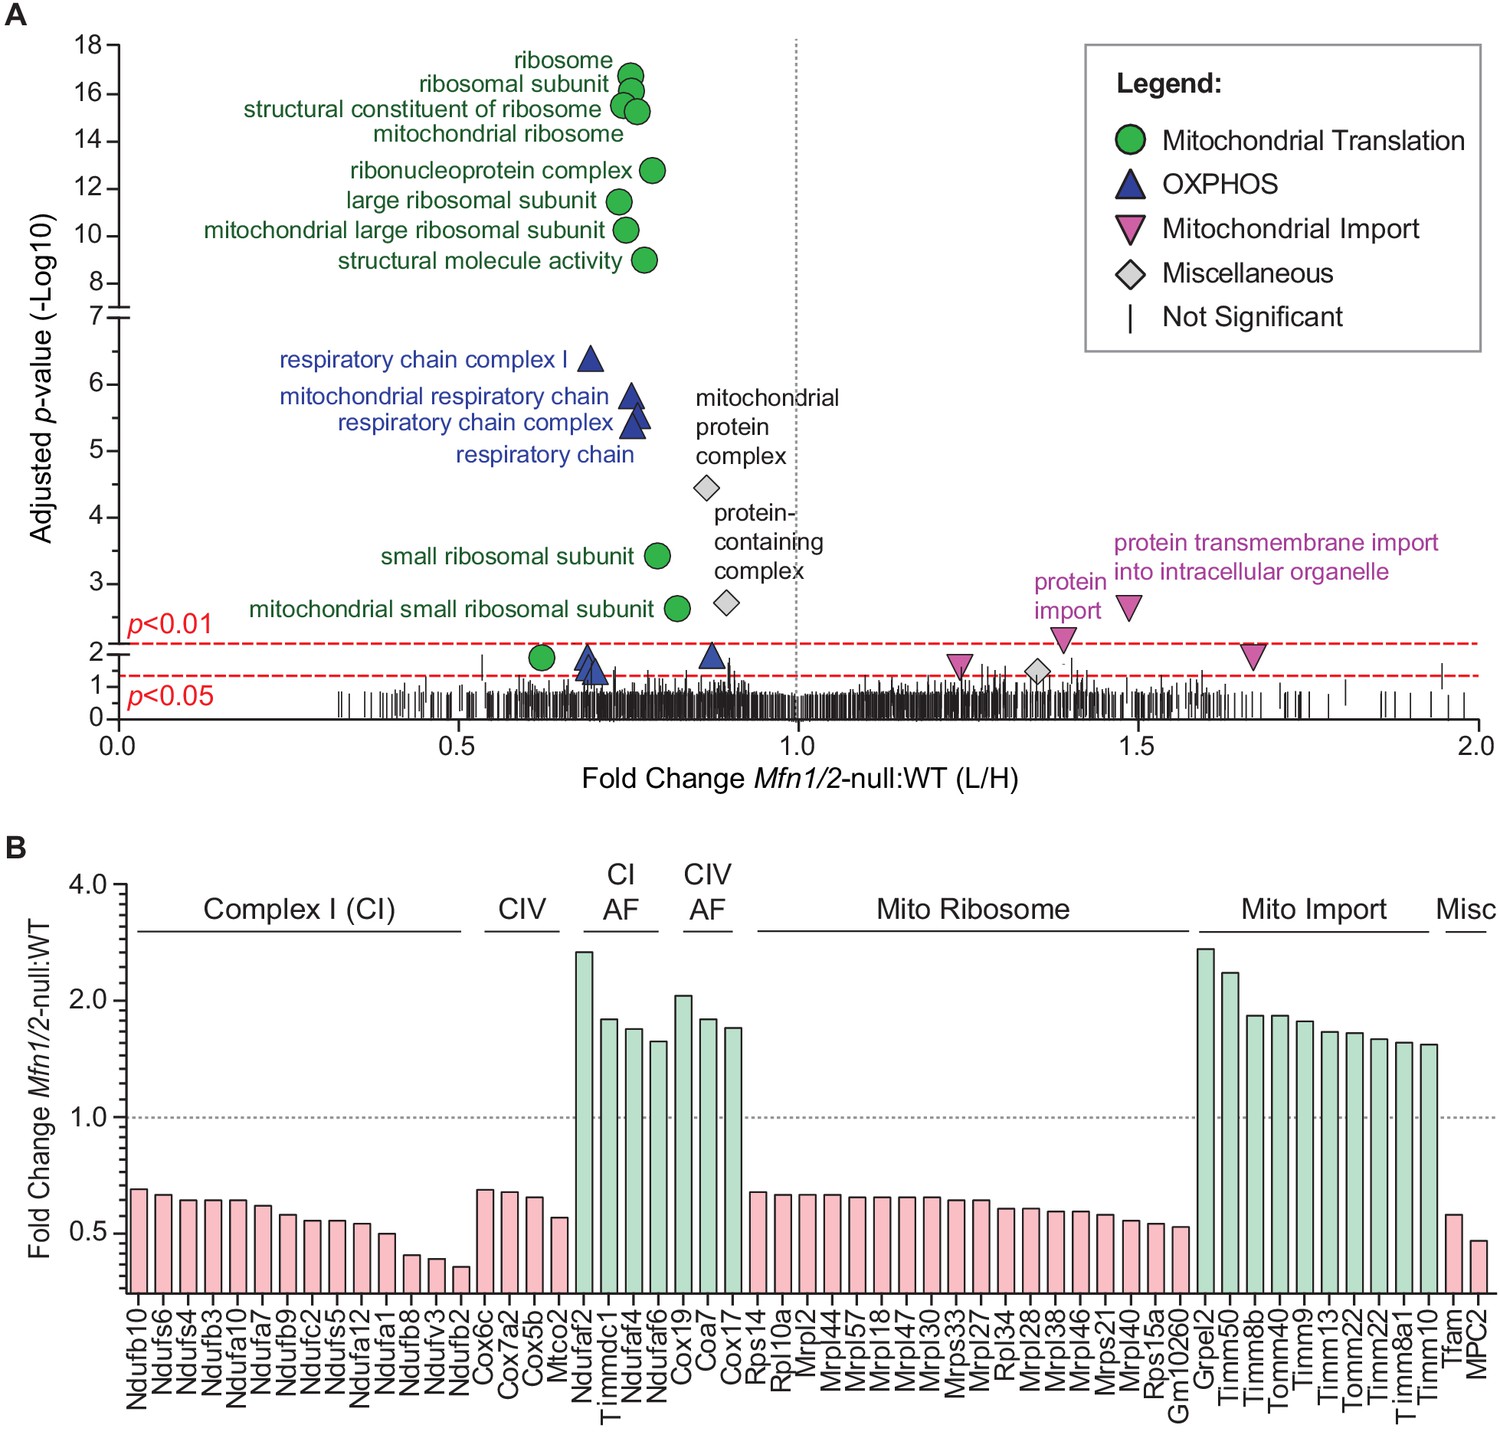
Mitofusin-deficient MEFs have reduced OXPHOS subunits and mitochondrial ribosomes.
(A) Volcano plot showing enriched Gene Ontology terms from SILAC experiments in MEFs. SILAC was performed on isolated mitochondria from WT and Mfn1/Mfn2-null MEFs. See also Supplementary file 1. (B) Comparison of individual mitochondrial proteins from SILAC analysis of MEFs. Bar charts show the protein ratios in Mfn1/Mfn2-null versus WT. Only proteins with ratios that reached statistical significance (p≤0.05) are plotted. For a complete list of proteins, see Supplementary file 1. The black dashed line indicates a mutant to WT ratio of 1:1. Magenta bars indicate proteins that are reduced and green bars indicate proteins that are increased. See also Supplementary file 2. Two biological replicates were used. Assembly factor, AF. For statistical tests used, see the Materials and methods section.
Figure 6—figure supplement 1
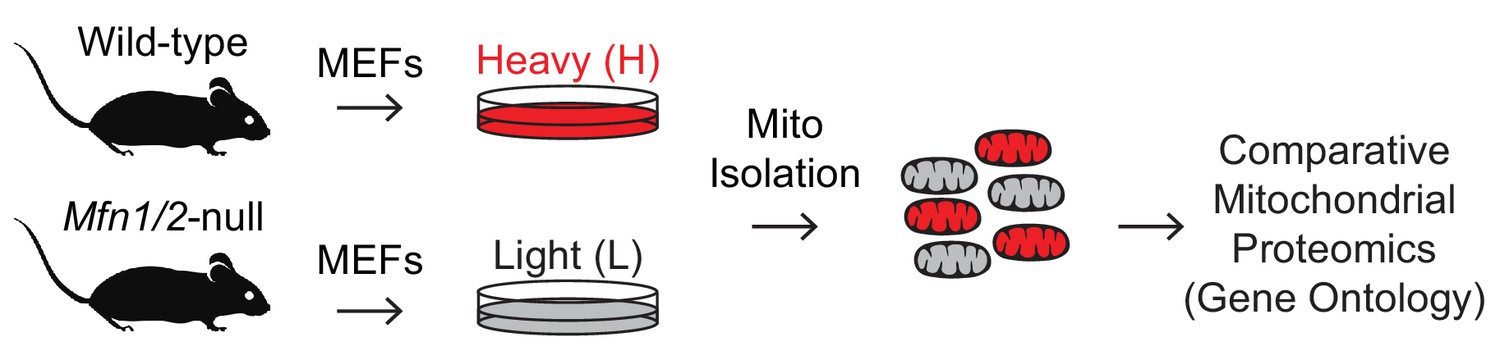
Schematic of SILAC experiment in MEFs.
Figure 7 with 3 supplements
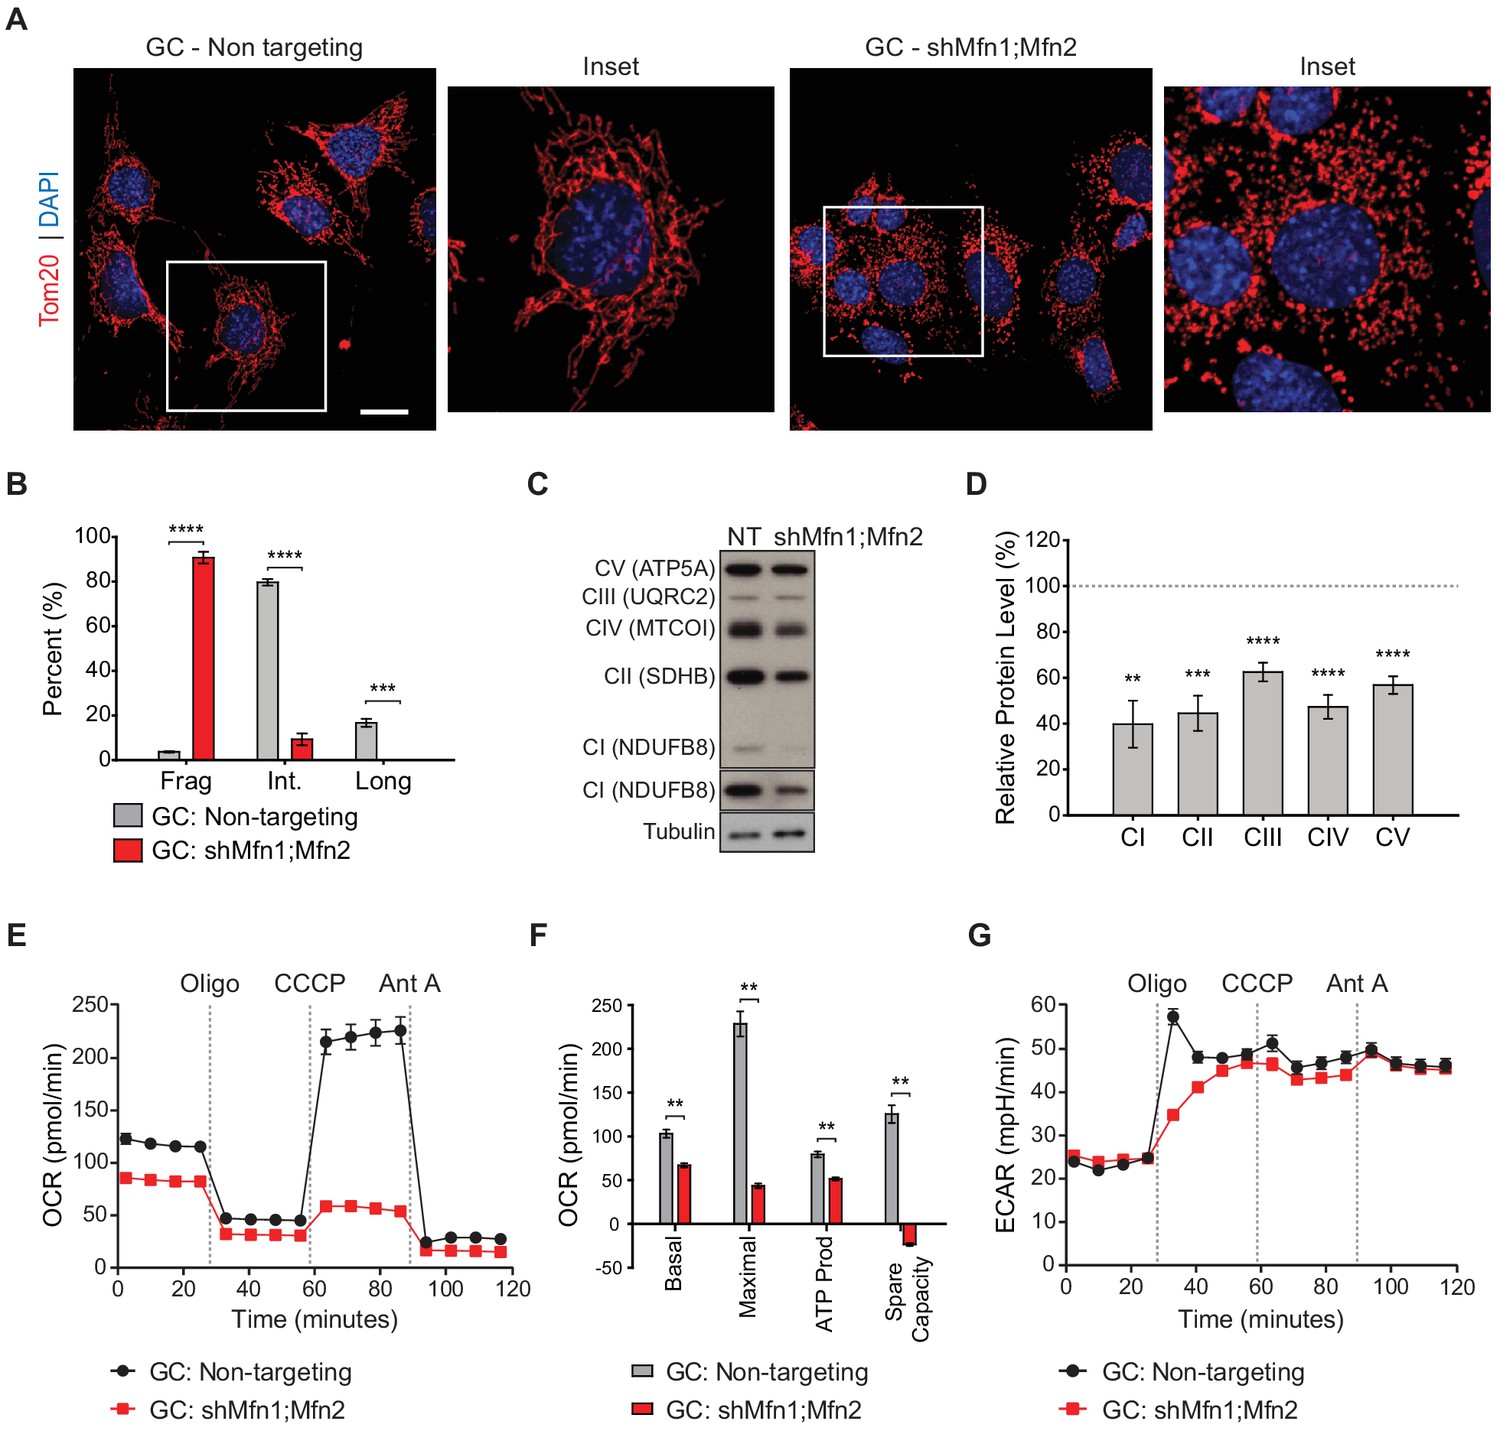
Mitofusin-deficient immortalized spermatocytes have reduced OXPHOS subunits and activity.
(A) Immunostaining against the mitochondrial outer membrane marker, Tom20 in an immortalized spermatocyte cell line, GC-2Spd(ts) (GC). Note the mitochondrial fragmentation in shMfn1;Mfn2 treated cells compared to the non-targeting control. Scale bar, 20 µm. (B) Quantification of mitochondrial morphology in GCs. Mean values from three replicates are plotted. (C) Western blots showing various respiratory chain complexes in GCs. NT, non-targeting. (D) Densitometry analysis of western blots. Mean values from four replicates are plotted. (E) Oxygen Consumption Rate (OCR) measurements in GCs. (F) Quantification from E. (G) Extracellular Acidification Rate (ECAR) measurements in GCs. Oligo, oligomycin; CCCP, carbonyl cyanide m-chlorophenyl hydrazine; Ant A, antimycin A. Data are represented as mean ± SEM. ****p≤0.0001; ***p≤0.001; **p≤0.01. For statistical tests used, see the Materials and methods section.
Figure 7—figure supplement 1
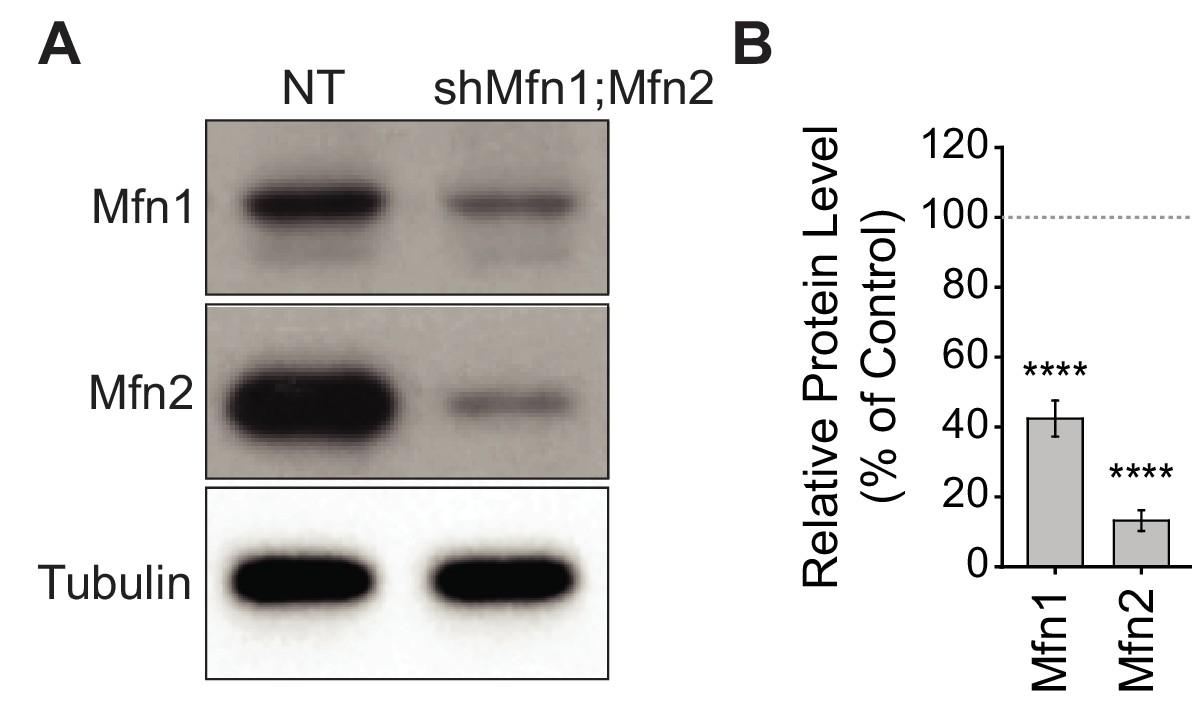
Mitofusin knockdown in immortalized spermatocytes.
(A) Western blots showing Mfn1 and Mfn2 levels in the GC-2spd(ts) cell line after knockdown. NT, non-targeting. (B) Densitometry analysis of western blots, plotted relative to control, which was set at 100%. Tubulin was used a loading control. Mean values from four replicates are plotted. Data are represented as mean ± SEM. ****p≤0.0001. For statistical tests used, see the Materials and methods section.
Figure 7—figure supplement 2
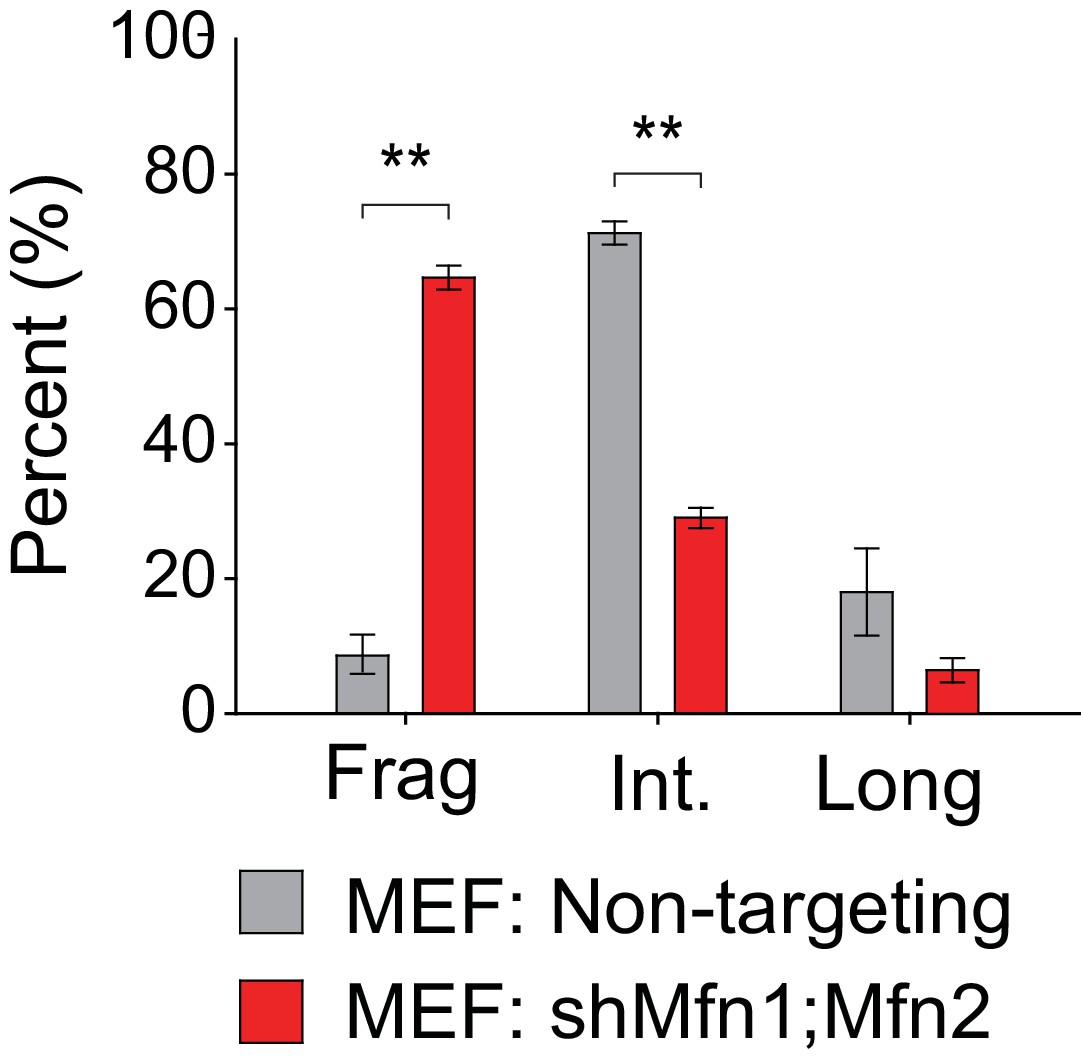
Quantification of mitochondrial morphology in MEFs.
Mean values from three replicates are plotted. Data are represented as mean ± SEM. **p≤0.01. For statistical tests used, see the Materials and methods section.
Figure 7—figure supplement 3
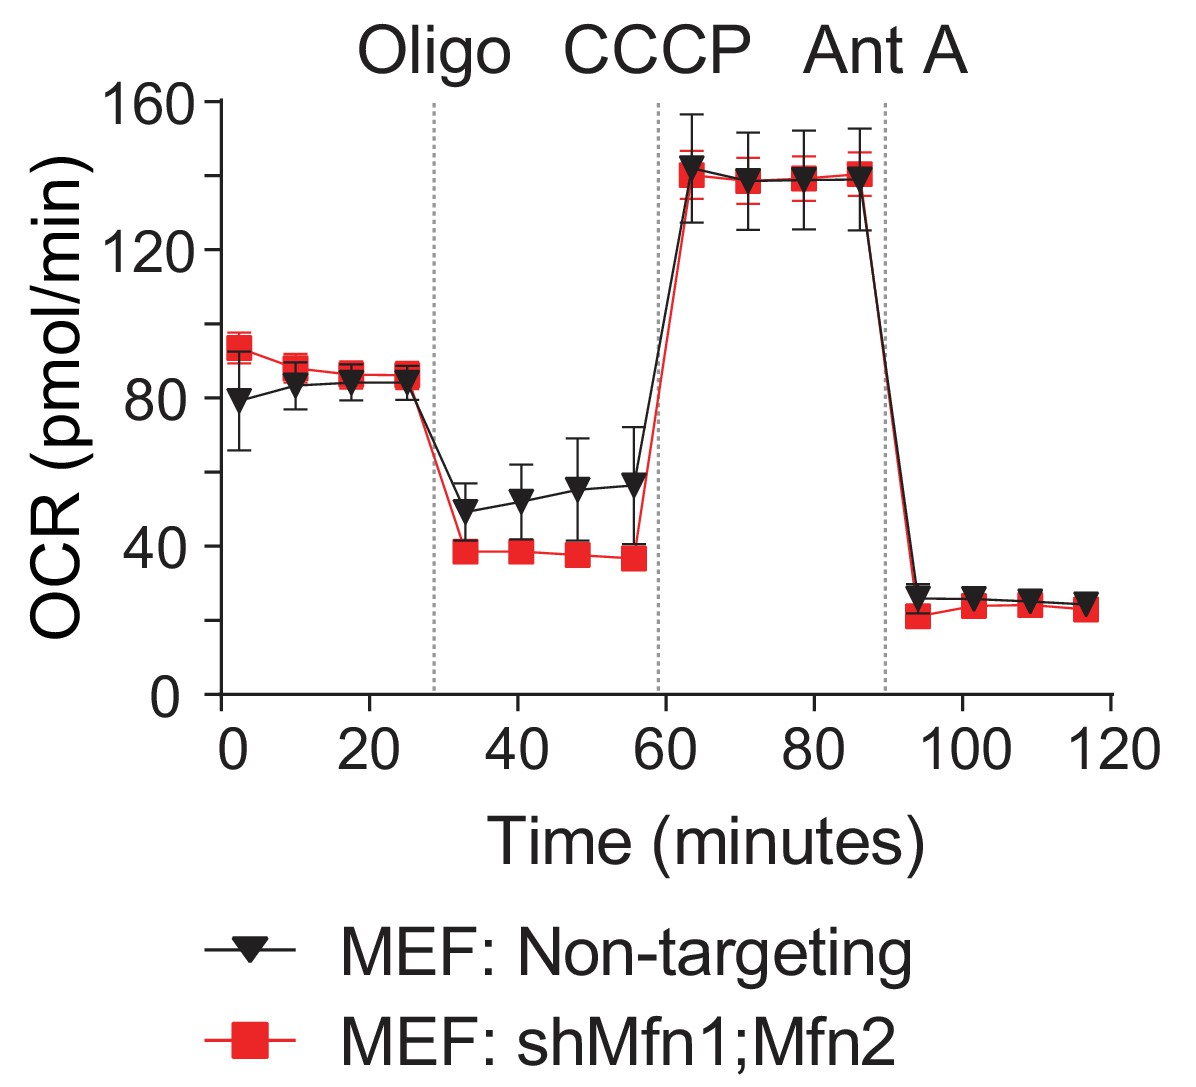
Oxygen Consumption Rate.
(OCR) measurements in MEFs. Oligo, Oligomycin; CCCP, Carbonyl cyanide m-chlorophenyl hydrazine; Ant A, Antimycin A. Data are represented as mean ± SEM. For statistical tests used, see the Materials and methods section.
Figure 8 with 3 supplements
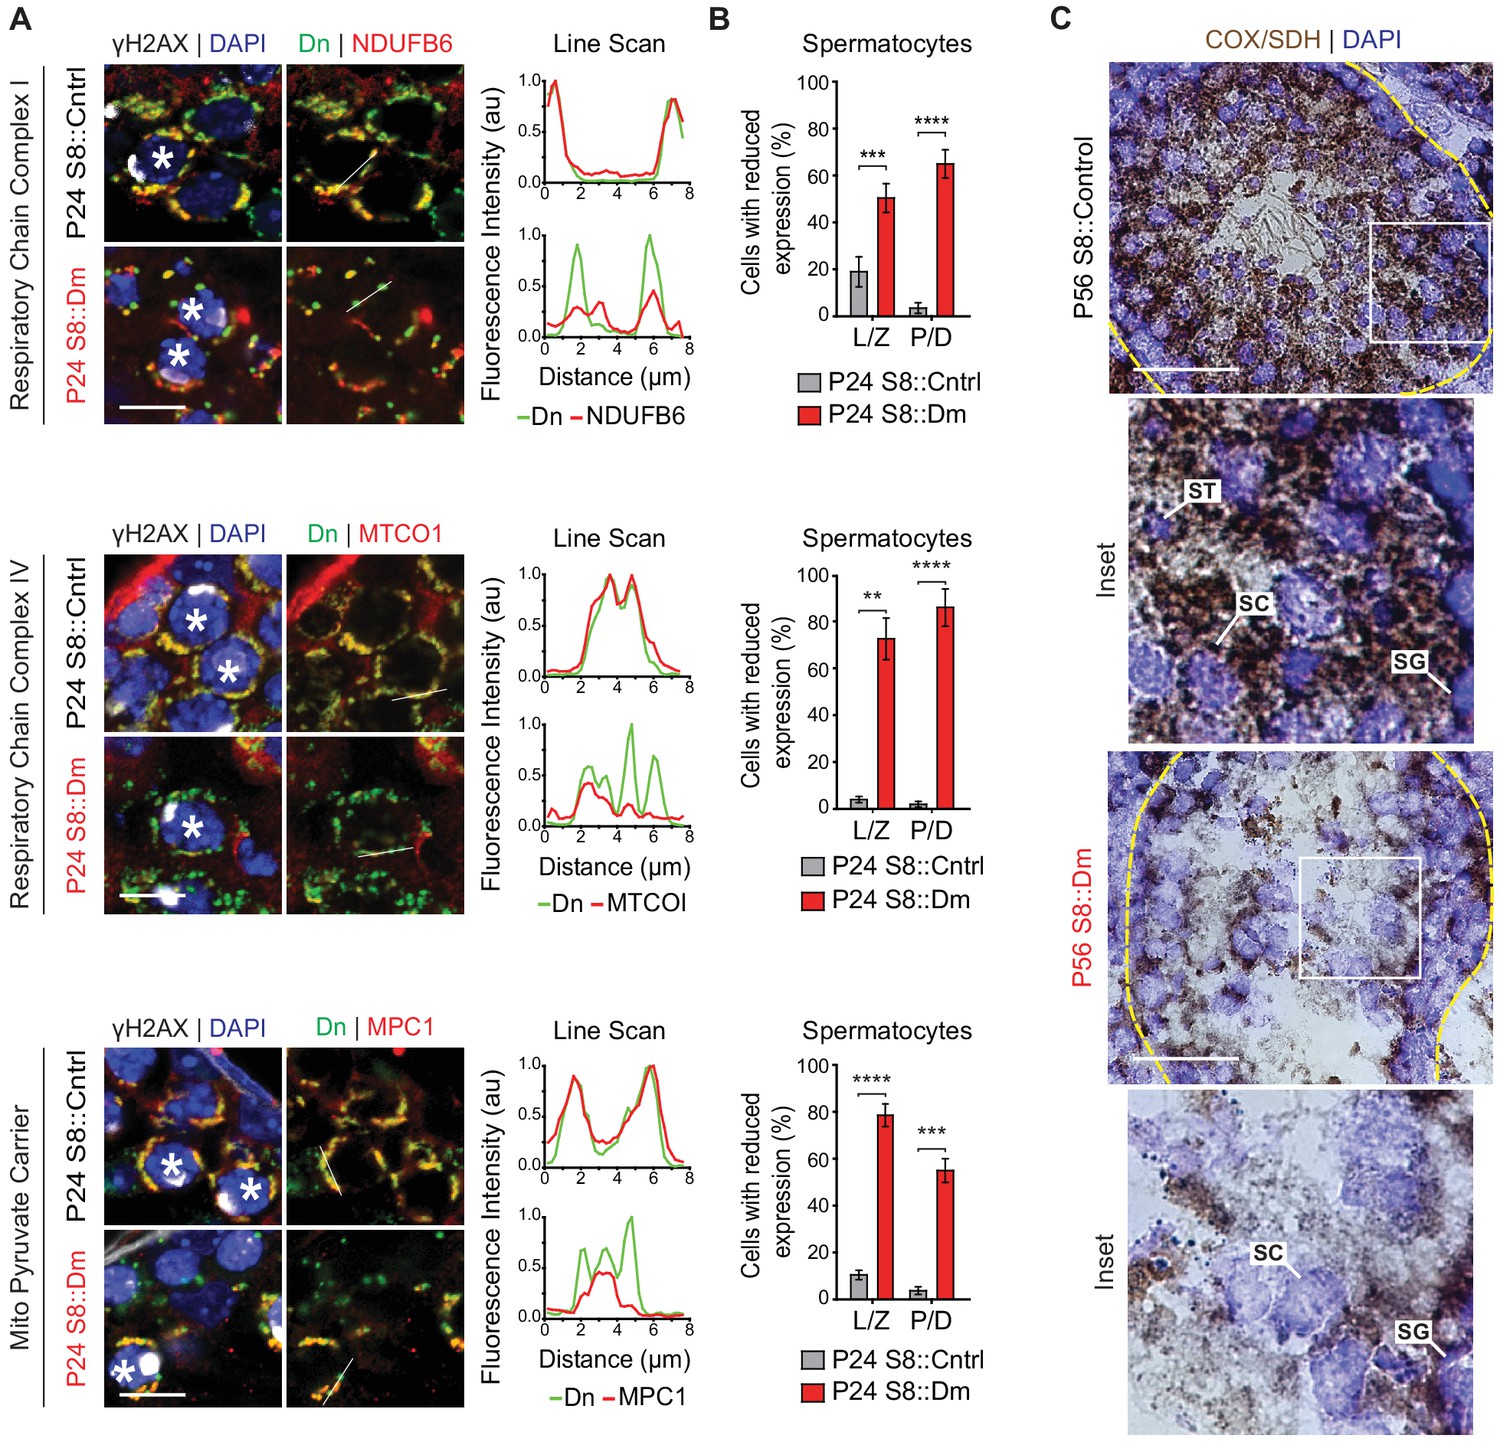
In vivo spermatocytes have heterogeneous mitochondria and reduced OXPHOS activity.
(A) Immunolabeling of NDUFB6, MTCOI, and MPC1 in spermatocytes in testis sections. Line scans are shown as arbitrary units (au) to the right. Scale bars, 20 µm. (B) Quantification showing the percentage of spermatocytes with reduced or heterogeneous staining. L/Z, leptotene/zygotene; P/D, pachytene/diplotene. N = 4. (C) COX/SDH enzyme histochemistry in adult testis sections. Note that mutant sections have much reduced OXPHOS activity. Scale bars, 50 µm. ST, spermatid; SC, spermatocyte; SG, spermatogonium. Data are represented as mean ± SEM. ****p≤0.0001; ***p≤0.001; **p≤0.01. For statistical tests used, see the Materials and methods section.
Figure 8—figure supplement 1
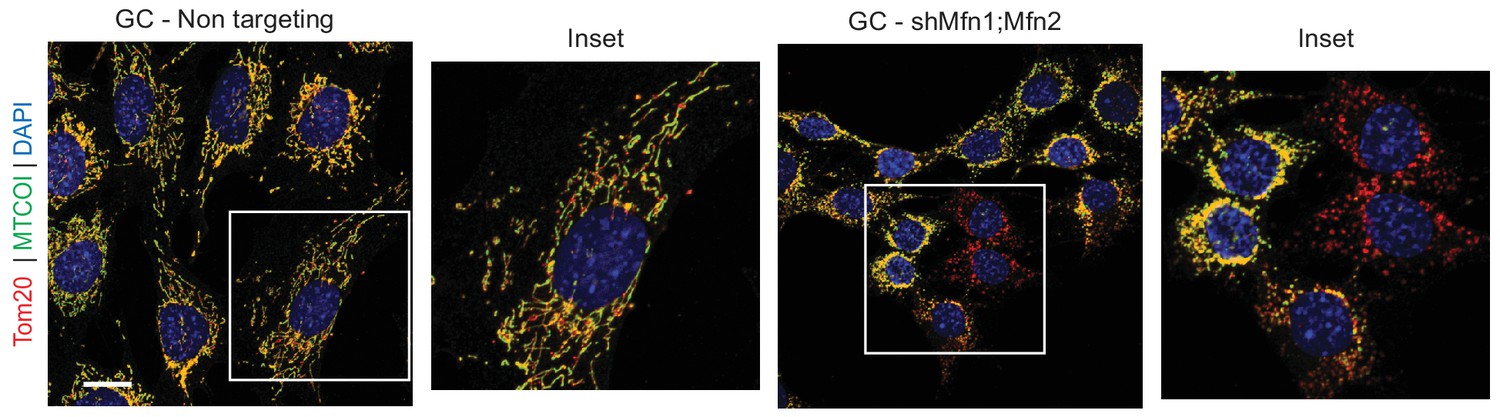
Immunolabeling of the mtDNA-encoded respiratory chain complex IV subunit MTCOI (green).
Mitochondria are labeled with the outer mitochondrial membrane marker Tom20 (red). Scale bar, 20 µm.
Figure 8—figure supplement 2
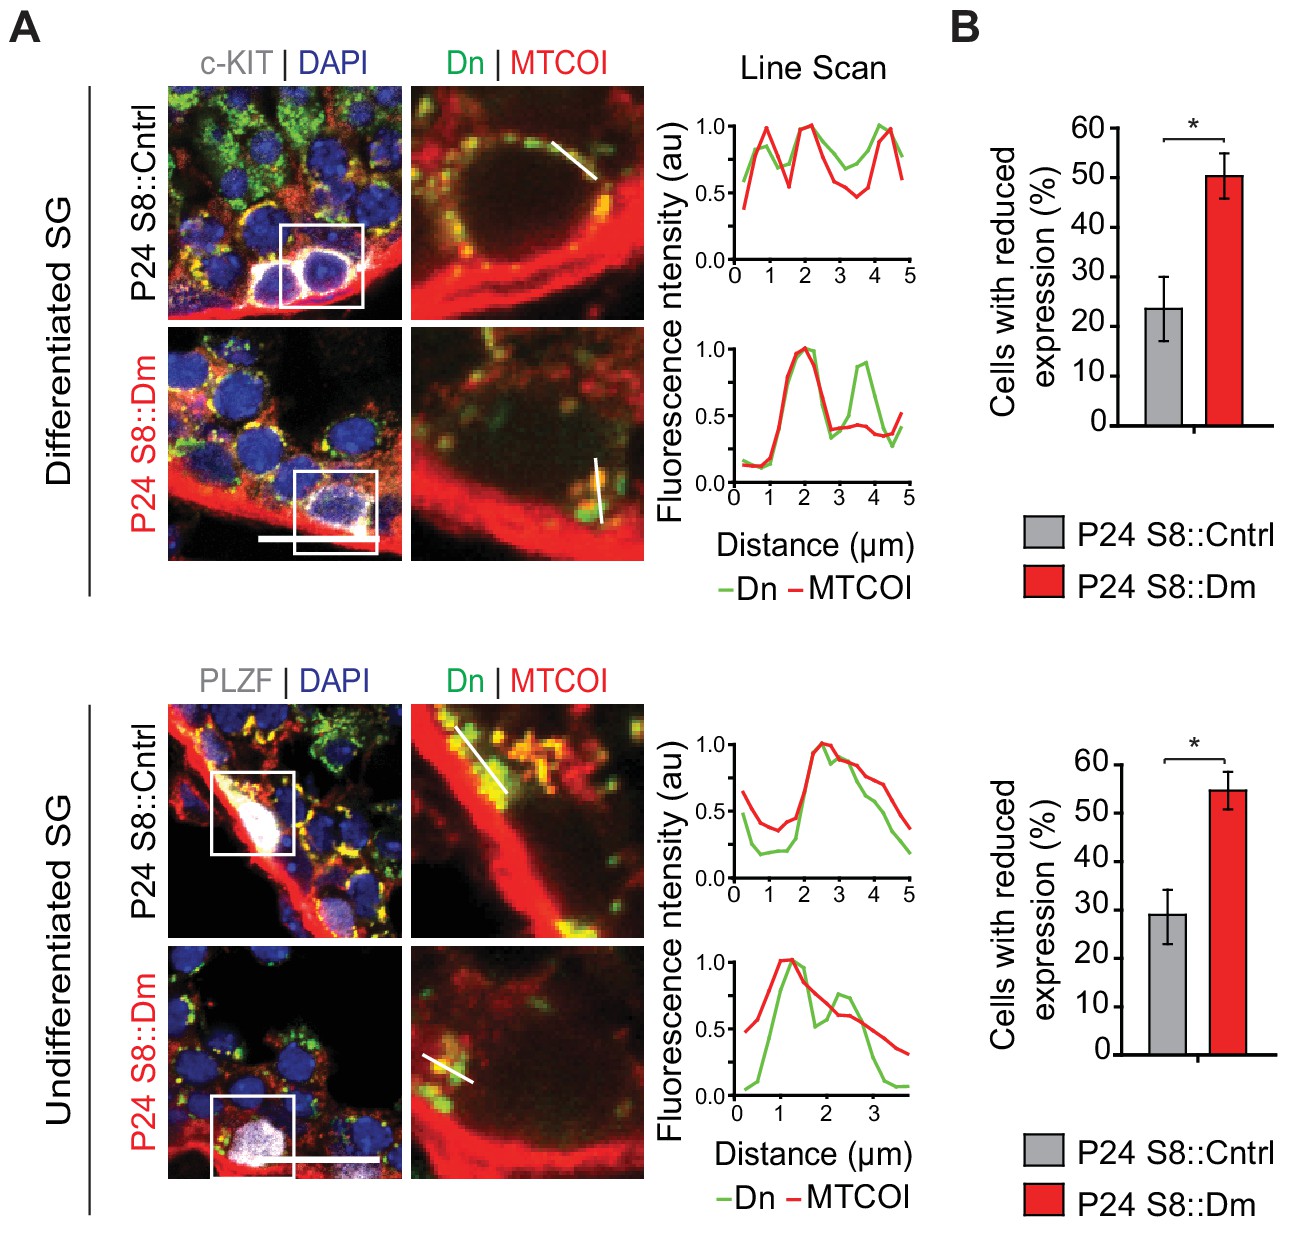
Mitochondrial heterogeneity in spermatogonia.
(A) Analysis of mitochondrial heterogeneity in differentiated and undifferentiated spermatogonia. MTCOXI protein was examined in c-Kit-positive cells (differentiated spermatogonia) and PLZF-positive cells (undifferentiated spermatogonia). Line scans are shown as arbitrary units (au) to the right. SG, spermatogonia. Scale bar, 20 µm. (B) Quantification showing the percentage of differentiated and undifferentiated spermatogonia with heterogeneous MTCOXI protein. N = 4. Data are represented as mean ± SEM. *p≤0.05. For statistical tests used, see the Materials and methods section.
Figure 8—figure supplement 3
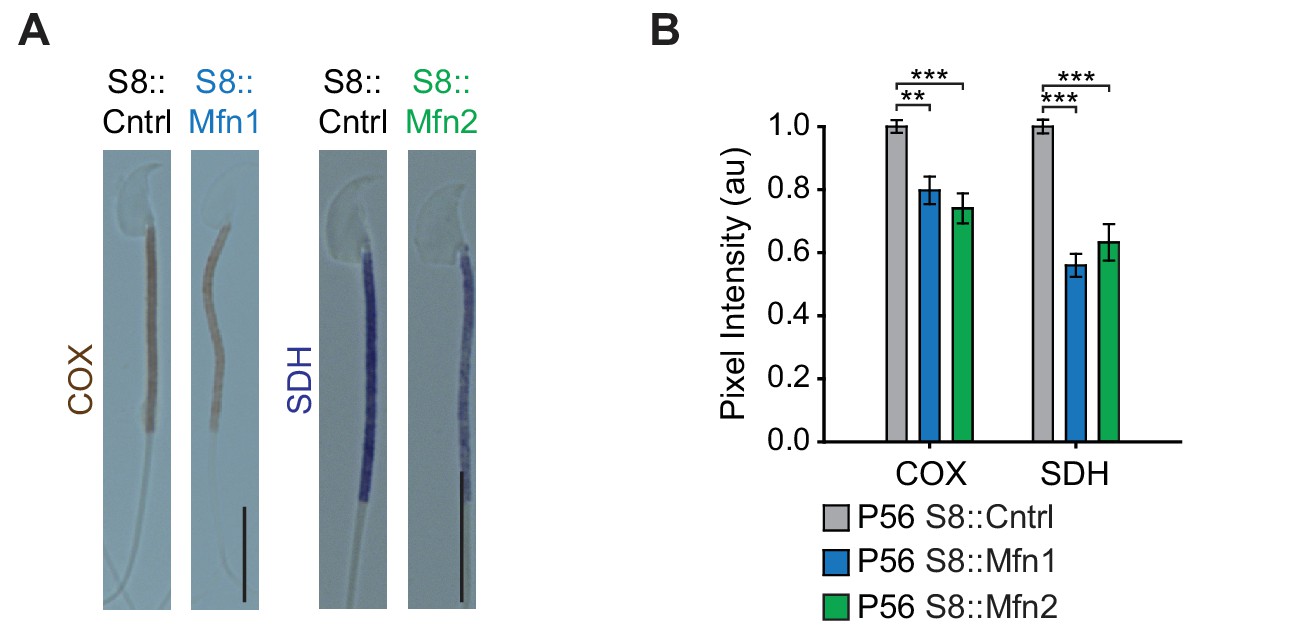
OXPHOS deficiency in Mfn1 and Mfn2 null sperm.
(A) COX/SDH enzyme histochemistry in isolated spermatozoa from S8::Mfn1 and S8::Mfn2 mice. S8::Dm mice do not produce any sperm. Scale bars, 10 µm. (B) Quantification of COX and SDH pixel intensity from midpieces of isolated spermatozoa. N = 3. Data are represented as mean ± SEM. ***p≤0.001; **p≤0.01. For statistical tests used, see the Materials and methods section.
Figure 9
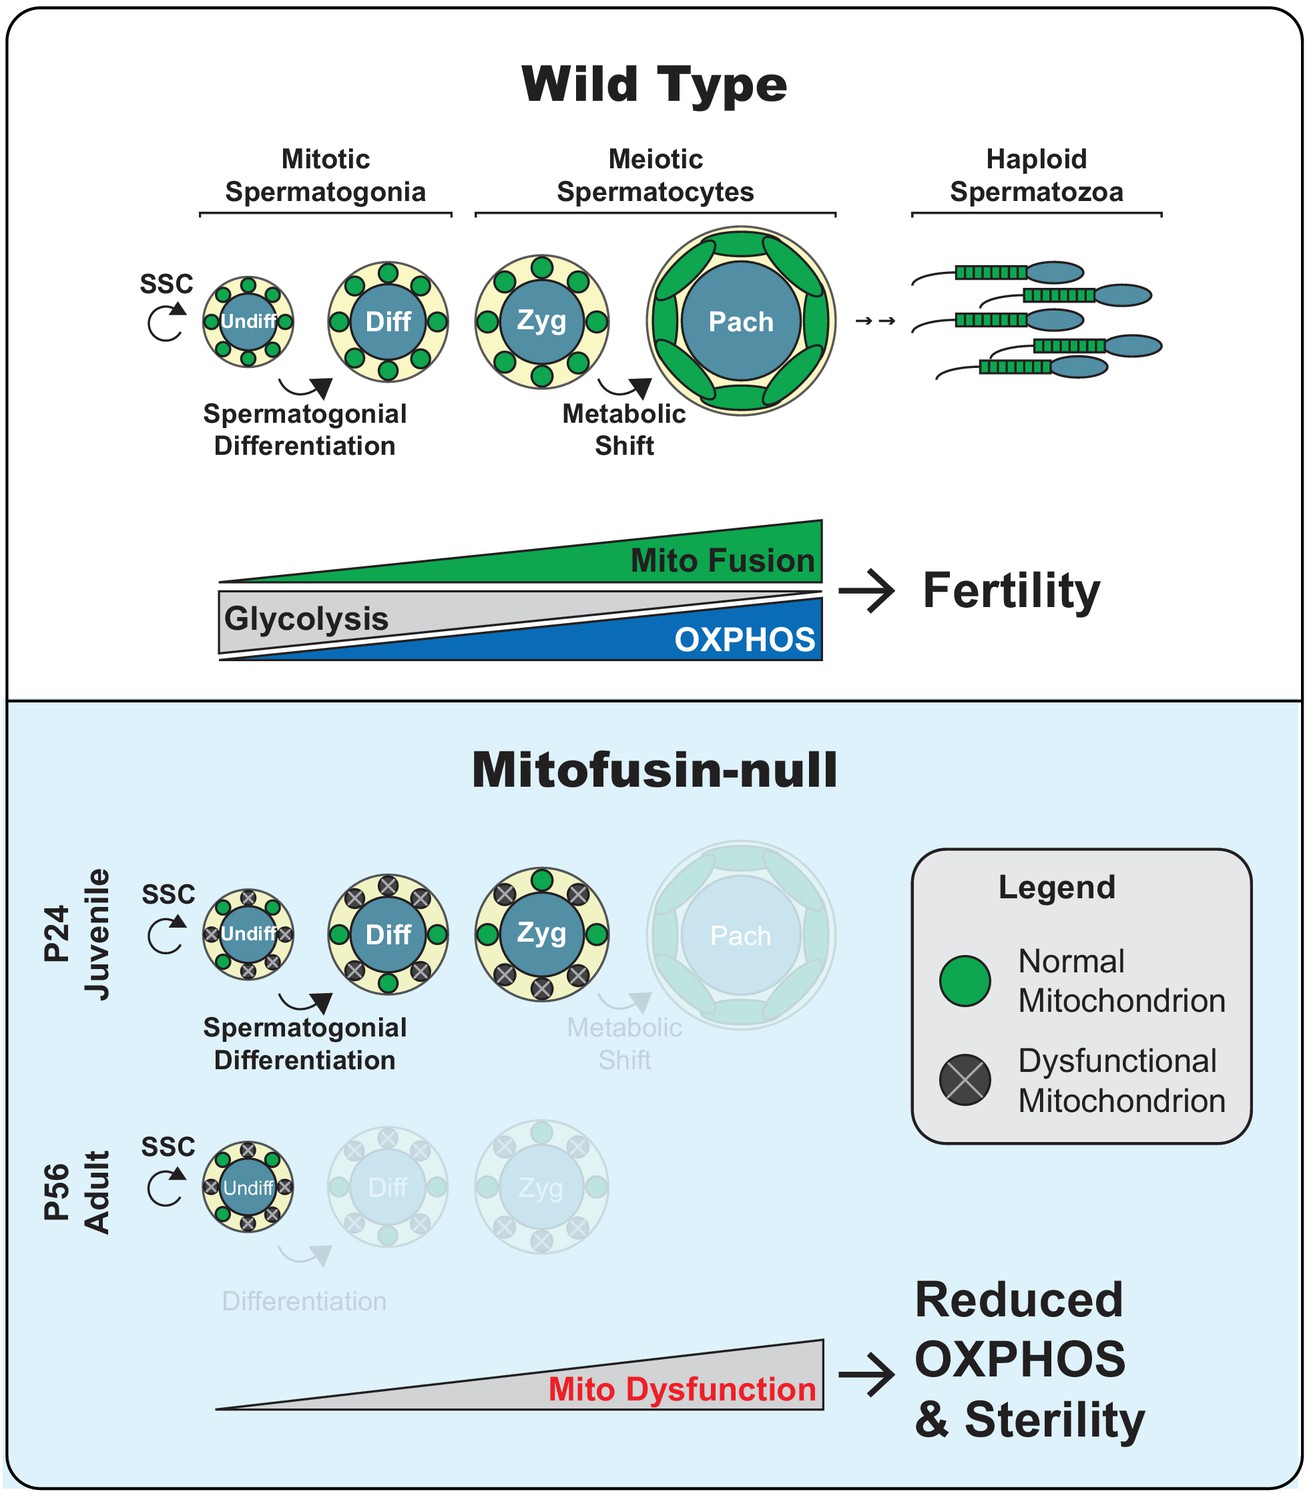
Model.
Top panel. Two key transitions during normal spermatogenesis are indicated: spermatogonial differentiation and the metabolic shift during meiosis. The metabolic shift includes increased mitochondrial biogenesis, fusion, and OXPHOS. Bottom panel. In juvenile mitochondrial fusion-deficient mice, spermatocytes have functionally heterogeneous mitochondria that are unable to accomplish this metabolic shift, resulting in meiotic arrest. Adult mutant mice have an earlier defect, wherein all differentiating germ cell types are lost but self-renewal of stem-like undifferentiated spermatogonia remains intact.
Videos
Video 1
Movie of sperm isolated from P56 S8::Control mice.
Video 2
Movie of sperm isolated from P56 S8::Mfn1 mice.
Video 3
Movie of sperm isolated from P56 S8::Mfn2 mice.
Video 4
EM tomogram of mitochondrion from P56 S8::Dm testis section showing that all cristae in the 400 nm testis section that can be traced back to the mitochondrial inner membrane are connected via cristae junctions.
Scale bar 200 nm.
Additional files
-
Supplementary file 1
Table showing enriched Gene Ontology terms from SILAC experiments in MEFs.
SILAC was performed on mitochondria isolated from WT or Mfn1/Mfn2-null MEFs. Related to Figure 6A.
- https://cdn.elifesciences.org/articles/51601/elife-51601-supp1-v4.xlsx
-
Supplementary file 2
Table showing the SILAC ratios for individual mitochondrial proteins.
Related to Figure 6B.
- https://cdn.elifesciences.org/articles/51601/elife-51601-supp2-v4.xlsx
-
Transparent reporting form
- https://cdn.elifesciences.org/articles/51601/elife-51601-transrepform-v4.pdf
Download links
A two-part list of links to download the article, or parts of the article, in various formats.
Downloads (link to download the article as PDF)
Open citations (links to open the citations from this article in various online reference manager services)
Cite this article (links to download the citations from this article in formats compatible with various reference manager tools)
Mitochondrial fusion is required for spermatogonial differentiation and meiosis
eLife 8:e51601.
https://doi.org/10.7554/eLife.51601


