Axon TRAP reveals learning-associated alterations in cortical axonal mRNAs in the lateral amygdala
- University of Connecticut, United States
- Karolinska Institutet, Sweden
- New York University, United States
- Nathan Kline Institute for Psychiatry Research, United States
- New York University School of Medicine, United States
Figures
Figure 1 with 1 supplement
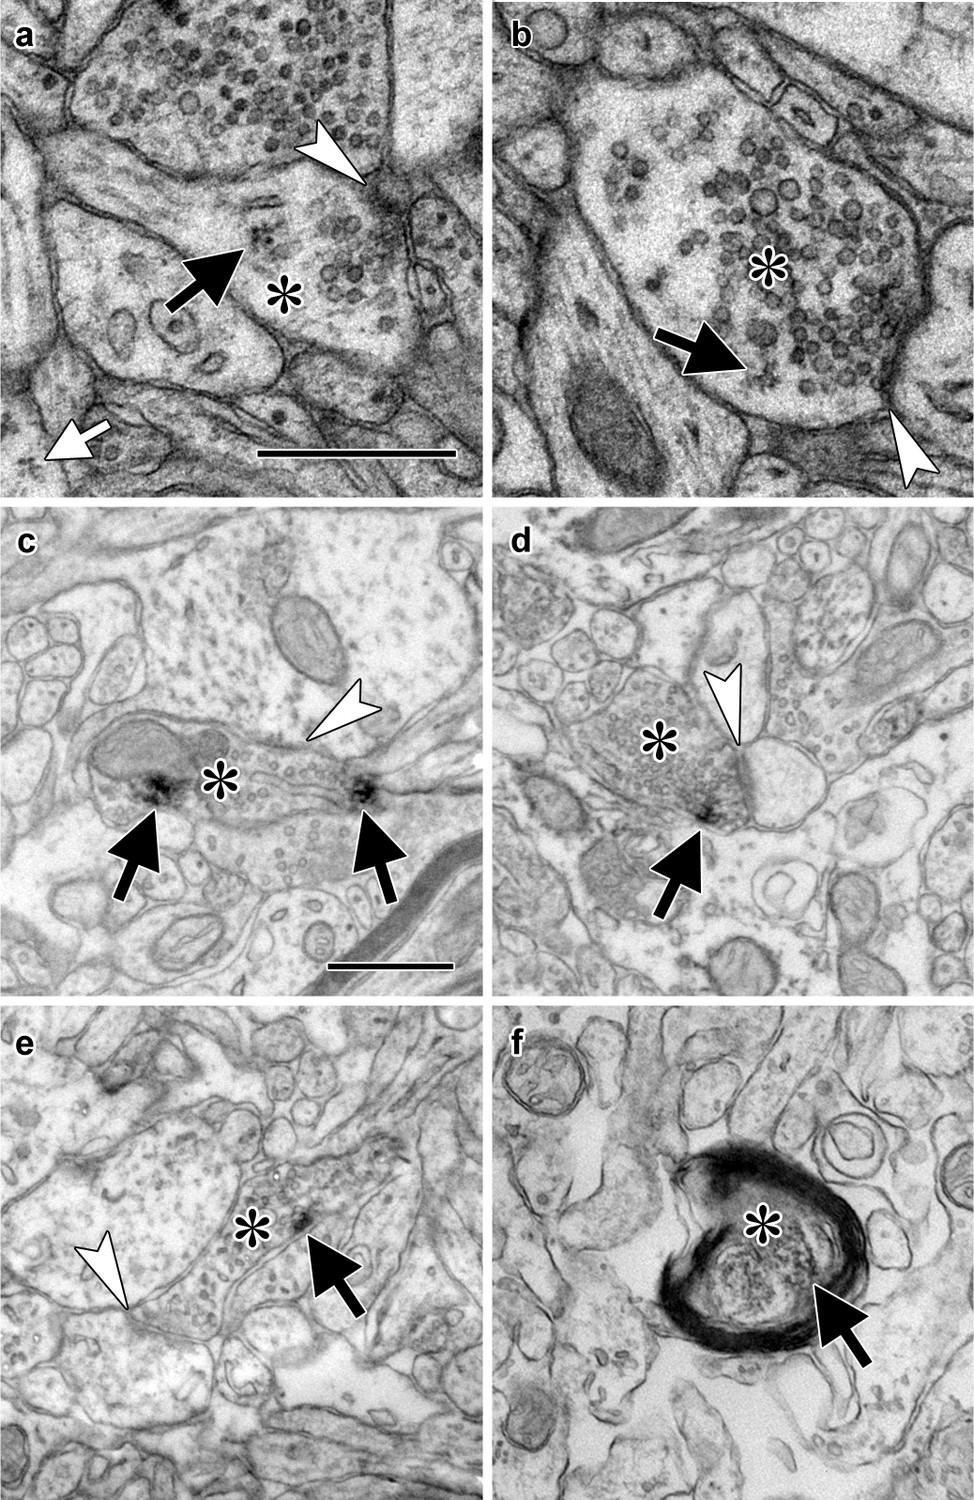
Electron micrographs of translation machinery in lateral amygdala axons.
(a–b) Polyribosomes (black arrows) in axonal boutons (asterisks). A polyribosome in an astrocytic process (white arrow) is visible at the lower left of panel (a). (c–e) Axonal boutons (asterisks) containing immunolabeling (black arrows) for eIF4E (c), eIF4G1 (d), and eIF2α (e). White arrowheads indicate asymmetric synapses onto dendritic spines (a, d, and e) and shafts (b and c). (f) Myelinated axon (asterisk) containing immunolabel for ribosomal protein s6 (arrow). Scale bars = 500 nm.
Figure 1—figure supplement 1
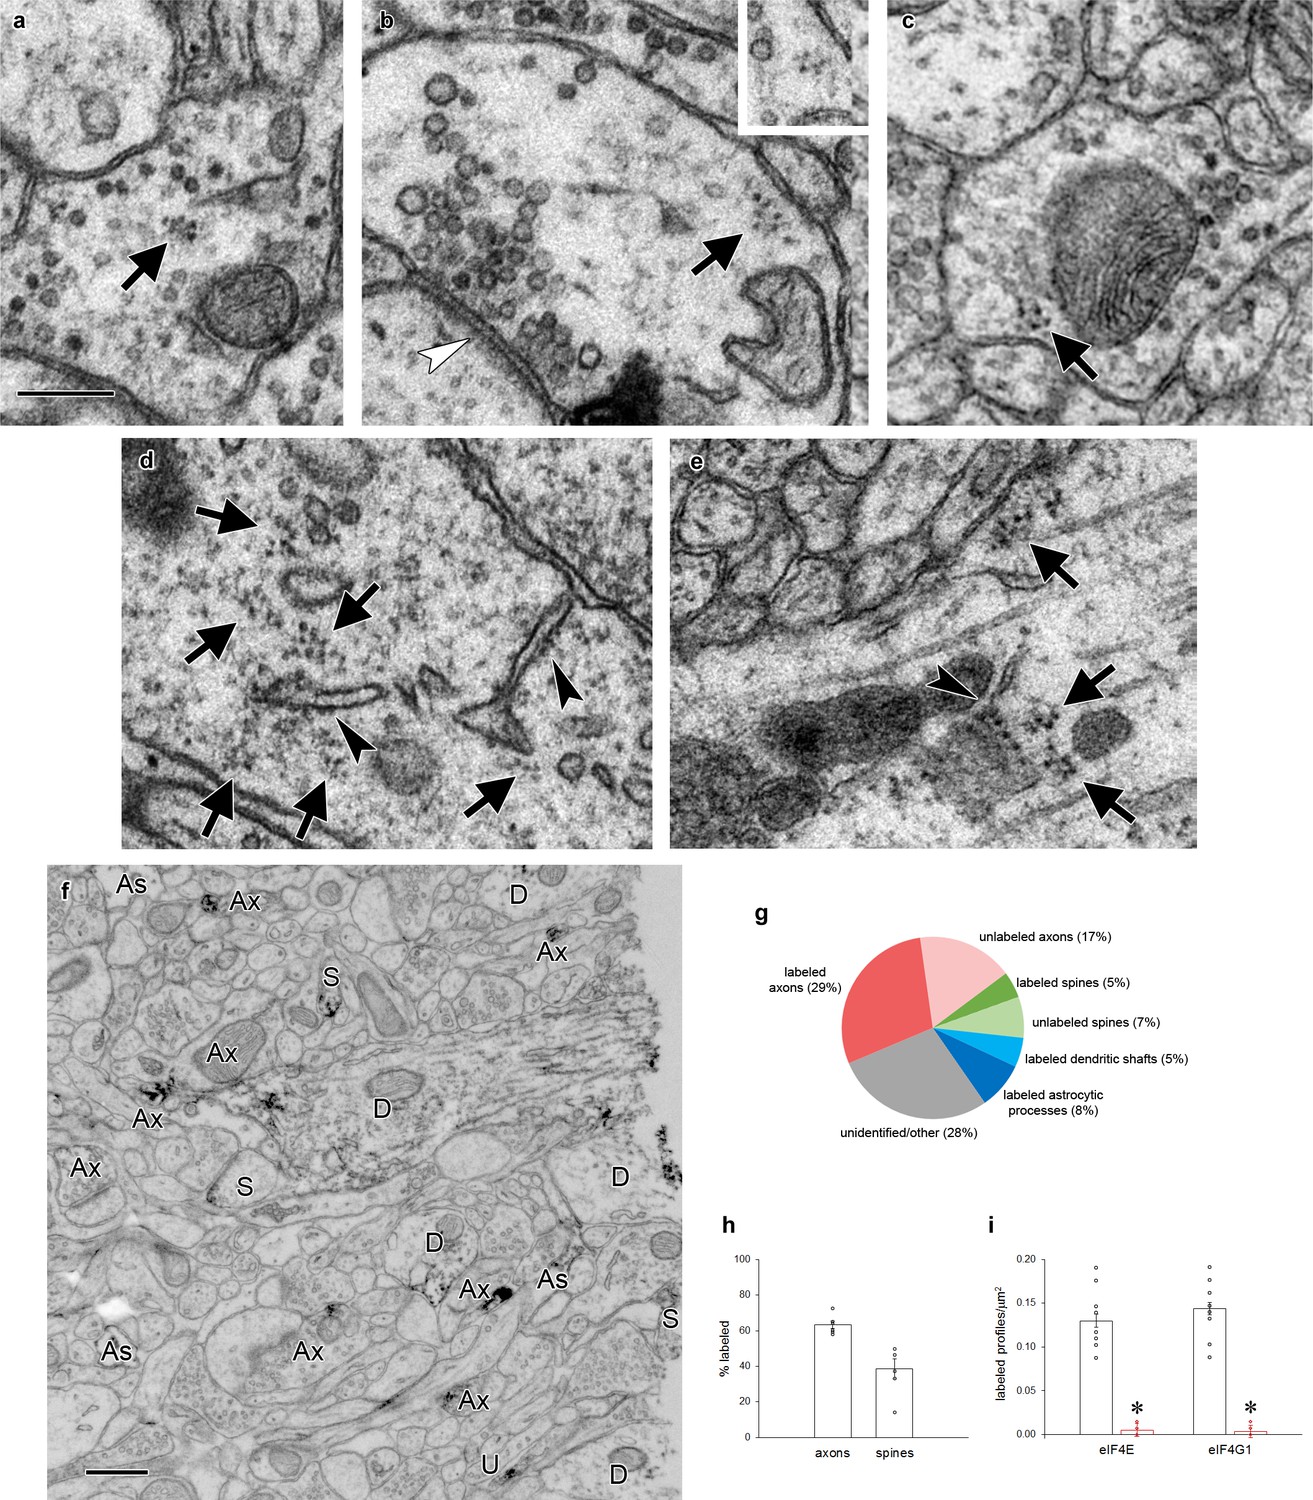
Polyribosomes and translation factors in axons.
(a–c) Examples of polyribosomes (arrows) in axonal boutons. Inset in (b) shows the same polyribosome on an adjacent serial section. (d–e) Copious polyribosomes (arrows) in a neuronal cell body (d) and a large dendritic shaft (e). Rough endoplasmic reticulum (arrowheads) is visible in both structures. (f) Representative field of tissue immunolabeled for eIF4E, with labeled axons (Ax), astrocytic processes (As), dendritic shafts (D), and dendritic spines (S) indicated. Profiles were followed through serial sections to confirm identifications. (g) Breakdown of all profiles in a 4 µm2 field of one section near the center of a serial EM volume of tissue immunolabeled for eIF4E. Six series were averaged. 28% of profiles could not be unambiguously identified within the series. (h) Percent of axons and spines in a 4 µm2 field that were immunolabeled for eIF4E when followed through series. 100% of dendritic shafts and astrocytic processes contained label. (i) Number of labeled profiles per square micron on 10 randomly chosen, non-consecutive 10 × 10 µm electron micrographs of tissue labeled with eIF4E and eIF4G1 antibodies (black) or antibodies preadsorbed with immunizing peptide (red). Densities were compared by ANOVA: eIF4E F(1,18)=133.5, p>0.00001; eIF4G1 F(1,18)=199.3, p>0.00001. Imaging and analysis were done with experimenters blind to whether the antibody was preadsorbed.
Figure 2
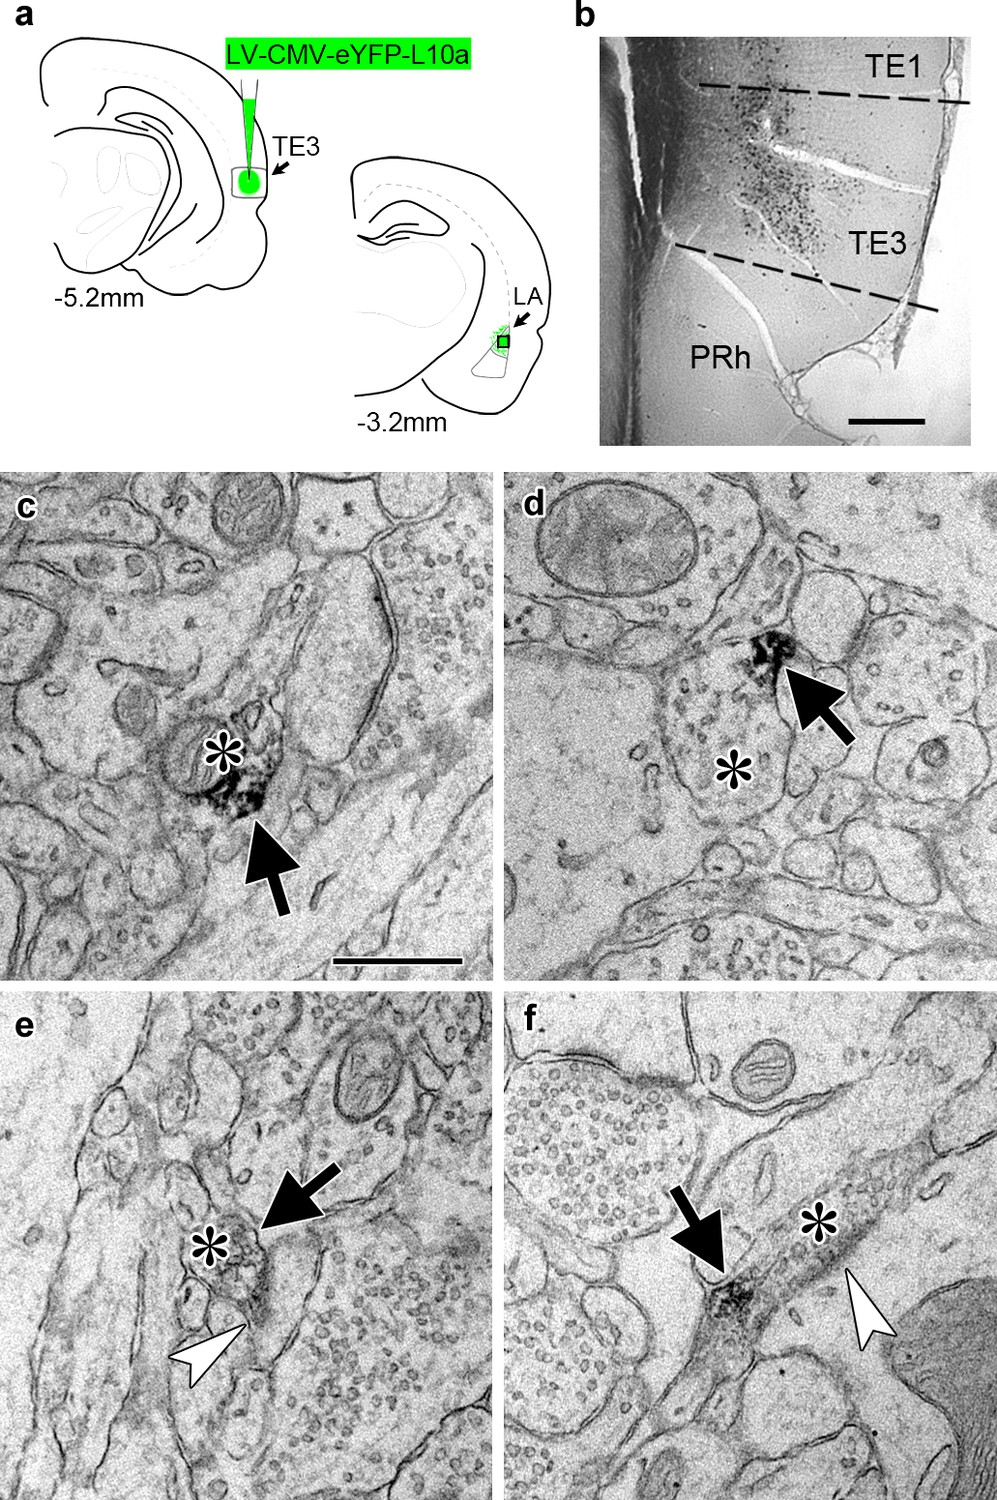
Transport of a tagged ribosomal L10a protein to cortical projection axons.
(a) Schematic of injection site in cortical area TE3 and its lateral amygdala (LA) projection area, with AP coordinates from Bregma noted. The black square indicates the area of LA sampled for EM. PRh: perirhinal cortex. (b) Immunolabeling of YFP in transfected TE3. (c–f) Electron micrographs of LA showing axonal boutons (asterisks) containing YFP immunolabel (black arrows). The boutons in (e) and (f) are forming asymmetric synapses (white arrowheads) on a dendritic spine head (e) and a dendritic shaft (f). Scale bars = 500 µm in (b) and 500 nm in (c–f).
Figure 3 with 4 supplements
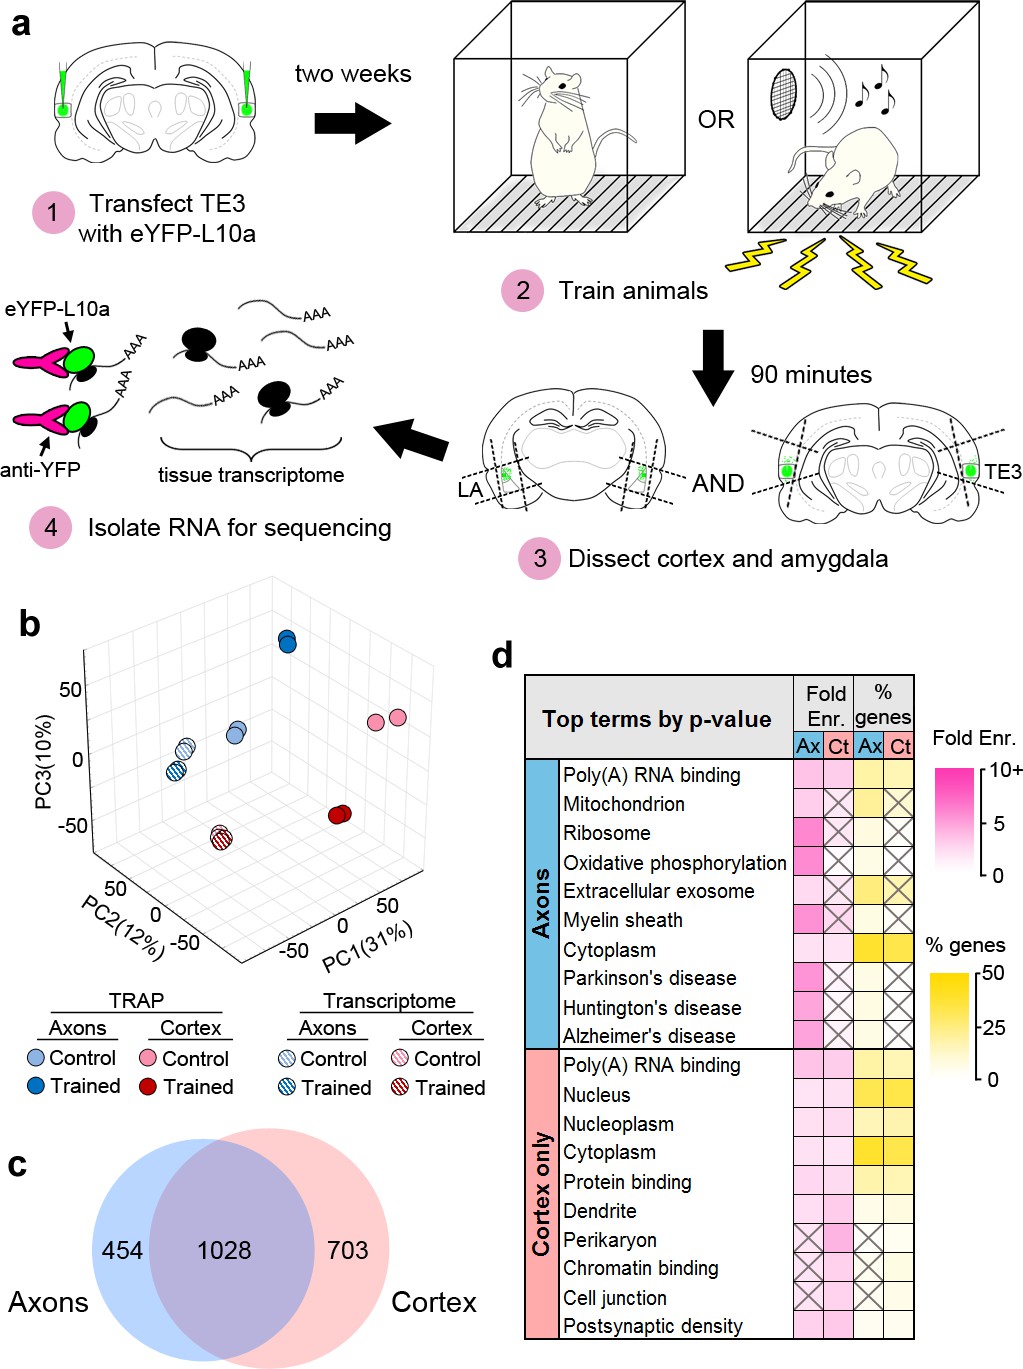
Isolation of the TE3 axonal translatome.
(a) Experimental workflow (see text). (b) Principal component analysis of all experimental replicates. (c) Overlap between axonal and cortical translatomes. (d) Most enriched GO terms and KEGG pathways in axonal and cortex-only translatomes, sorted by Benjamini-Hochberg adjusted p-value. Gray X’s indicate effects that were not significant (adjusted p-value>0.05).
Figure 3—figure supplement 1
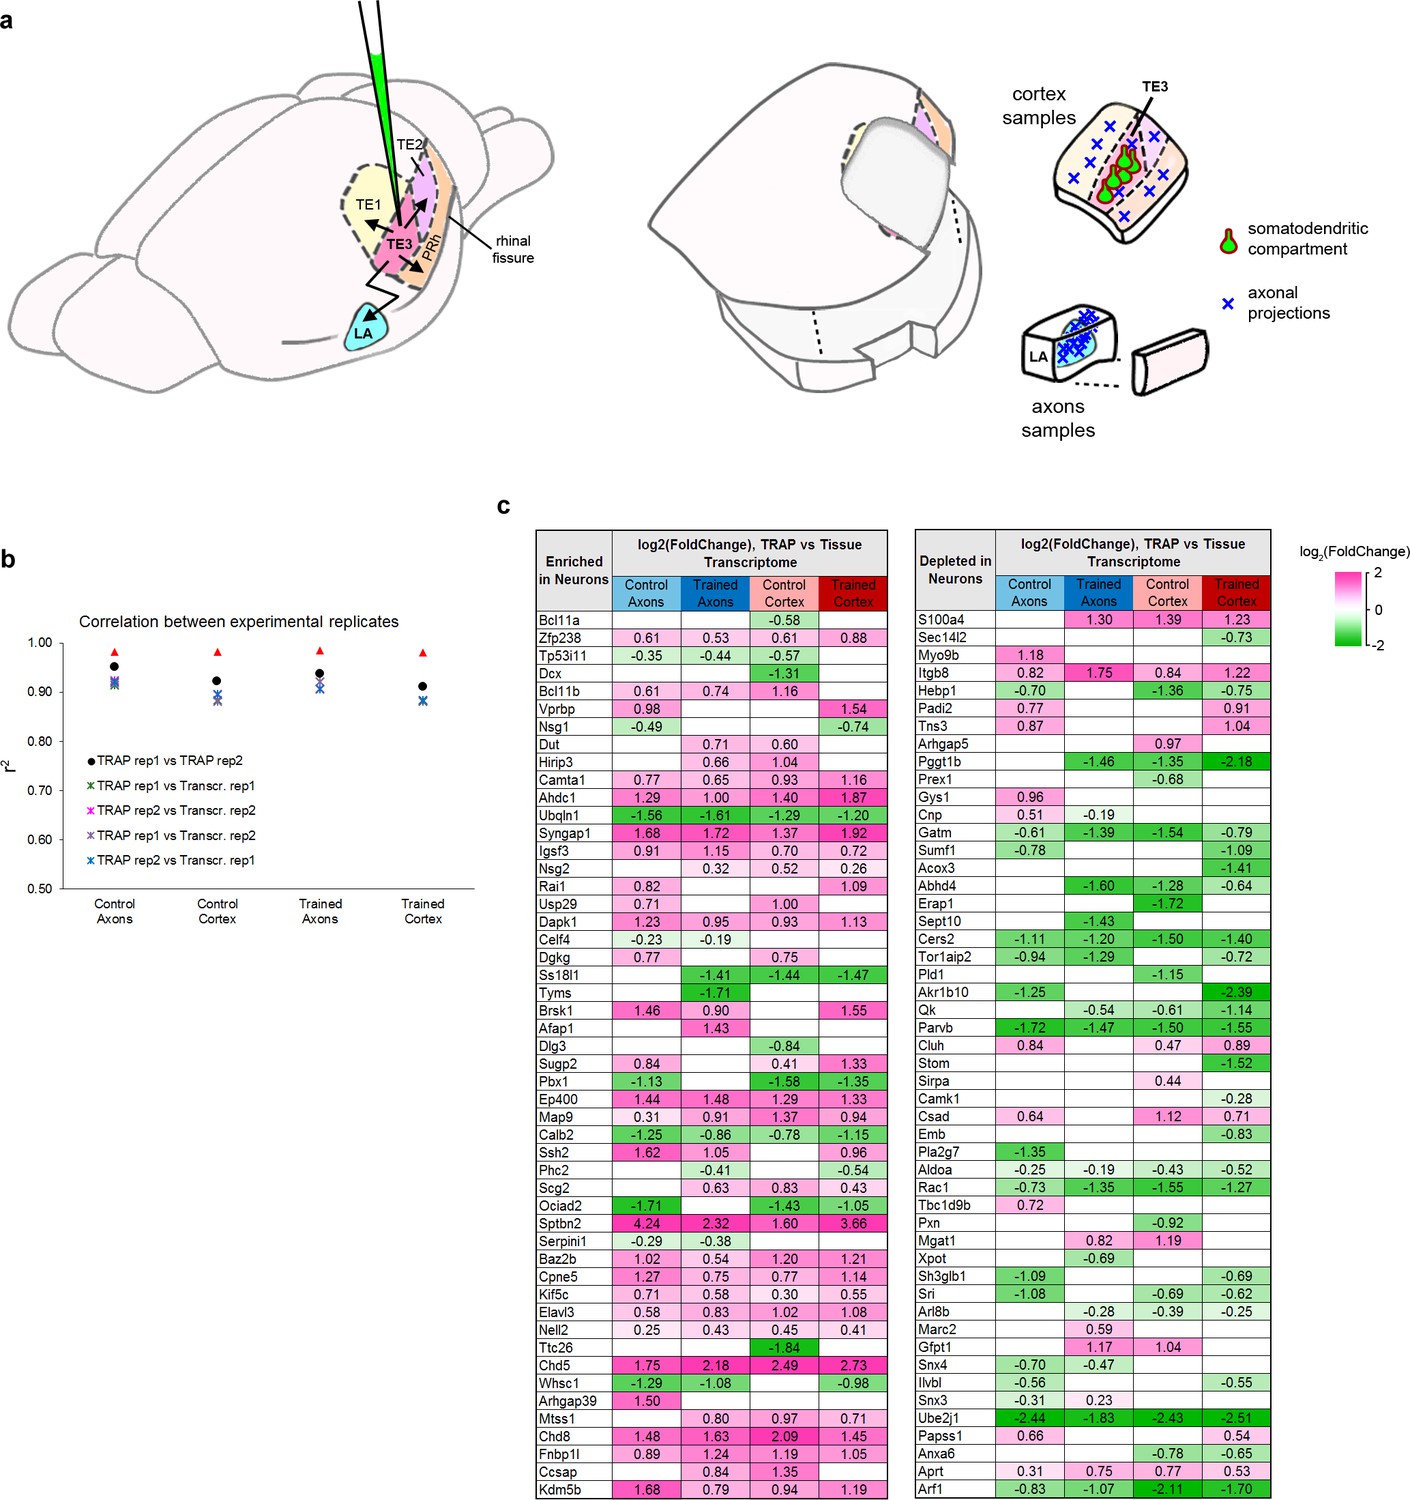
Collection of TRAP samples.
(a) Left: Illustration of LV-CMV-eYFP-L10a injection into cortical area TE3, showing TE3 projections to cortical areas TE1, TE2, and perirhinal (PRh), and the lateral amygdala (LA). Right: Illustration of tissue sampling for TRAP. After separating the hemispheres and bisecting along the rhinal fissure, cortex samples were collected by dissecting wide margins around TE3 so that portions of adjacent cortical areas and the underlying white matter were included. A separate block was dissected from the ventral half (the ‘axons’ sample), containing the LA, along with the immediately adjacent small area of caudate that also receives projections from TE3. The adjacent area of cortex was removed to ensure that these samples did not contain any stray pieces of perirhinal cortex that could contain cortico-cortical axons. Cortical divisions and projection patterns adapted from Romanski and LeDoux (1993), Shi and Cassell (1997), and Farb and Ledoux (1999). (b) Correlation coefficients of log2(FPKM) between experimental replicates, calculated from all raw data. (c) The top genes in the proteome of adult mouse cortex identified as enriched (left) or depleted (right) in neurons versus other cell types, sorted by magnitude of enrichment (Sharma et al., 2015). The top 50 genes that were also significantly enriched or depleted in our TRAPed samples versus the tissue transcriptome are shown, with the normalized magnitude of change. Significance was defined as an adjusted p value of < 0.05. Neuron-enriched genes were mostly enriched in TRAPed samples (36 of 50), while neuron-depleted genes were depleted from TRAP samples (34 of 50).
Figure 3—figure supplement 2
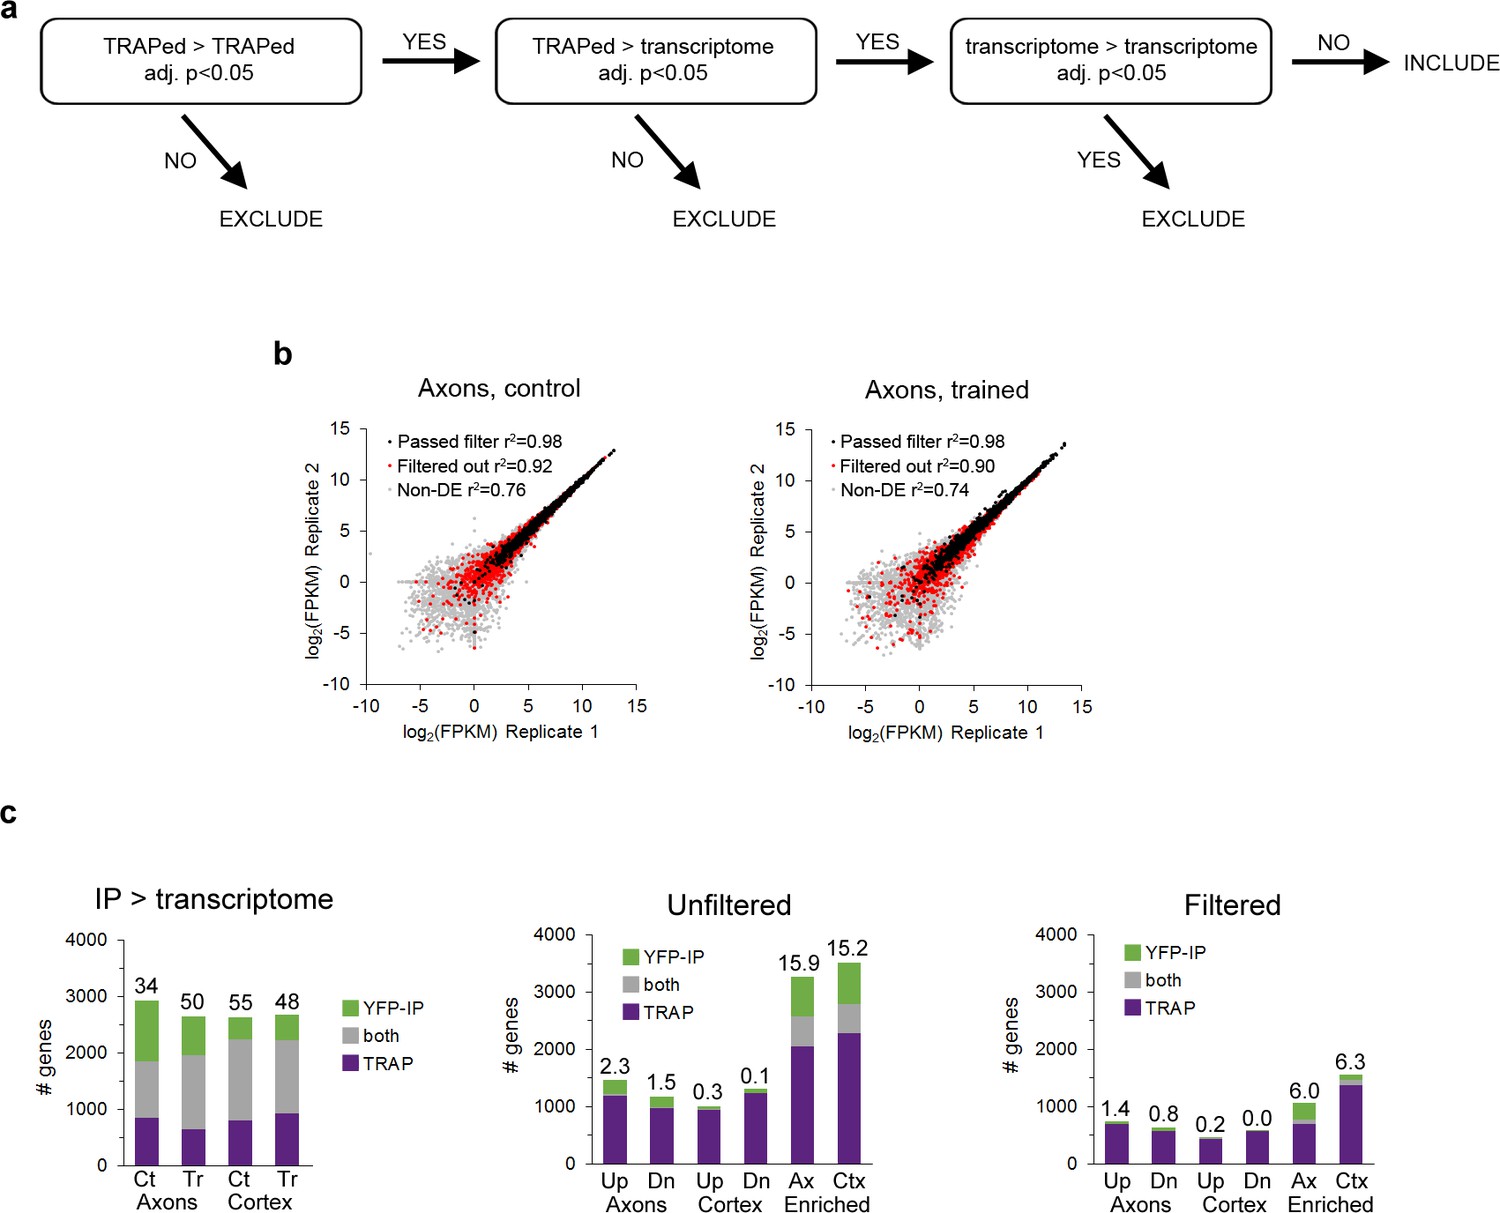
Filtering of DGE results.
(a) Strategy for removing false positives from results of differential gene expression analysis for comparisons between pairs of TRAPed groups. (b) FPKM values of TRAPed genes from axons in experimental replicates of the control (left) and trained (right) groups. All genes defined as axonal that passed the filtering procedure are indicated with black markers, axonal genes that were removed by filtering with red, and genes that were not axonal in gray. (c) Overlap between DGE results in the TRAP and YFP-IP experiments. Left: genes enriched in the TRAP and YFP IP samples versus the transcriptome for all four experimental conditions. Numbers above the bars indicate percent overlap. Center, right: Overlap between genes regulated in axons and cortex (Up, upregulated; Dn, downregulated) or enriched in the axons versus cortex in the unfiltered data (center) and filtered data (right).
Figure 3—figure supplement 3
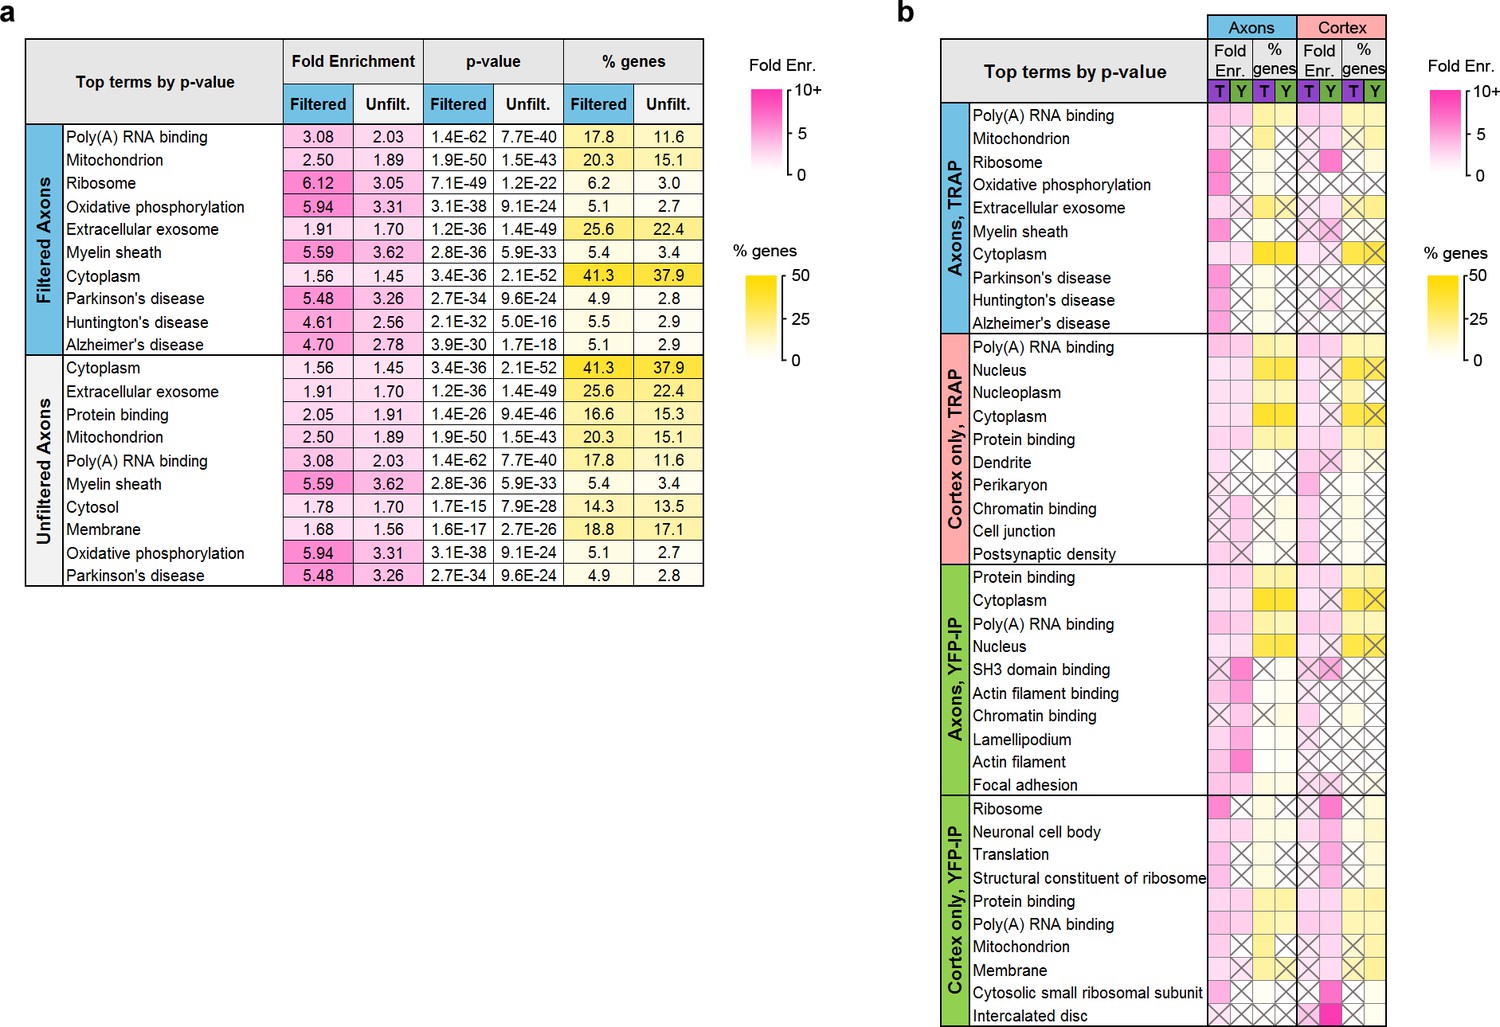
Comparison of TRAP and YFP-IP experiments.
(a) Top GO and KEGG Pathway terms enriched in the filtered and unfiltered sets of axonal genes, sorted by Benjamini-Hochberg adjusted p-value. (b) Top GO Terms and KEGG pathways in axonal and cortex-only translatomes in TRAP and YFP-IP samples, sorted by Benjamini-Hochberg adjusted p-value. Gray X’s indicate effects that were not significant (adjusted p-value>0.05).
Figure 3—figure supplement 4
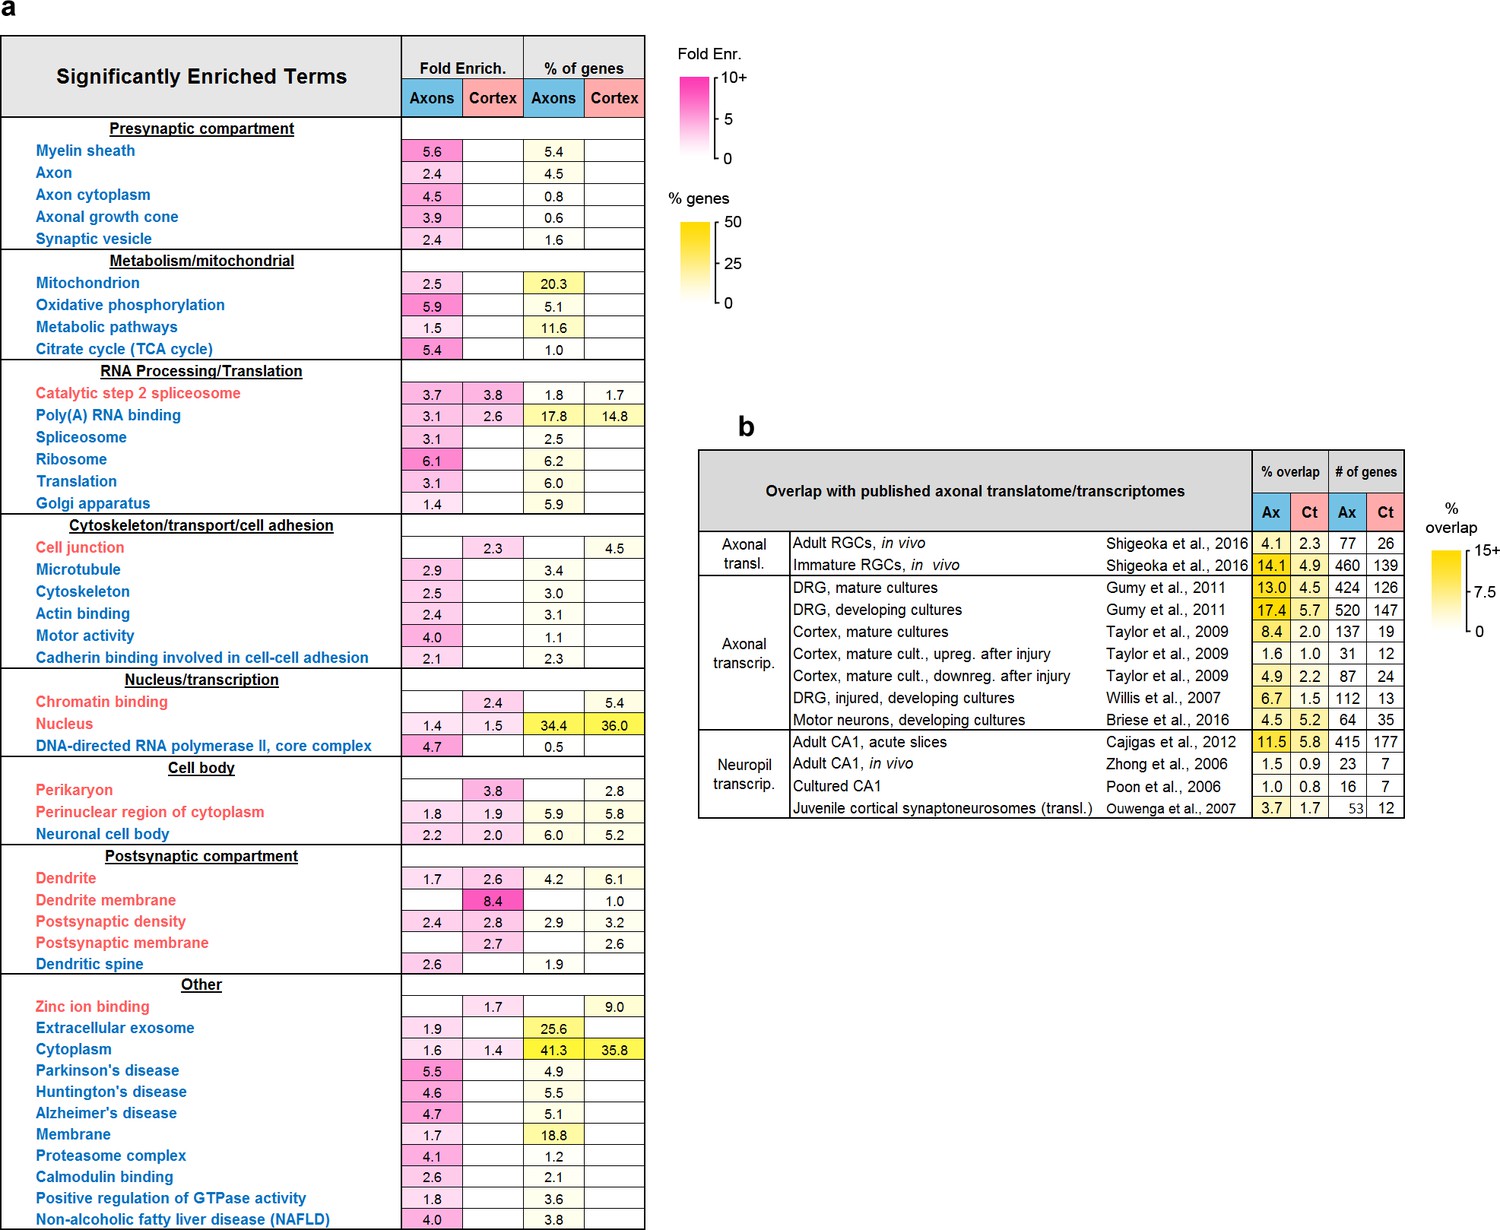
Composition of the axonal translatome.
(a) Groups of related terms enriched in axonal, cortex-only, or both gene sets. Text color indicates higher enrichment in axons (blue) or cortex (red). Only significant effects (adjusted p-value<0.05) are shown. (b) Overlap (% intersection/union) between the axonal and cortex-only and published translatomes and transcriptomes, and number of overlapping genes.
Figure 4 with 3 supplements
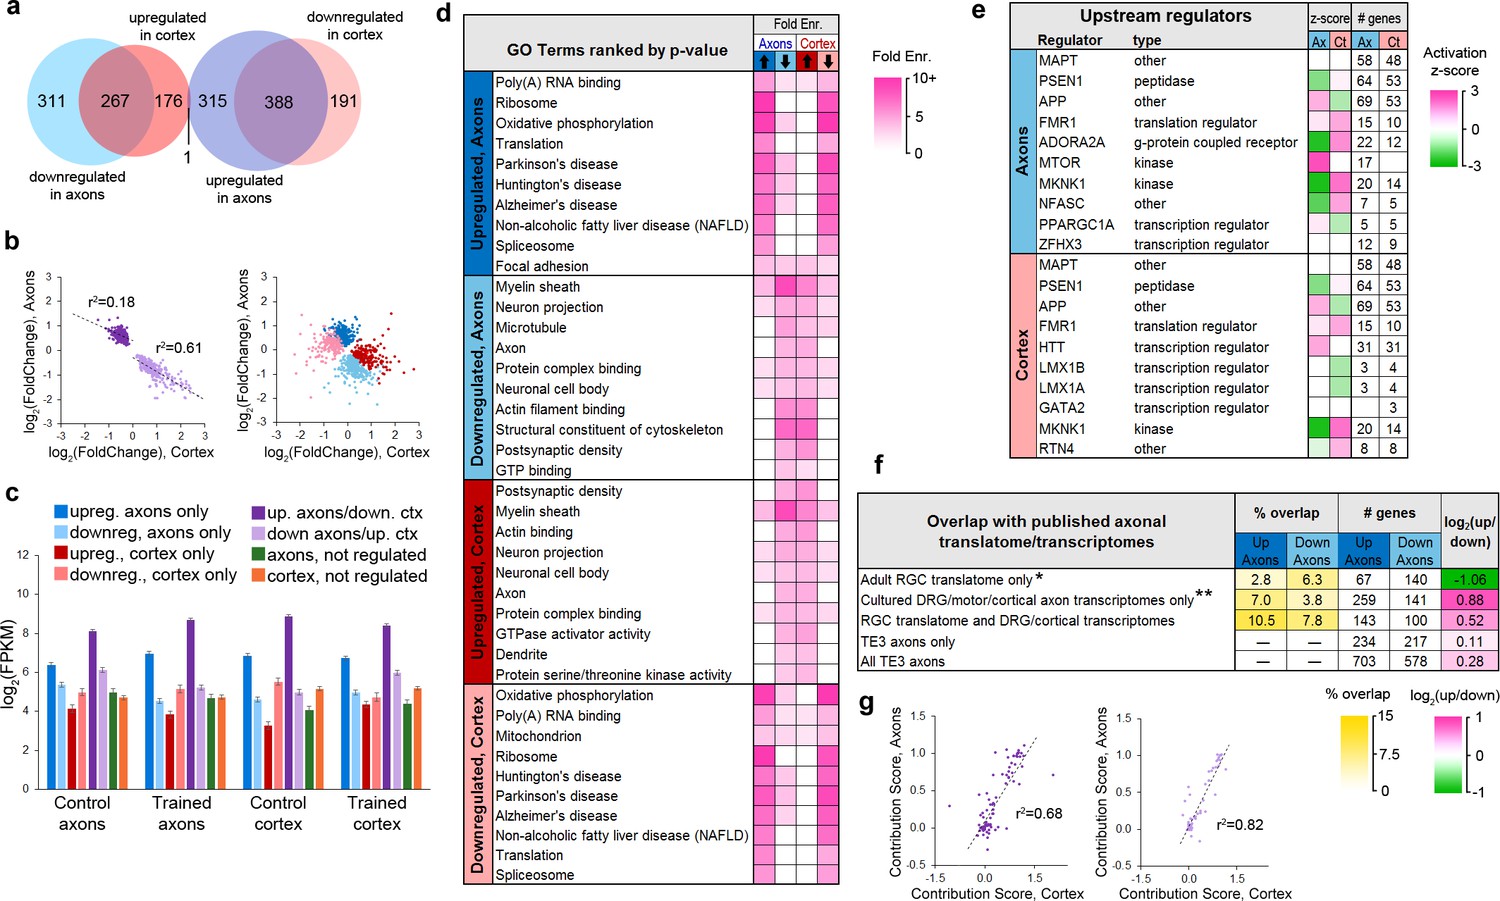
Learning-associated changes in the axonal translatome.
(a) Overlap of training effects in the axons and cortex. (b) Correlations between effect sizes in the axons and cortex for genes differentially expressed in both areas after learning (left) or only one area (right). Regression lines are shown for correlations significant at p<1 × 10⁻⁵. (c) Mean expression levels of genes in each group with respect to training effects. Results of ANOVA and post hoc test are given in Supplementary file 5. Error bars = s.e.m. (d) Top GO term and KEGG pathways enriched >3 fold in learning-regulated genes, ranked by Benjamini-Hochberg adjusted p-value. Highly redundant terms are not shown. (e) Top regulatory pathways affected by training in axons and cortex, sorted by adjusted p-value. Activation z-score represents the probability of a pathway being activated or inhibited after learning. (f) Overlap between genes up- or downregulated in axons by learning and published axonal translatomes and transcriptomes. * Data from Shigeoka et al. (2016); ** Data from Gumy et al. (2011), Willis et al. (2007), Taylor et al. (2009), and Briese et al. (2016). (g) For genes that had multiple transcripts and were regulated by training in both axons and cortex, the contribution of each transcript to the gene-level effects in axons and cortex were correlated for genes upregulated in axons and downregulated in cortex (left) and genes downregulated in axons and upregulated in cortex (right). The contribution score was calculated as (change in FPKM transcript)/(change in FPKM gene).
Figure 4—figure supplement 1
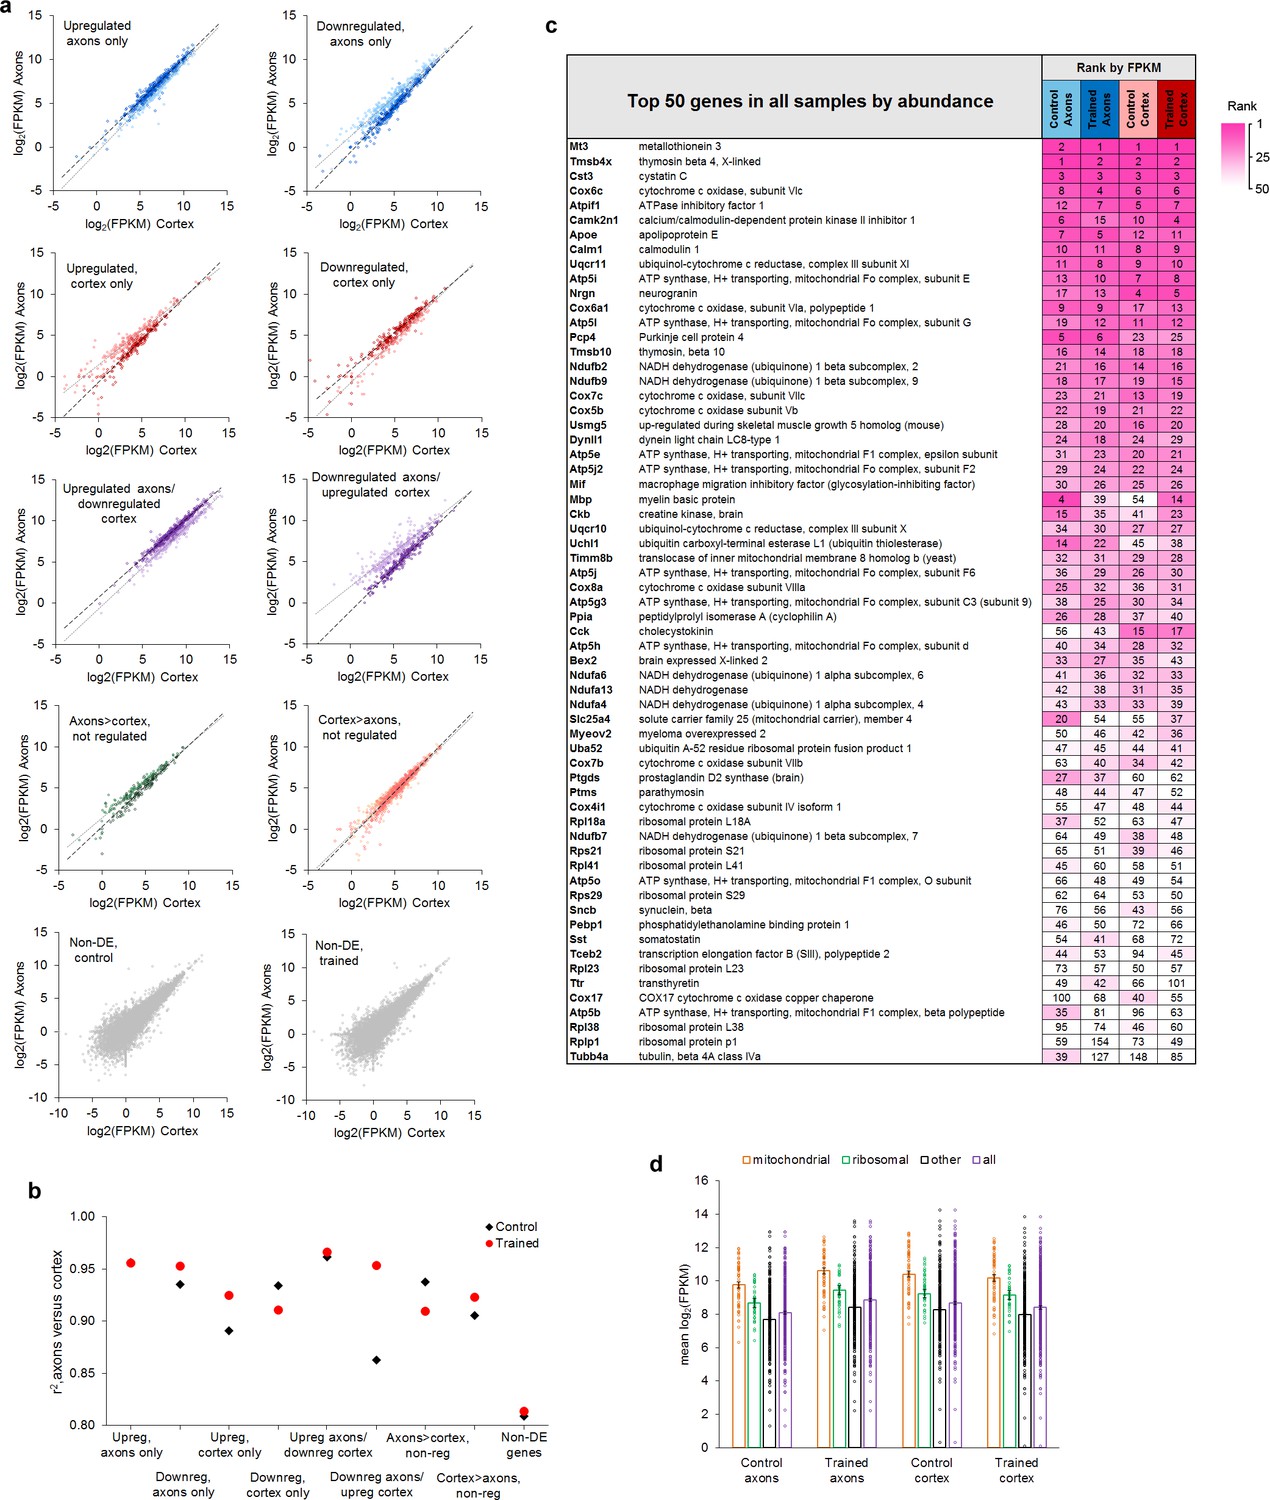
Relative abundance of genes in axons and cortex.
(a) Plots of log2(FPKM) in cortex versus axons in control (light markers) and trained (dark markers) groups, grouped by training effects. (b) Correlation coefficients between log2(FPKM) in cortex and axons for each training effect. (c) 63 genes representing the top 50 genes from each of the four groups, sorted by average rank. (d) Mean FPKM of genes upregulated in axons and downregulated in cortex after training, grouped into mitochondrial respiration (n = 55), ribosomal proteins (n = 39), the remainder (n = 294), and the full gene set (n = 388). Error bars = s.e.m.
Figure 4—figure supplement 2
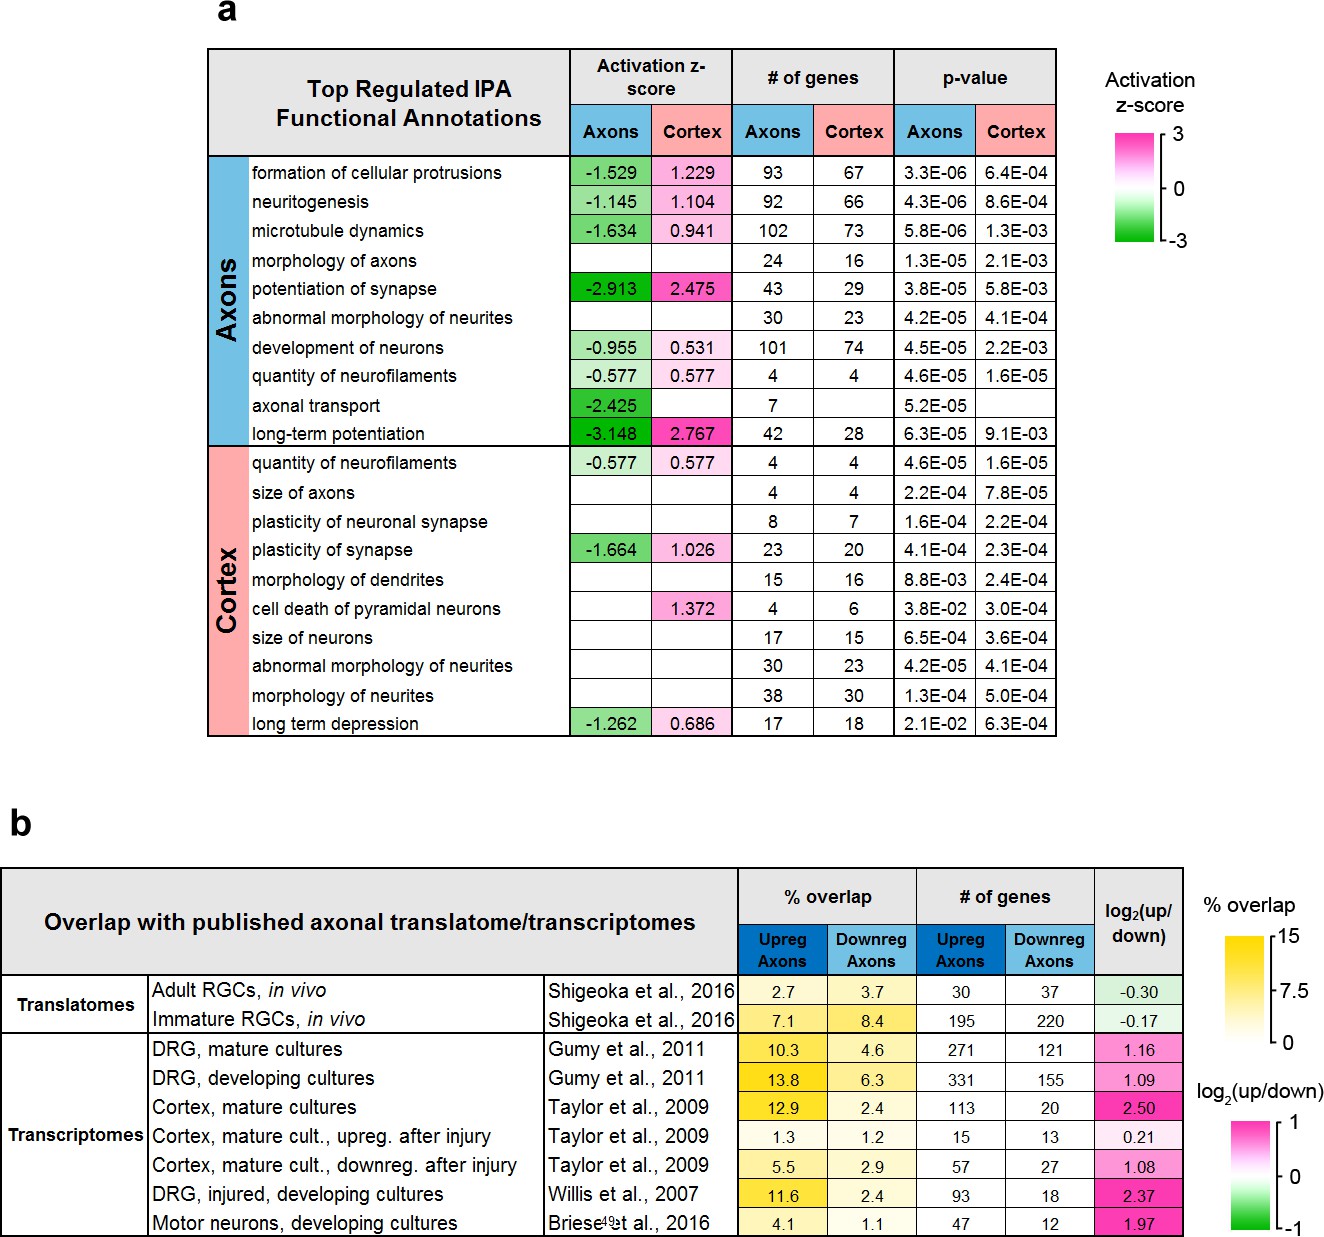
Ingenuity Pathway Analysis and comparison with published translatomes and transcriptomes.
(a) Functional annotations significantly regulated by training in the axons and cortex. (b) Overlap between genes regulated in axons and published translatomes and transcriptomes.
Figure 4—figure supplement 3
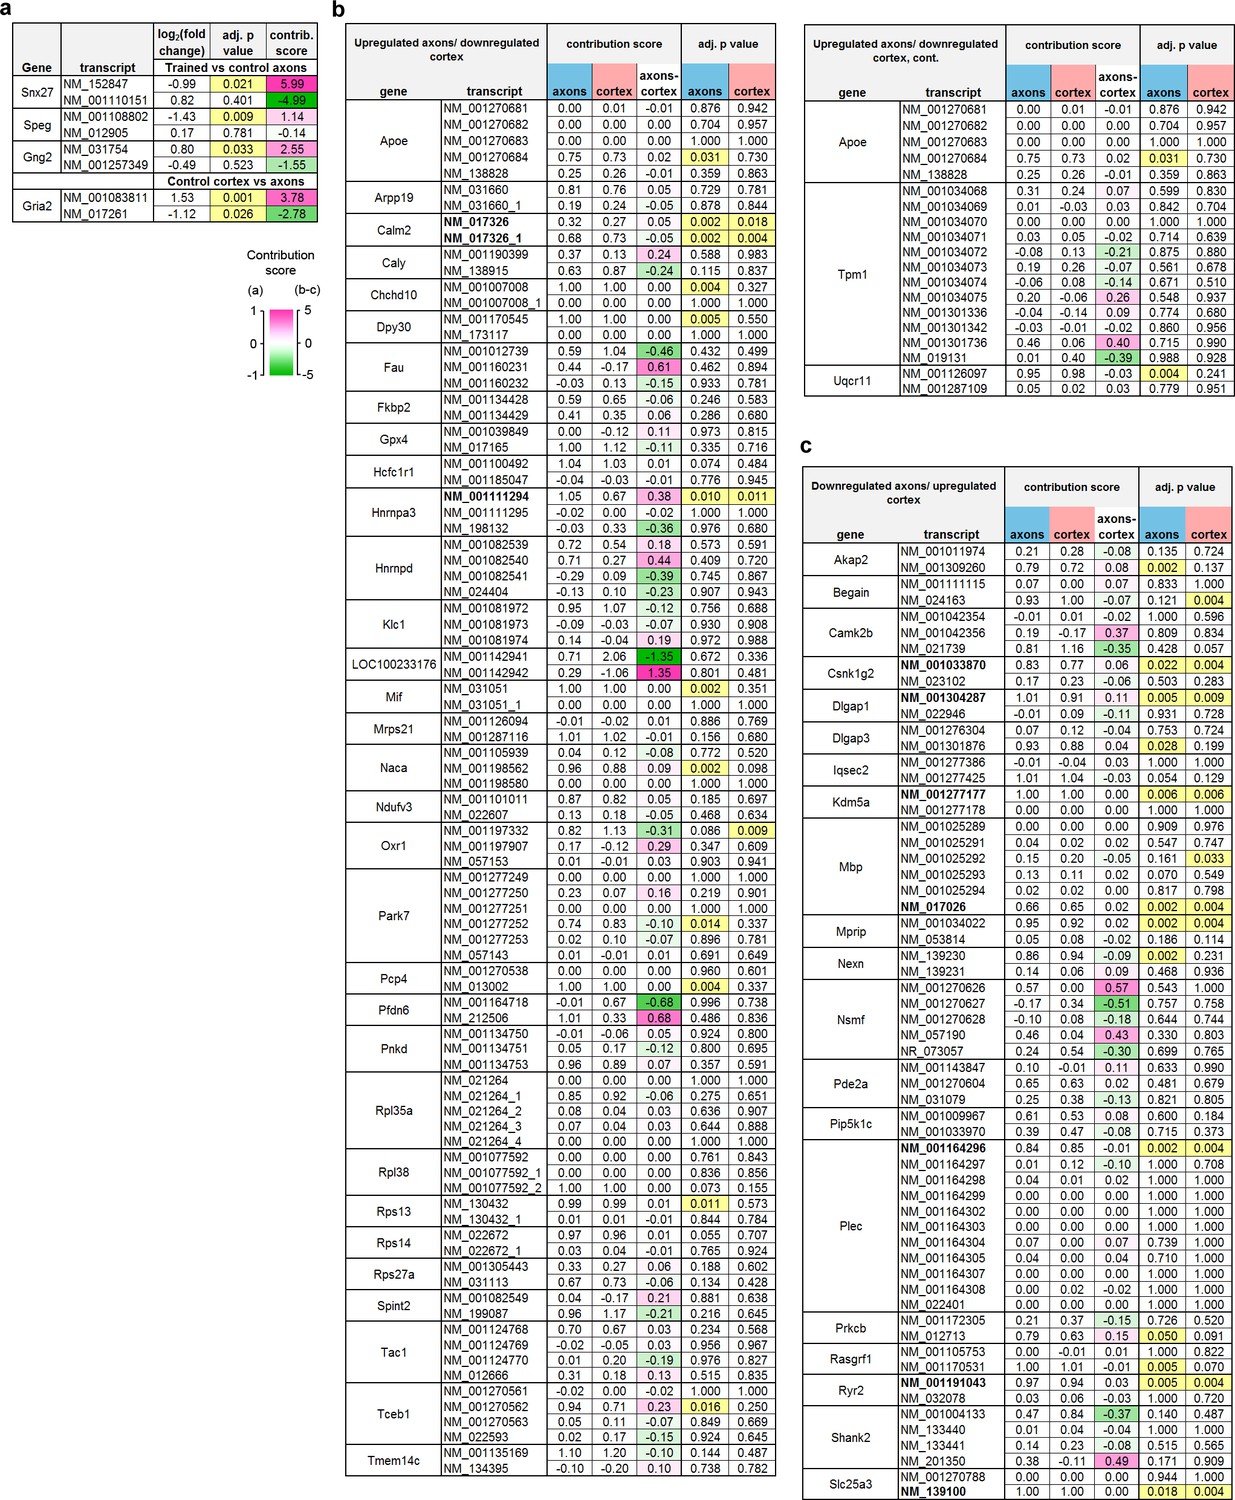
Transcript-level analysis.
The contribution score (change in FPKM transcript/change in FPKM gene) indicates the effect of training on a transcript relative to the net effect on all transcripts of the same gene, with a negative score indicating differences in opposite directions between the transcript and gene. Adjusted p-values for each transcript are highlighted at <0.05. (a) Three transcripts were found to be regulated by training in the axons that were not differentially expressed at the gene level. In each case, a second transcript was affected non-significantly in the opposite direction. The two transcripts of Gria2 were differently distributed in the control group, with one enriched in axons and the other in cortex. (b–c) Genes regulated in both axons and cortex (b; upregulated in axons/downregulated in cortex, c; downregulated in axons/upregulated in cortex) with multiple transcripts in the dataset. The difference between the score in the axons and cortex (‘axons – cortex’) indicates the degree of asymmetry, with positive numbers indicating transcripts which were affected proportionally more in the axons than cortex. Values near zero indicate transcripts that were similarly affected in both areas. Transcripts with significant effects in both areas are shown in bold type.
Figure 5 with 1 supplement
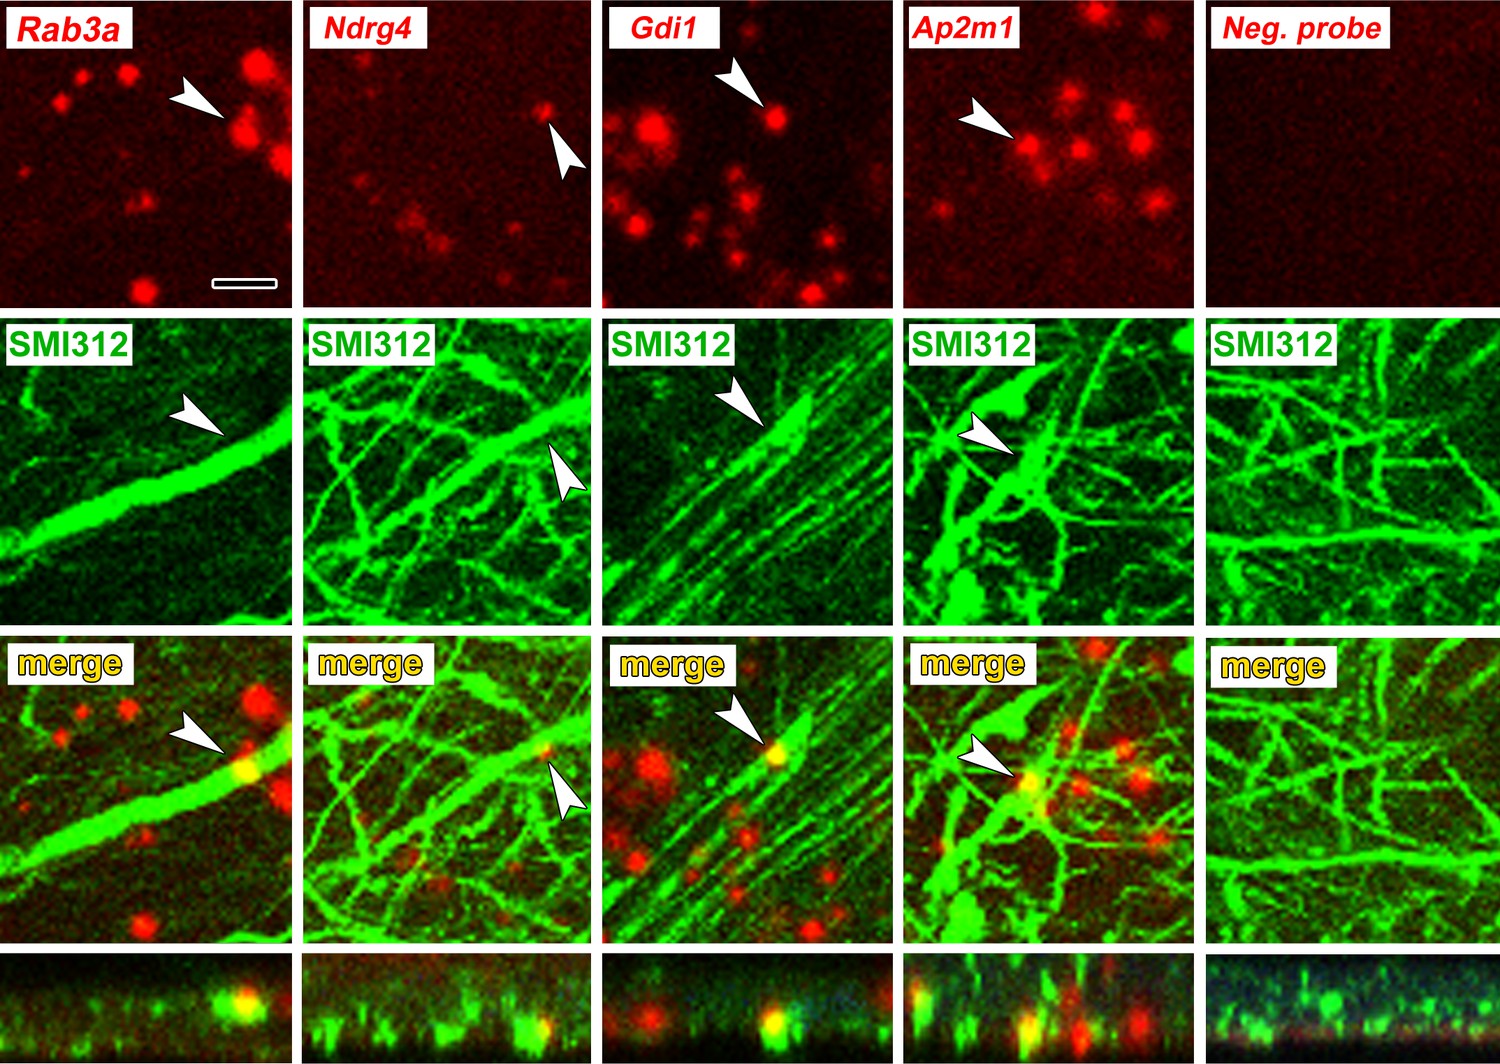
Axonal localization of mRNAs in vivo.
First row: FISH showing localization of four mRNAs, but not a control probe, in amygdala neuropil. Second and third rows: Immunolabeling with the pan-axonal neurofilament antibody SMI312 shows overlap with mRNA probes. Bottom row: XZ orthogonal view of merged images. Scale = 5 µm.
Figure 5—figure supplement 1
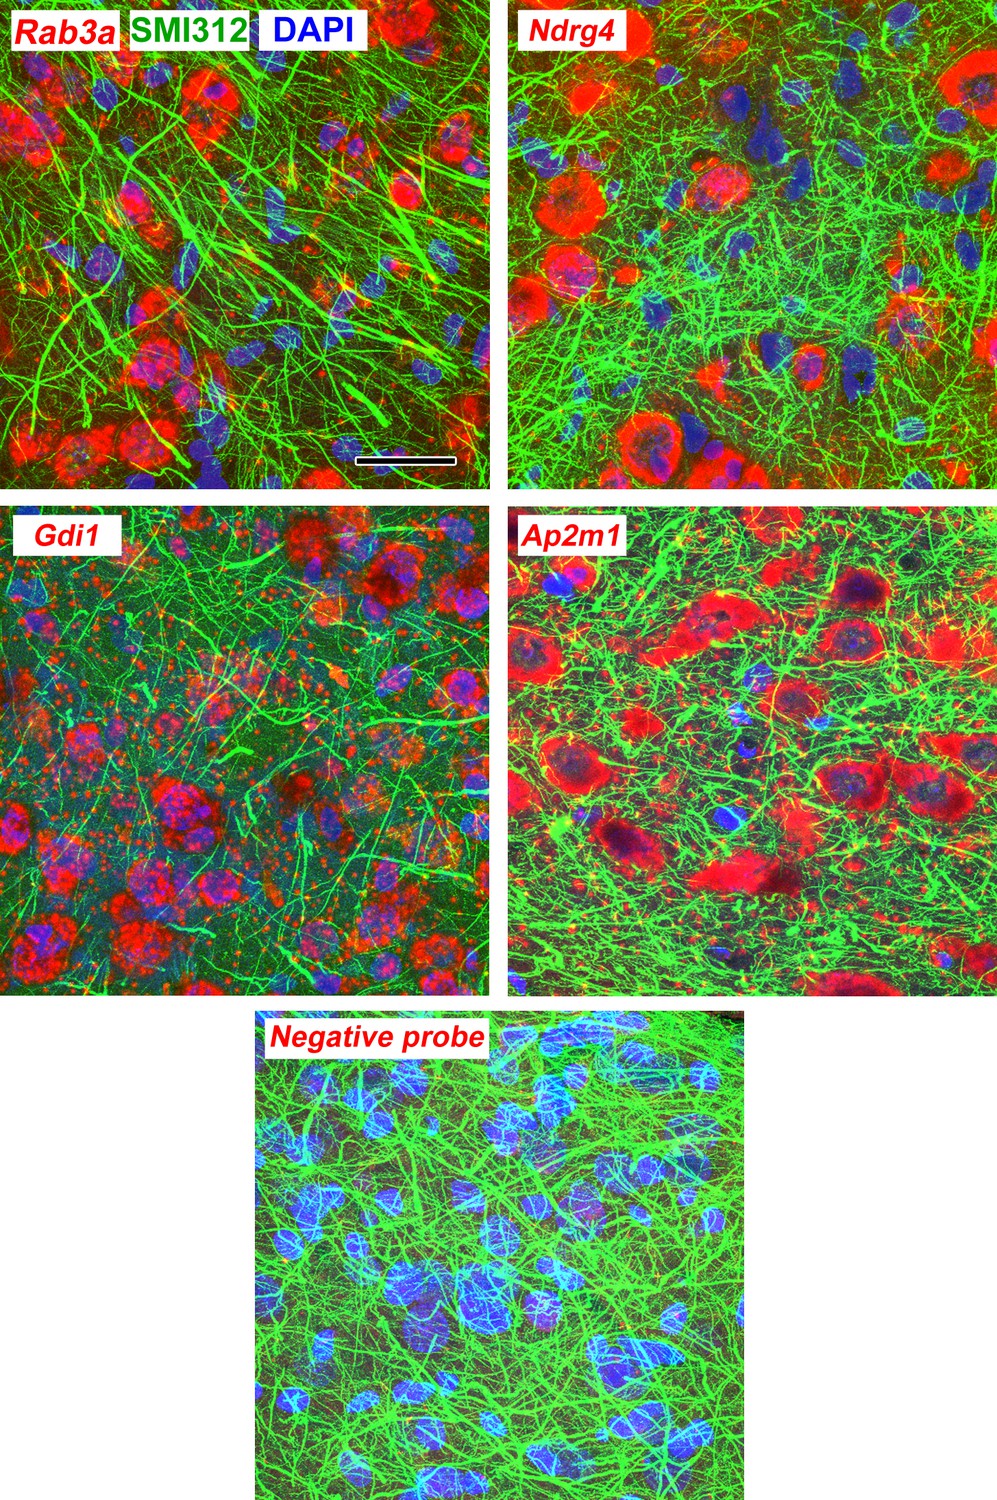
Maximum intensity projections through 3 µm (10 confocal images with a 0.3 µm z-step size) of lateral amygdala showing FISH labeling and immunolabeling for neurofilaments.
Scale = 20 µm.
Figure 6 with 1 supplement
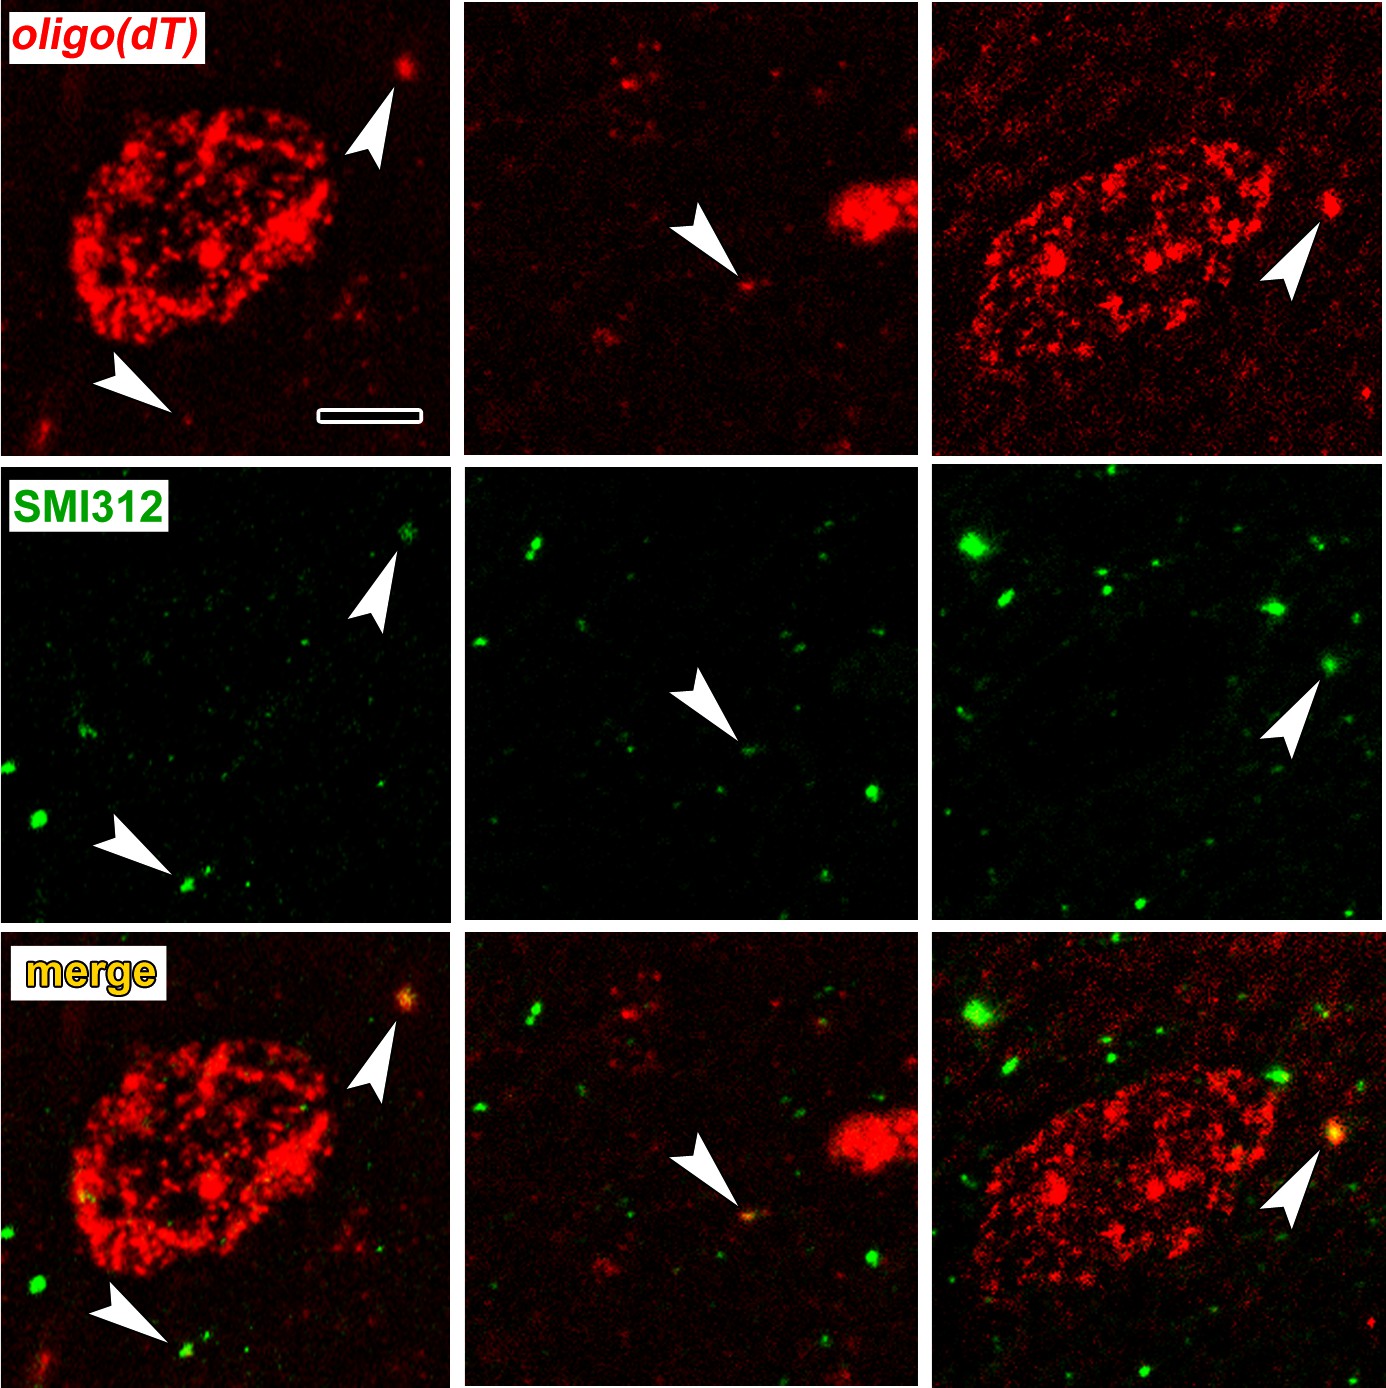
Colocalization of poly-A RNA with axonal neurofilaments in 100 nm resin-embedded amygdala sections.
(a) Widefield images show overlap between and oligo(dT) probe and the pan-axonal neurofilament antibody SMI312 in the neuropil. Scale = 5 µm. (b–c) Mander’s colocalization coefficients show a greater fraction of SMI312 signal colocalized with oligo(dT) in the neuropil versus the soma (b), but no difference oligo(dT) colocalized with SMI312 (c). * F(1,32) = 24.34, p=0.00002, η2 = 0.43.
Figure 6—figure supplement 1
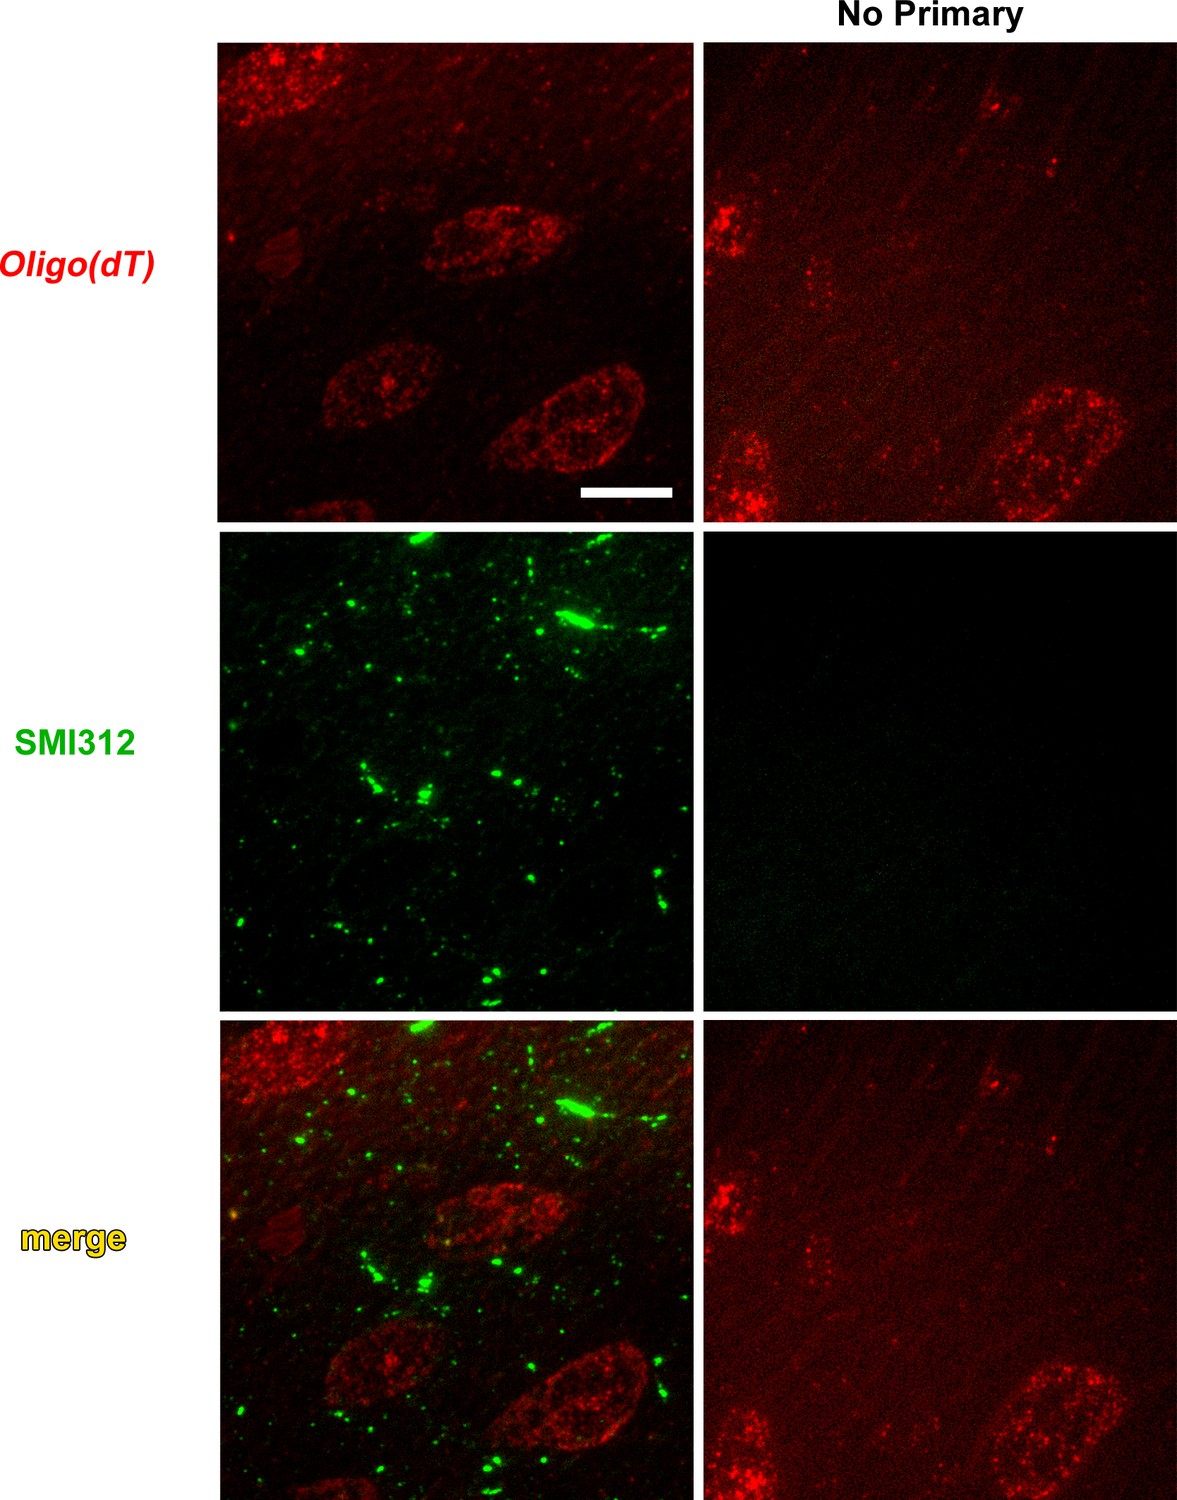
FISH labeling with an oligo(dT) probe combined with immunolabeling for neurofilaments on 100 nm amygdala sections.
Scale = 5 µm.
Tables
Table 1
Examples of genes found in auditory cortical axons during memory consolidation by function and effect of learning.
Genes in bold type were changed in the opposite direction in the cortex.
| Type | Upregulated in axons | Downregulated in axons | Enriched in axons, not regulated |
|---|---|---|---|
| Mitochondrial respiration | Atp5(d,e,g1,g2,g3,h,i,j,j2,5l,5o),Atp6v(if,0b, 1g1),Cox(4l1,5a,5b,6a1,6a2,6c,7a2,7a2l,7b, 7 c,8a,17),Dlst,Mdh1,Mpc(1,2),Ndufa(2,4,5,6,7,11,12,b1),Ndufb(2,3,4,5,6,7,8,9,10,11), Ndufc2,Ndufs(4,5,6,8),Ndufv(2,3),Suclg1, Uqcc2, Uqcr(10,11,b,c2,fs1,h,q) | Aco2,Atp5(a1,b),Fh,Got2,Idh(2,3b), Ndufa10,Ndufs(1,2,3),Ndufv1,Ogdhl, Pc,Pck2,Pdh(a1,b),Sucla2 | Cox20,Me3,Uqcrc2 |
| Mitochondrial translation | Mrp63,Mrpl(11,12,13,16,18,20,23,27,34,35,41,44,51,52,54,55),Mrps(7,11,12,14,15,16,18b, 18 c,21,23, 25,26,28,33,34,36) | Mrpl(19,37),Mtif2,Tufm | Mrpl16,Mrps9 |
| Mitochondrial, other | Fis1,Minos1,Timm(8b,10,13) | Cluh,Immt,Mfn1,Pink1,Opa1 | Aldh2,Oxa1l,Sdhd |
| Ribosomal proteins | Rpl(3,4,5,6,7,8,9,10,10a,11,12,13,13a,14,15, 17,18,18a,19,21,22l1,23,23a,24,26,27,27a,28, 29,30,31,32,34,35,35a,36,36a,37,38,39,p1), Rps(3,3a,4x,5,7,8,10,11,12,13,14,15,15a,16, 17, 18,21,23,24,25,26, 27,27a,28,29,a) | Rps2 | |
| Translation apparatus/regulation | Eef1(a2,b2,d,e1),Eif1b,Eif2s2,Eif3g,Eif5b, Erp29,Fkbp(2,3),Hspa5,Naca,Pfdn(1,2,5,6), Sil1, Srp(9,14,19) | Apc,Cyfip(1,2),Denr,Eef2,Eif2b5, Eif3(a,d),Eif3l,Eif4a1,Eif6,Mtor,Rps6kb2,Tsc2 | Rheb,Rps6ka2 |
| Spliceosome | Gemin7,Hnrnp(a1,a2/b1,a3,d,l,r,ul2),Lsm(3,4,5,7,8),Nono,Sf3b(2,6),Sfpq,Smndc1,Snrnp27,Snrp(b2,c,d2,e,f,g),Ssrf4 | Snrp200 | |
| Golgi apparatus | Napg,Tmed9,Trappc(3,5) | Copa,Coro(1 c,7),Gbf1,Gorasp1,Trappc (9,10,11) | Copg2 |
| Transcription | Brd(4,7),Btf3,Cited2,Ddit3,Dek,Dnajc2,Drap1,Gtf2h5,Hmgb1,Id4, Lmo4,Morf4l1,Ncor(1,2), Polr2(e,f,g,j,k),Sub1,Taf10 | Apbb1,Ahctf1,Baz2b,Cnot8,Gtf3c(1,3), Mta1,Nsmf,Polr2b | Baz1a,Hes6 |
| Proteasome/ubiquitination | Psm(a7,d4,d7,d12,g4),Psmg4, Ube2(k,v2) | Elp2,Psm(a1,a4,a5,b3,b4,c1,c5,d1,d2),Ube(3a,3b,4b),Ubr4 | Psma6,Smurf1 |
| Active zone/synaptic vesicle cycle | Ap2s1,Bloc1s4,Calm(1,2),Clta,Gabbr1,Gng13,Hspa8,Lin7b, Marcks,Nos1ip,Nrgn,Pfn(1,3), S100b,Stmn2,Syt1,Unc13a | Ap(2a1,2m1,3d1),Atp6v0a1,Brsk1,Bsn,Btbd9,Camk2a,Camkv,Dnm1,Gna(12, b2,l1),Gsn,Nos1ap,Rab3a,Scrib, Sptan1, Sptbn(1,2),Stxbp1,Synj1,Vdac (1,2,3) | Nos1,Pcdh17,Prkcg |
| Cytoskeleton/axonal transport | Bloc1s1,Dynll(1,2),Dynlrb1,Klc1, Sod1 | Bicd2,Clip1,Dctn1,Dync(1h1,2h1),Hap1,Htt,Kif(3a,5a,5b,5c,c3,ap3),Myo(1b,1d, 5a,5b,9a,9b,16,18a),Myh(10,14),Nefh, Nefl,Nefm,Tuba(1b,4a),Tubb(2b,3,4a, 4b,5) | Llgl1,Myh11,Myo10, Tubb2a,Tubg1 |
| Myelin sheath | Ank3,Cnp,Cntnap1,Mbp,Sptnb4 | Myrf | |
| Postsynaptic | Dbn1,Ddn,Dlgap(1,3,4),Mink1,Ppp1r9 (a,b),Shank(1,2,3) | ||
| Other axonal/signaling | Akap5,Akip1,Eno1,Gap43,Mapt,Olfm1,Park7, Sumo2,Tmsb4x | Akap(2,6,8 l,11,13),Aldoc,Arhgap(21, 39),Arhgef(2,11),Dpysl2,Fez1,Kalrn, Rab(2b,3b,3c, 5 c,6b),Rock2,Vim | Arhgap26,Arhgef(12,18,28) |
Key resources table
| Reagent type | Designation | Source | Identifiers | Additional information |
|---|---|---|---|---|
| Antibody | Rabbit polyclonal anti-eIF4E | Bethyl Labs | Cat# A301-154A | 1:500 (EM-IHC) |
| Antibody | Mouse polyclonal anti-eIF4G1 | Abnova | H00001981-A01 | 1:500 (EM-IHC) |
| Antibody | Mouse monoclonal anti-eIF2α | Cell Signaling | L57A5 | 1:500 (EM-IHC) |
| Antibody | mouse monoclonal anti-GFP | Invitrogen | A11120 | 1:1000 (EM-IHC) |
| Antibody | mouse monoclonal anti-neurofilament cocktail | BioLegend | SMI312 | 1:500 (IHC); 1:250 (IHC) |
| Antibody | mouse monoclonal anti-GFP | PMID: 24810037 | RRID:AB_2716736 | .29μg/μl |
| Antibody | mouse monoclonal anti-GFP | PMID: 24810037 | RRID:AB_2716737 | .29μg/μl |
| Recombinant DNA reagent | pAAV-CMV-eYFP-L10a | PMID: 24904046 | Dr. Thomas Launey (RIKEN Brain Science Institute) | |
| Recombinant DNA reagent | VSVG.HIV.SIN.cPPT.CMV.eYFP-L10a | this paper (Materials and methods) | ||
| Software, algorithm | Fiji | PMID: 22743772 | RRID:SCR_002285 |
Additional files
-
Supplementary file 1
RNA quality control data.
- https://cdn.elifesciences.org/articles/51607/elife-51607-supp1-v3.docx
-
Supplementary file 2
Results of differential gene expression analysis and subsequent filtering.
- https://cdn.elifesciences.org/articles/51607/elife-51607-supp2-v3.xlsx
-
Supplementary file 3
Results of differential gene expression analysis and subsequent filtering, YFP samples.
- https://cdn.elifesciences.org/articles/51607/elife-51607-supp3-v3.xlsx
-
Supplementary file 4
Results of DAVID enrichment analyses of all axonal genes, cortex-only genes, and genes that were upregulated and downregulated in the axons and cortex.
- https://cdn.elifesciences.org/articles/51607/elife-51607-supp4-v3.xlsx
-
Supplementary file 5
Results of ANOVA and post hoc Bonferroni test comparing mean FPKM between experimental groups by training effect.
- https://cdn.elifesciences.org/articles/51607/elife-51607-supp5-v3.xlsx
-
Supplementary file 6
Results of IPA upstream regulator analysis of training effects in axons and cortex.
- https://cdn.elifesciences.org/articles/51607/elife-51607-supp6-v3.xlsx
-
Supplementary file 7
Results of IPA functional annotation analysis of training effects in axons and cortex.
- https://cdn.elifesciences.org/articles/51607/elife-51607-supp7-v3.xlsx
-
Supplementary file 8
Transcript-level FPKM values and results of differential expression analysis.
- https://cdn.elifesciences.org/articles/51607/elife-51607-supp8-v3.xlsx
-
Transparent reporting form
- https://cdn.elifesciences.org/articles/51607/elife-51607-transrepform-v3.pdf
Download links
A two-part list of links to download the article, or parts of the article, in various formats.
Downloads (link to download the article as PDF)
Open citations (links to open the citations from this article in various online reference manager services)
Cite this article (links to download the citations from this article in formats compatible with various reference manager tools)
Axon TRAP reveals learning-associated alterations in cortical axonal mRNAs in the lateral amygdala
eLife 8:e51607.
https://doi.org/10.7554/eLife.51607


