SIRT6 is a DNA double-strand break sensor
- Department of Life Sciences, Ben-Gurion University of the Negev, Israel
- The Zlotowski Center for Neuroscience, Ben-Gurion University of the Negev, Israel
- Department of Chemistry, Ben-Gurion University of the Negev, Israel
- Division of Chromatin Networks, German Cancer Research Center (DKFZ), BioQuant, Germany
- Centre de Biologie Intégrative, CNRS UPS, France
Figures
Figure 1 with 2 supplements
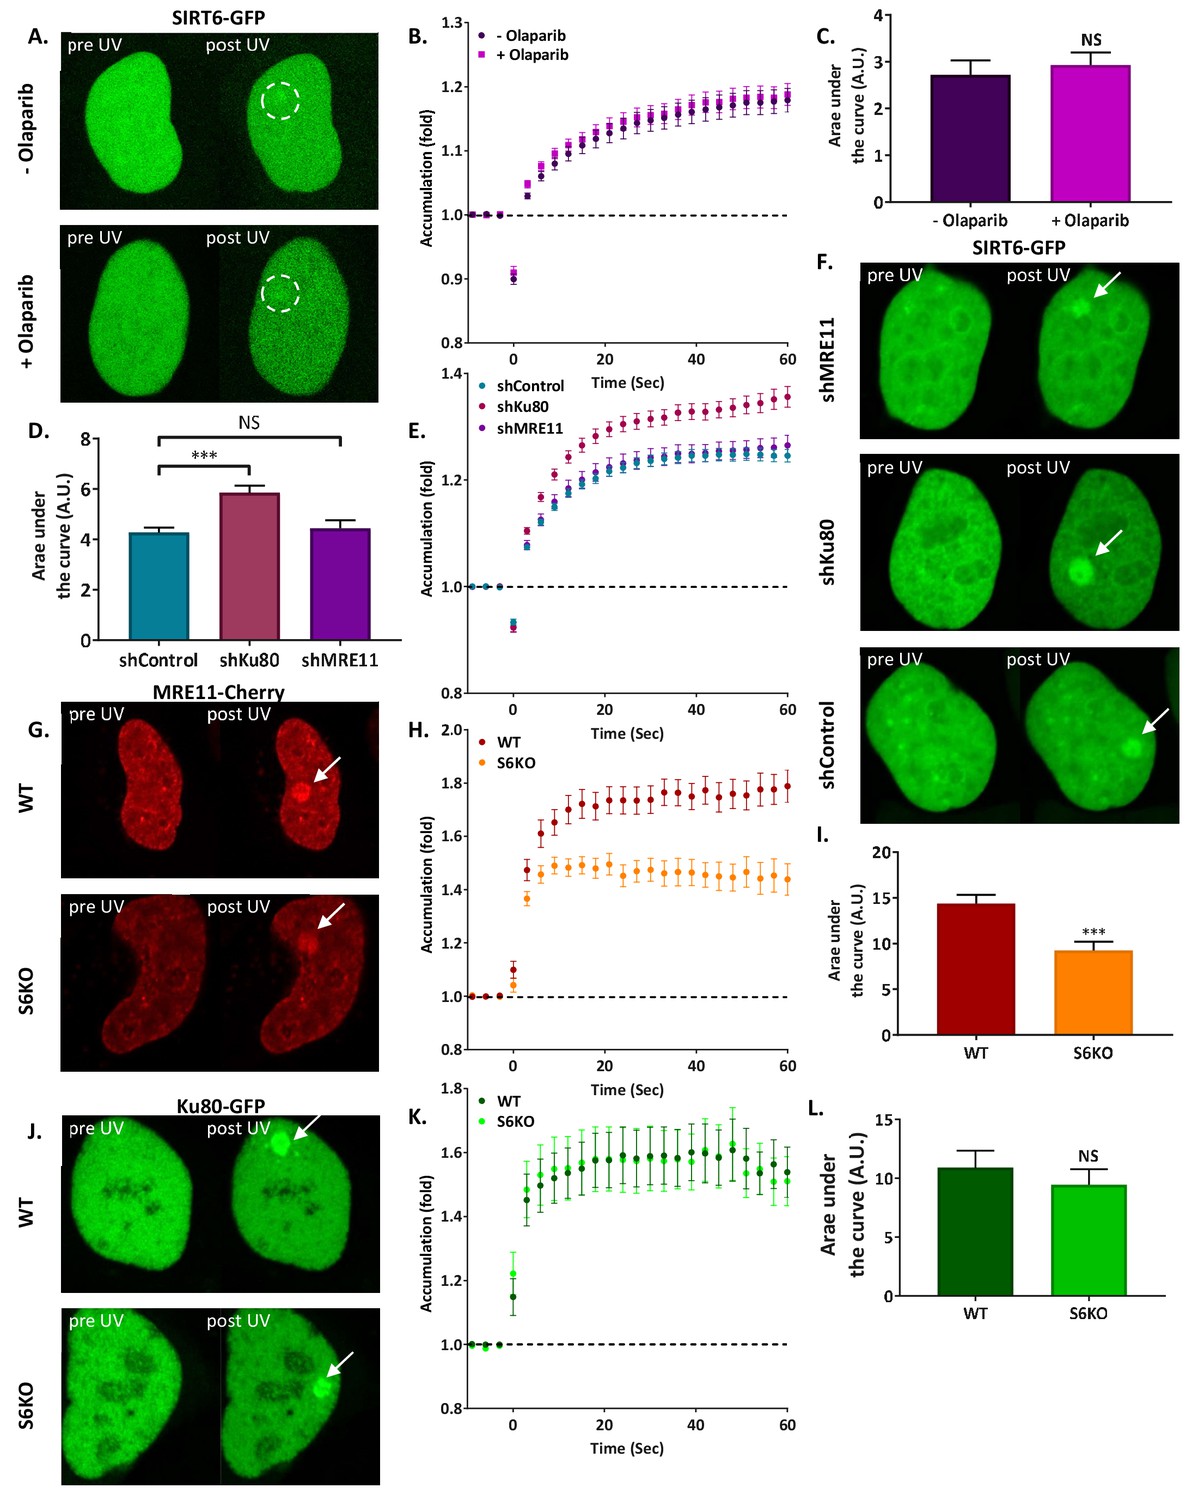
SIRT6 arrives at sites of damage independently of other repair factors.
(A–C) Imaging and AUC for SIRT6-GFP in cells with or without Olaparib. (A) Live imaging recruitment upon UV laser-induced damage (LID) shown by SIRT6-GFP in U2OS +/– Olaparib. Representative experiment examining SIRT6 recruitment to LID (n[+Ola]=23, n[–Ola]=23). (B) SIRT6 accumulation in same experiment as panel (A). (C) Average area under the curve (AUC) for cells +/– Olaparib in three replicate experiments. Error bars are the standard error of the mean (SEM) (n[+Ola]=38, n[–Ola]=39, p>0.05). (D–F) Imaging and AUC for SIRT6-GFP accumulation in shControl, shKu80 or shMRE11 Hela cells. (D) Average AUC from three experiments. Error bars are the SEM (shControl: n = 50; shKu80: n = 50, p<0.0005; shMRE11: n = 52, p>0.05). Accumulation of SIRT6-GFP (E) and imaging (F) from a representative experiment examining SIRT6 recruitment after LID (n[shControl]=28; n[shKu80]=30, n[shMRE11]=30). (G–I) MRE11-Cherry accumulation in response to LID in SIRT6 WT and KO U2OS cells. MRE11-Cherry imaging (G) and accumulation (H) in a representative experiment (n[WT]=20, n[KO]=16). (I) Mean AUC for three replicate experiments. Error bars are the SEM (n[WT]=36, n[KO]=33, p<0.0005). (J–L) Ku80-GFP accumulation in response to LID in SIRT6 WT and KO U2OS cells. Ku80-GFP imaging (J) and accumulation (K) in a representative experiment (n[WT]=17, n[KO]=17). (L) Mean AUC for three replicate experiments. Error bars are the SEM (n[WT]=33, n[KO]=33, p>0.05).
Figure 1—figure supplement 1
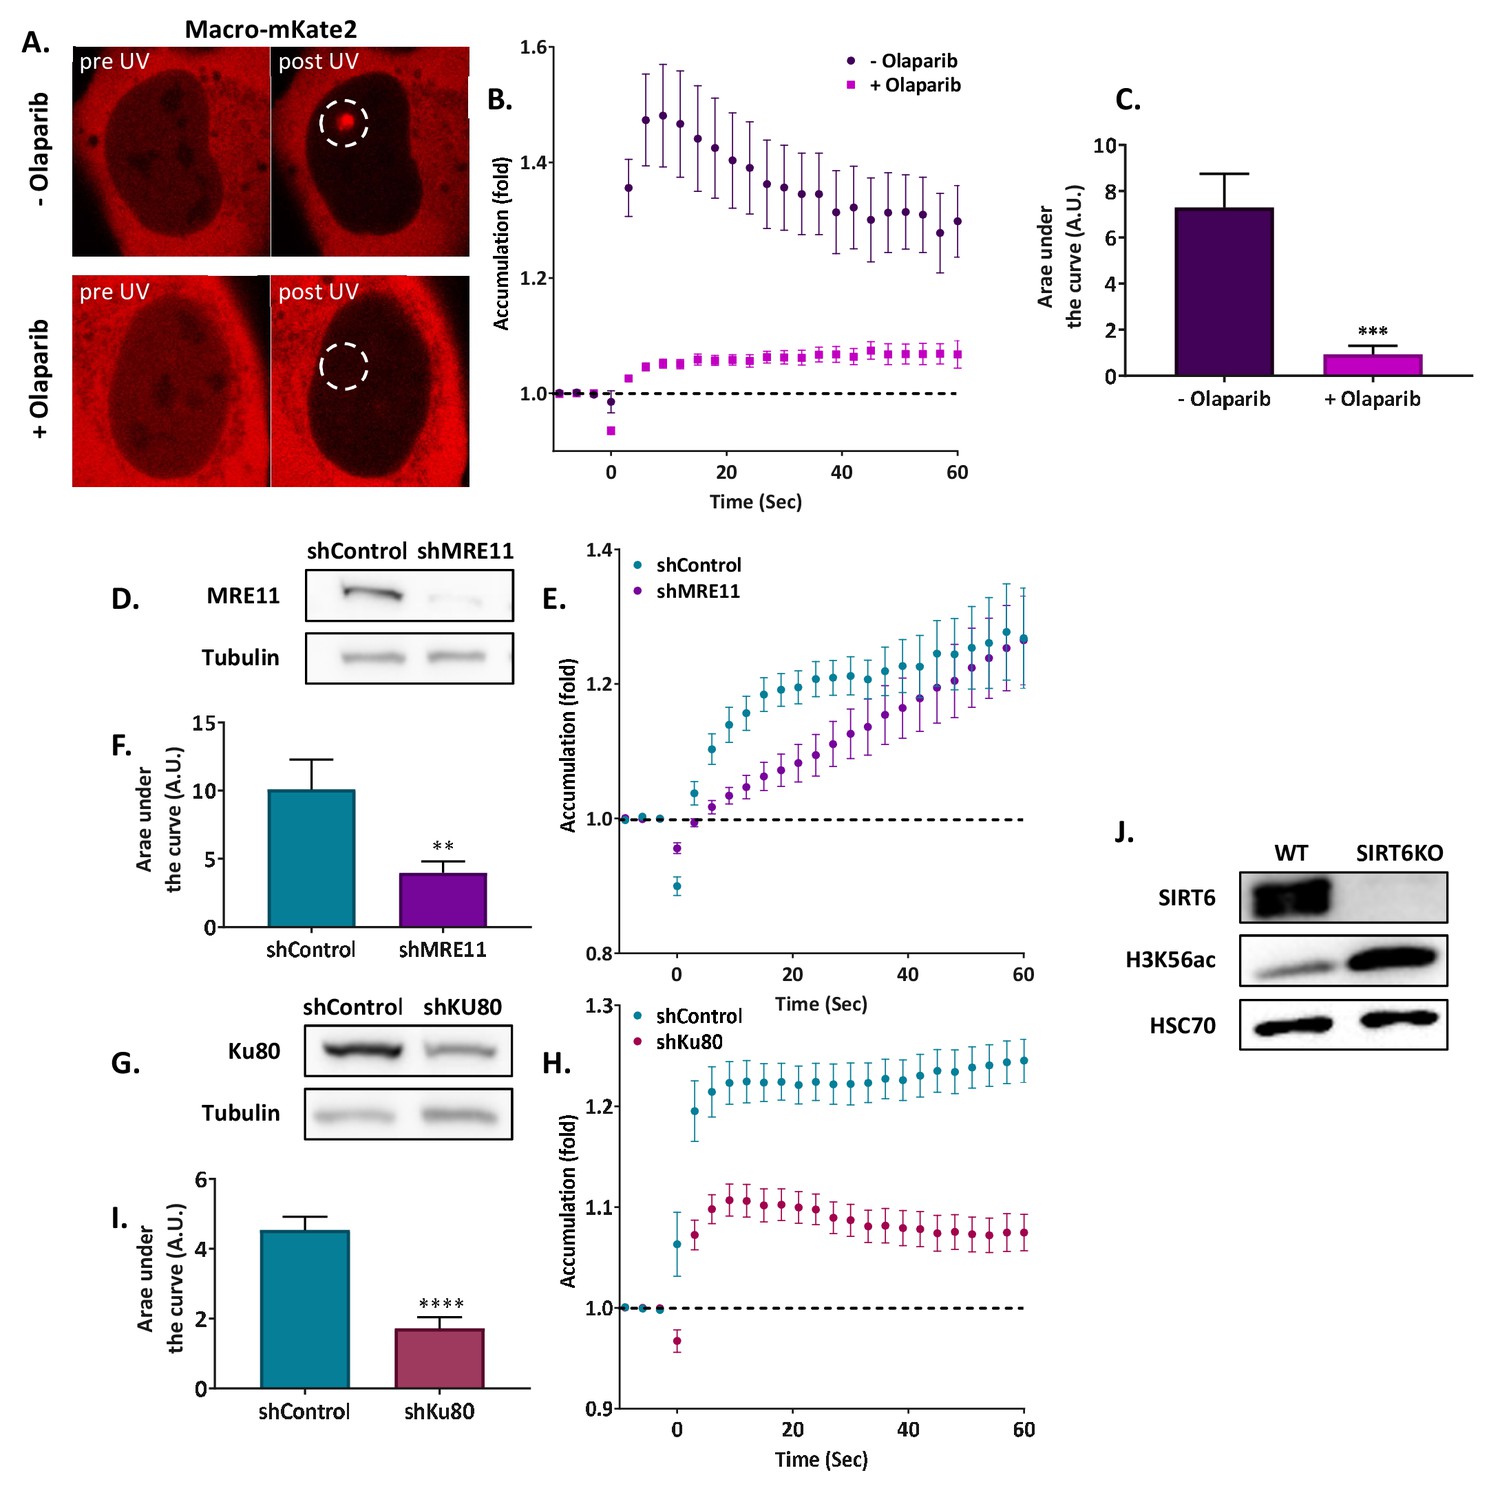
SIRT6 arrivesatsites of damage independently of other repair factors.
(A, B) Effect of LID on Macro-domain mKate2 in U2OS +/- Olaparib. (n[+Ola]=10, n[-Ola]=10). (C) Average AUC of Macro-mKat2 in U2OS +/- Olaparib for three replicated experiments (error bars are SEM) (n[+Ola]=25, n[–Ola]=25, p<0.0005). (D) Blot of shControl and shMRE11 Hela cells. (E) Effect of LID on NBS1-Cherry in shControl (n = 10) and shMRE11 Hela cells (n = 10). (F) Average AUC for three replicate experiments +/- SEM (n[shControl]=29, n[shMRE11]=30, p<0.005)). (G) Protein blot of shControl and shKu80 Hela cells. (H) Effect of LID on Ku70-GFP accumulation in shControl (n = 10) and shKu80 Hela cells (n = 10). (I) Average AUC for three replicate experiments. Error bars are SEM (n[shControl]=33, n[shKu80]=31, p<0.0001). (J) Blot of WT and SIRT6KO cells.
Figure 1—figure supplement 2
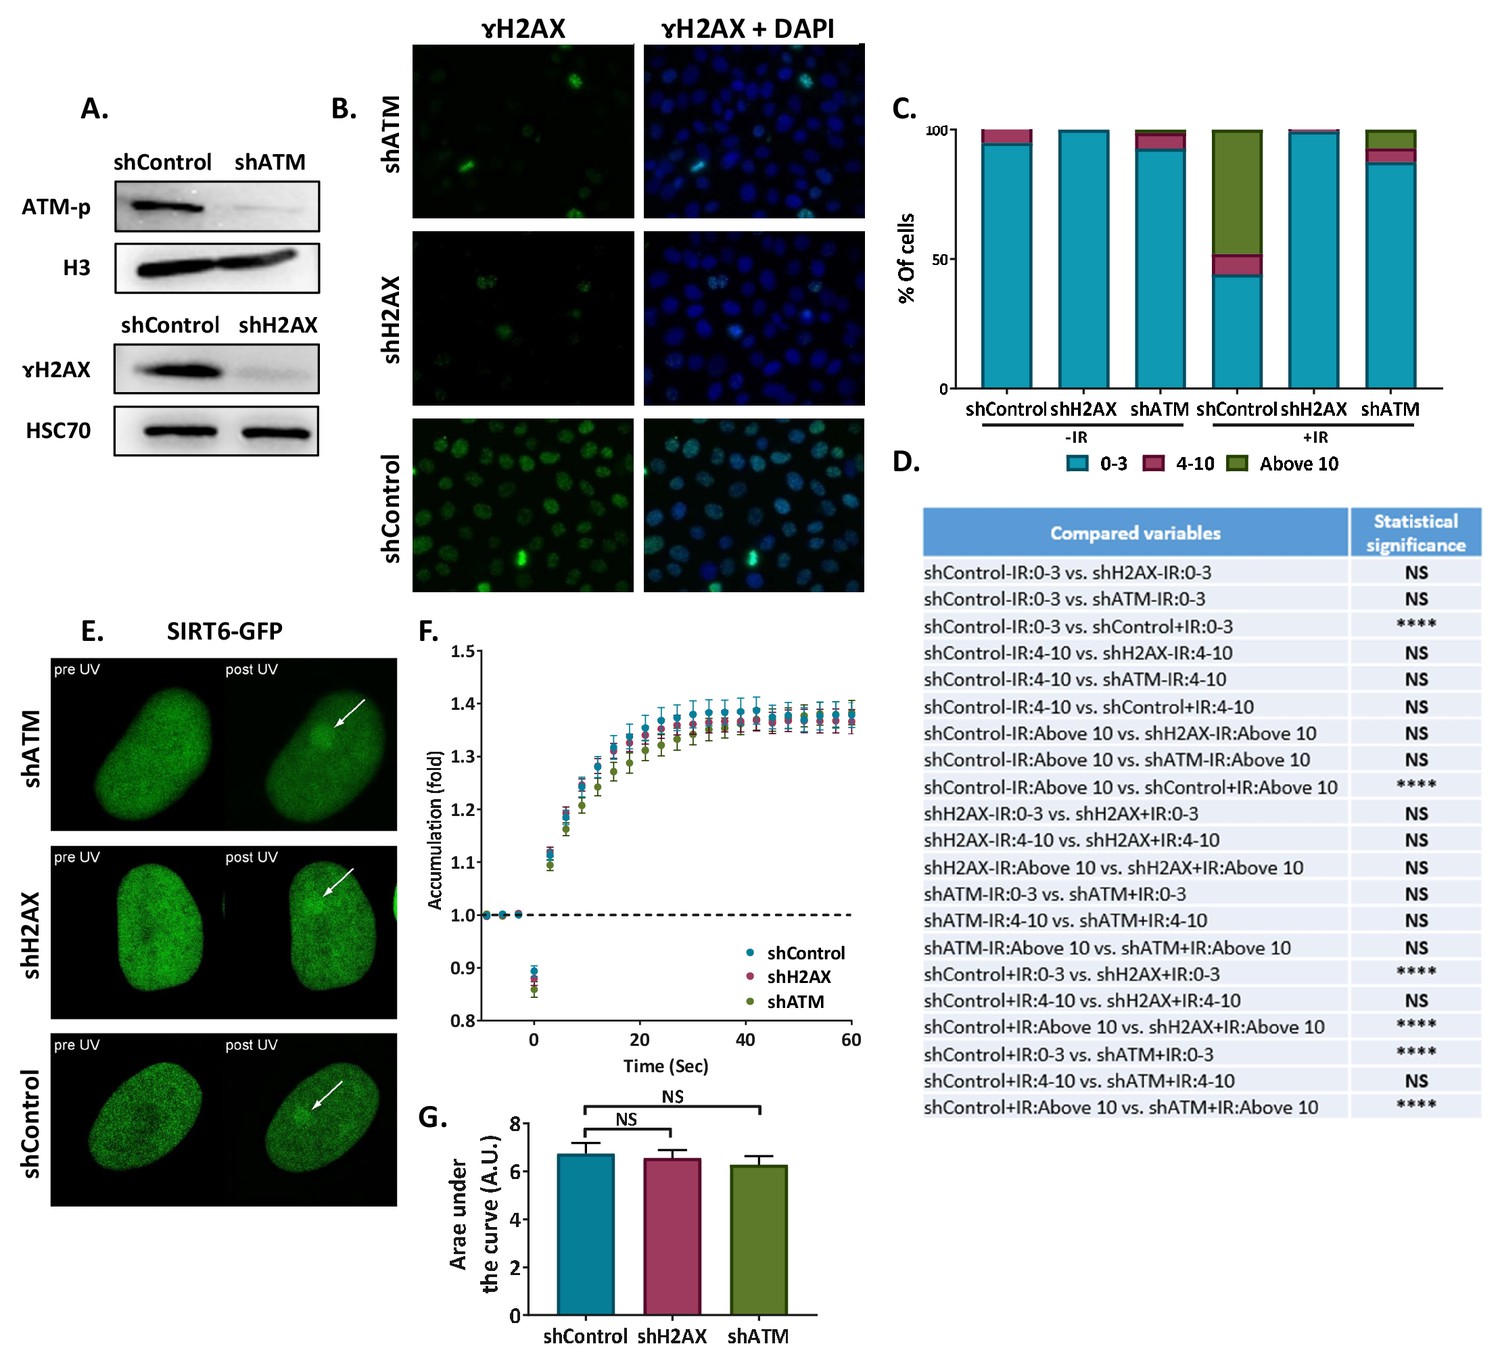
SIRT6 arrivesatsites of damage independently of other repair factors.
(A) Blot of shATM, shH2AX and shcControl Hela cells. (B) Immunofluorescence of γH2AX in sh-Hela cells upon irradiation (IR). (C) Quantification of γH2AX foci in Control (n[–IR]=283, n[+IR]=301), shH2AX (n[–IR]=284, n[+IR]=322) and shATM (n[–IR]=299, n[+IR]=385) Hela cells. The bar chart shows the percentages of cells with 0–3, 4–10 or more than 10 foci per nucleus (+/- IR, average of six experiments). (D) Statistical analysis of the γH2AX foci quantification experiment depicted in panel (C) (*, p < 0.05; **, p <0.005, ***, p < 0.0005). (E,F) Representative experiment showing SIRT6-GFP accumulation in response to LID in shH2AX (n = 10), shATM (n = 10) or shControl (n = 10) cells. (G) Average AUC for three replicate experiments. Error bars are SEM (shControl: n = 30; shH2AX: n = 30, p>0.05; shATM: n = 30, p>0.05).
Figure 2 with 1 supplement
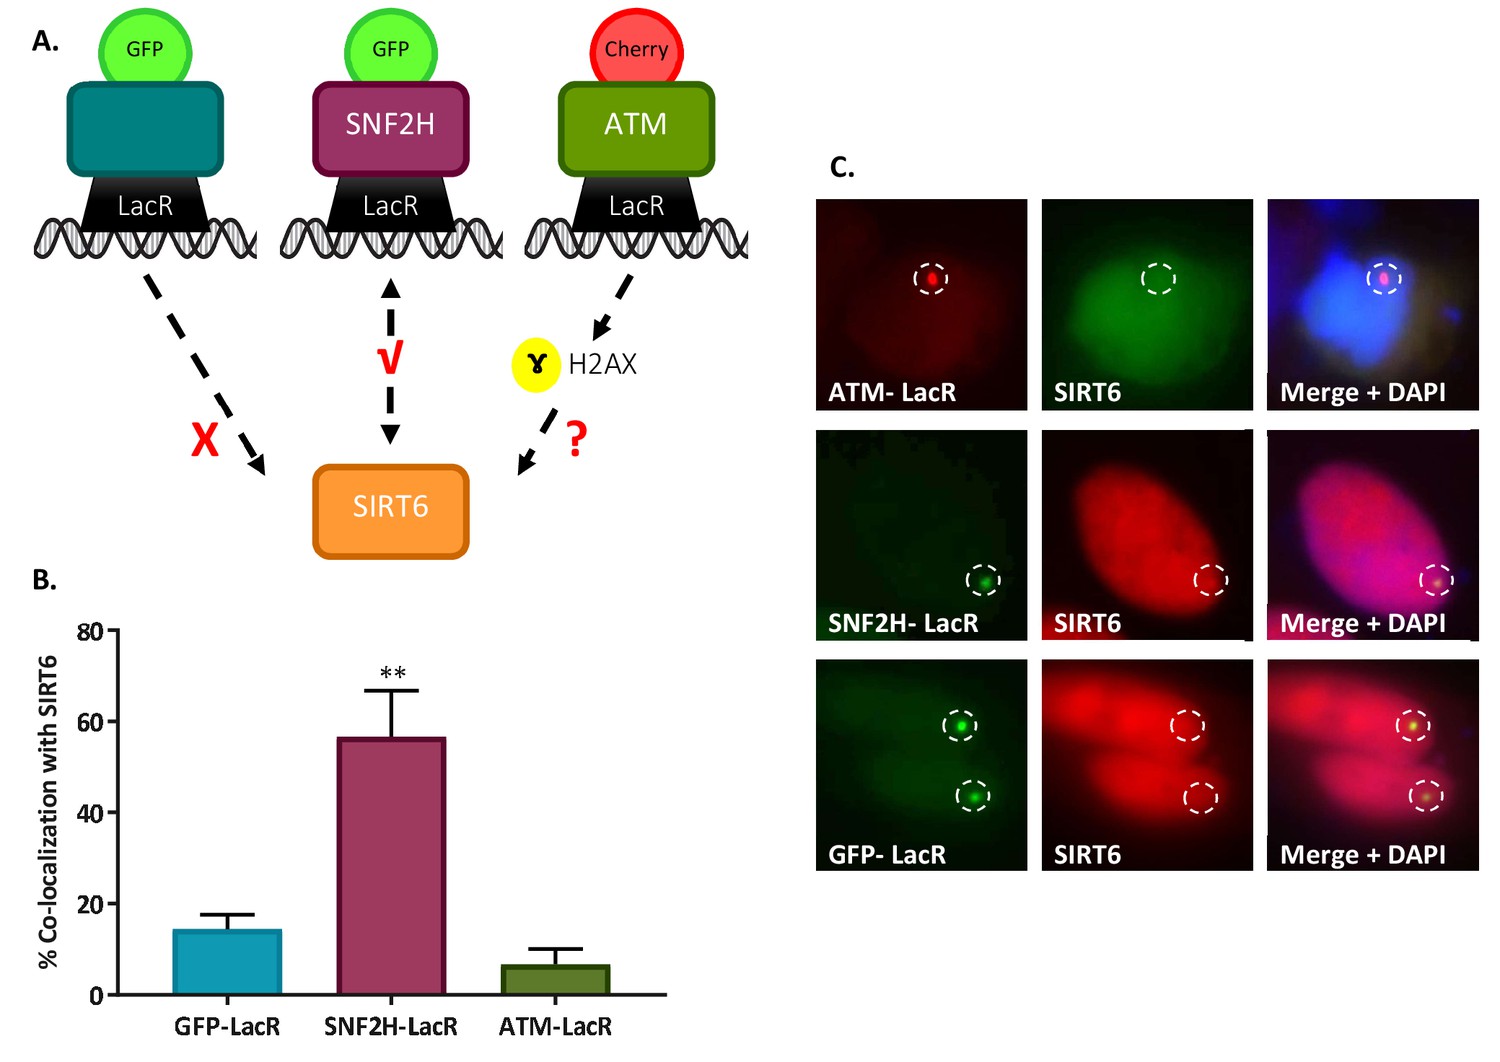
SIRT6 is not recruited by signaling.
(A) Schematic representation of the ‘Tethering assay’. Recruitment can occur through DDR signaling (ATM-LacR-Cherry) or through direct protein–protein interaction (SNF2H-LacR-GFP). (B, C) Recruitment of SIRT6-GFP/SIRT6-Cherry to LacO sites by ATM-LacR-Cherry (n = 30, p>0.05), SNF2H-LacR-GFP (n = 85, p<0.005) and GFP-LacR (n = 85). The bar chart in panel (B) depicts averages for3–6 experiments. Error bars are SEM.
Figure 2—figure supplement 1
SIRT6 is not recruited by signaling.
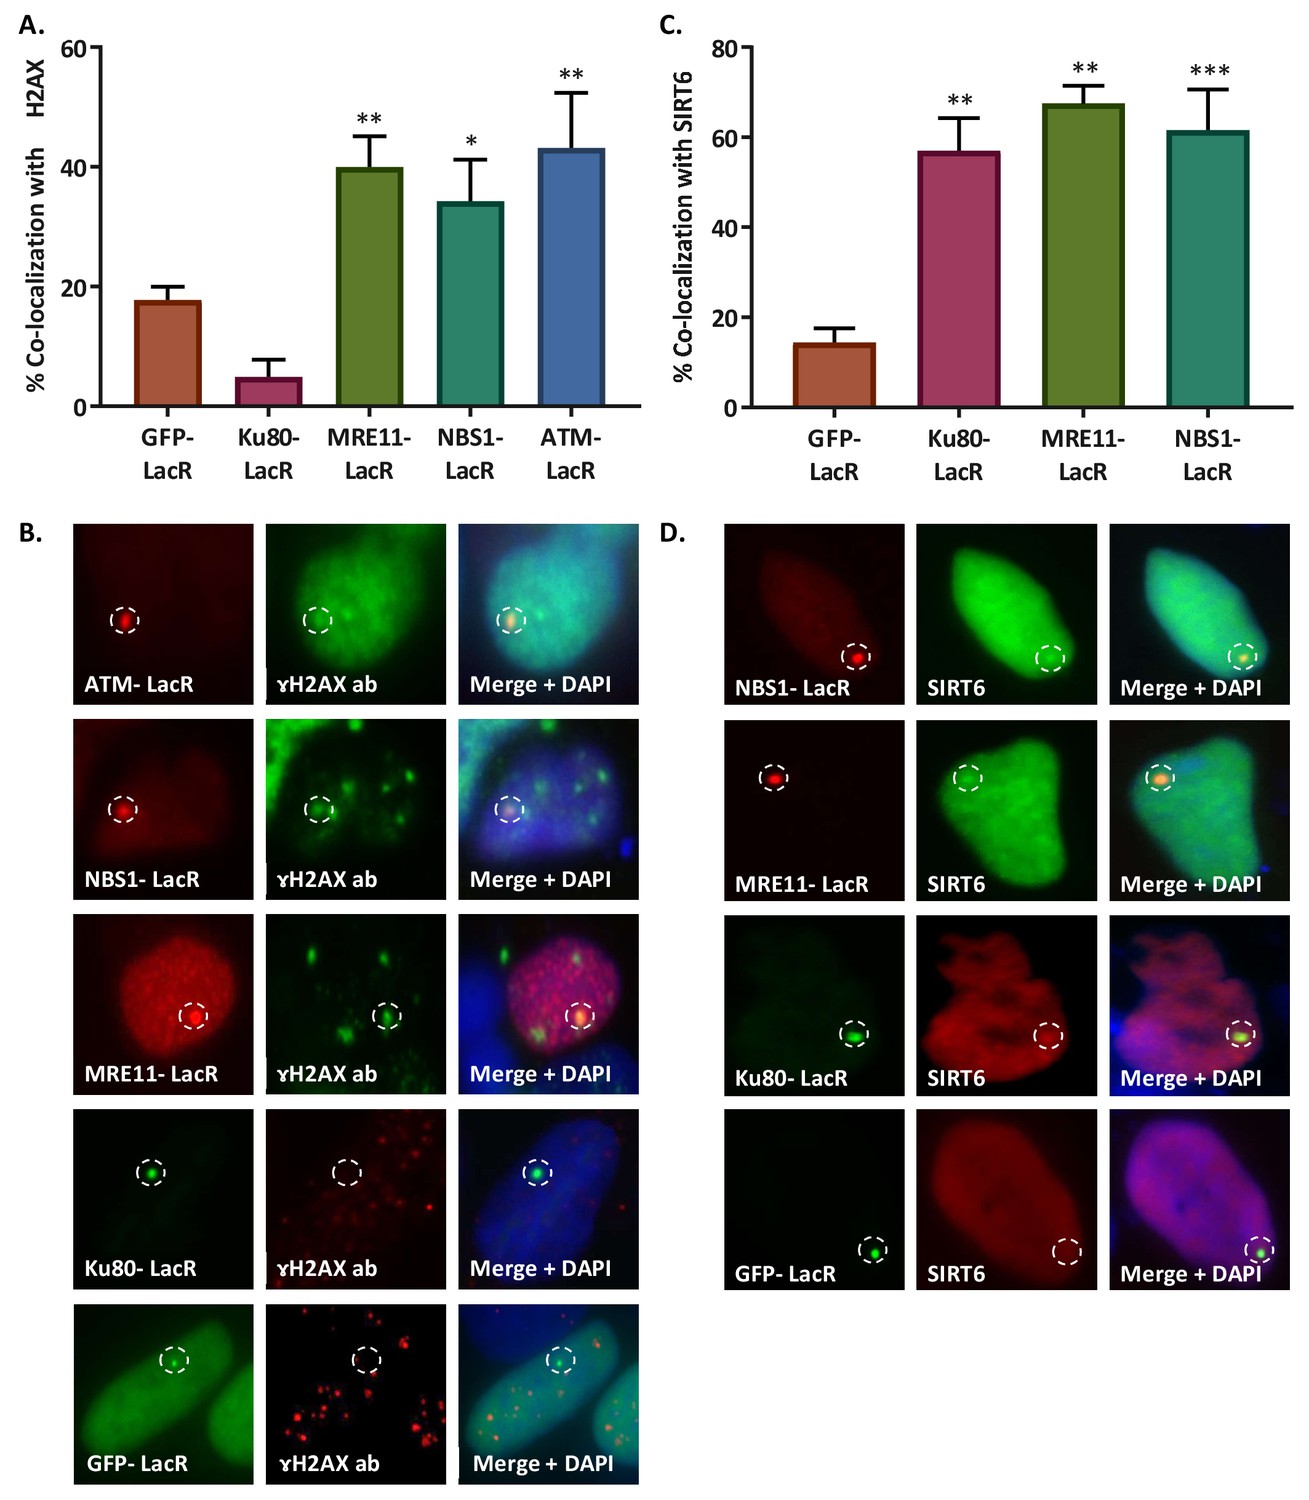
(A, B) Initiation of DDR by ATM-LacR-Cherry (n = 33, p<0.005), NBS1-LacR-Cherry (n = 82, p<0.05), MRE11-LacR-Cherry (n = 136, p<0.005) and Ku80-LacR-GFP (n = 52, p>0.05) in the tethering system. Co-localization percentage with γH2AX (compared to GFP-LacR (n = 310)) (A) and immunofluorescence (B) are shown. (C, D) Recruitment of SIRT6-GFP/SIRT6-Cherry to LacO sites by NBS1-LacR-Cherry (n = 87, p<0.0005), MRE11-LacR-Cherry (n = 31, p<0.005), Ku80-LacR-GFP (n = 45, p<0.005) and GFP-LacR (n = 85). Co-localization percentage with SIRT6 (compared to GFP-LacR (C) and immunoflorescence (D) are shown. Averages are for 3–5 experiments. Error bars show the SEM.
Figure 3 with 2 supplements
SIRT6 binds DNA with no intermediates.
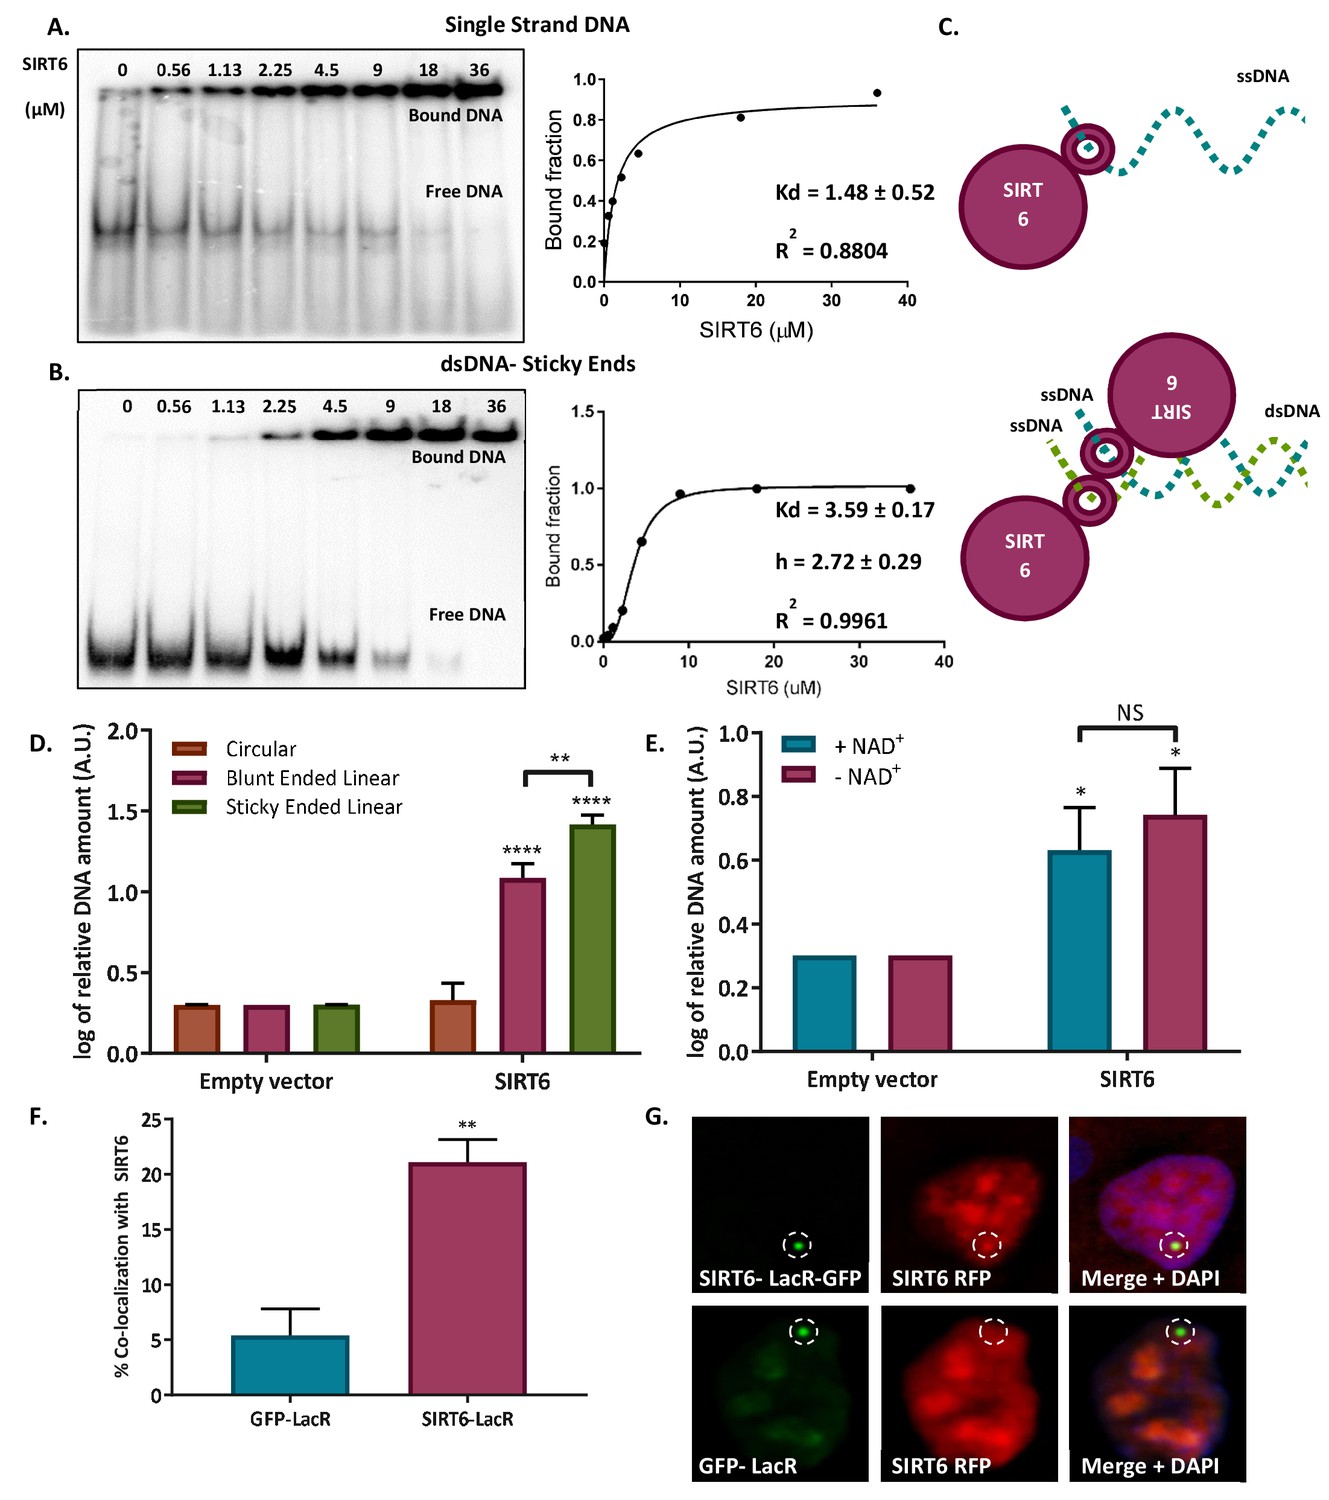
(A–B) Gel retardation assay of 32 P-5' end-labeled single-strand DNAs and sticky ended dsDNAs as a function of increasing concentrations of SIRT6-His (ssDNA, Kd = 1.48 ± 0.52; sticky dsDNA, Kd = 3.59 ± 0.17). (C) Suggested model of SIRT6 binding to ssDNA as a monomer or open ssDNA ends of dsDNA as a dimer. (D) Ability of SIRT6-Flag to bind to the DNA of circular, blunt-ended and sticky-ended cleaved plasmids. The bar chart depicts averages for three replicate experiments (error bars show SEM), after logarithmic transformation. (E) SIRT6-Flag DNA-binding ability for an open-ended +plasmid +/- NAD. Data are averages from four experiments, with error bars representing SEM (after logarithmic transformation). (F, G) Dimerization of SIRT6 at the LacO site, represented by the recruitment of SIRT6-Cherry by SIRT6-LacR-GFP (n = 181, p<0.005) or GFP-LacR (n = 104). Data are averages from four experiments, with error bars representing SEM.
Figure 3—figure supplement 1
SIRT6 binds DNA with no intermediates.
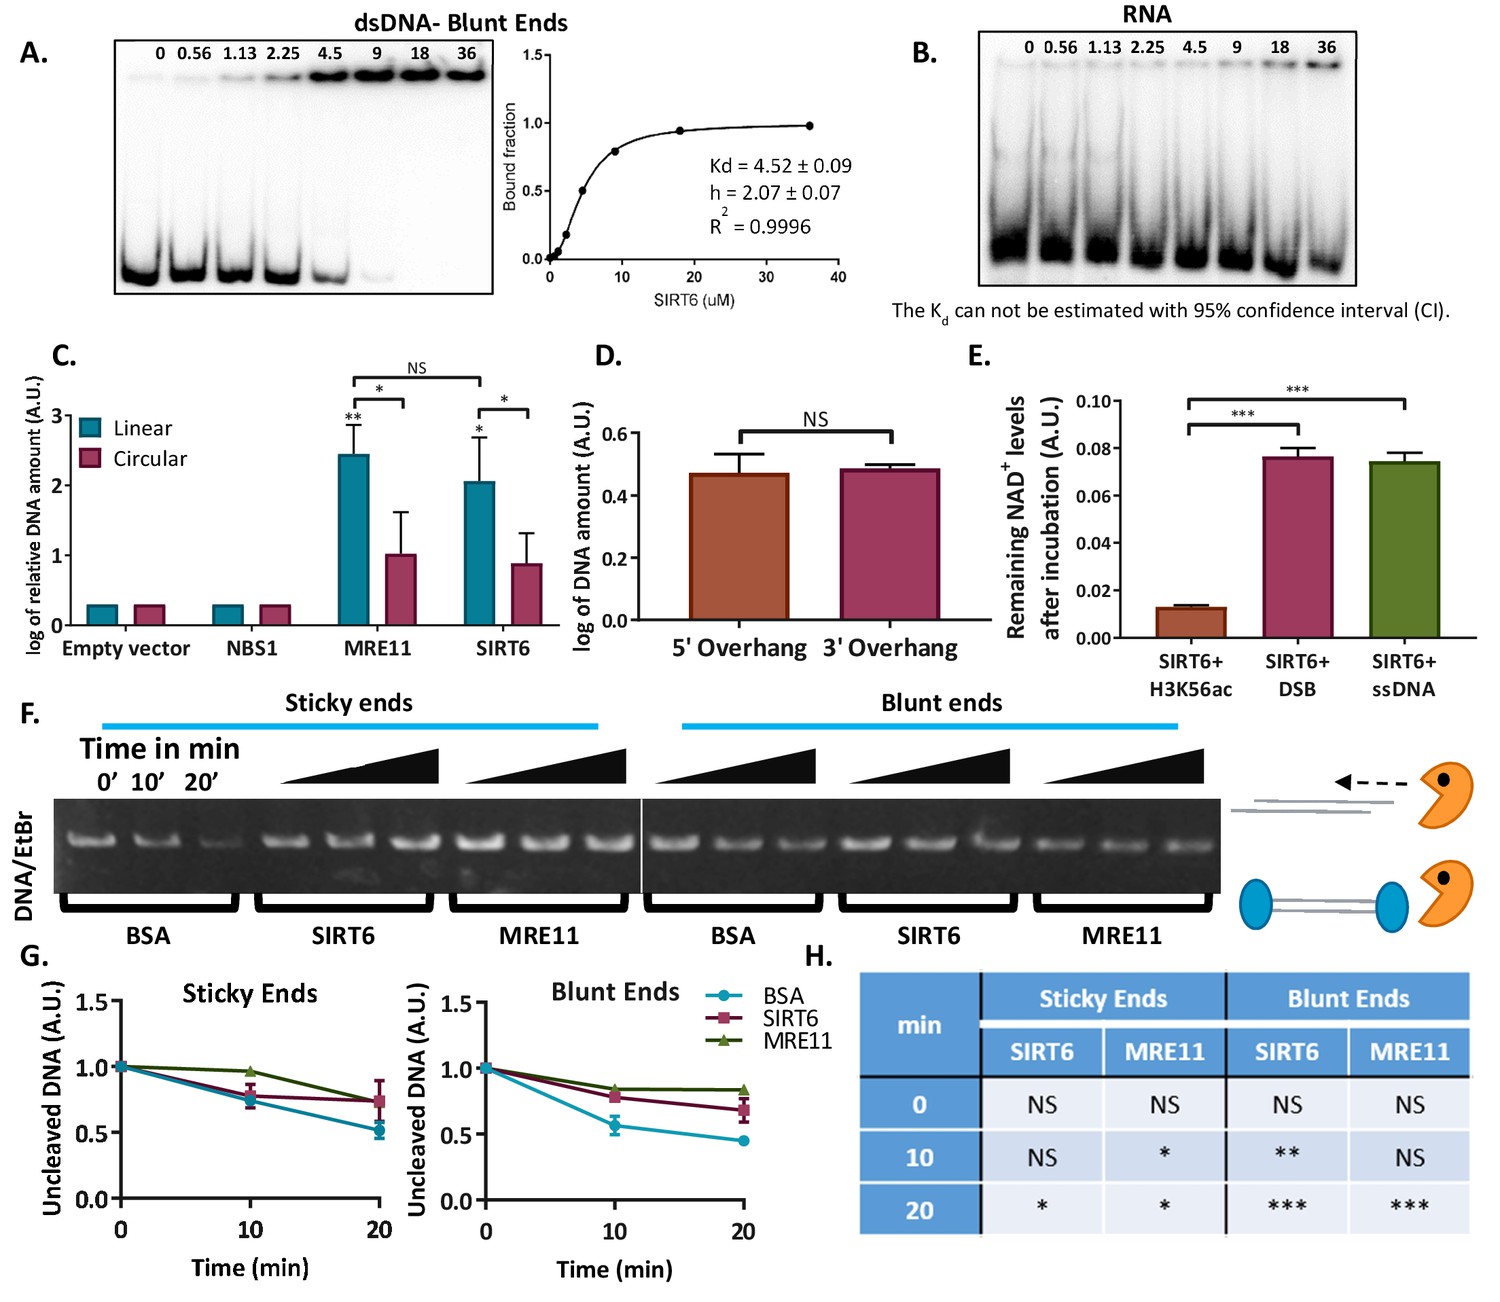
(A) Gel retardation assay of 32 P-5′ end-labeled dsDNAs with blunt ends as a function of increasing concentrations of SIRT6-His. (B) Gel retardation assay of 32 P-5′ end-labeled RNAs as a function of increasing concentrations of SIRT6-His. Kd could not have been calculated with a 95% confidence interval (CI). (C) DNA-binding ability of SIRT6-Flag, MRE11-Flag and NBS1-Flag for circular and linear plasmids, assessed by a DNA-binding assay. Data are means for 3–9 experiments (with error bars representing SEMs) after logarithmic transformation. (D) SIRT6-Flag DNA-binding ability for plasmids with a 3′ over-hang and a 5′ over-hang assessed by a DNA-binding assay. Log of averages of three experiments (with error bars representing SEMs). (E) Relative amount of NAD+ remaining after consumption by SIRT6 in the presence of DNA alone or with an acetylated peptide (H3K56ac). (F, G) Protection of sticky-ended and blunt-ended plasmids by BSA, SIRT6 and MRE11 against Exonuclease 1 in different time points. Data in panel (G) are means (with error bars showing +/- SEM) from three experiments. (H) Statistical analysis of the end protection: amounts of uncleaved DNA remaining in the presence of SIRT6 or MRE11 compared to BSA (as a control) after 0, 10 or 20 min (*, p <0.05; **, p <0.005; ***, p <0.0005).
Figure 3—figure supplement 2
SIRT6 binds DNA with no intermediates.
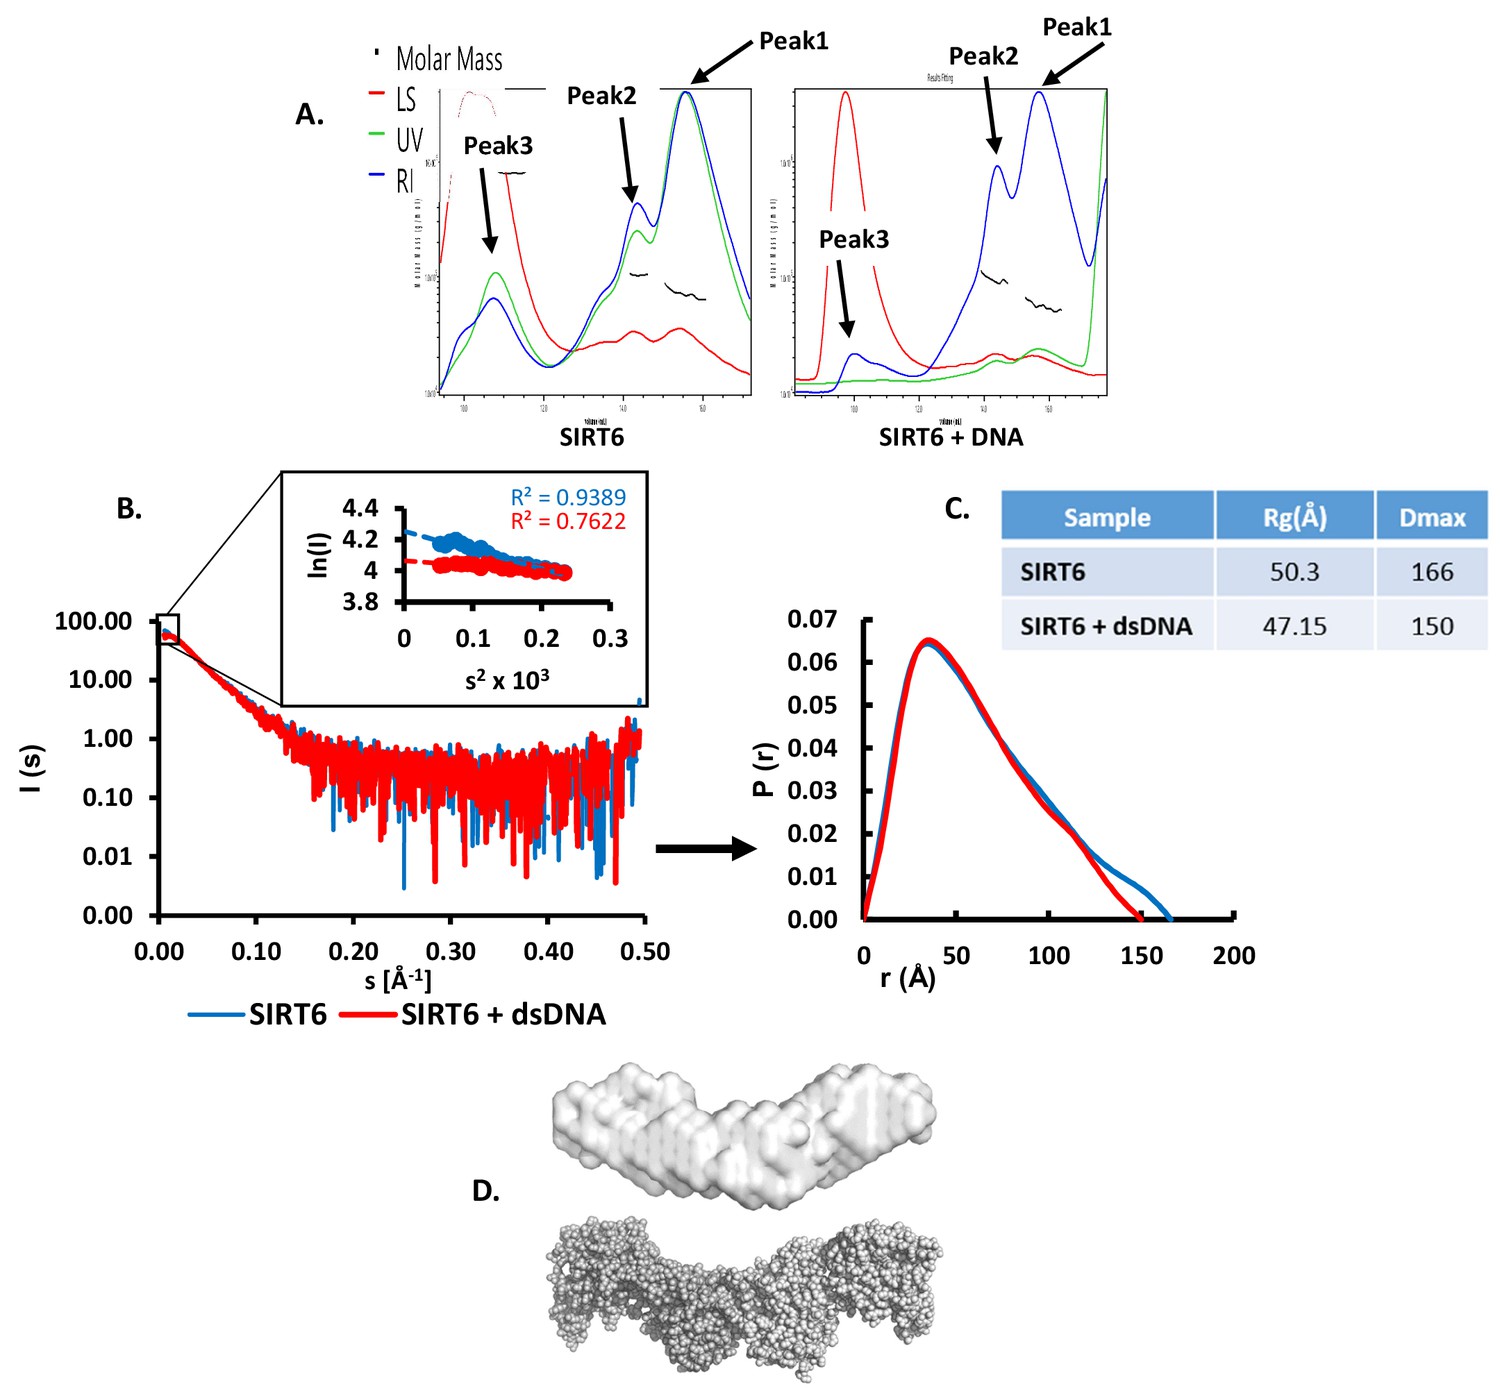
(A) SEC-MALS analysis of SIRT6 or of SIRT6 with a dsDNA 10-bp oligo with 3-bp overhanging ends on both sides. For SIRT6: Peak1 protein mass (calculated by UV) = 66.7 ± 3.3 kDa, protein mass (calculated by RI) = 70.7 ± 3.5 kDa; Peak2 protein mass (calculated by UV) = 114.3 ± 5.7 kDa, protein mass (calculated by RI) = 103.8 ± 4.9 kDa; Peak3 protein mass (calculated by UV) = 609.7 ± 14.6 kDa, protein mass (calculated by RI) = 833.6 ± 16.4 kDa. For SIRT6 +DNA: Peak1 protein mass (calculated by UV) = 52.5 ± 3.1 kDa, protein mass (calculated by RI) = 55.7 ± 3.2 kDa; Peak2 protein mass (calculated by UV) = 99.4 ± 3.8 kDa, protein mass (calculated by RI) = 94.6 ± 3.5 kDa; Peak3 protein mass (calculated by UV) = extremely high, protein mass (calculated by RI) = 9224 ± 258 kDa. (B) X-ray scattering profile (right) and the distance distribution function (left) of SIRT6 (blue) and SIRT6 bound to dsDNA (red). (C) Overall parameters for small angle X-ray scattering of SIRT6 alone and of SIRT6 bound to dsDNA determined from the distance distribution function P(r). Rg is the radius of gyration, and Dmax is the maximum dimension of the particle. (D) SAXS structure of SIRT6 (grey surface). Ab initio models were reconstructed from SAXS data using the computer program DAMMIN (Svergun, 1999) and were averaged by the computer program DAMAVER (Volkov and Svergun, 2003). The crystal structure of SIRT6 tetramer (grey spheres) was extracted from the crystal structure of SIRT6 (pdb id: 3PKI) and compared with the obtained SAXS model in PyMOL (http://www.pymol.org).
Figure 4 with 1 supplement

SIRT6 binds DSB through its core domain.
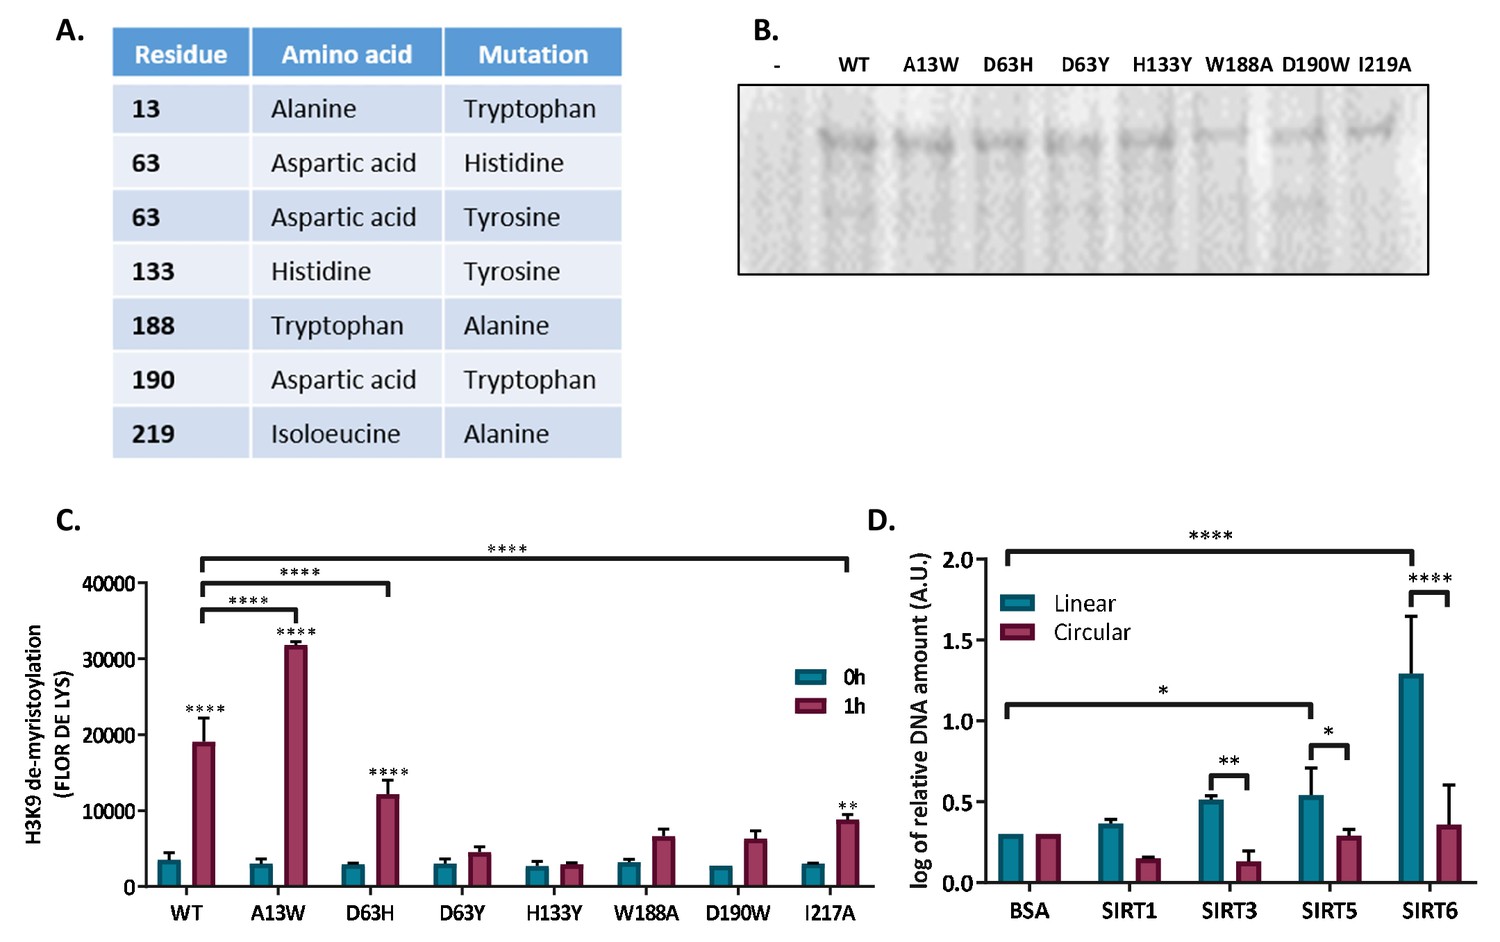
(A) Predicted DNA-binding site based on the published SIRT6 structure, (http://dnabind.szialab.org/). Highlighted in yellow are the predicted DNA-binding amino acids in the SIRT6 core domain; red highlights show the tunnel-forming amino acids that were mutated. (B) Schematic representation of the SIRT6 core domain. (C) List of amino acids that are predicted to participate in the ‘tunnel-like’ structure. (D) DNA binding of an open-ended plasmid by full-length SIRT6 (p<0.0005) and by the SIRT6-core domain (p<0.005). Data are the log of averages from three experiments (with error bars respresenting SEMs). (E) SIRT6 ssDNA-binding prediction, based on the known SIRT6 structure with bound ssDNA. (F, G) Gel retardation assay of 32 P-5′ end-labeled ssDNAs with SIRT6-MBP mutants. Data are averages from three experiments (with error bars representing SEMs). (H) Ability of Flag-tagged mammalian Sirtuins to bind the DNA of circular and linear plasmids. Data are averages from 4–7 experiments (with error bars representing SEMs) (*, p <0.05; **, p <0.005; ***, p <0.0005).
Figure 4—figure supplement 1
SIRT6 binds DSB through itscore domain.
(A) List of generated SIRT6 point mutations in the SIRT6 tunnel structure. (B) Ponceau staining of SIRT6-MBP point mutants. (C) Catalytic activity of SIRT6-MBP mutants, assessed by H3K9 de-myristolation in a FLUOR DE LYS assay. (D) Ability of His-tagged mammalian Sirtuins to bind the DNA circular and linear plasmids. Data are logs of the averages from 4–7 experiments (with error bars representing SEMs) (*, p<0.05; **, p<0.005; ***, p<0.0005).
Figure 5 with 1 supplement
SIRT6 can initiate the DNA damage response.
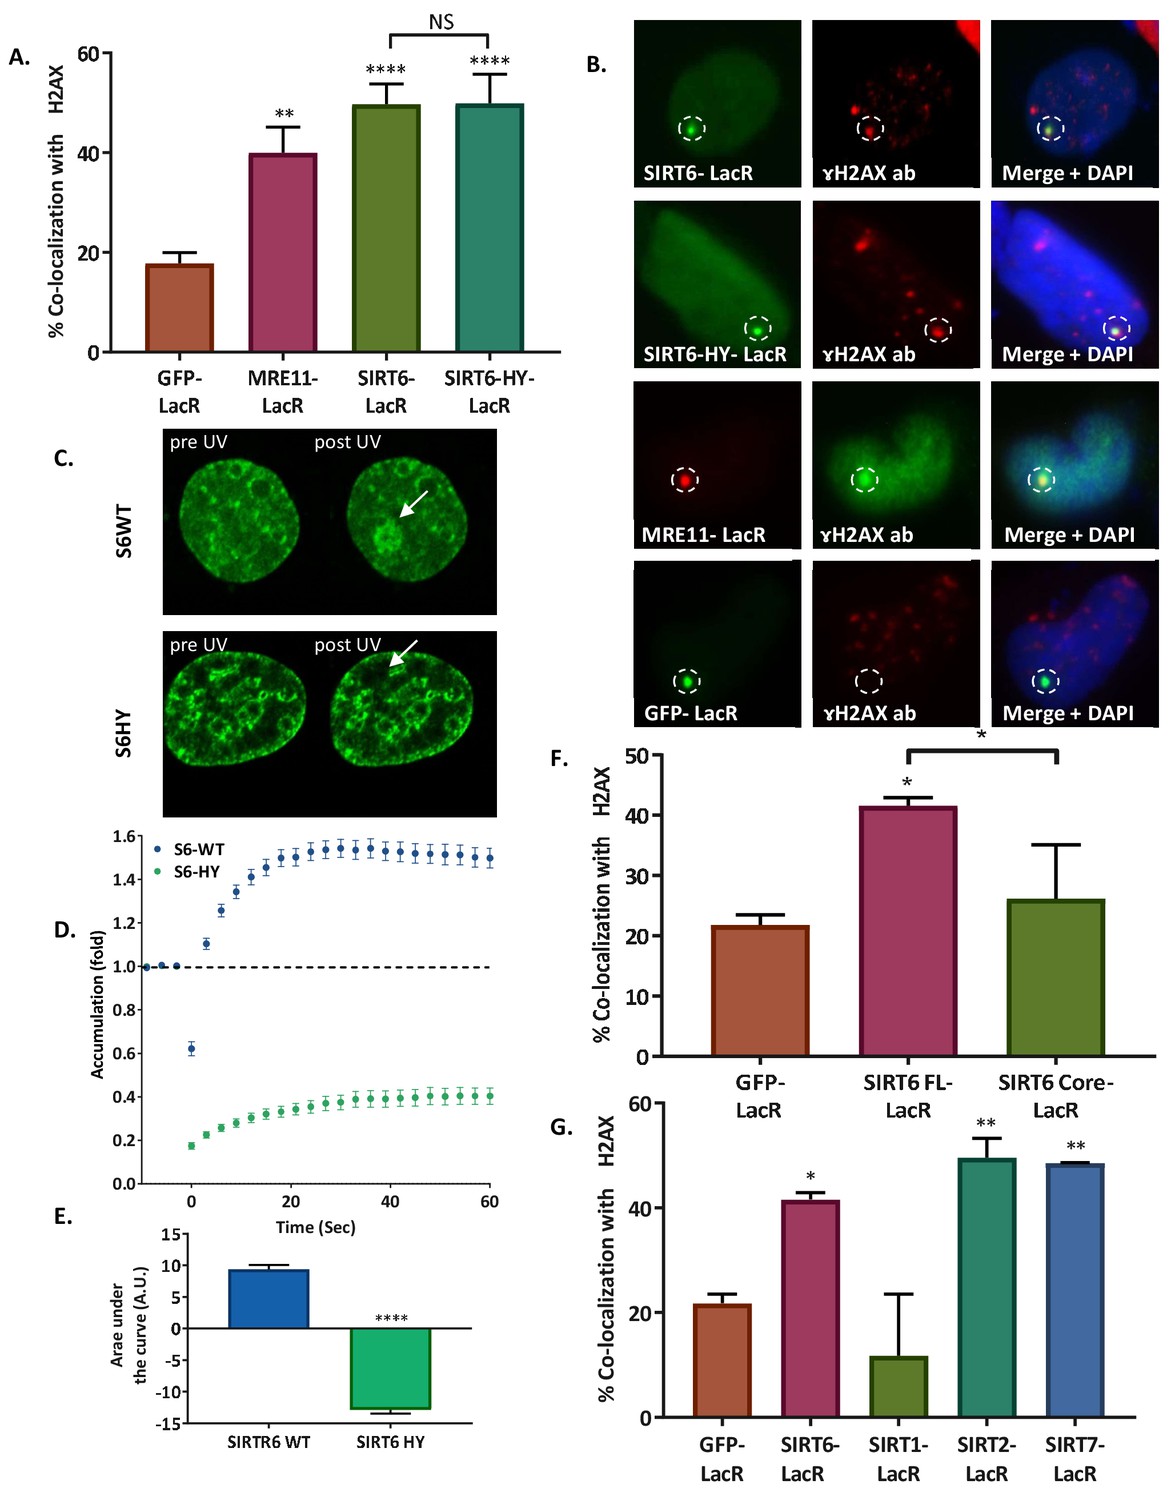
(A, B) Initiation of the DDR, measured by co-localization of MRE11-LacR-Cherry (n = 136, p<0.005), SIRT6-LacR-GFP (n = 243, p<0.0001) or SIRT6 HY-LacR-GFP (n = 71, p<0.0001), compared to GFP-LacR (n = 310). Data are means for 4–9 experiments (error bars are SEMs). (C, D) Live imaging upon laser-induced damage (LID) of SIRT6-WT-GFP (n = 20) or SIRT6-HY-GFP (n = 20) in SIRT6 KO U2OS cells (n = 20). (D) Accumulation over time in 3 s intervals. (E) Average area under the curve of for three LID experiments (error bars are SEMs) (n[S6-WT]=40, n[S6-HY]=39, p<0.0001). (F) Initiation of DDR by full-length SIRT6-LacR-GFP (n = 127, p<0.005), Core-LacR-GFP (n = 66, p>0.05) or GFP-LacR (n = 64). Data are averages from 3–4 experiments (error bars show SEMs). (G) Initiation of DDR by SIRT6-LacR-GFP (n = 127, p<0.05), SIRT1-LacR-GFP (n = 44, p>0.05), SIRT2-LacR-GFP (n = 67, p<0.005), SIRT7-LacR-GFP (n = 68, p<0.005) or GFP-LacR (n = 64). Data are averages from 3–10 experiments (error bars show SEMs).
Figure 5—figure supplement 1
SIRT6 can initiatetheDNA damage response.
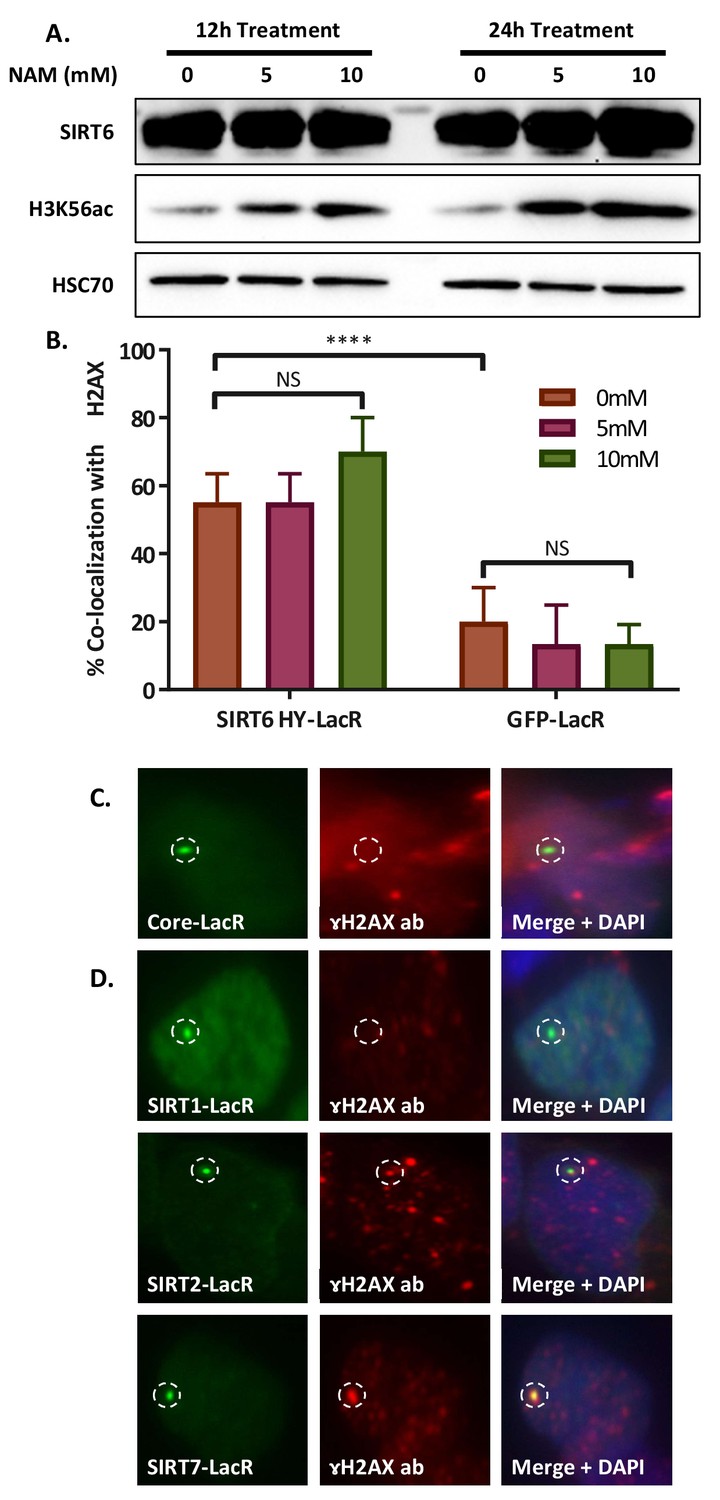
(A) Western blot of nuclear protein fraction of LacO containing U2OS cells after 12 or 24 hr treatment with 0, 5 or 10 mM nicotinamide (NAM) added to their media. (B) Co-localization percentage with γH2AX of SIRT6 HY-LacR-GFP and GFP-LacR after 24 hr of treatment with NAM at three concentrations (*, p<0.05; **, p<0.005; ***, p<0.0005). (C) Immunofluorescence (IF) of co-localization of Core-LacR-GFP (n = 66, p>0.05). Experiment quantification appears in Figure 5C. (D) IF of co-localization of SIRT1-LacR-GFP (n = 44, p>0.05), SIRT2-LacR-GFP (n = 67, p<0.005) and SIRT7-LacR-GFP (n = 68, p<0.005). Experiment quantification appears in Figure 5D.
Figure 6 with 3 supplements
SIRT6 can recruit enzymes of both the NHEJ and HR repair pathways.
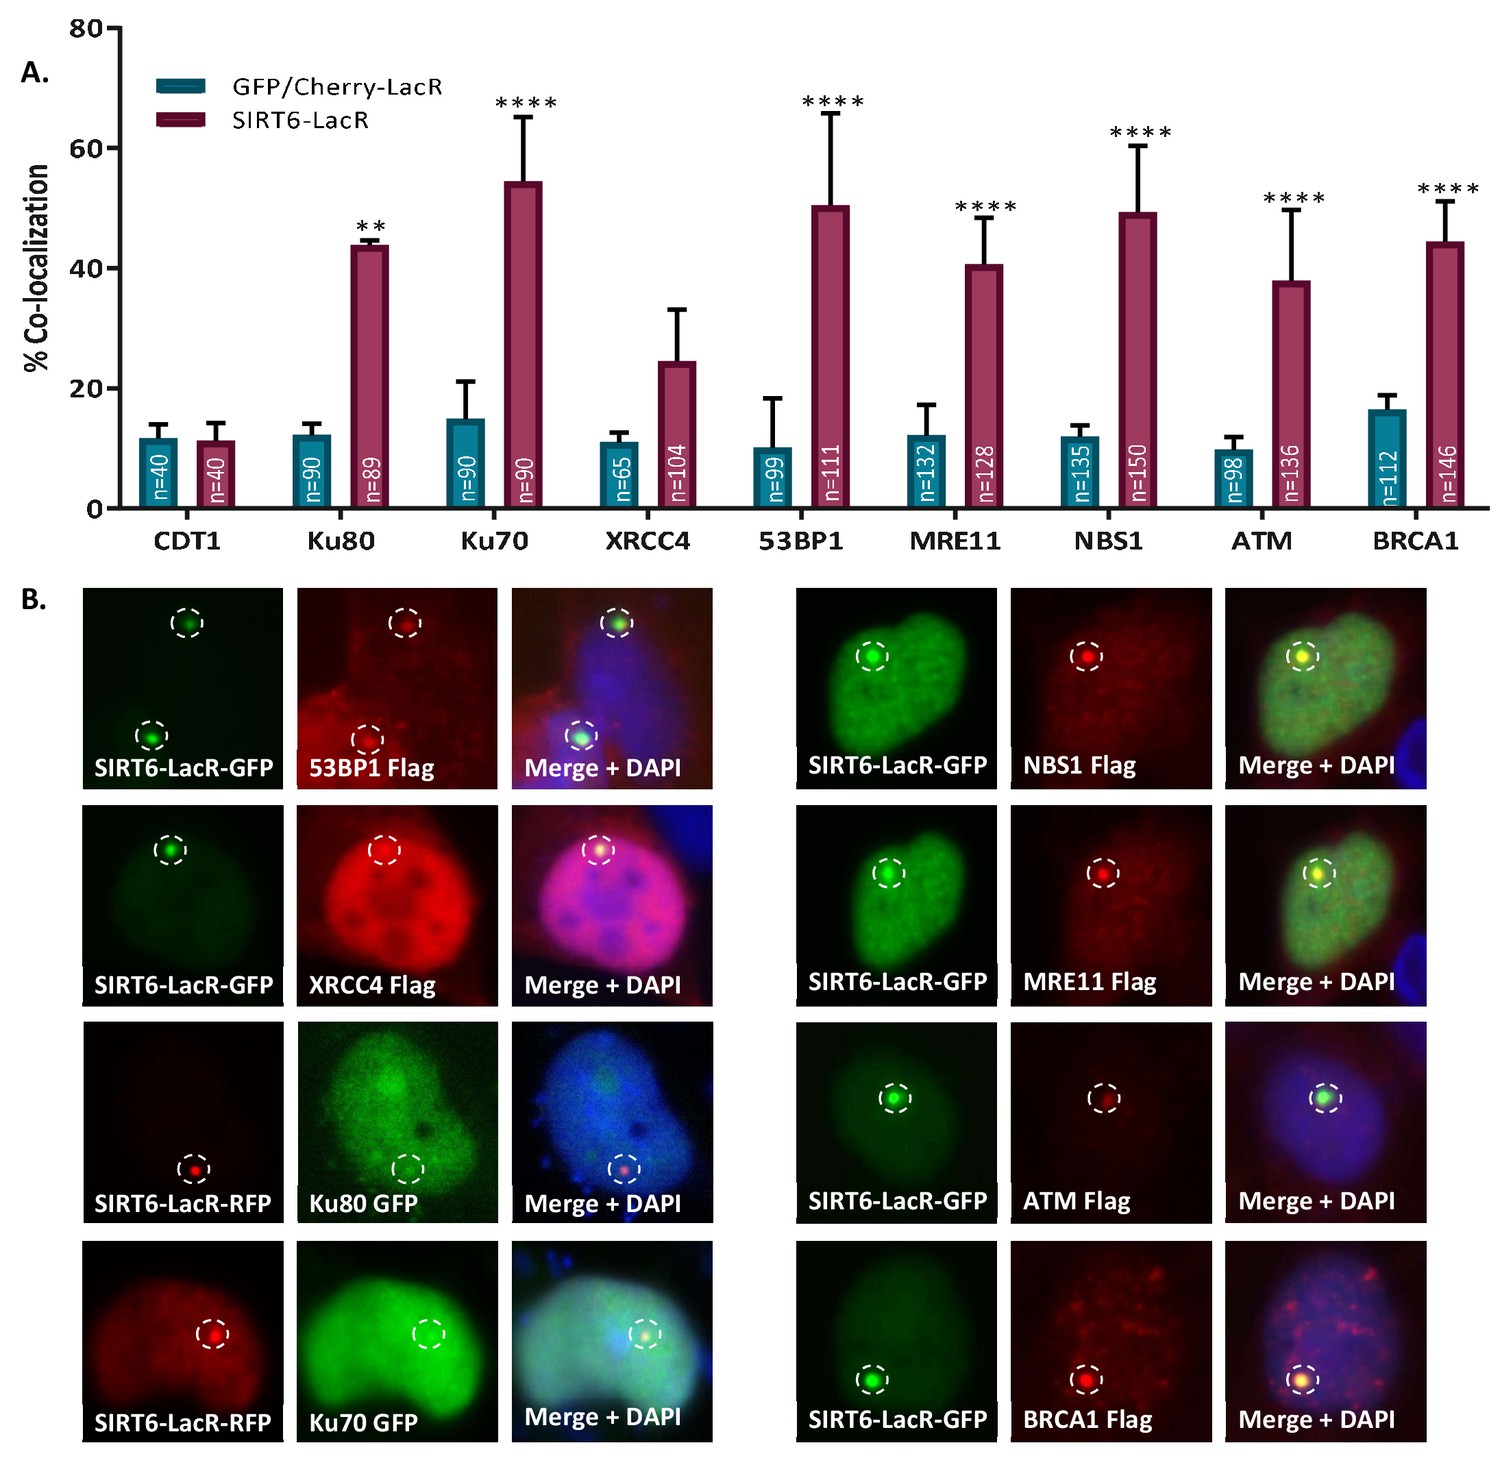
(A, B) Percentage repair enzymes that are co-localized with SIRT6-LacR-GFP/Cherry at LacO sites. IF with Flag antibody. Data are averages for 3–6 experiments (with error bars representing SEMs) (*, p<0.05; **, p<0.005; ***, p<0.0005; ****, p<0.00005).
Figure 6—figure supplement 1
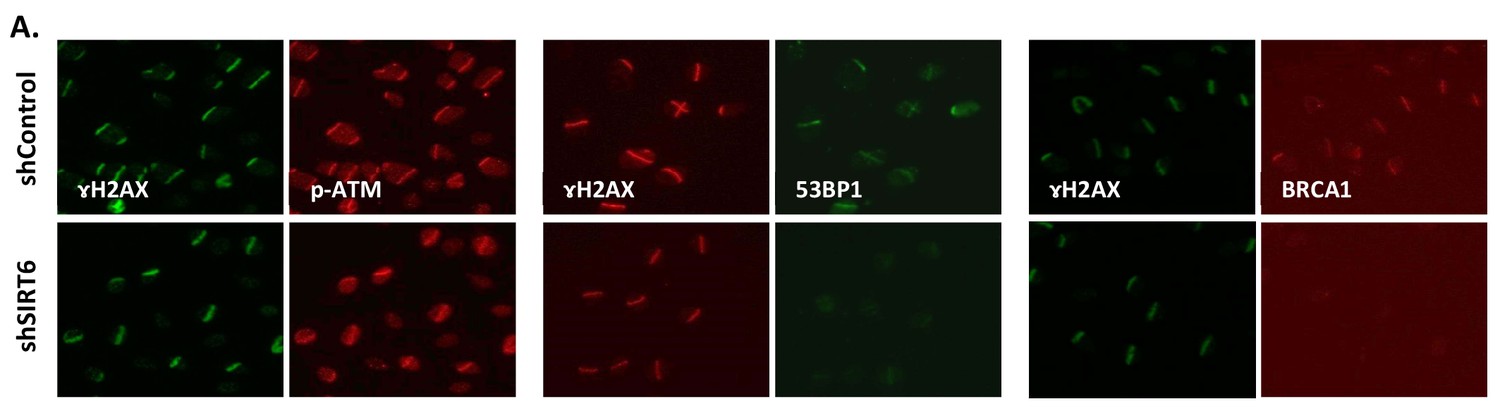
SIRT6 can recruit enzymes of boththeNHEJ and HR repair pathways.
(A) Laser-induced damage imaged by IF 30 min after damage. The images show recruitment of p-ATM, 53BP1 or BRCA1 in shControl or shSIRT6 U2OS.
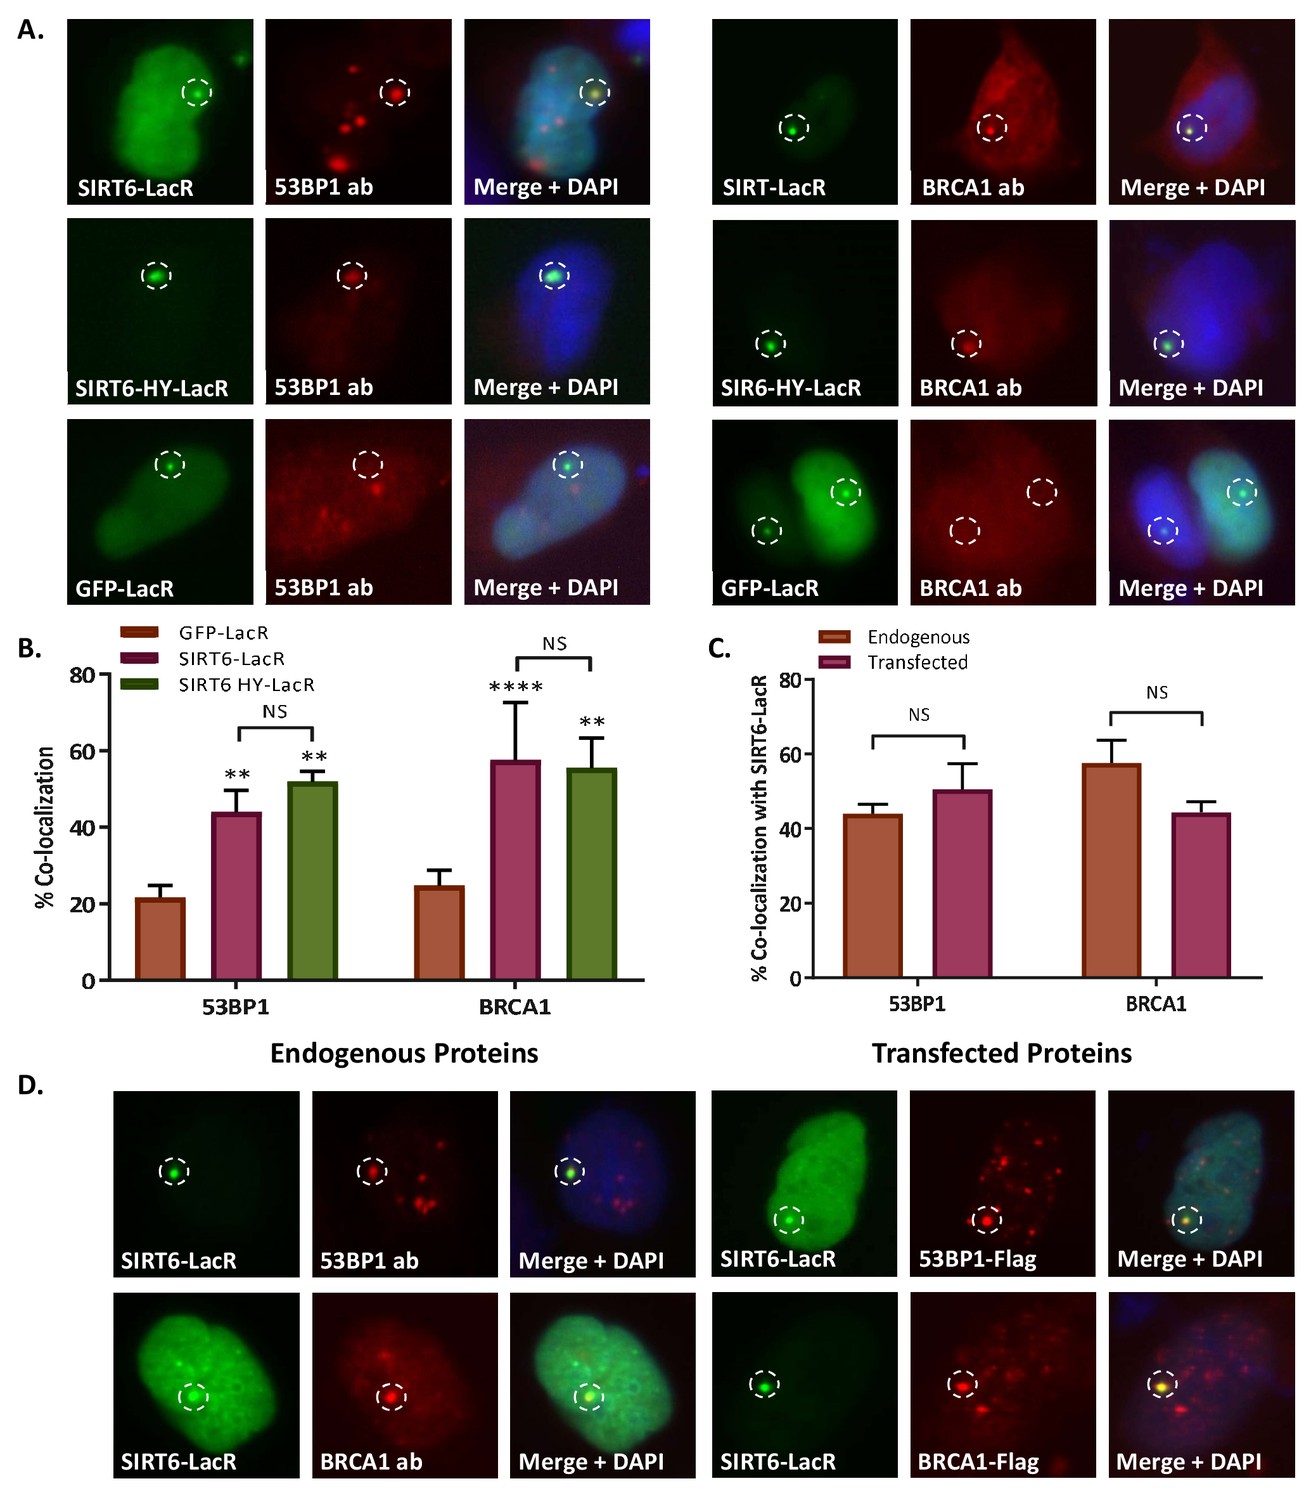
Figure 6—figure supplement 2
SIRT6 can recruit enzymes of boththeNHEJ and HR repair pathways.
(A, B) Co-localization of 53BP1 and BRCA1 with SIRT6-LacR-GFP (53BP1: n = 247, p<0.005; BRCA1: n = 223, p<0.005) and HY-LacR-GFP (53BP1: n = 113, p<0.005; BRCA1: n = 122, p<0.005), compared with GFP-LacR (53BP1: n = 130; BRCA1: n = 157). The data shown in panel (B) are averages from 3–5 experiments (error bars are SEMs). (C, D) Comparison of co-localization of endogenous 53BP1 (n = 247) and BRCA1 (n = 223) and transfected 53BP1-Flag (n = 111) and BRCA1-Flag (n = 146) with SIRT6-LacR-GFP, assessed by IF.
Figure 6—figure supplement 3

SIRT6 can recruit enzymes of boththeNHEJ and HR repair pathways.
(A) Schematic representation of the Tethering assay with inhibition of signaling using Wortmannin. (B–D) Co-localization of γH2AX (B), 53BP1 (C), and BRAC1 (D) with SIRT6-LacR-GFP or GFP/Cherry-LacR after 24 hr with or without Wortmannin. Data are averages for three experiments (error bars are SEMs). (B) Co-localization with γH2AX (0 μM: n[SIRT6] = 43, n[GFP] = 41; 1 μM: (n[SIRT6] = 42, n[GFP] = 42; 10 μM: (n[SIRT6] = 42, n[GFP]=41). (C) Co-localization with 53BP1 (0 μM: n[SIRT6] = 32, n[GFP] = 32; 1 μM: n[SIRT6] = 30, n[GFP] = 32; 10 μM: n[SIRT6] = 33, n[GFP] = 31). (D) Co-localization with BRCA1 (0 μM: n[SIRT6] = 30, n[GFP] = 32; 1 μM: n[SIRT6] = 31, n[GFP] = 31; 10 μM: n[SIRT6] = 32, n[GFP] = 31). (E) Co-localization of Ku80-Flag or MRE11-Flag with SIRT6-LacR-GFP or GFP/Cherry-LacR after 24 hr with or without Wortmannin. Data are averages for three experiments (error bars are SEMs). For Ku80-Flag — 0 μM: n[SIRT6] = 45, n[Cherry] = 53; 10 μM: n[SIRT6] = 45, n[Cherry] = 58. For MRE11-Flag — 0 μM: n[SIRT6] = 50, n[Cherry] = 56; 10 μM: n[SIRT6] = 60, n[Cherry] = 51. *, p<0.05; **, p<0.005; ***, p<0.0005; ****, p<0.00005).
Author response image 1

Validation on defective repair cell-lines.
(A) Foci quantification of ɤH2AX (in shATM and shH2AX) or 53BP1 (in shRNF8) for DDR impairment assessment in shHela cells from Mostoslavsky’s lab. Not included in the manuscript. (B) Blot of nuclear protein extraction of Hela cells knocked-down for ATM. (C) ɤH2AX foci quantification in Control (n[-IR]=283, n[+IR]=301), shH2AX (n[-IR]=284, n[+IR]=322) and shATM (n[-IR]=299, n[+IR]=385) Hela cells. The graph presents the percentage of cells that present either 0-3, 4-10 or above 10 foci per nucleus, with or without exposure to irradiation. The graph depicts an average of 6 experiments. (D) Samples of the IF of ɤH2AX in sh- Hela cells upon irradiation that were used in the quantification.
Author response image 2
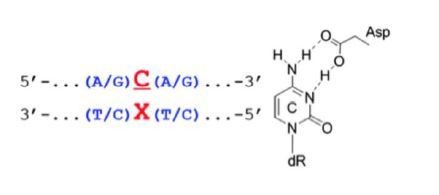
Aspartate basepairing with DNA bases and backbone.
Author response image 3
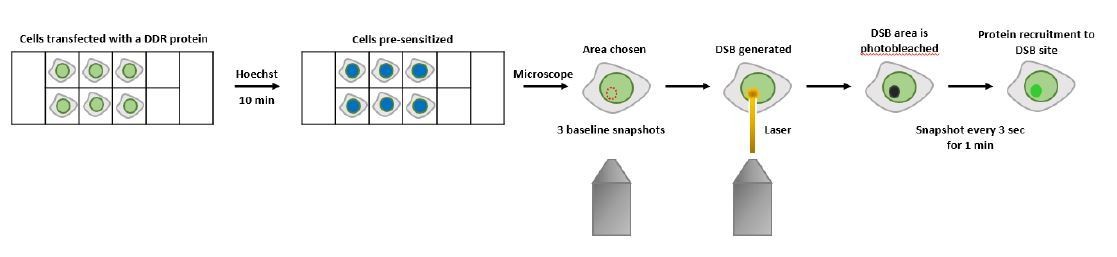
Scheme of Laser Induced damage (LID) experiment.
Author response image 4
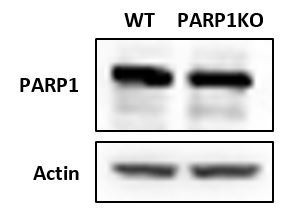
Western blot of Hela cells after attempt to create PARP1 KO using a CRISPR-Cas9 system.
Author response image 5

Co-localization analysis.
(A) LacR-ATM with SIRT6-GFP: Both are nuclear proteins that are usually found evenly spread across the entire nucleus. While we can see a sharp peak where the ATM-LacR focus is located, we do not see a peak of SIRT6-GFP at the same cellular location, which means there is no co-localization of the two proteins in this image. (B) LacR-SNF2H with SIRT6-RFP: A clear peak in the graph of the SNF2H-LacR is accompanied by a clear peak of the SIRT6-RFP, meaning positive co-localization. Since the red signal is much weaker than the green, the SIRT6 peak is much smaller than the SNF2H one. (C) LacR-Ku80 with SIRT6-RFP: In this case the SIRT6-RFP signal is much stronger that the Ku80-LacR GFP signal; however, we can still observe clear peaks at the same location. (D) LacR-GFP with SIRT6-RFP: In this negative control condition, there are no parallel peaks in the graph. However, when looking at the merged image we see that both cells are”yellow”. This just means that both signals are equally as strong (as can be seen in the graph as well) and that both proteins are spread throughout the entire nucleus; however, this is not a co-localization. (E-F) LacR-SIRT6 with 53BP1: When comparing endogenous 53BP1 (E) to the exogenous (F), we can see that using an endogenous antibody usually gives a “cleaner” higher peak with less background; however, in both cases the co-localization is clear.
Author response image 6

IF for ɤH2AX in in SIRT6-LacR-GFP expressing U2OS cells.
“New” vs. “Old” cells.
Tables
Table 1
DNA sequences used in the EMSA assay.
| DNA sequences used in the EMSA assays | |||
|---|---|---|---|
| ssDNA | 5′ | GGGAAAGTTGACGGGAGGGTATTGGAGGTTAGTGGAGGTGAGTGG | 3′ |
| ssDNA | 5′ | CCACTCACCTCCACTAACCTCCAATACCCTCCCGTCAACTTTCCC | 3′ |
| dsDNA-Blunt | 5′ | CCACTCACCTCCACTAACCTCCAATACCCTCCCGTCAACTTTCCC | 3′ |
| dsDNA-recessed | 5′ | CCACTCACCTCCACTAACCTCCAATACCCTCCCGTCAAC | 3′ |
| dsDNA-recessed | 5′ | ACCTCCACTAACCTCCAATACCCTCCCGTCAACTTTCCC | 3′ |
| dsDNA-Blunt | 5′ | AAGGTCGACACCACCTTTGAGAGCGCGCGGCCCACGCAGACCCACATGGCGCTGGTGCAGCTGGAGCGCGTGGGCCTCCTCCGCTTCCTGGTCAGCCAGAACGTCGACAAA | 3′ |
| dsDNA-recessed | 5′ | TCGACACCACCTTTGAGAGCGCGCGGCCCACGCAGACCCACATGGCGCTGGTGCAGC TGGAGCGCGTGGGCCTCCTCCGCTTCCTGGTCAGCCAGAACG | 3′ |
| RNA | 5′ | GCGAAGUCUUCGU | 3′ |
Table 2
Theoretical Rg (Å) derived from the SAXS data.
| Theoretical Rg (Å) | |
|---|---|
| SIRT6 dimer | 27.14 |
| SIRT6 tetramer | 36 |
| SIRT6 hexamer | 40 |
Key resources table
| Reagent type (species) or resource | Designation | Source or reference | Identifiers | Additional information |
|---|---|---|---|---|
| Recombinant DNA reagent | ATM-LacR-Cherry | Soutoglou and Misteli, 2008 | ||
| Recombinant DNA reagent | CDT1-TagRFP | ThermoFisher | P36237 | |
| Recombinant DNA reagent | CMV-Flag | Toiber et al., 2013 | ||
| Recombinant DNA reagent | MRE11-Flag | Wu et al., 2008 | ||
| Recombinant DNA reagent | MRE11-LacR-Cherry | Soutoglou and Misteli, 2008 | ||
| Recombinant DNA reagent | mRFP-SIRT6 | Kaidi et al., 2010 - retracted | ||
| Recombinant DNA reagent | NBS1-Flag | Wu et al., 2008 | ||
| Recombinant DNA reagent | NBS1-LacR-Cherry | |||
| Recombinant DNA reagent | pcDNA3.1(+)Flag-His-ATM-WT | Addgene | 31985 | |
| Recombinant DNA reagent | pcDNA5-FRT/T0-Flag-53BP1 | Addgene | 52507 | |
| Recombinant DNA reagent | pDEST 3x Flag-pcDNA5-FRT/T0-BRCA1 | Addgene | 52504 | |
| Recombinant DNA reagent | pEGFP-C1-FLAG-Ku70 | Addgene | 46957 | |
| Recombinant DNA reagent | pEGFP-C1-FLAG-Ku80 | Addgene | 46958 | |
| Recombinant DNA reagent | pEGFP-C1-FLAG-XRCC4 | Addgene | 46959 | |
| Recombinant DNA reagent | pEGFP- SIRT6 | Kaidi et al., 2010 - retracted | ||
| Recombinant DNA reagent | pET28 hSIRT6-His | Gertman et al., 2018 | ||
| Recombinant DNA reagent | pHPRT-DRGFP | Addgene | 26476 | |
| Recombinant DNA reagent | pMal-C2-hSIRT6-WT | Gertman et al., 2018 | ||
| Recombinant DNA reagent | pMal-C2-hSIRT6-A13W | This paper | ||
| Recombinant DNA reagent | pMal-C2-hSIRT6-D63H | This paper | ||
| Recombinant DNA reagent | pMal-C2-hSIRT6-D63Y | This paper | ||
| Recombinant DNA reagent | pMal-C2-hSIRT6-H133Y | Gertman et al., 2018 | ||
| Recombinant DNA reagent | pMal-C2-hSIRT6-D188A | This paper | ||
| Recombinant DNA reagent | pMal-C2-hSIRT6-D190W | This paper | ||
| Recombinant DNA reagent | pMal-C2-hSIRT6-I217A | This paper | ||
| Recombinant DNA reagent | pQCXIP-Cherry-LacR | This paper | ||
| Recombinant DNA reagent | pQCXIP-SIRT6 Core-GFP-LacR | This paper | ||
| Recombinant DNA reagent | pQCXIP-GFP-LacR | Addgene | 59418 | |
| Recombinant DNA reagent | pQCXIP-KU80-GFP-LacR | This paper | ||
| Recombinant DNA reagent | pQCXIP-mSIRT6-Cherry-LacR | This paper | ||
| Recombinant DNA reagent | pQCXIP-mSIRT6-GFP-LacR | This paper | ||
| Recombinant DNA reagent | pQCXIP-mSIRT6-H133Y-GFP-LacR | This paper | ||
| Recombinant DNA reagent | pQCXIP-SIRT1-GFP-LacR | This paper | ||
| Recombinant DNA reagent | pQCXIP-SIRT2- GFP-LacR | This paper | ||
| Recombinant DNA reagent | pQCXIP-SIRT7- GFP-LacR | This paper | ||
| Recombinant DNA reagent | SIRT1-Flag | Zhong et al., 2010 | ||
| Recombinant DNA reagent | SIRT2-Flag | Addgene | 13813 | |
| Recombinant DNA reagent | SIRT3-Flag | Addgene | 13814 | |
| Recombinant DNA reagent | SIRT4-Flag | Addgene | 13815 | |
| Recombinant DNA reagent | SIRT5-Flag | Addgene | 13816 | |
| Recombinant DNA reagent | SIRT6 Core | Tennen et al., 2010 | ||
| Recombinant DNA reagent | mSIRT6-WT-Flag | Zhong et al., 2010 | ||
| Recombinant DNA reagent | SIRT7-Flag | Addgene | 13818 | |
| Recombinant DNA reagent | SNF2H-WT-GFP-LacR | Klement et al., 2014 | ||
| Antibody | Alexa Fluor 488 AffiniPure Donkey Anti-Rabbit IgG (H+L) | Jackson Immunoresearch | 711-545-152 | IF (1:200) |
| Antibody | Alexa Fluor 594 AffiniPure Donkey Anti-Rabbit IgG (H+L) | Jackson Immunoresearch | 711-585-152 | IF (1:200) |
| Antibody | Alexa Fluor 488 AffiniPure Donkey Anti-Mouse IgG (H+L) | Jackson Immunoresearch | 715-545-150 | IF (1:200) |
| Antibody | Alexa Fluor 594 AffiniPure Goat Anti-Mouse IgG (H+L) | Jackson Immunoresearch | 115-585-062 | IF (1:200) |
| Antibody | 53 BP1 | Snata-Cruz Biotechnology | sc-22760 | IF (1:300) |
| Antibody | BRCA1 | Snata-Cruz Biotechnology | sc-7298 | WB (1:1000) |
| Antibody | Flag | Sigma-Aldrich | F1804 | IF (1:900), WB (1:1000) |
| Antibody | Flag Beads | Sigma-Aldrich | A2220 | IP |
| Antibody | gamma H2A.X (phospho s139) | abcam | ab2893 | IF(1:3000), WB (1:1000) |
| Antibody | Goat Anti-Rabbit IgG H and L (HRP) | abcam | ab6721 | WB (1:10000) |
| Antibody | Histone H3 | abcam | ab1791 | WB (1:5000) |
| Antibody | Histone H3 (acetyl K56) | abcam | ab76307 | WB (1:1000) |
| Antibody | HSC 70 | Snata-Cruz Biotechnology | sc-7298 | WB (1:1000) |
| Antibody | Ku80 | Cell Signaling | #2180 | WB (1:1000) |
| Antibody | MRE11 | abcam | ab214 | WB (1:1000) |
| Antibody | phospho-ATM (Ser1981) | Cell Signaling | #5883 | WB (1:1000) |
| Antibody | phospho-Histone H2A.X (Ser139) | Millipore | 05–636 | IF (1:1500) |
| Antibody | Rabbit Anti-Mouse IgG H and L (HRP) | abcam | ab97046 | WB (1:10000) |
| Antibody | SIRT6 | abcam | ab62739 | WB (1:1000) |
| Antibody | Tubulin | Merck | MAB1637 | WB (1:1000) |
| Peptide, recombinant protein | SIRT1 Human | PROSPEC | PRO-1909 | DNA binding assay |
| Peptide, recombinant protein | SIRT3 Human | PROSPEC | PRO-462 | DNA binding assay |
| Peptide, recombinant protein | SIRT5 Human | PROSPEC | PRO-1774 | DNA binding assay |
| Peptide, recombinant protein | SIRT6 Human | PROSPEC | PRO-282 | DNA binding assay |
Additional files
Download links
A two-part list of links to download the article, or parts of the article, in various formats.
Downloads (link to download the article as PDF)
Open citations (links to open the citations from this article in various online reference manager services)
Cite this article (links to download the citations from this article in formats compatible with various reference manager tools)
SIRT6 is a DNA double-strand break sensor
eLife 9:e51636.
https://doi.org/10.7554/eLife.51636


