KIT ligand protects against both light-induced and genetic photoreceptor degeneration
- Laboratory of Developmental Cell Biology and Disease, School of Ophthalmology and Optometry and Eye Hospital, Wenzhou Medical University, China
- State Key Laboratory of Ophthalmology, Optometry and Vision Science, Wenzhou Medical University, China
- GHM Institute of CNS Regeneration, Jinan University, China
Figures
Figure 1 with 3 supplements
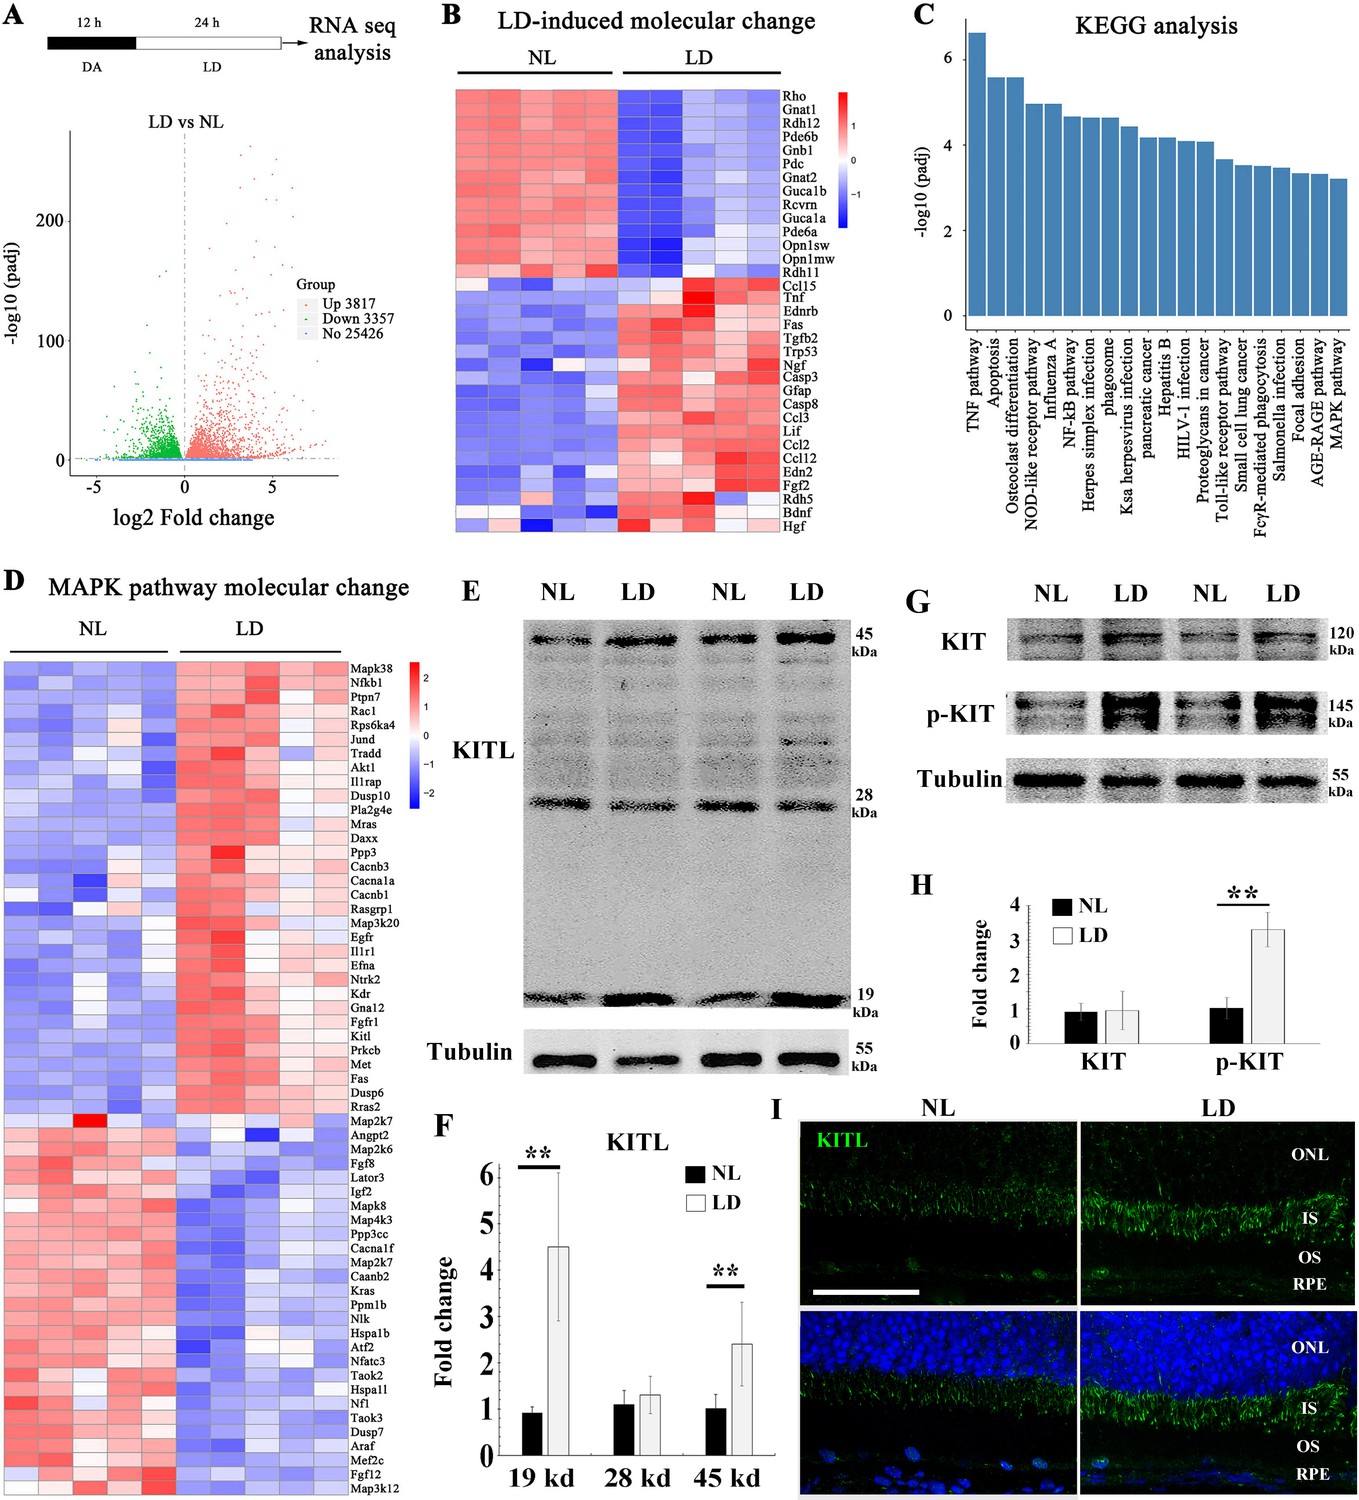
Light damage induces increased expression of KITL and activation of KIT in mouse retina.
(A) Schematic representation of time frame and analysis of light damage (LD). Two-month-old albino mice were raised in the dark for 12 hr and then exposed to constant white light of 15,000 lux for 1 day to induce retinal damage. The volcano map of transcriptome analysis shows a global view of gene expression. (B) Heat map of the selective LD-induced differentially expressed reported genes. The columns for NL (normal light) or LD represent the results from five biological replicates. (C) The bar graph of KEGG analysis shows the top 20 differentially activated signaling pathways. (D) Heat map shows the differentially expressed genes of the MAPK pathway. (E) Western blotting analysis of KITL in retinas after LD. (F) Quantification of western blot bands shows the expression levels of the KITL. Note that both the 19 kDa and 45 kDa isoforms of KITL were upregulated by LD. (G) Western blot analysis of the tyrosinase kinase receptor KIT (upper panels) and its phosphorylated form (lower panels) in the retinas after LD. (H) Quantification of western blot bands show the expression levels of KIT and its phosphorylation levels. Note that p-KIT was upregulated by LD. (I) Immunostaining of light-treated retina detected by anti-KITL antibody. Each image is representative of at least five retinas. IS, photoreceptor inner segments; ONL, outer nuclear layer; OS, photoreceptor outer segments. ** indicates p<0.01. Scale bar, 50 μm.
Figure 1—figure supplement 1
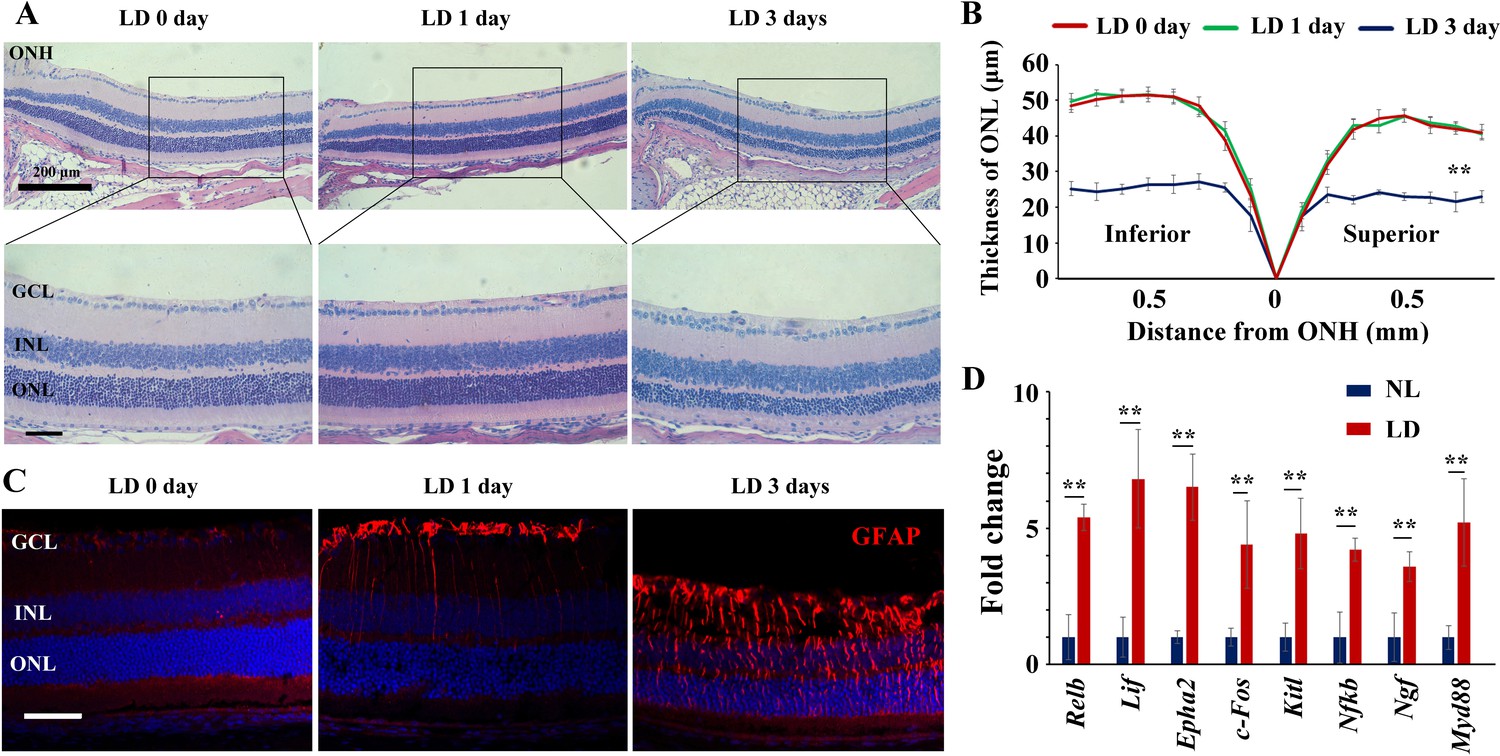
High-intensity light induces retinal damage in albino mice.
(A, B) Histological images of HE staining from the retinas (A) and thickness of the outer nuclear layer (ONL) at various distances from the ONH based on the results of hematoxylin-eosin staining (B). Note that the structure was significantly changed in retinas treated with high intensity LD for 3 days instead of 1 day. (C) Immunofluorescence images of anti-GFAP antibody in retinas from 2-month-old albino mice kept under the indicated conditions. Note that LD induces increased expression of GFAP in the retinas treated for 1 day or 3 days. (D) RT-PCR data show changes in transcript levels of MAPK pathway genes in albino neural retinas in response to LD. GCL, ganglion cell layer; INL, inner nuclear layer; IS, inner segments; ONL, outer nuclear layer; OS, outer segments; PL, photoreceptor cell layer; ONH, optic nerve head. ** indicates p<0.01. Bar: 50 μm.
-
Figure 1—figure supplement 1—source data 1
Source data for the diagram in Figure 1-figure supplement 1B.
- https://cdn.elifesciences.org/articles/51698/elife-51698-fig1-figsupp1-data1-v3.xlsx
Figure 1—figure supplement 2
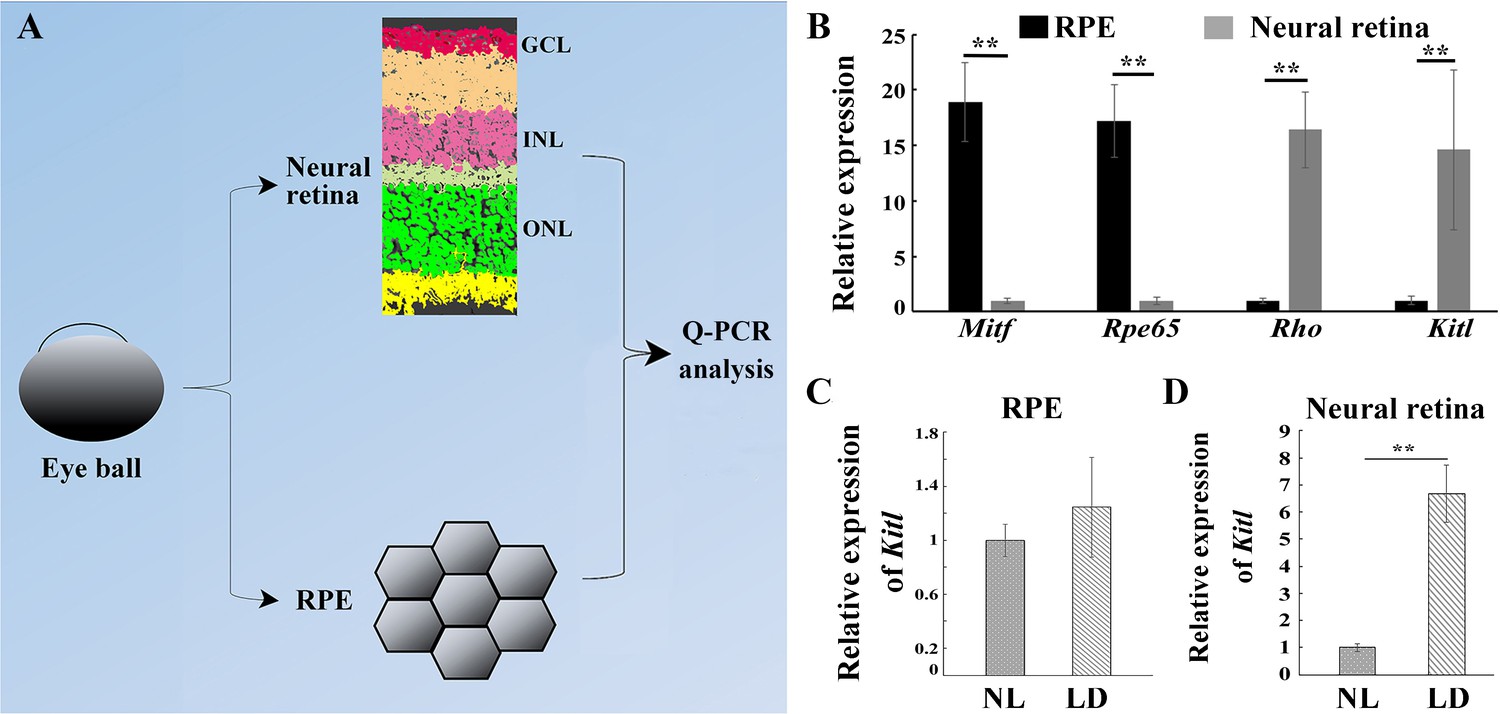
The level of KITL protein is much higher in photoreceptor cells compared to RPE cells.
(A) Diagram showing separation of the eye ball into RPE and neural retina separately used for examining Kitl mRNA. (B) Q-PCR data show expression of Mitf, Rpe65, Rhodopsin (Rho) and Kitl in RPE and neural retinas from 2-month-old albino mice kept under normal light conditions (NL). (C, D) Bar graphs show the relative expression of Kitl in RPE (C) and neural retinas (D) from 2-month-old albino mice kept under NL or high intensity (15,000 lux) light (LD) conditions for 1 day. GCL, ganglion cell layer; INL, inner nuclear layer; ONL, outer nuclear layer; WB, western blotting. ** indicates p<0.01.
Figure 1—figure supplement 3

LD induces Kitl expression in photoreceptor cells.
(A) Diagram showing separation of the eye ball into RPE and neural retina and the portion of the retina and RPE separately used for examining KITL protein. (B) Western blots showing the expression of MITF, Rhodopsin and KITL in the RPE and photoreceptor cells from 2-month-old C57BL/6J mice kept under normal light condition. (C) The bar graph shows the relative protein level of KITL in the photoreceptor cells and RPE cells based on the results of western blots. (D) Representative images of in situ hybridization using a Kitl probe show Kitl expression in the RPE and photoreceptor cells under the indicated conditions. GCL, ganglion cell layer; INL, inner nuclear layer; ONL, outer nuclear layer. ** indicates p<0.01. Bar: 50 μm.
Figure 2 with 2 supplements
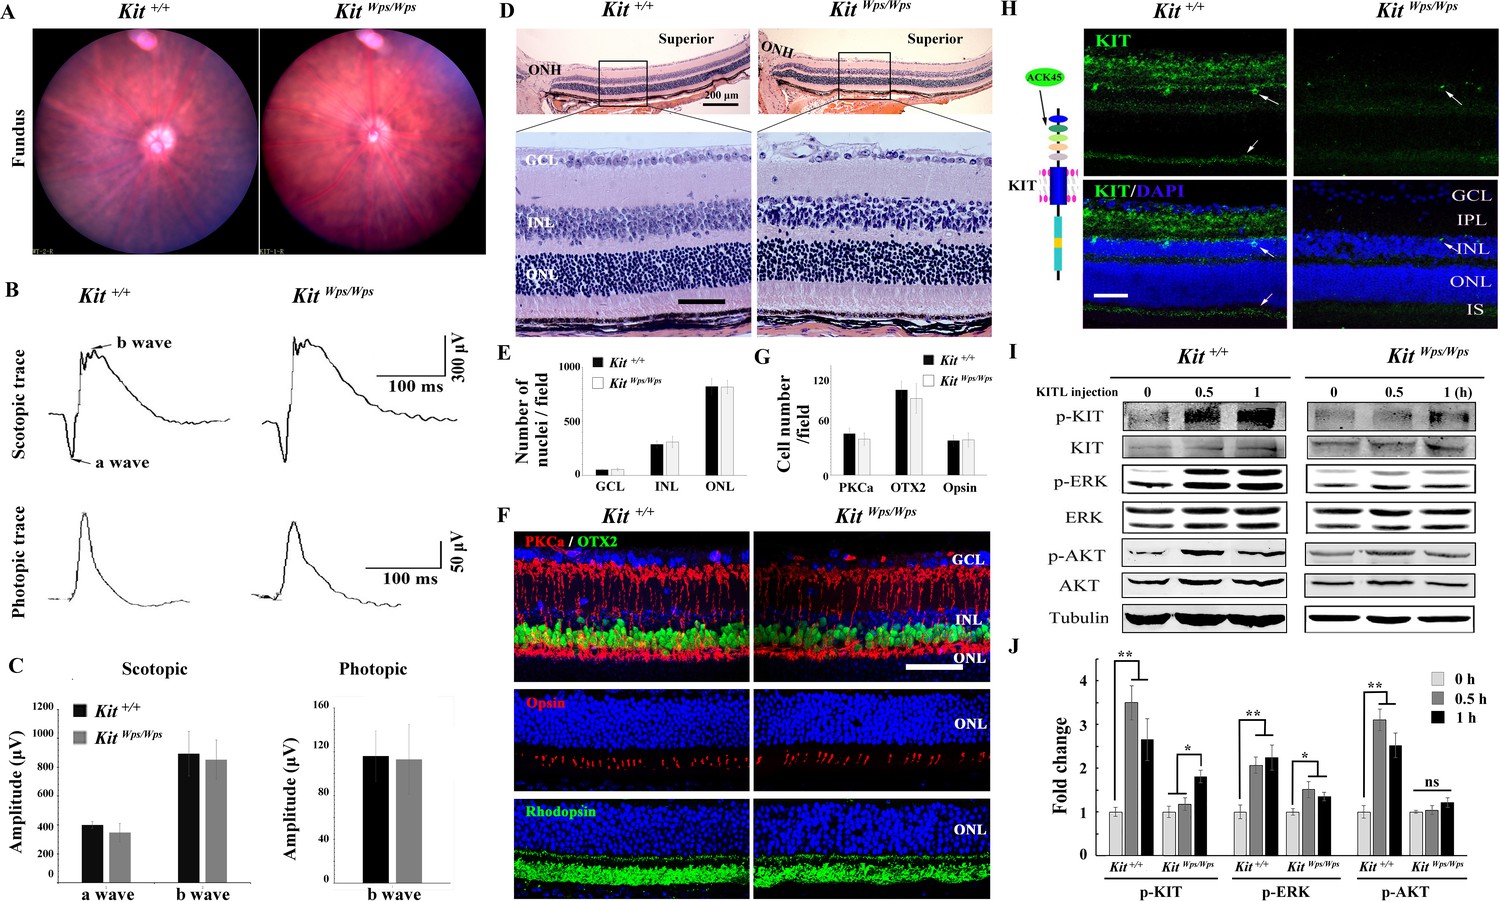
No changes in retinal cell distribution and structure, but disruption of Kit activation in KitWps/Wps retina.
(A) Fundus images of 2-month-old Kit+/+ and KitWps/Wps mice. (B) ERG traces of Kit+/+ (left panels) and KitWps/Wps (right panels) retinas under scotopic (upper panels) and photopic conditions (lower panels). (C) Quantification of ERG amplitudes under scotopic and photopic conditions. (D, E) Histological images of H and E staining from 2-month-old Kit+/+ and KitWps/Wps retinas (D) and quantification showing the mean number of nuclei localized at GCL, INL, and ONL over the length of 0.35 mm between 300 μm to 700 μm from the optic nerve head in dorsal retina of Kit+/+ and KitWps/Wps mice (n = 5) (E). Representative histological sections are from superior retinas 0.3 mm from the optic nerve head. (F) Immunohistochemistry for OTX2, PKCα, Opsin and Rhodopsin in 2-month-old Kit+/+ and KitWps/Wps retinas. (G) Quantification of OTX2+, PKCα+ and Opsin+ cells in the indicated retinas. Each image is representative for at least five retinas. The analyzed sectional numbers are from at least 30 sections from at least five retinas. (H) Schematic representation of KIT protein structure and the location recognized by the ACK45 antibody (left panels) and immunostaining images of ACK45 antibody in 3-month-old Kit+/+ and KitWps/Wps retinas (right panels). (I) Western blots show phosphorylation of KIT, ERK and AKT in Kit+/+ and KitWps/Wps retinas after the injection of KITL (5.6 nM) at the indicated time points. (J) Quantification of western blot bands shows the phosphorylation levels of KIT, ERK and AKT. GCL, ganglion cell layer; IPL, inner plexiform layer; INL, inner nuclear layer; IS, photoreceptor inner segments; ONL, outer nuclear layer; OS, photoreceptor outer segments. Arrows in panels H indicate KIT-positive signal. * or ** indicates p<0.05 or p<0.01. Scale bar, 50 μm.
-
Figure 2—source data 1
Source data for the graphs in Figure 2C.
- https://cdn.elifesciences.org/articles/51698/elife-51698-fig2-data1-v3.xlsx
Figure 2—figure supplement 1
The KitWps mutation does not affect KIT expression.
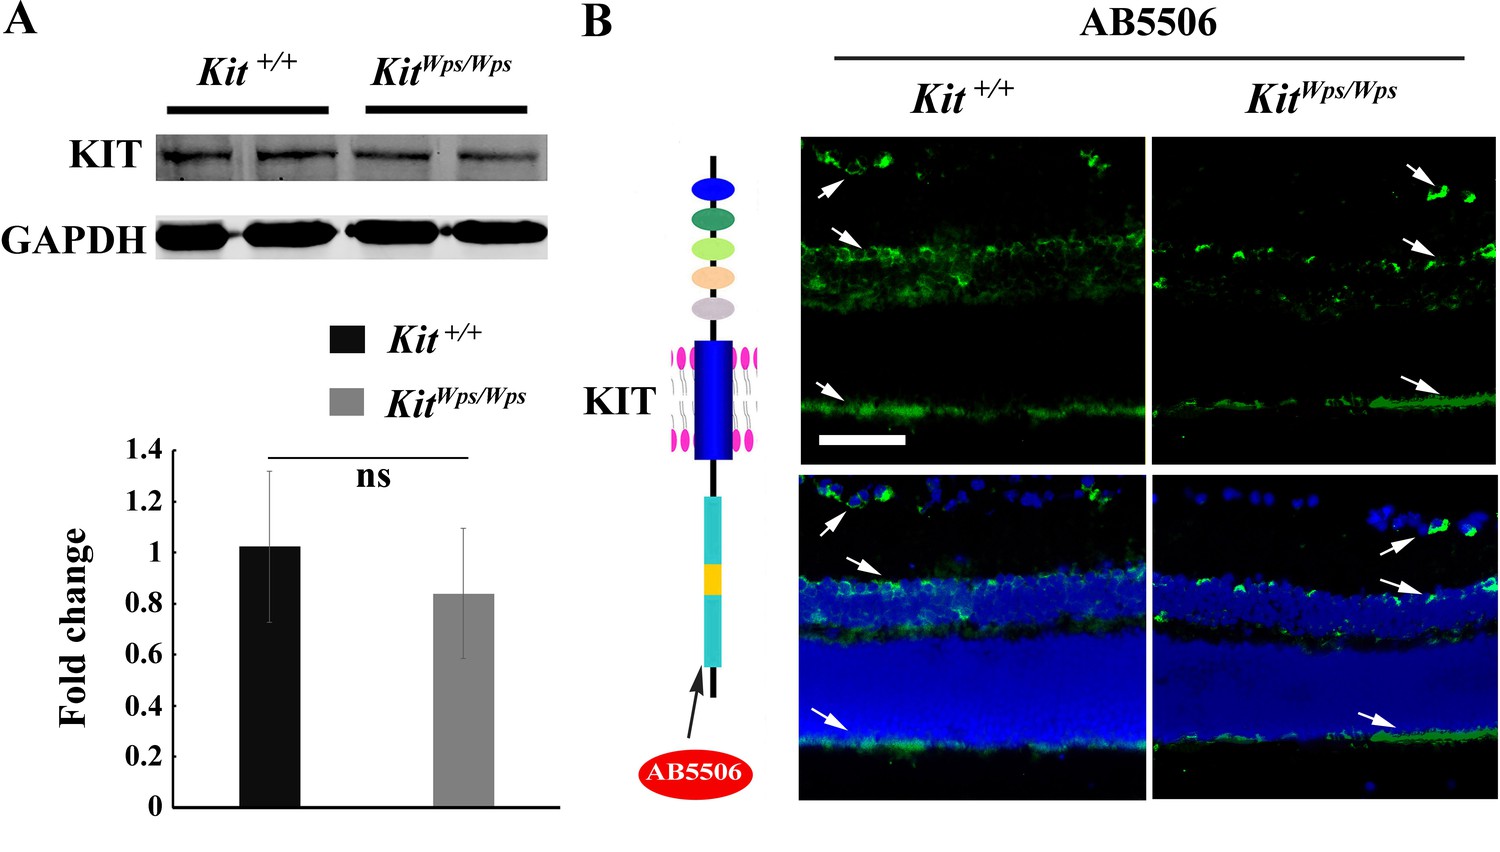
(A) Western blots showing expression of KIT in Kit+/+ and KitWps/Wps retinas (upper panels) using antibodies reacting with the KIT C terminus (AB5506) and bar graph showing no apparent difference of KIT expression between wildtype and mutant retinas (lower panels). (B) Schematic representation of KIT protein structure and the location recognized by the AB5506 antibody (left panels) and immunostaining images of AB5506 antibody in 3-month-old Kit+/+ and KitWps/Wps retinas (right panels). GCL, ganglion cell layer; INL, inner nuclear layer; ONL, outer nuclear layer. Arrows in panels B indicate the positive signal for KIT. Bar: 50 μm.
Figure 2—figure supplement 2
KIT is expressed in photoreceptor cells.
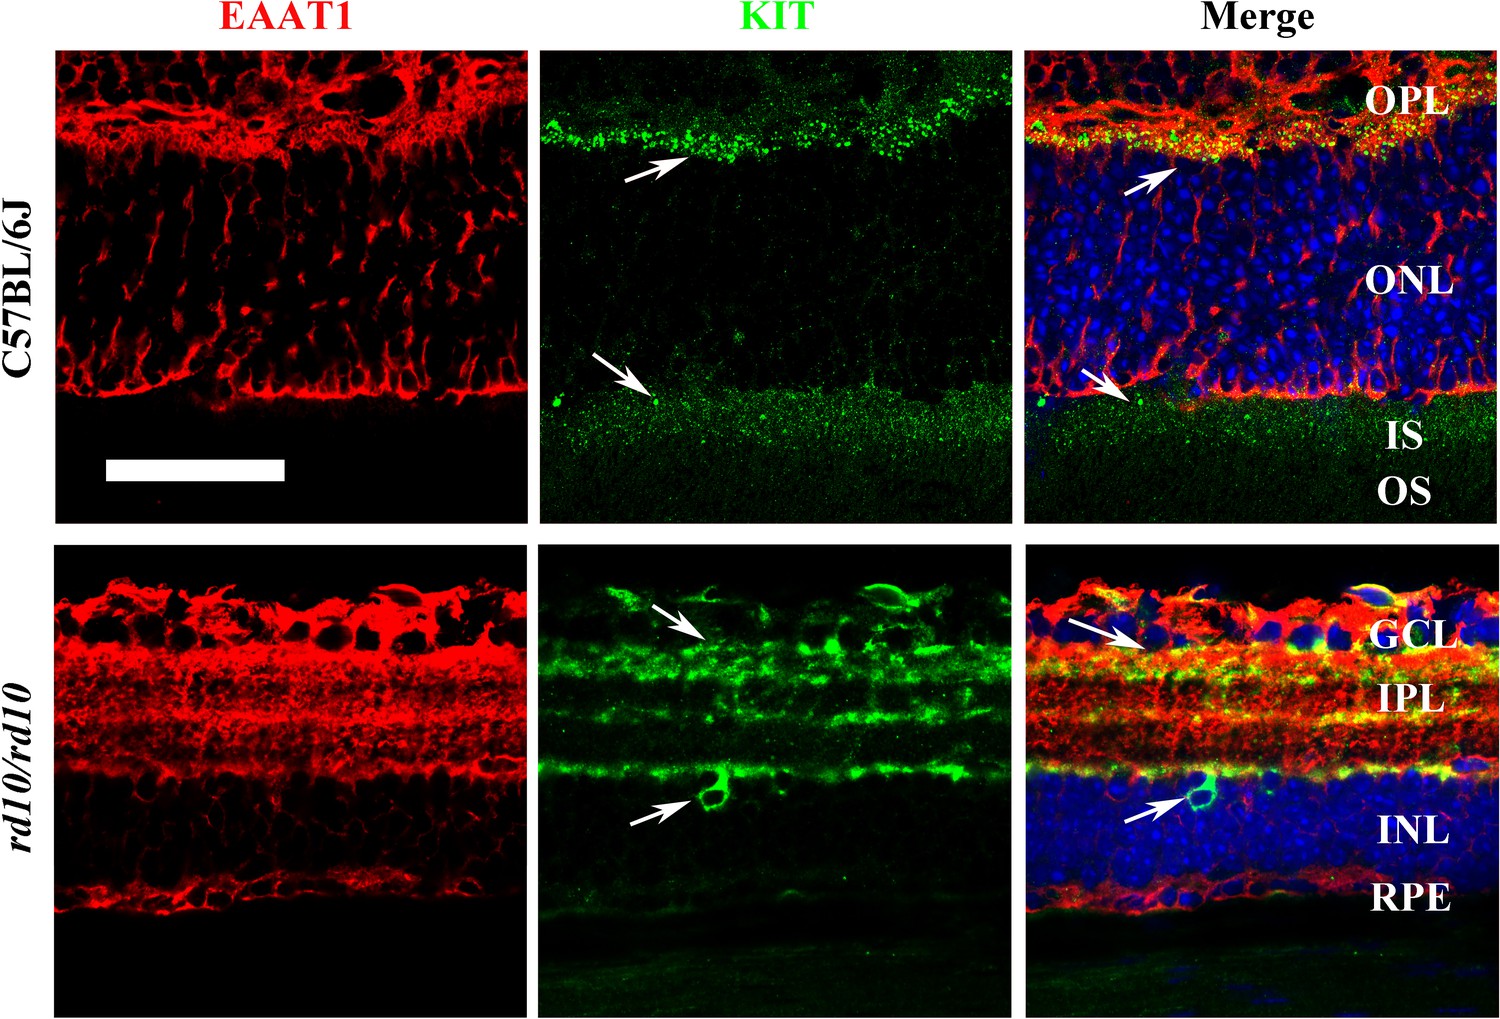
Representative double immunostaining images of EAAT1 and KIT in the retinas from C57BL/6J (upper panels) and rd10/rd10 mice (lower panels) at 2 months of age. Allows indicate the positive signal for KIT. GCL, ganglion cell layer; IPL, inner plexiform layer; INL, inner nuclear layer; OPL, outer plexiform layer; ONL, outer nuclear layer; IS, inner segment; OS, outer segment. Bar: 50 μm. The white arrows indicate positive KIT staining.
Figure 3

KitWps mutation significantly damages retinal function and accelerates retinal degeneration during LD.
(A) Schematic representation of LD treatment of mice for B-G. Three-month-old Kit+/+ and KitWps/Wps mice were raised in the dark for one day, and then exposed to constant high intensity light of 15,000 lux for 8 days with mydriasis treatment to induce retinal damage. Retinal functions were subsequently assessed by electroretinography (ERG) after one day dark adaptation. (B) ERG traces of Kit+/+ (left panels) and KitWps/Wps (right panels) retinas before and after LD treatment under scotopic (upper panels) and photopic conditions (lower panels). Note that both scotopic and photopic responses of the KitWps/Wps retinas were similar to those of Kit+/+ retinas with normal light (NL). Usually, the scotopic ERG result is shown as step-wise figure. (C and D) Quantification of ERG amplitudes under scotopic (C) and photopic conditions (D). Note that both scotopic and photopic responses of KitWps/Wps retinas were impaired more severely than those in Kit+/+ retinas. Each trace is the average of individual records from at least five mice. (E) Retinal degeneration analysis of Kit+/+ and KitWps/Wps mice before and after LD treatment by HE staining (a), GFAP staining (b), Rhodopsin staining (c) and TUNEL detection (d). Arrows point to the weakened signal or abnormal translocation signal of the rhodopsin (c) and dead cells (d). (F) The curve diagram shows the thickness of ONL from Kit+/+ and KitWps/Wps retinas under NL or high-intensity LD conditions. (G) Quantification of the number of TUNEL-positive cells in the ONL. GCL, ganglion cell layer; I, inferior; INL, inner nuclear layer; IS, photoreceptor inner segments; ONL, outer nuclear layer; S, superior. ** indicates p<0.01. Scale bar, 50 μm.
-
Figure 3—source data 1
Source data for the graphs in Figure 3C, D, G and the diagram in Figure 3F.
- https://cdn.elifesciences.org/articles/51698/elife-51698-fig3-data1-v3.xlsx
Figure 4 with 2 supplements
Overexpression of KITL by AAV8-KITL virus prevents light-induced retinal degeneration.
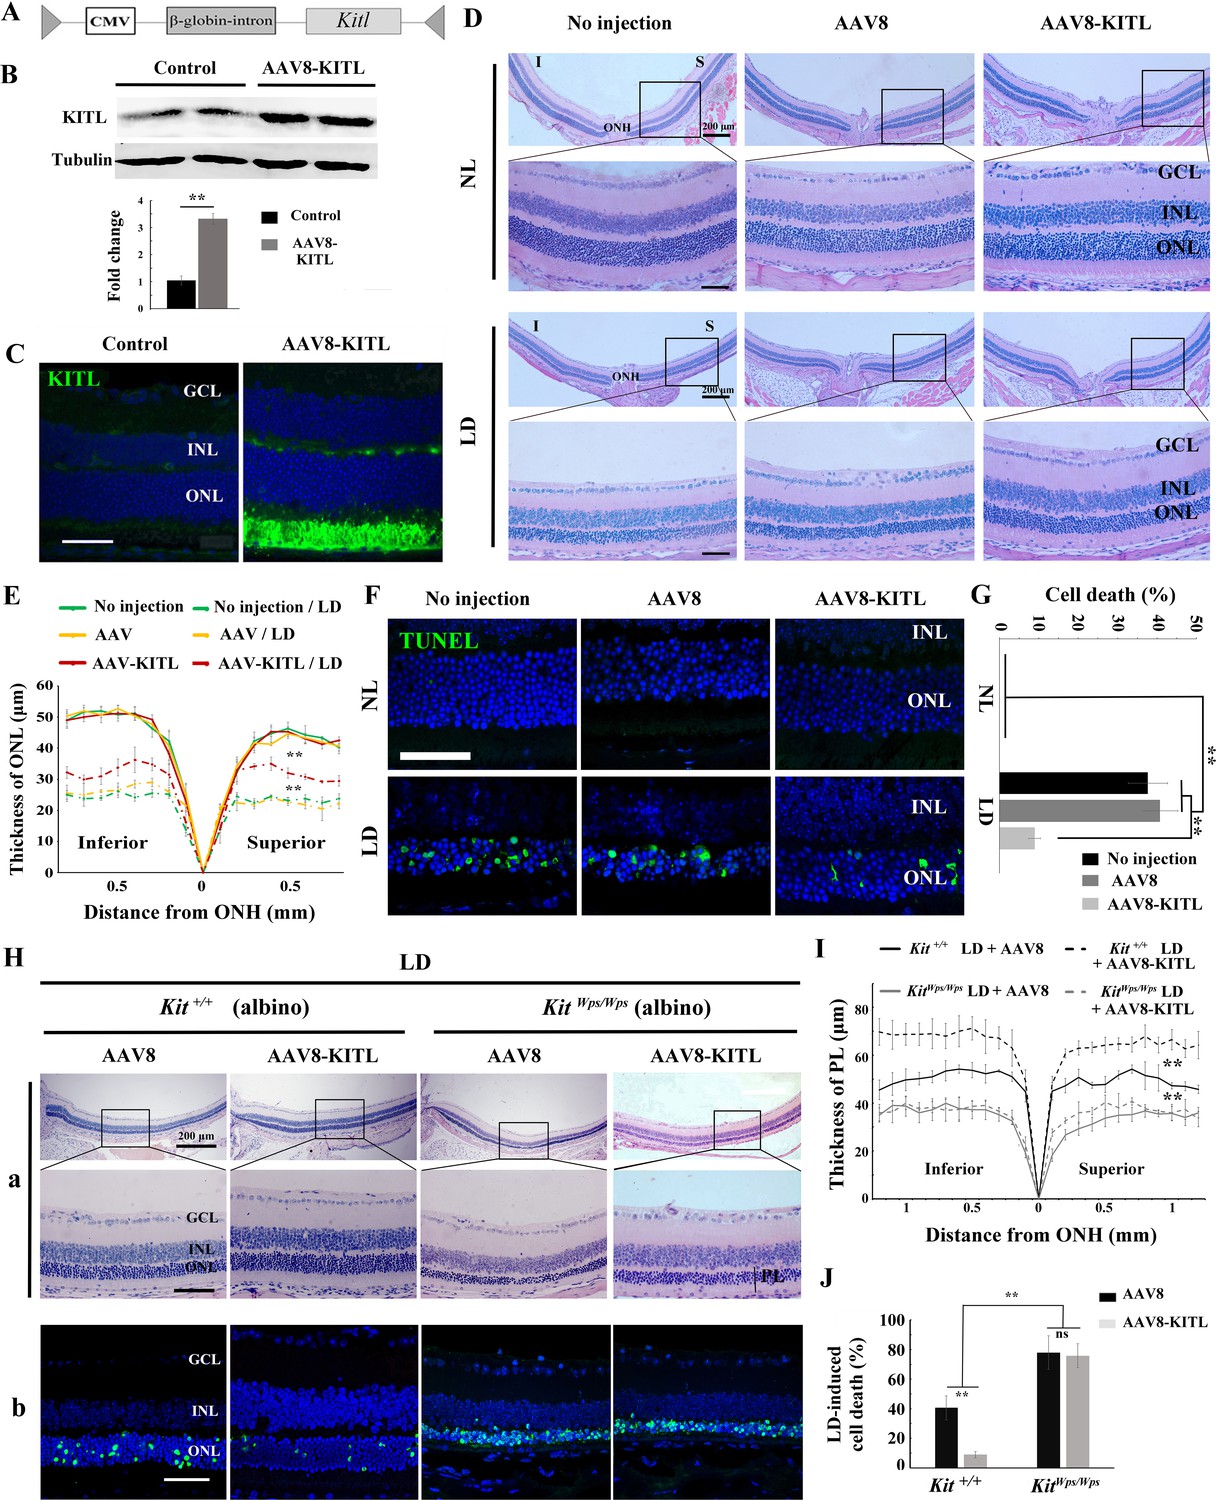
(A) Schematic representation of the AAV8-KITL construct. (B) Western blots (upper panels) show the expression of KITL in the retina 2 weeks after intraocular injection of AAV8-KITL. The bar graph (lower panels) shows the relative expression of KITL based on the results of western blots. (C) Immunostaining images show the immunoreactivity of KITL in 3-month-old Kit+/+ retinas 2 weeks after intraocular injection of AAV8-KITL. (D) Histological images of H and E staining from 3-month-old albino retinas infected with AAV8 or AAV8-KITL virus for 2 weeks and then kept under NL (upper panels) or high intensity LD (15,000 lux) continuously for 3 days (lower panels). (E) The curve diagram shows the thickness of ONL from albino retinas under NL or high-intensity LD conditions. (F, G) Images of TUNEL assays from the retinas (F) and bar graph show the cell death rate of photoreceptor cells (G) under the indicated conditions. (H) Retinal degeneration analysis of 3-month-old KitWps/Wps albino retinas infected with AAV8 or AAV8-KITL virus for 2 weeks and then kept under high-intensity LD by HE staining (upper panels) and TUNEL detection (down panels). (I) The curve diagram shows the thickness of the photoreceptor cell layer from the indicated retinas. (J) Quantification of the rate of cell death in the ONL of the indicated retinas. GCL, ganglion cell layer; INL, inner nuclear layer; ONL outer nuclear layer; ONH, optic nerve head; PL, photoreceptor cell layer. ** indicates p<0.01. Scale bar: 50 μm.
-
Figure 4—source data 1
Source data for the diagrams in Figure 4E, I and the graphs in Figure 4G, J.
- https://cdn.elifesciences.org/articles/51698/elife-51698-fig4-data1-v3.xlsx
Figure 4—figure supplement 1
AAV8-GFP virus specifically infects photoreceptor cells throughout the KitWps mutant retina.
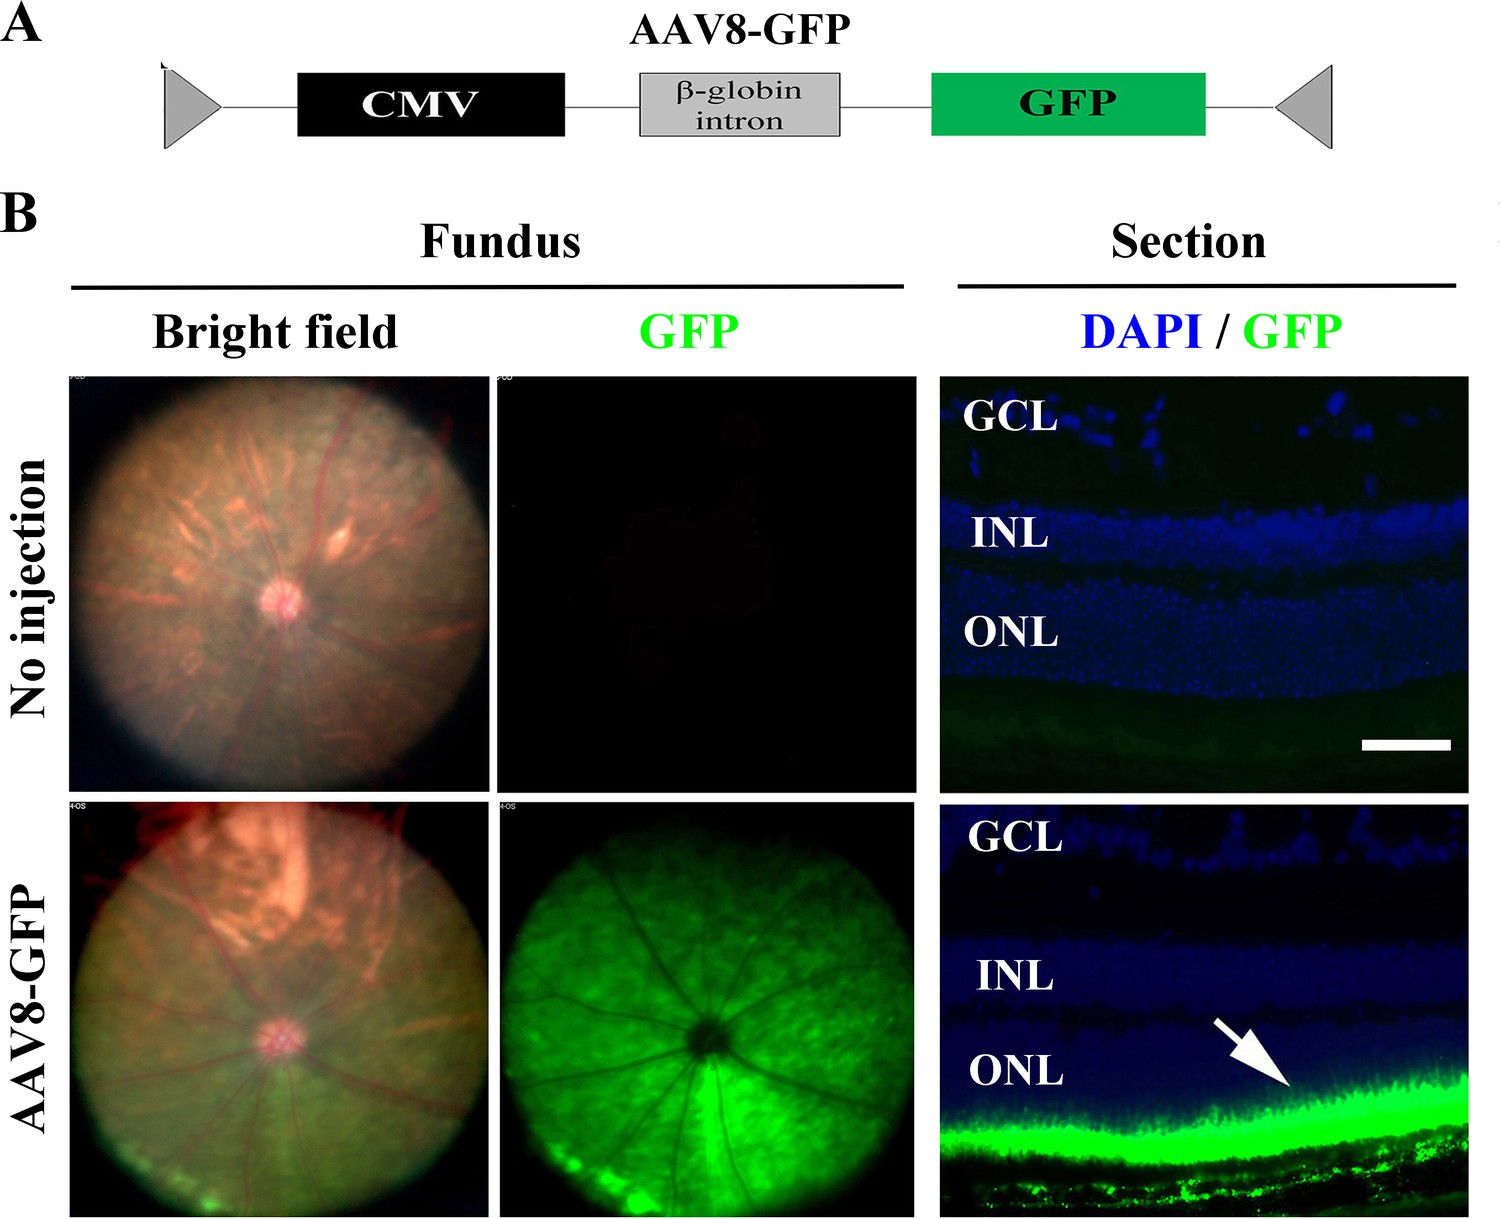
(A) Schematics of the AAV8-GFP construct. (B) Bright field and GFP fluorescence fundus photographs after AAV8-GFP infection (left panels) and a representative cross-section image of an AAV-GFP–infected retina (right panels). The ONL shows a high degree of infection (green). ONL, outer nuclear layer. Bar: 50 μm.
Figure 4—figure supplement 2
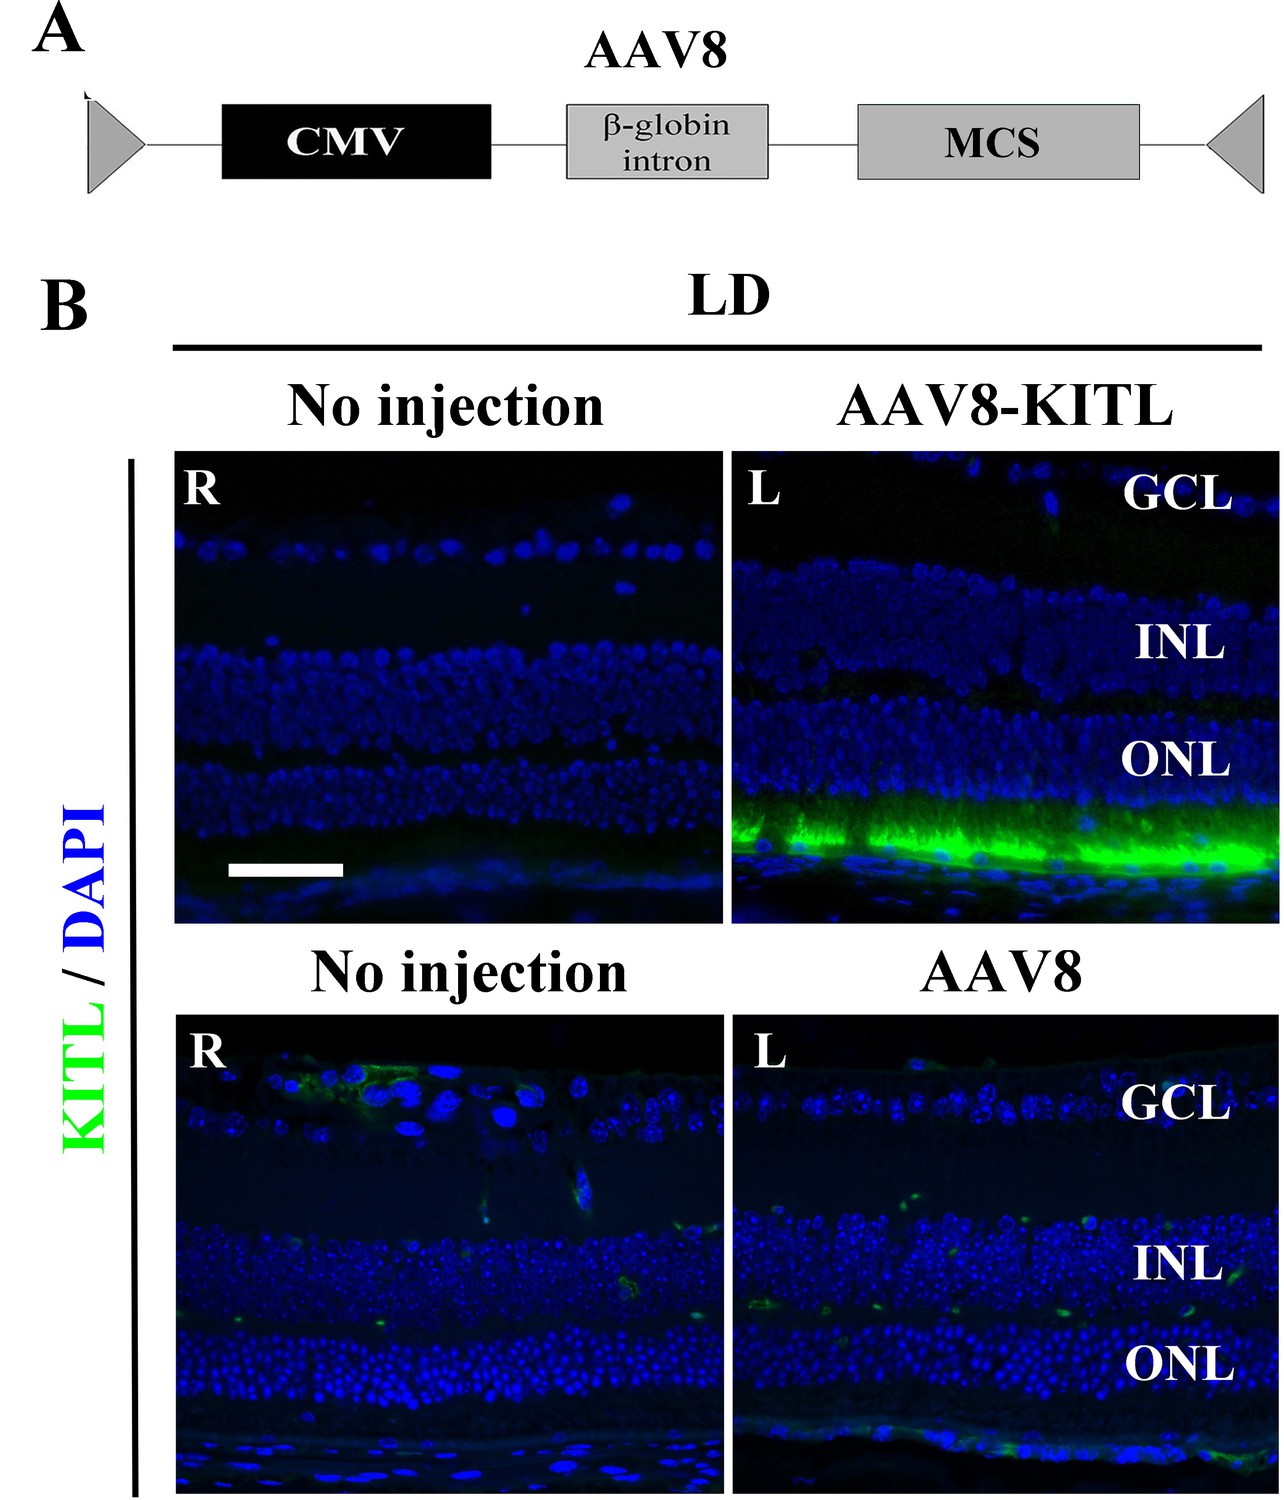
High expression levels of KITL in LD-treated retina infected with AAV8-KITL virus.
(A) Schematic depiction of the AAV8 construct. (B) Immunofluorescence images of anti-KITL in the retinas under the indicated conditions. Right (R) eye and left (L) eye are from the same mouse, whereby (R) has not been injected (both upper and lower panel) while (L) in the upper panel has been injected with AAV8-KITL and (L) in the lower panel has been injected with control AAV8. GCL, ganglion cell layer; INL, inner nuclear layer; ONL, outer nuclear layer. Bar: 50 μm.
Figure 5 with 1 supplement
Overexpression of KITL by AAV8-RHO-KITL but not AAV8-RPE65-KITL virus prevents light-induced retinal degeneration.
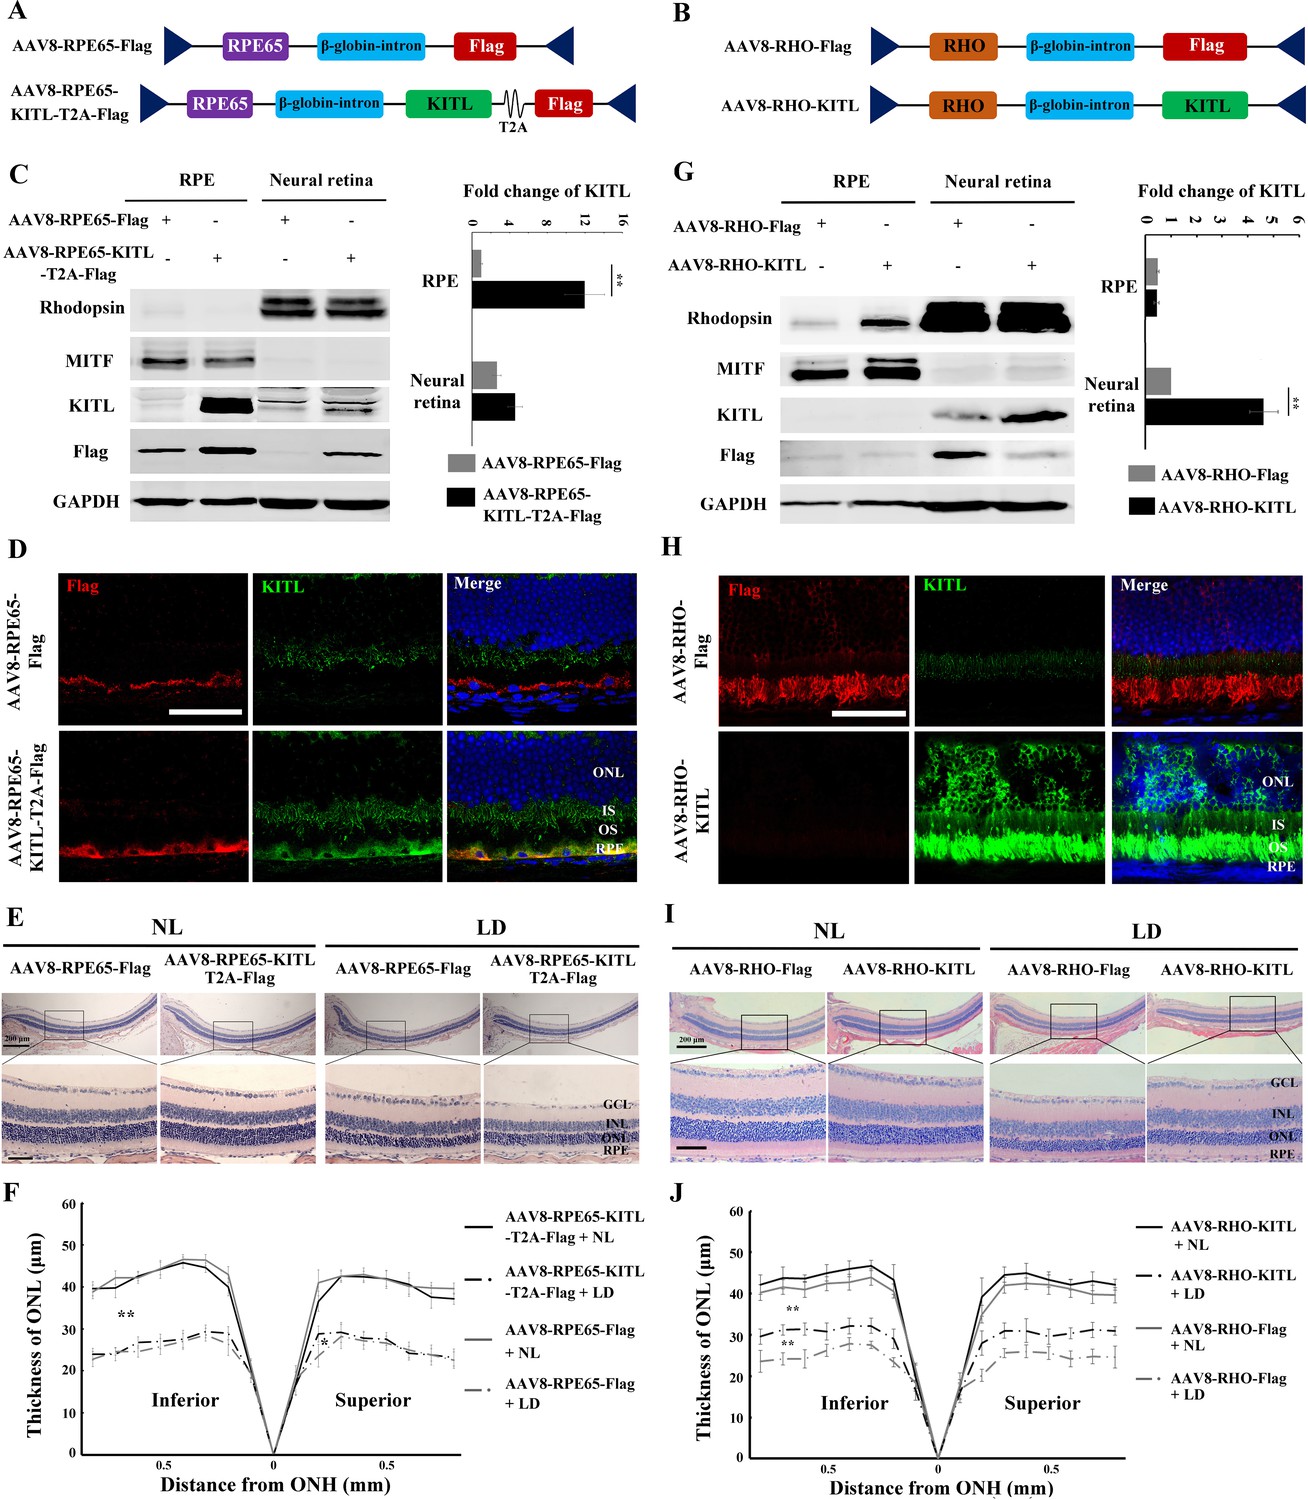
(A) Schematic representation of the AAV8-RPE65-Flag and AAV8-RPE65-KITL-T2A-Flag constructs. (B) Schematic representation of the AAV8-RHO-Flag and AAV8-RHO-KITL constructs. (C) Western blots showing expression of KITL in the RPE and neural retina 2 weeks after intraocular injection of AAV8-RPE65-Flag or AAV8-RPE65-KITL-T2A-Flag (left panels). The bar graph shows the relative expression levels of KITL based on the results of western blots (right panels). (D) Immunoreactivity of KITL in retina sections of 2-month-old albino mice 2 weeks after intraocular injection of AAV8-RPE65-KITL-T2A-Flag or control AAV8-RPE65-Flag. (E) Histological images of H and E staining of retinas infected with the indicated viruses for 2 weeks and then kept under NL or high-intensity LD (15,000 lux) continuously for 3 days. (F) The curve diagram shows the thickness of the ONL from albino retinas under the indicated condition. (G) Western blots (left panels) and the bar graph (right panels) show the expression of KITL in the RPE and neural retina at 4 weeks after intraocular injection of AAV8-RHO-Flag or AAV8-RHO-KITL virus. (H) Immunoreactivity of KITL in retina sections of 2-month-old albino mice 4 weeks after intraocular injection of the AAV8-RHO-Flag or AAV8-RHO-KITL. (I, J) Histological images of H and E staining (I) and the curve diagram (J) showing retinal degeneration under the indicated conditions. GCL, ganglion cell layer; INL, inner nuclear layer; ONL outer nuclear layer; IS, inner segment; OS, outer segment; ONH, optic nerve head. * or ** indicates p<0.05 or p<0.01. Scale bar: 50 μm.
-
Figure 5—source data 1
Source data for the diagrams in Figure 5E, J.
- https://cdn.elifesciences.org/articles/51698/elife-51698-fig5-data1-v3.xlsx
Figure 5—figure supplement 1
Overexpression of KITL in photoreceptor cells prevents light-induced photoreceptor cell death.
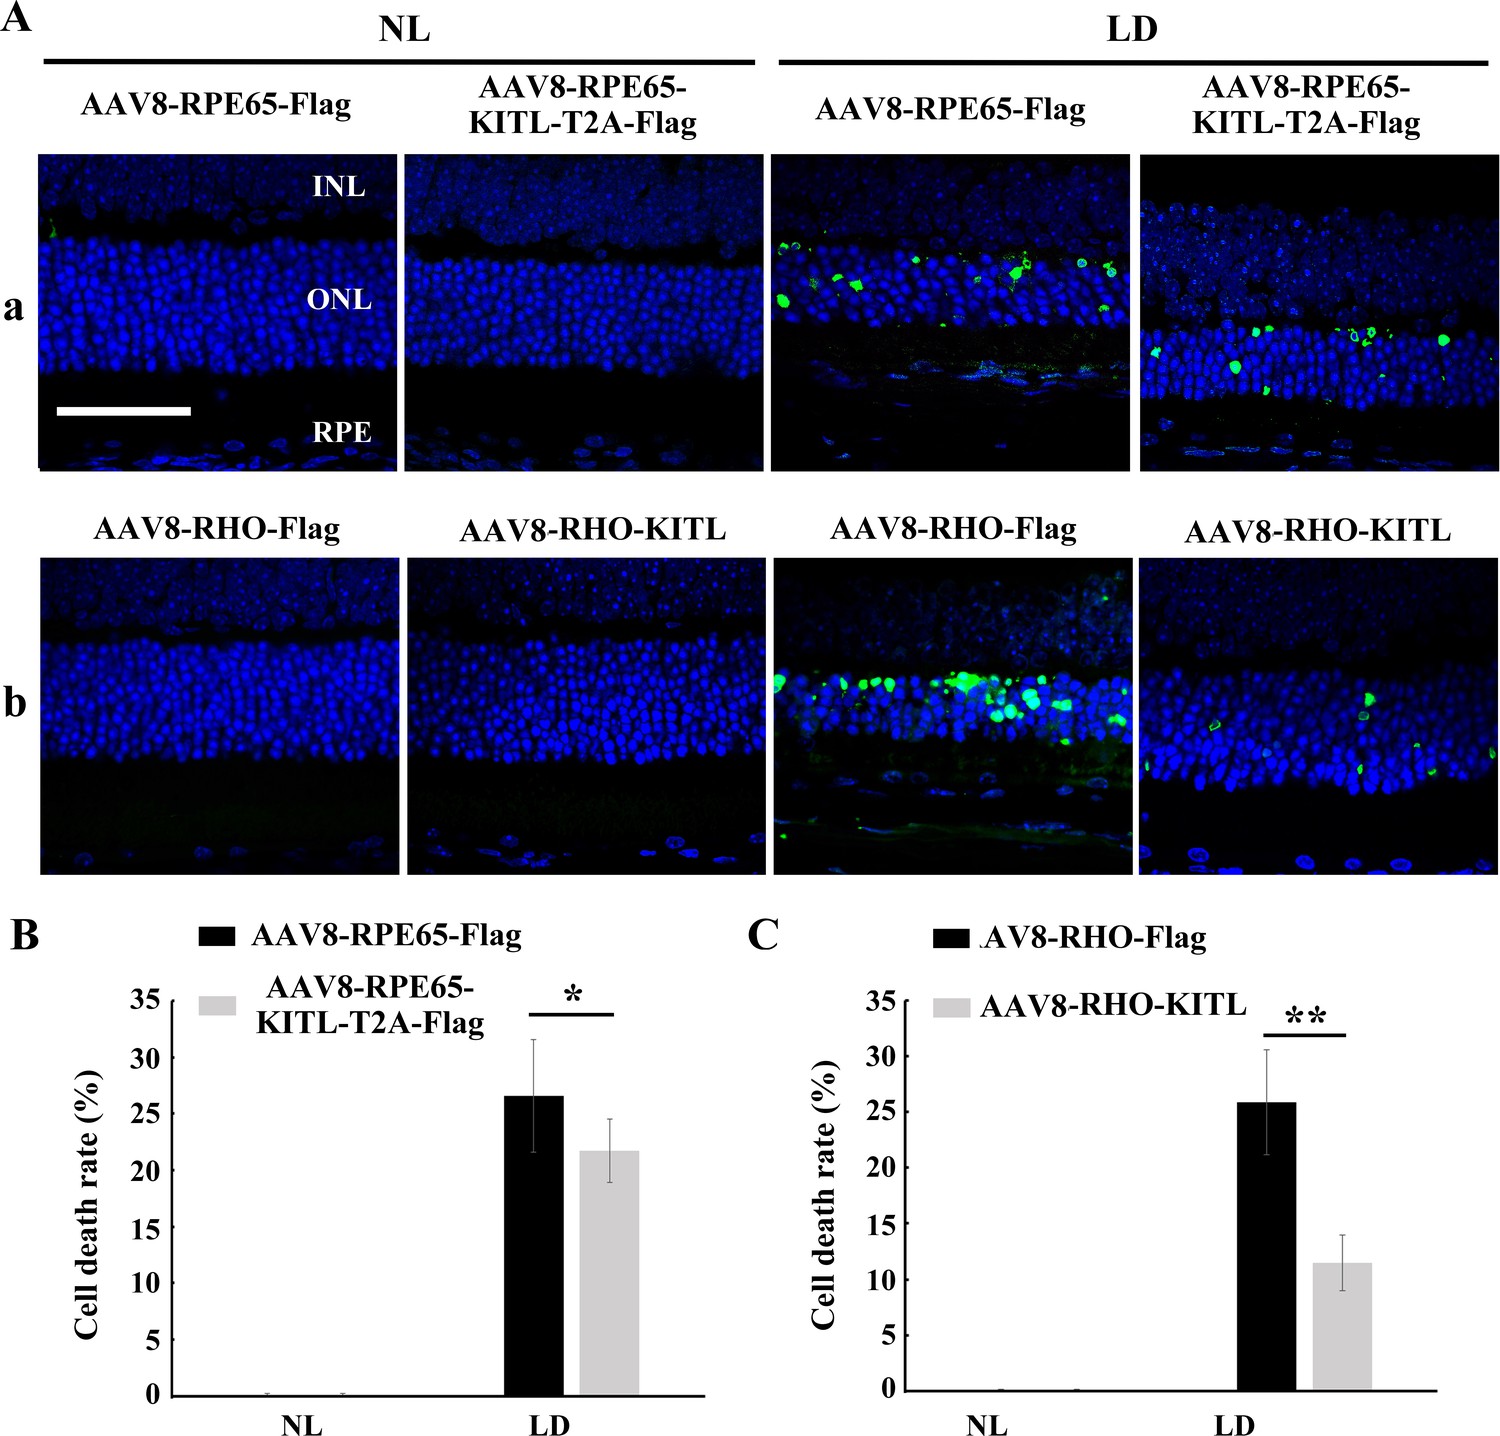
(A) Representative images of TUNEL assays from 3-month-old albino retinas infected with AAV8-RPE65-Flag, AAV8-RPE65-KITL (panels a), AAV8-RHO-Flag or AAV8-RHO-KITL virus (panels b) and kept under NL (left panels) or high-intensity LD (15,000 lux) continuously for 3 days (right panels). (B, C) Quantification of cell death in the ONL of the retinas infected with AAV8-RPE65-Flag, AAV8-RPE65-KITL (B), AAV8-RHO-Flag or AAV8-RHO-KITL virus (C) kept under the indicated light conditions. INL, inner nuclear layer; ONL, outer nuclear layer. * or ** indicates p<0.05 or p<0.01. Scale bar: 50 μm.
-
Figure 5—figure supplement 1—source data 1
Source data for the graphs in Figure 5-figure supplement 1B, C.
- https://cdn.elifesciences.org/articles/51698/elife-51698-fig5-figsupp1-data1-v3.xlsx
Figure 6 with 1 supplement
KIT signaling regulates expression of Hmox1 in photoreceptor cells.
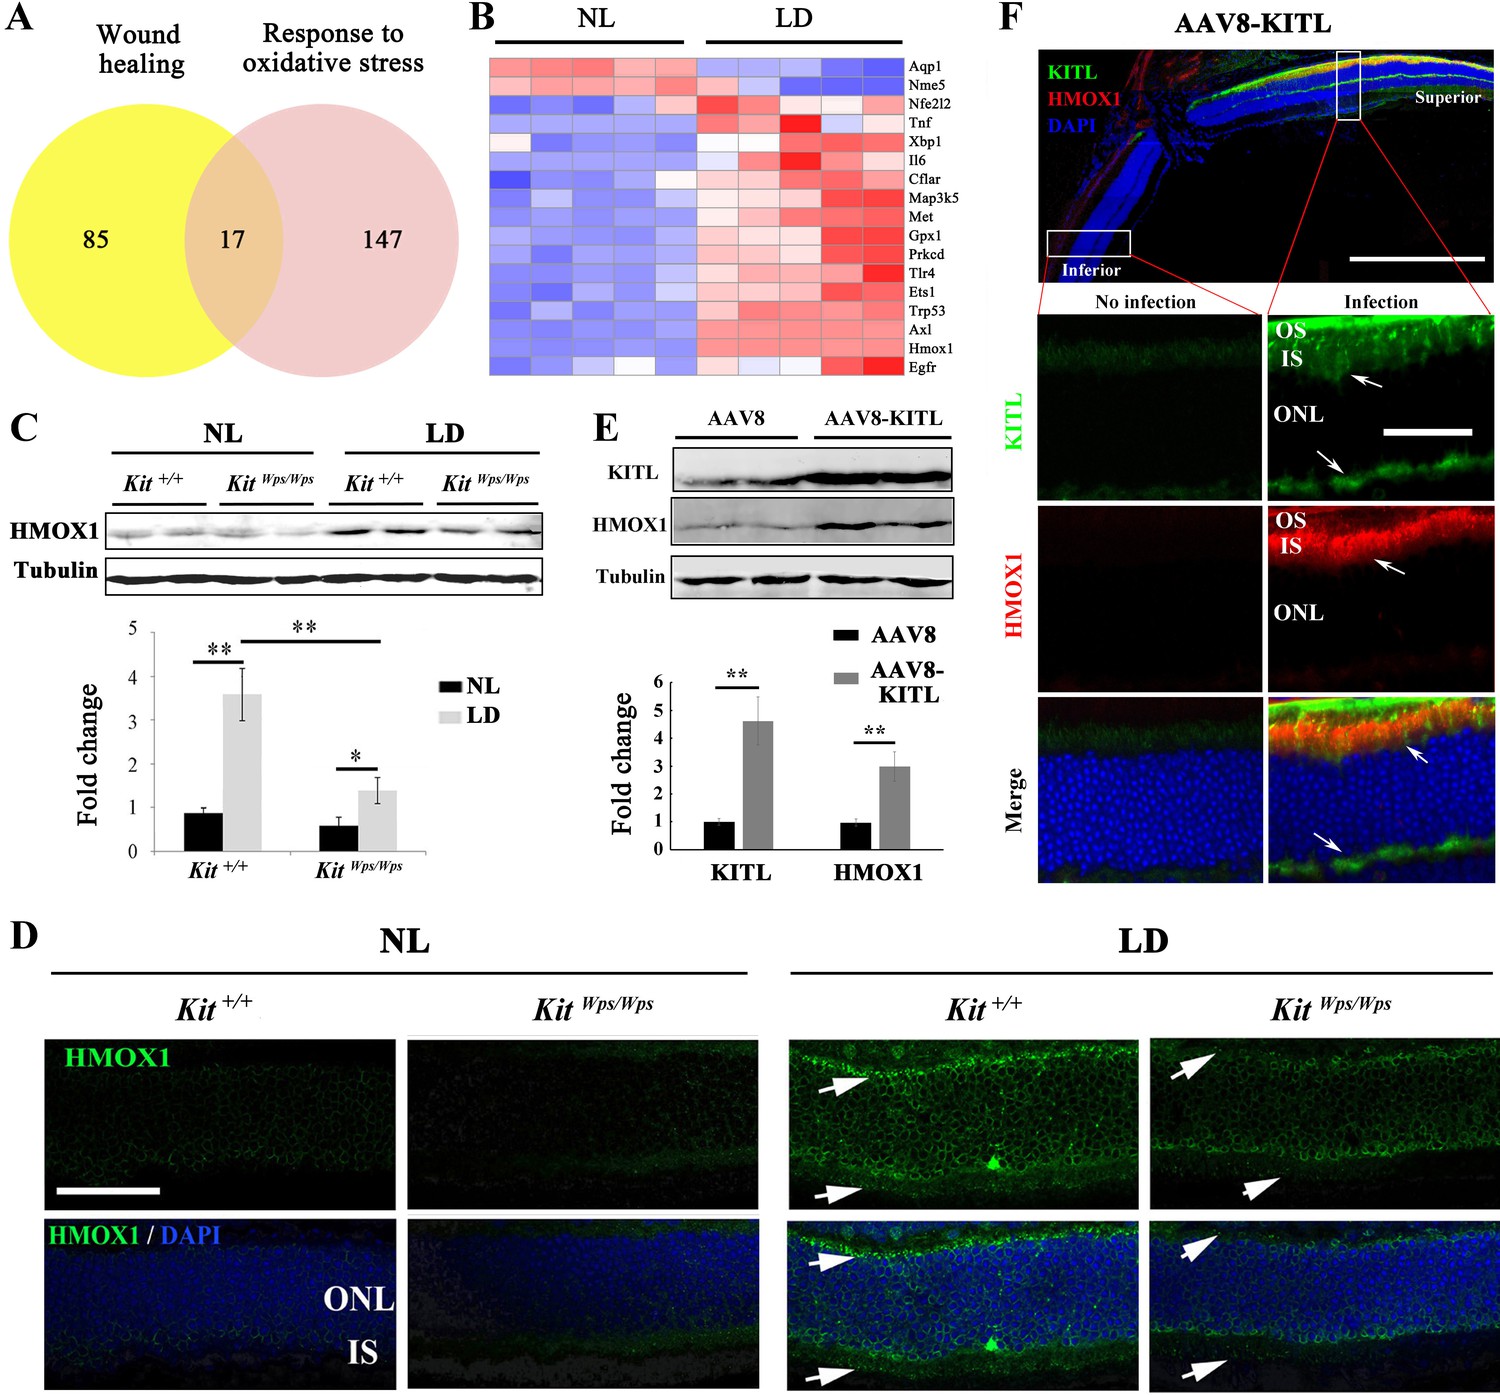
(A) Venn diagram showing numbers of differentially expressed genes involved in response to oxidative stress and/or wound healing. Results from Kit+/+ retinas after LD for 1 day. (B) Heat-map of differentially expressed genes from the 17 genes common between the wound healing group and response to oxidative stress group according to the result of Venn diagram. Messenger RNA expression changes of anti-oxidant genes in Kit+/+ retinas after LD for 1 day. (C and D) Expression of HMOX1 in Kit+/+ and KitWps/Wps retinas were detected by western blots and immunostaining. Note that the expression of HMOX1 was more significantly upregulated in light-degenerated Kit+/+ compared to light-degenerated KitWps/Wps photoreceptors. (E) Western blots showing the expression of KITL and HMOX1 in the retinas infected with control AAV8 or AAV8-KITL virus. Bar graphs show the relative expression of KITL and HMOX1 in retinas based on the results of western blots. (F) Immunoreactivity of KITL and HMOX1 in Kit+/+ retina sections 1 week after subretinal injection of AAV8-KITL. IS, photoreceptor inner segments; ONL, outer nuclear layer; OS, photoreceptor outer segment. * or ** indicates p<0.05 or p<0.01. Scale bar: 50 μm.
Figure 6—figure supplement 1
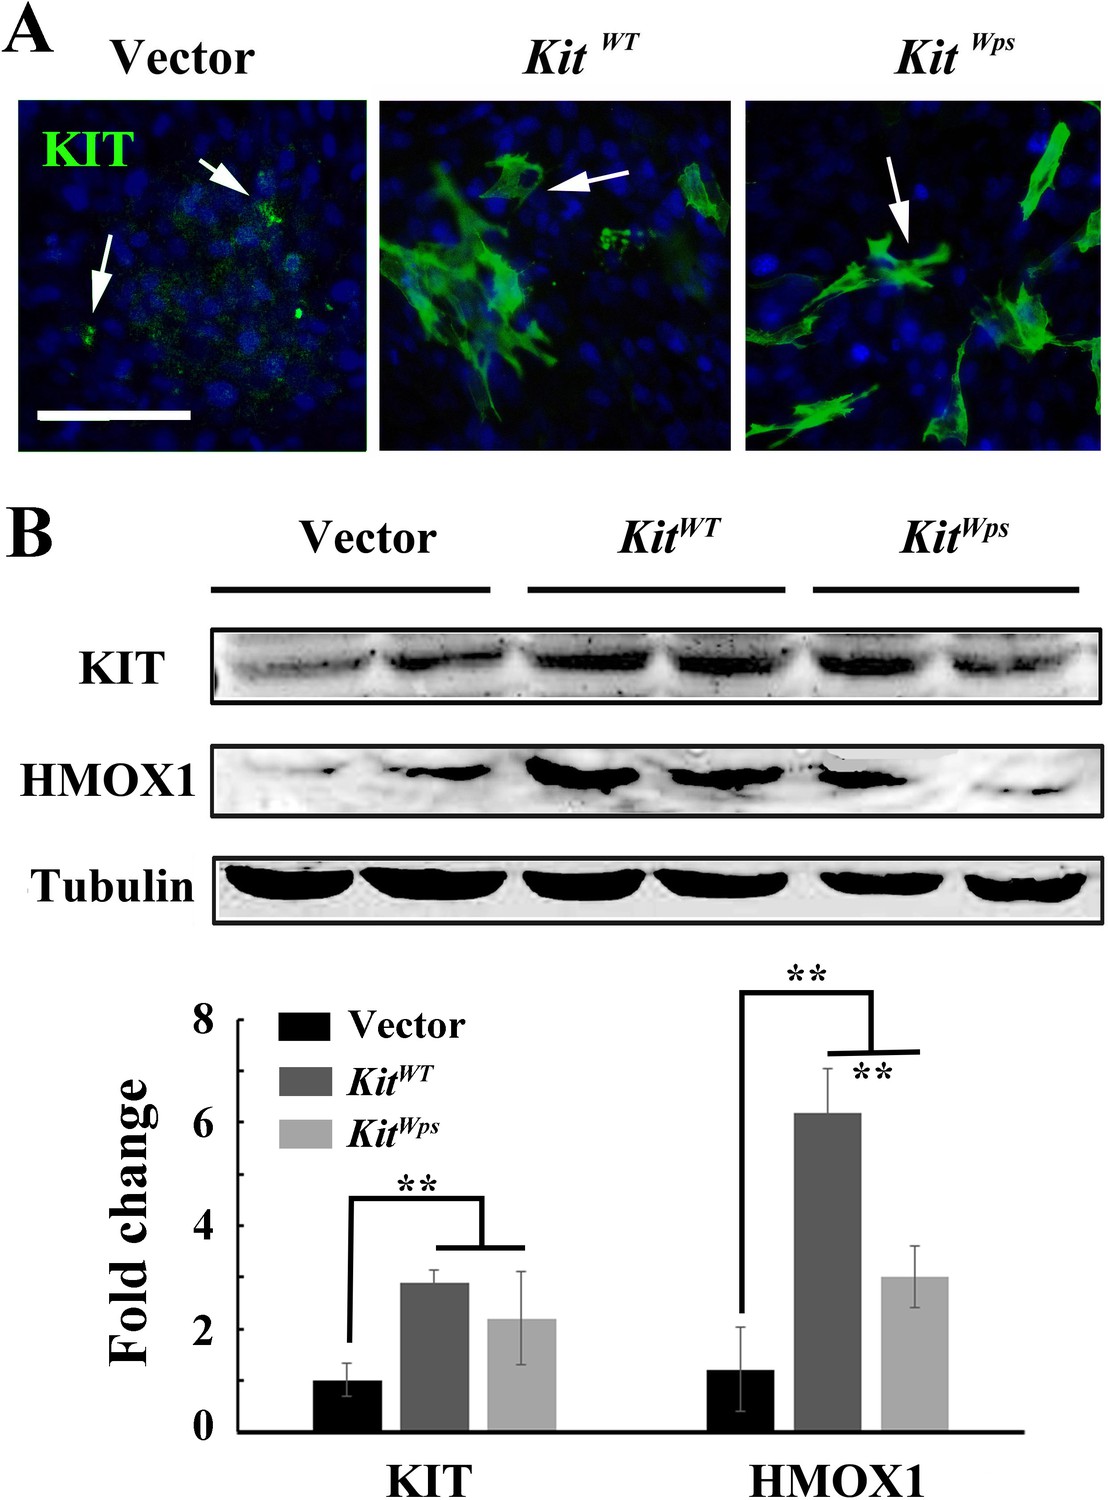
Overexpression of KIT upregulates Hmox1 expression in 661W photoreceptor cells.
(A) Immunostaining using a KIT antibody (ACK2/CD117) after transfection of KitWT (wildtype Kit cDNA plasmid) or KitWps (Kit-Wps mutant cDNA plasmid) in 661 W cells with 2.8 nM of KITL. (B) Immunoblotting of KIT and HMOX1 expression in 661 W cells transfected with KitWT or KitWps plasmid (upper panels), and quantification of the immunoblotting results (lower panel). Note that overexpression of wildtype Kit but not KitWps led to upregulation of Hmox1 expression. * or ** indicates p<0.05 or p<0.01. Bar: 50 μm.
Figure 7 with 1 supplement
KIT signaling acts through the transcription factor NRF2 to regulate Hmox1 expression.
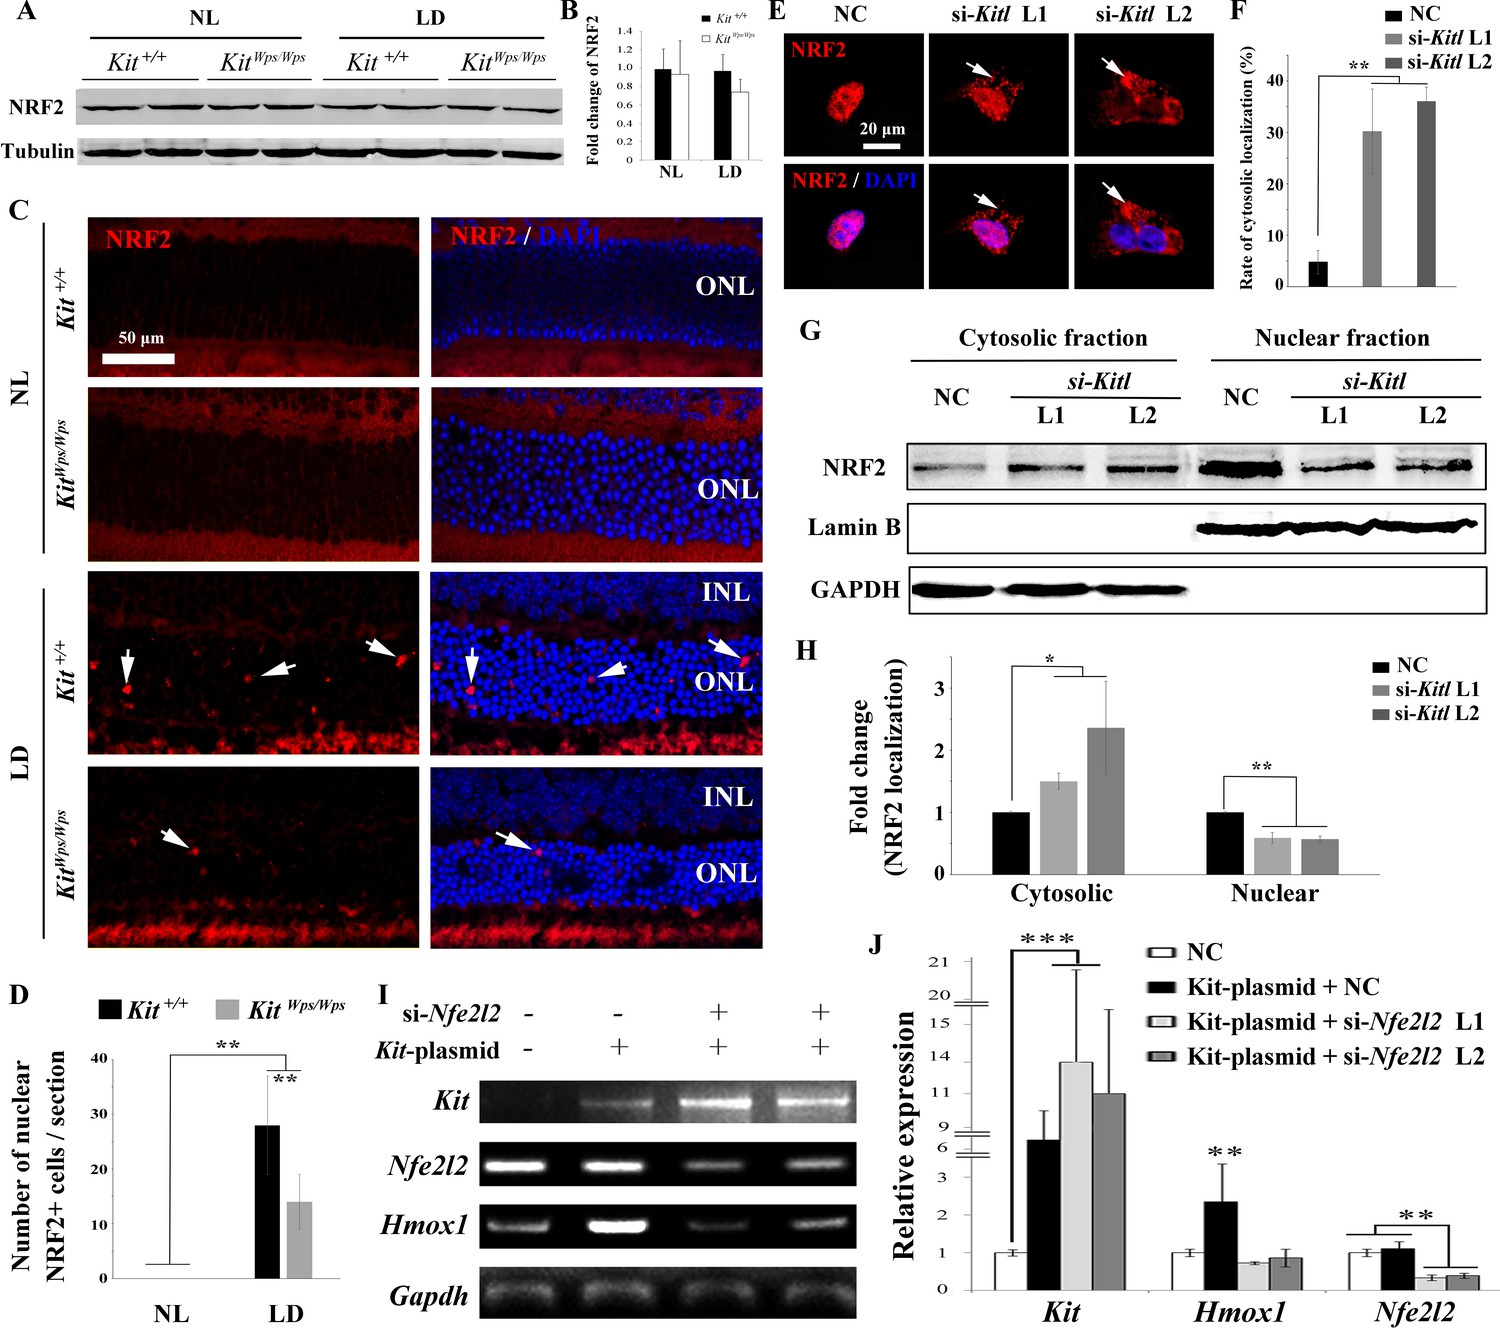
(A) Western blots for analyzing NRF2 expression in Kit+/+ and KitWps/Wps retinas under the indicated conditions. (B) The bar graph shows quantification of NRF2 expression in the indicated retinas. (C) Immunostaining of anti-NRF2 in Kit+/+ and KitWps/Wps retinas under the indicated conditions. The arrows point to nuclear signals of NRF2 in the ONL. (D) Quantification of the number of nuclear NRF2 positive cells in the retina. Note that LD induced nuclear accumulation of NRF2 in photoreceptor cells. (E–H) Analysis of subcellular localization of NRF2 in 661W photoreceptor cells treated with si-Kitl by immunostaining (E, and F) and western blot (G, and H). Note that knockdown of Kitl led to an increase in the proportion of cells with cytosolic NRF2. (I, J) Analyses of the regulation of HMOX1 in 661 W cells after overexpression of KIT together with si-Nfe2l2. The images of RT-PCR (I) and qPCR (J) show the expression levels of Kit, si-Nfe2l2, and Hmox1 under the indicated treatments. Note that upregulation of Hmox1 induced by overexpression of KIT was blocked by the knockdown of Nfe2l2. * indicates p<0.05, ** indicates p<0.01.
Figure 7—figure supplement 1
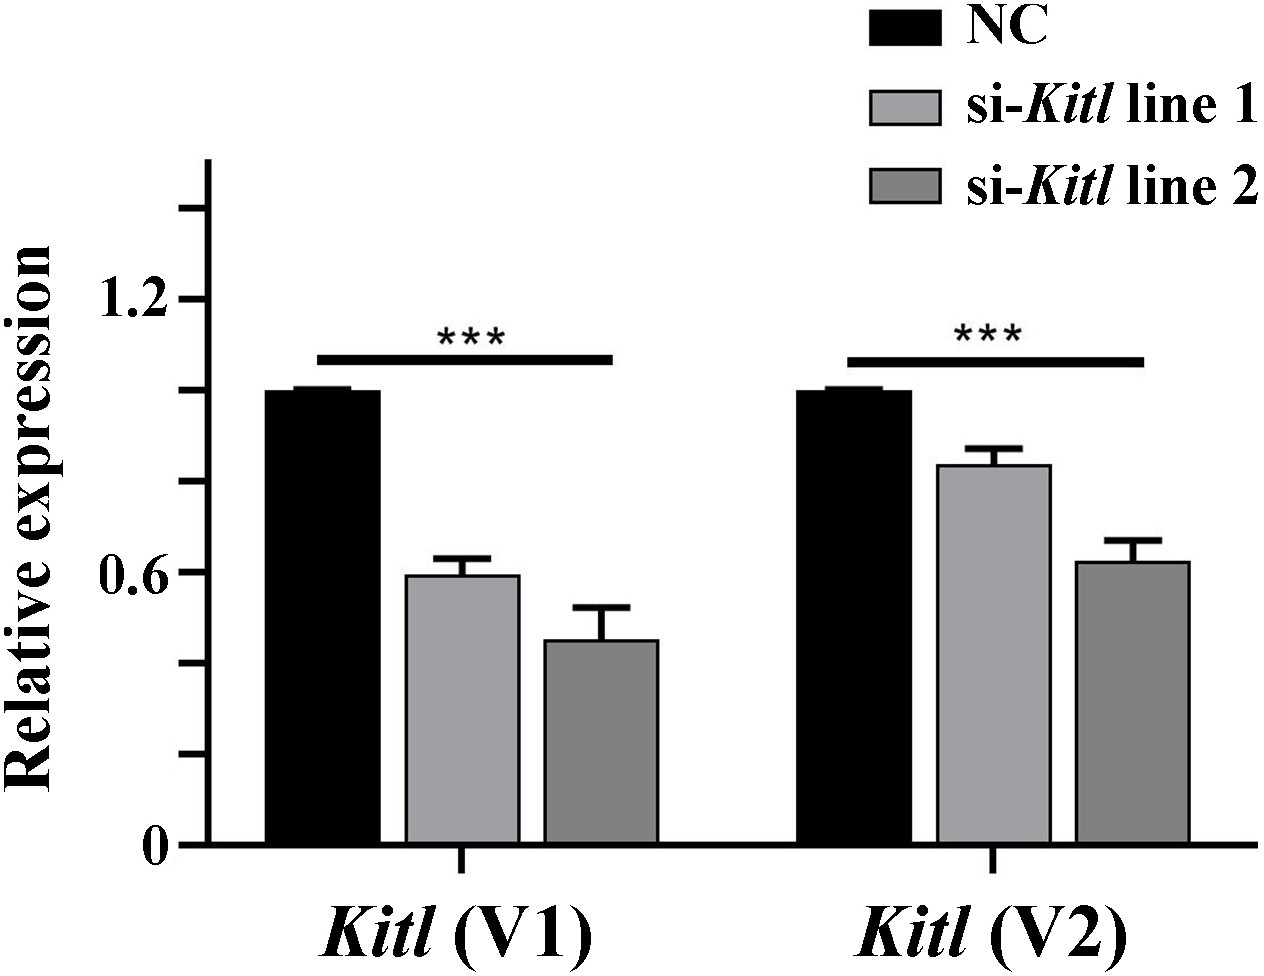
Kitl mRNA expression levels are reduced after transfection with Kitl-si-RNAs in 661 W cells.
The transcript variant 1 (V1) contains the full length Kitl mRNA sequence while the transcript variant 2 (V2) corresponds to a Kitl mRNA lacking exon 6.
Figure 8 with 1 supplement

Protective role of HMOX1 in LD-treated KitWps/Wps retina.
(A) Schematic representation of the AAV8-HMOX1 construct (upper panel) and western blots show the expression of KITL in the retina 2 weeks after subretinal injection of AAV8- HMOX1 virus (lower panels). The bar graph shows the relative expression of HMOX1 based on the results of western blots. (B) Ectopic HMOX1 expression in retina by infection of AAV8 or AAV8-HMOX1 virus was visualized by immunofluorescence (n = 4). (C) ERG scotopic traces of KitWps/Wps; albino mice infected with control AAV8 (n = 5) or AAV8-HMOX1 (n = 5) virus for 2 weeks and then kept under NL or high-intensity LD (15,000 lux) for 3 days. (D) Quantification of amplitude of b-wave from standard response based on the results from C. (E) Histological analysis of KitWps/Wps; albino retina infected with control AAV8 (n = 6) or AAV8-HMOX1 (n = 6) virus after LD. (F) Curve diagram showing the total thickness of the ONL under the indicated conditions. GCL, ganglion cell layer; INL, inner nuclear layer; ONL, outer nuclear layer; PL, photoreceptor cell layer. * or ** indicates p<0.05 or p<0.01. Scale bar: 50 μm.
-
Figure 8—source data 1
Source data for the graphs in Figure 8D and the diagram in Figure 8F.
- https://cdn.elifesciences.org/articles/51698/elife-51698-fig8-data1-v3.xlsx
Figure 8—figure supplement 1
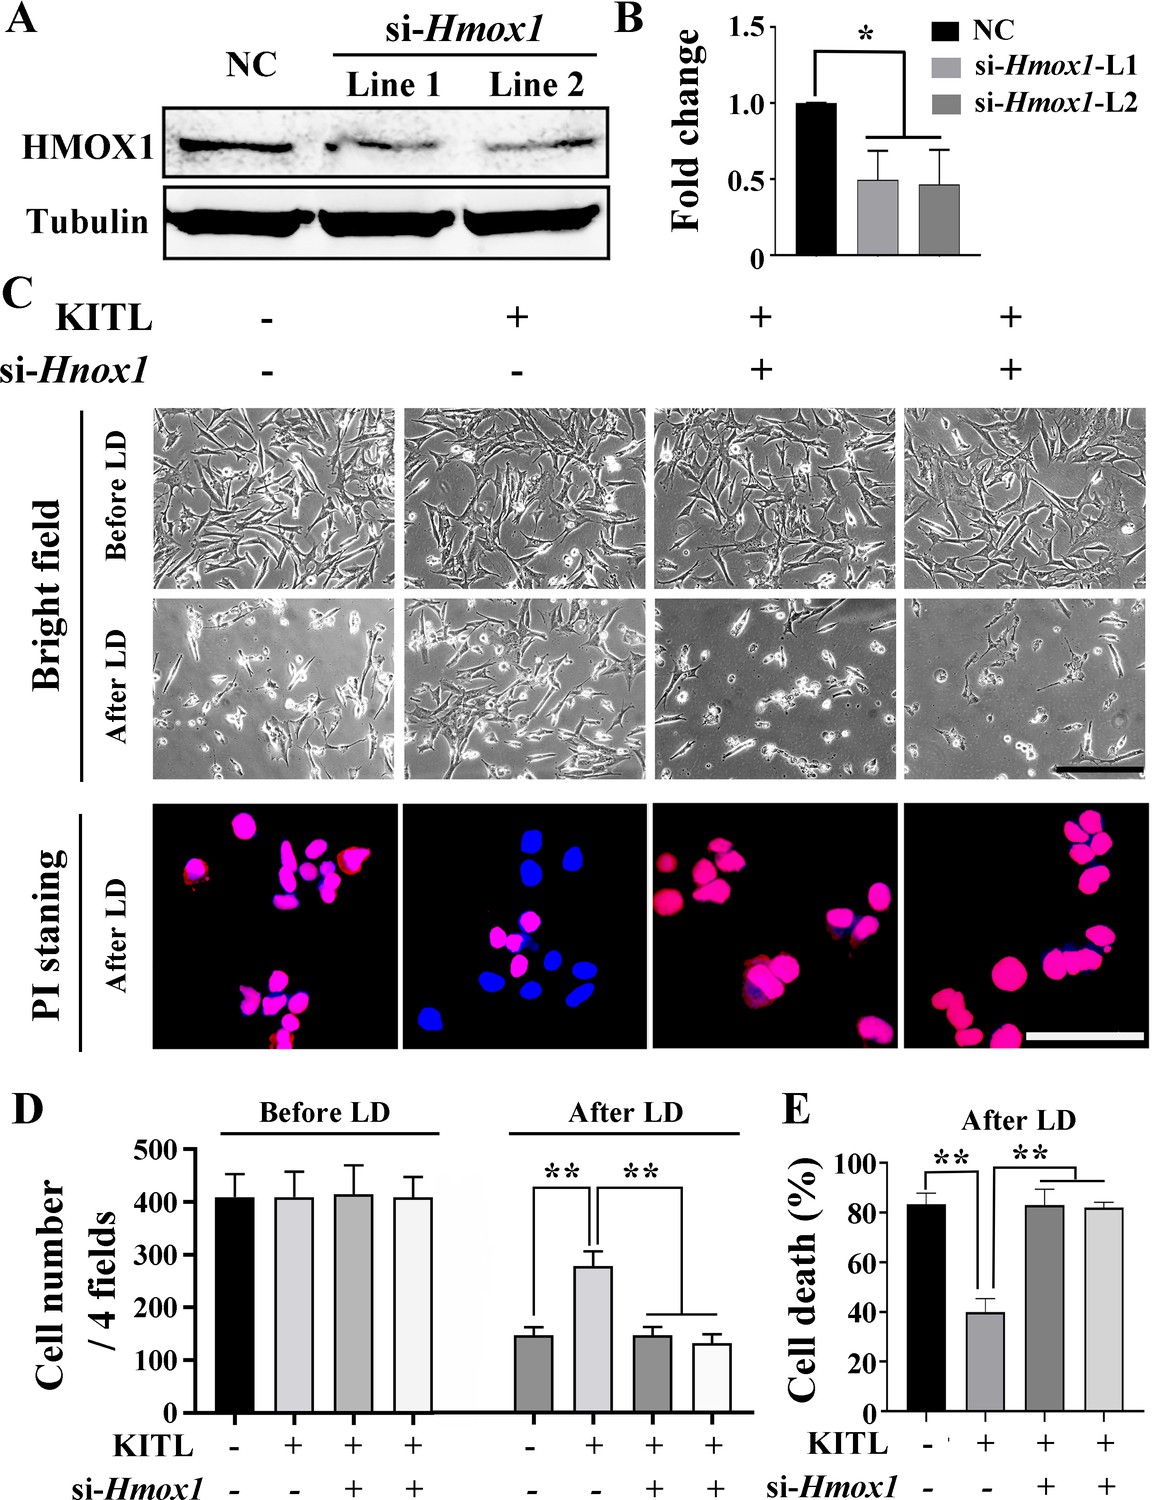
Protective role of KITL depends on HMOX1 in light-induced photoreceptor cell death.
(A) Western blot analysis of HMOX1 in 661W photoreceptor cells after si-RNA treatment. (B) Quantification of western blot bands shows expression levels of HMOX1. Note that both si-Hmox1 lines show reduced expression of HMOX1. (C) Bright field images of photoreceptor cells under the indicated conditions (upper panels) and Propidium Iodide (PI) staining of photoreceptor cells after LD (down panels). (D, E) Bar graphs show the cell numbers before and after high-intensity light treatment (D) and the numbers of PI positive cells after LD treatment (E). ** indicates p<0.01. Scale bar, 20 μm.
Figure 9 with 1 supplement
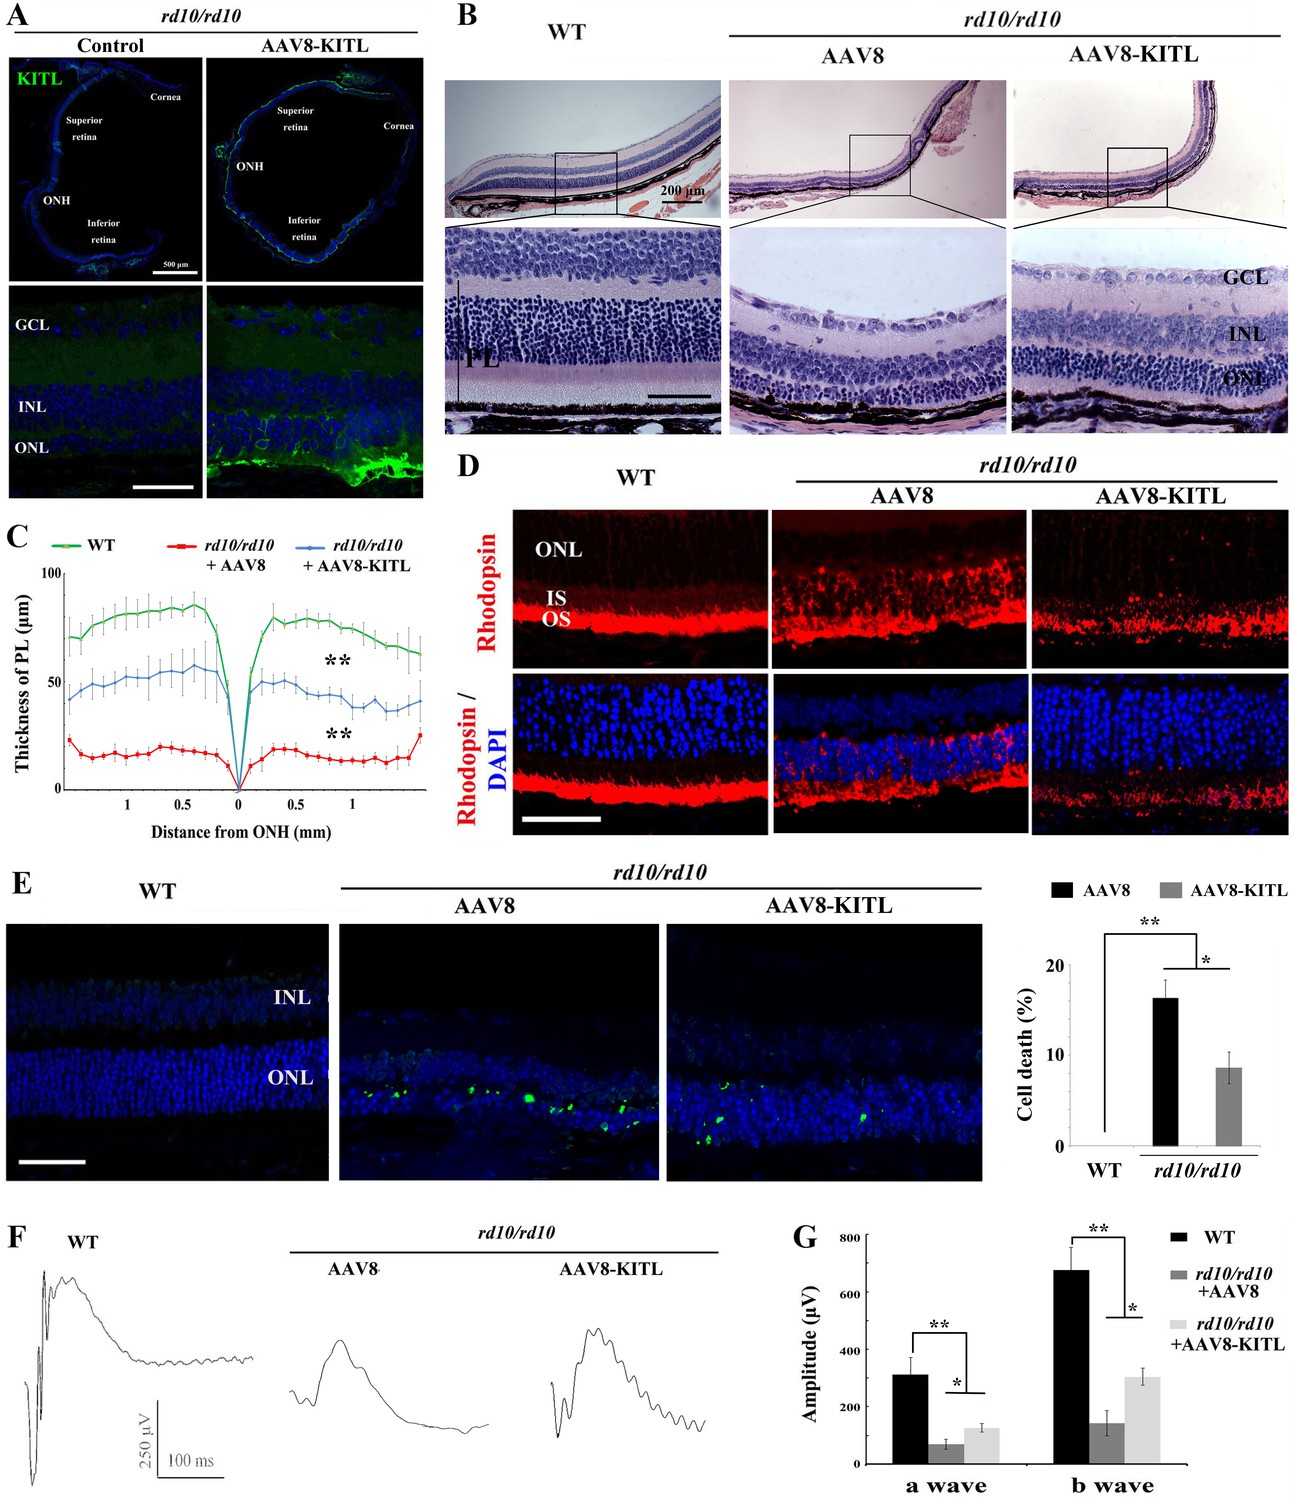
Ectopic expression of KITL prevents retinal degeneration of rd10 homozygous mice.
(A) Expression of KITL in rd10/rd10 retinas 2 weeks after infection with AAV8-KITL virus or control was visualized by immunofluorescence. Note that the subretinal injection was performed in rd10/rd10 mice at postnatal day 3. (B and C) Histological analysis of rd10/rd10 retinas infected with AAV8 or AAV8-KITL virus (n = 5) or control (B). Curve diagram showing the thickness of total photoreceptor cell layer from rd10/rd10 retina under the indicated conditions (C). (D) Rhodopsin expression in WT and rd10/rd10 retina under the indicated conditions. (E) Apoptosis of photoreceptor cells from rd10/rd10 mice with of AAV8 or AAV8-KITL was analyzed by TUNEL assay and is presented as fluorescent images (upper panels) and as bar graphs after quantitation (lower panels). (F, G) ERG scotopic traces (F) obtained from rd10/rd10 mice with infection of AAV8-KITL virus (n = 5) or control (n = 5) and kept under normal conditions for 25 days (right panels). Bar graph (G) shows the quantification of the amplitude of the b-wave from standard response based on the results of the ERG scotopic traces (F). GCL, ganglion cell layer; INL, inner nuclear layer; ONL, outer nuclear layer; PL, photoreceptor layer. * or ** indicates p<0.05 or p<0.01. Scale bar: 50 μm.
-
Figure 9—source data 1
Source data for the diagram in Figure 9C and the graphs in Figure 9E, G.
- https://cdn.elifesciences.org/articles/51698/elife-51698-fig9-data1-v3.xlsx
Figure 9—figure supplement 1
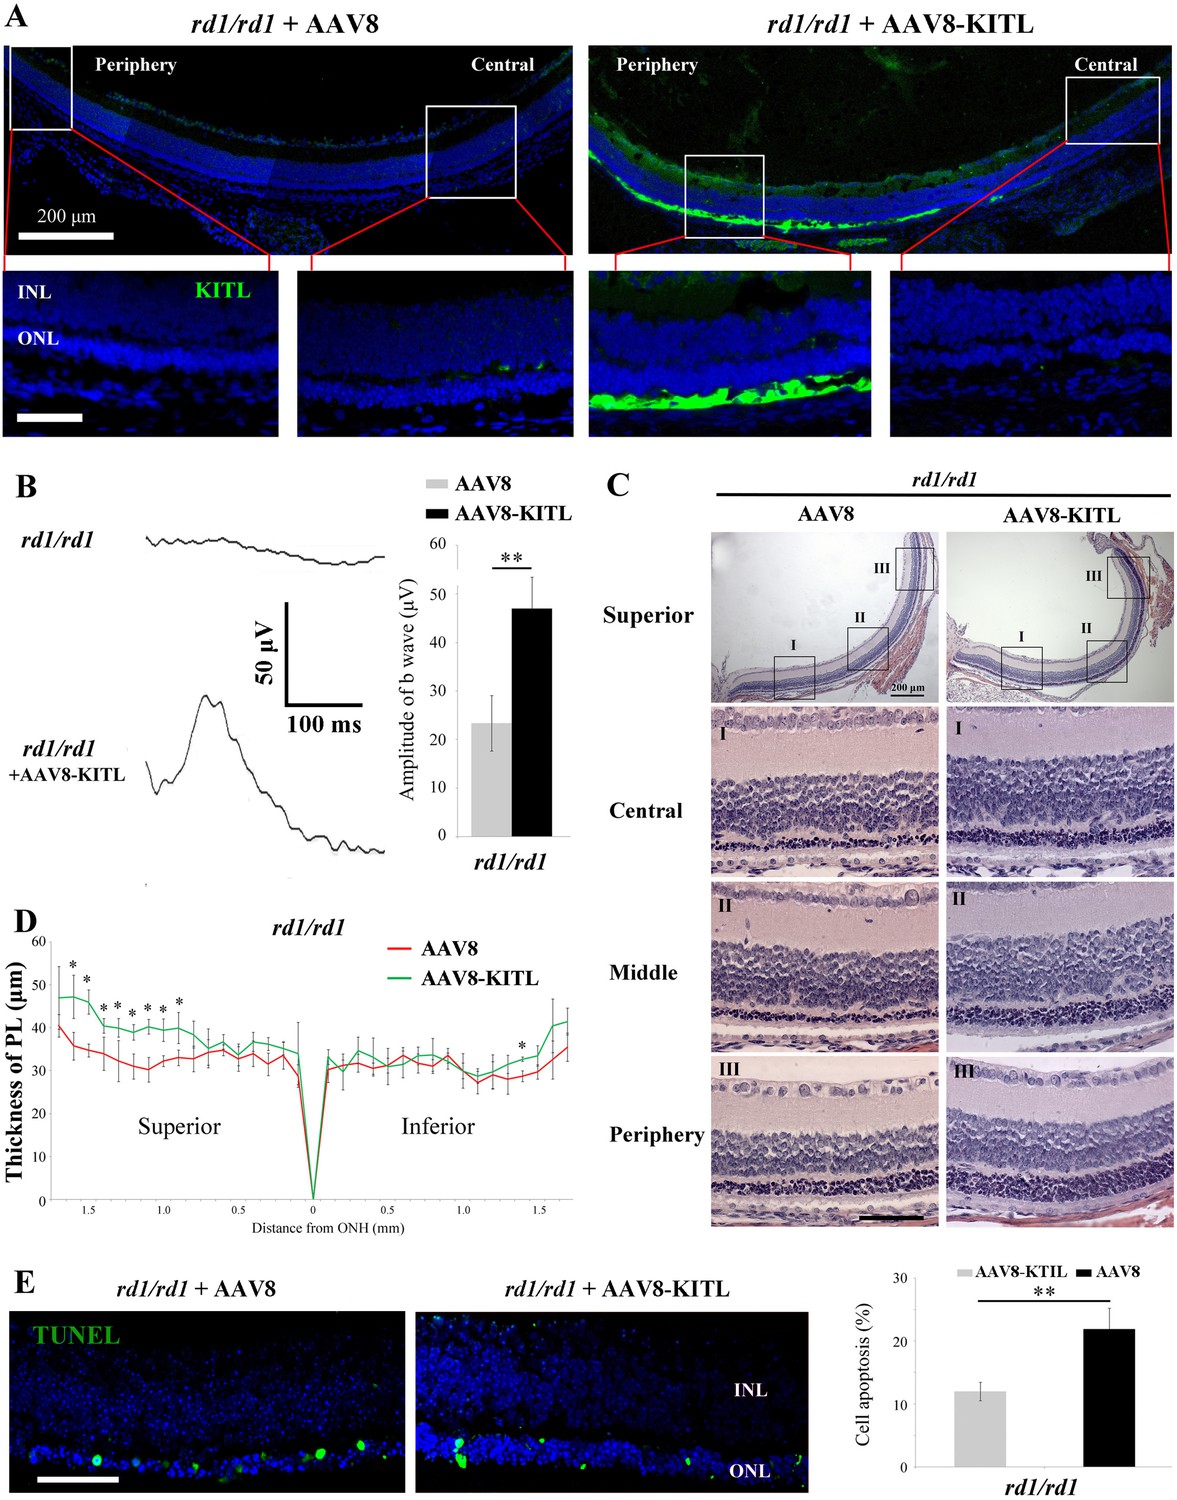
Ectopic expression of KITL prevents retinal degeneration of rd1 homozygous mice.
(A) Expression of KITL in rd1/rd1 retinas 2 weeks after infection with AAV8 or AAV8-KITL virus infection was visualized by immunofluorescence. Note that the subretinal injection was performed in rd1/rd1 mice at postnatal day 1. (B) ERG scotopic traces obtained from rd1/rd1 mice with infection of AAV8 or AAV8-KITL virus (n = 5) and kept under normal environmental condition for 20 days (right panels). Bar graph shows the quantification of the amplitude of the b-wave from standard response based on the results of the ERG scotopic traces (left panels). (C and D) Histological analysis of rd1/rd1 retinas infected with AAV8 or AAV8-KITL virus (n = 5) (C) and the curve diagram showing the thickness of total ONL from rd1/rd1 retina under the indicated conditions (D). (E) Apoptosis of photoreceptor cells from rd1/rd1 mice with infection of AAV8 or AAV8-KITL was analyzed by TUNEL assay and presented as fluorescent images (left panels) and as bar graphs after quantitation (right panel). GCL, ganglion cell layer; INL, inner nuclear layer; ONL, outer nuclear layer; PL, photoreceptor cell layer. * or ** indicates p<0.05 or p<0.01. Bar: 50 μm.
-
Figure 9—figure supplement 1—source data 1
Source data for the graphs in Figure 9-figure supplement 1B and the diagrams in Figure 9-figure supplement 1D, E.
- https://cdn.elifesciences.org/articles/51698/elife-51698-fig9-figsupp1-data1-v3.xlsx
Author response image 1
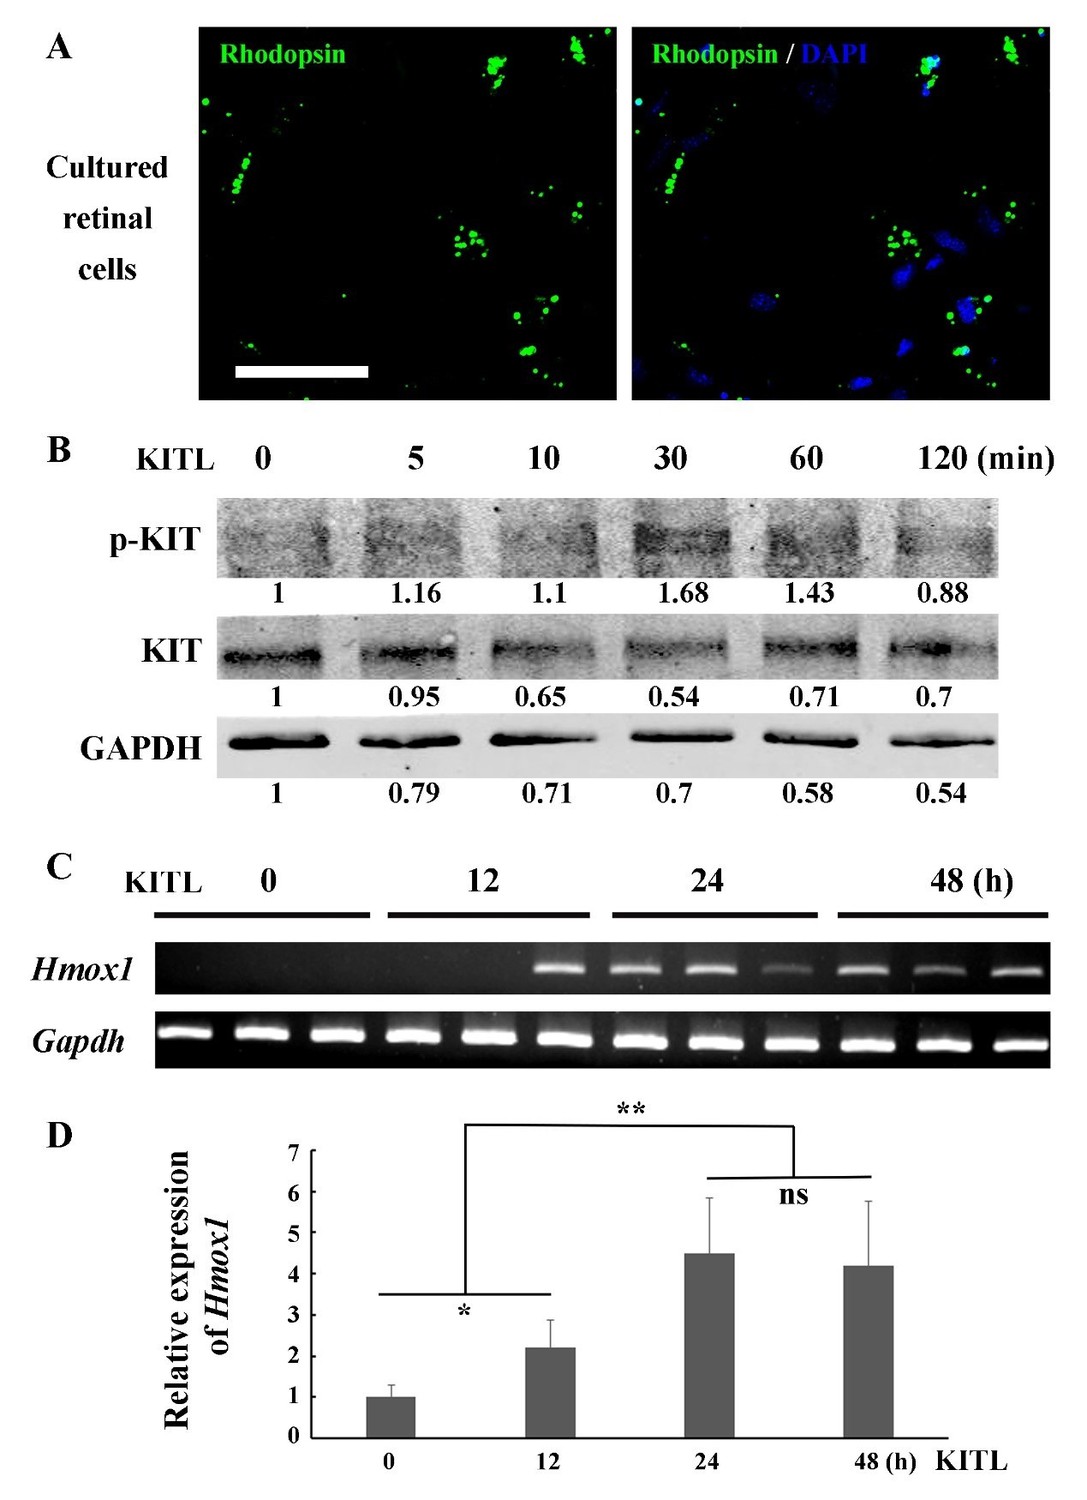
KITL induces Hmox1 expression in primary retinal cells.
(A) Representative immunostaining images of anti-Rhodopsin in cultured retinal cells from C57BL/6J mice at P7. (B) Western blots show the levels of phosphorylated KIT after stimulation with KITL in the primary cells. (C, D) The expression analysis of Hmox1 in the primary cells after stimulation with KITL through RT-PCR (C) and qPCR (D) examination (n=3). * or ** indicates p<0.05 or p<0.01. Bar: 50 μm.
Author response image 2
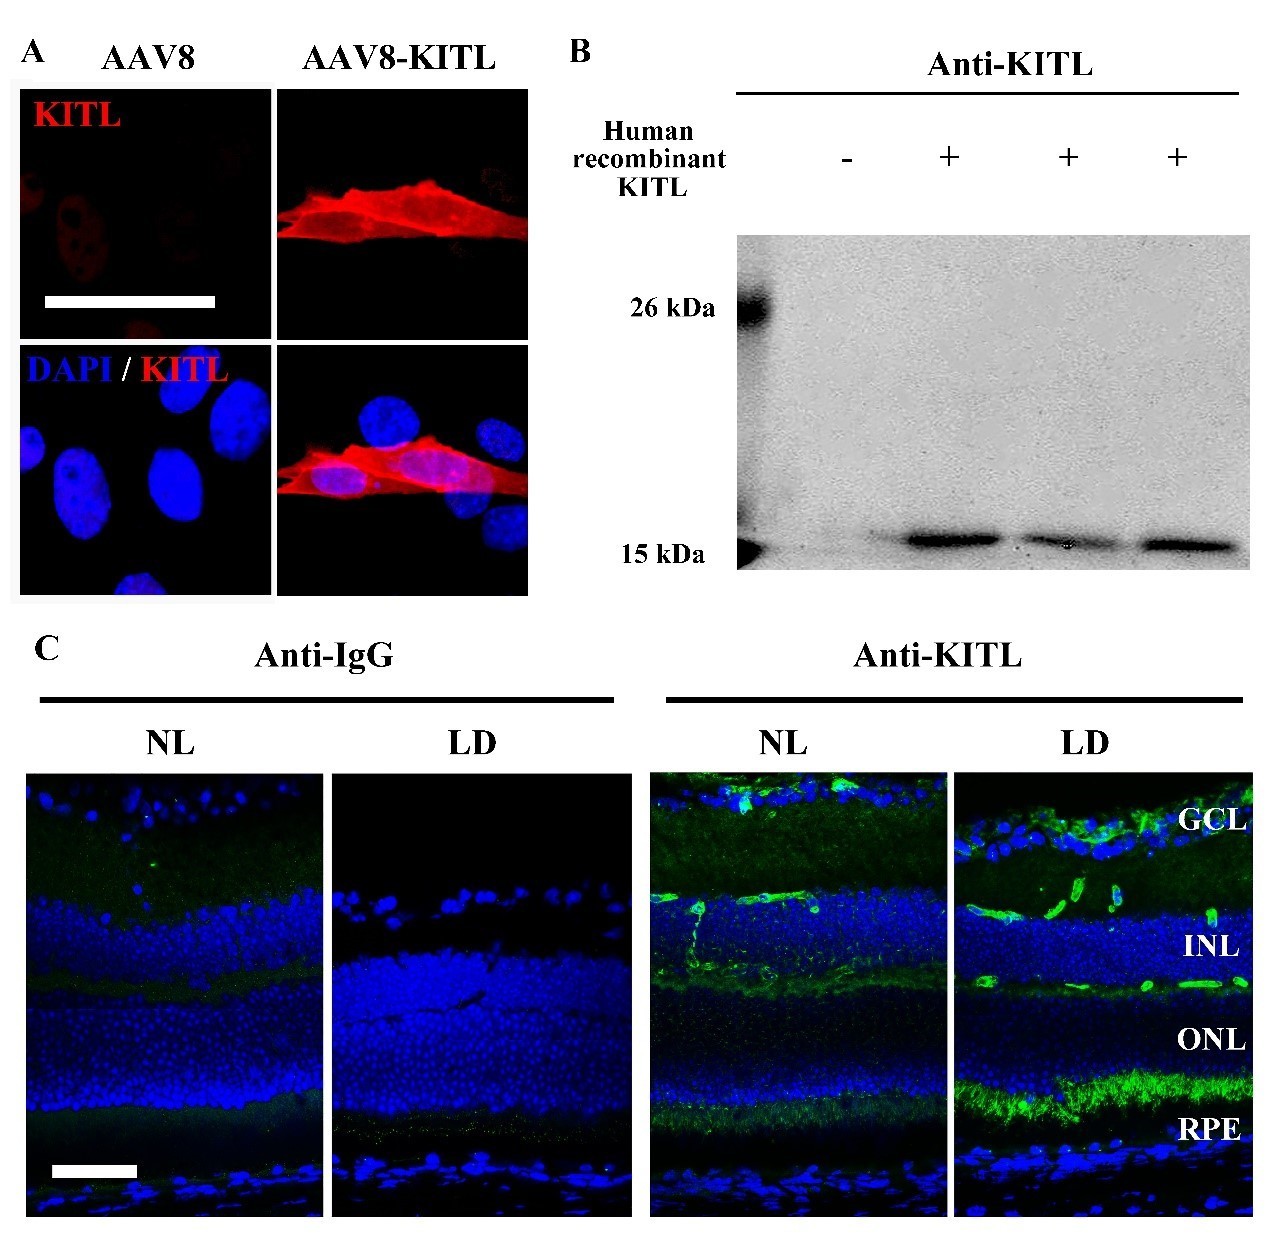
Analysis of the anti-KITL antibody in photoreceptor cells.
(A) Immunostaining images of anti-KITL in 661W photoreceptor cells infected with AAV8 (left panel) or AAV8-KITL (right panel) virus. (B) Western blots show the specific recognition of the anti-KITL antibody to Human recombinant KITL protein (18 kDa). (C) Immunostaining images of Goat anti-IgG (left panels) and Goat anti-KITL (right panels) in the retinas from 2-month-old albino mice kept under normal light or LD (15, 000 Lux) condition for 1 day. GCL, ganglion cell layer; INL, inner nuclear layer; ONL, outer nuclear layer. Bar: 50 μm.
Author response image 3
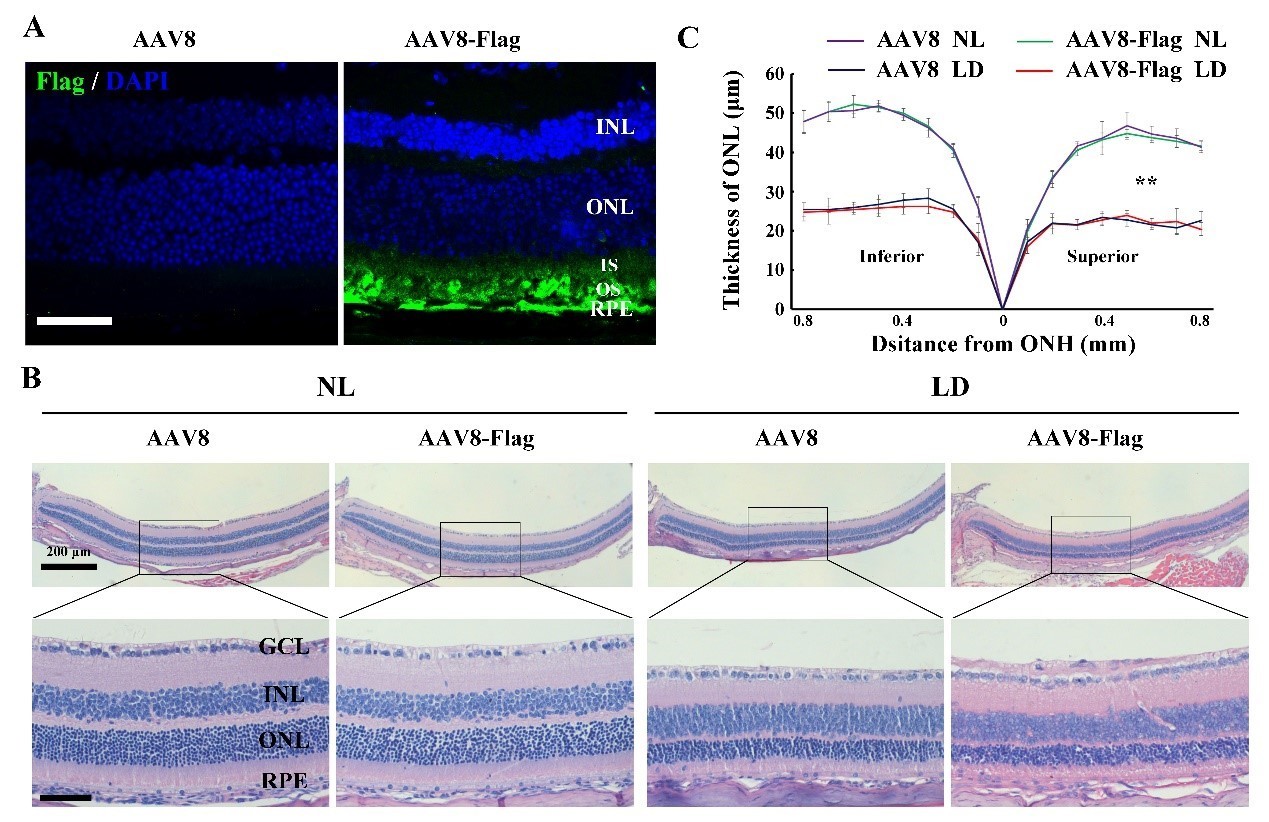
The effect of AAV8-Flag virus on the LIRD is similar to that of AAV8 empty virus.
(A) Immunostaining images of anti-Flag in the retinas from 2-month-old albino mice 2 weeks after intraocular injection of AAV8 or AAV8-Flag virus. (B, C) Histological analysis ofretinas from the albino mice infected with AAV8 or AAV8-Flag and kept under NL or LD (15, 000 Lux) condition for 3 days (n=5) (B) and the curve diagram (C) showing the thickness of ONL fromthe albino retinas under the indicated conditions. GCL, ganglion cell layer; INL, inner nuclear layer; ONL, outer nuclear layer; IS, inner segment; OS, outer segment. ** indicates p<0.01. Bar: 50 μm.
Additional files
-
Supplementary file 1
Key resources table.
- https://cdn.elifesciences.org/articles/51698/elife-51698-supp1-v3.doc
-
Transparent reporting form
- https://cdn.elifesciences.org/articles/51698/elife-51698-transrepform-v3.docx
Download links
A two-part list of links to download the article, or parts of the article, in various formats.
Downloads (link to download the article as PDF)
Open citations (links to open the citations from this article in various online reference manager services)
Cite this article (links to download the citations from this article in formats compatible with various reference manager tools)
KIT ligand protects against both light-induced and genetic photoreceptor degeneration
eLife 9:e51698.
https://doi.org/10.7554/eLife.51698


