Structural basis for the activation of PLC-γ isozymes by phosphorylation and cancer-associated mutations
- The University of North Carolina at Chapel Hill, United States
Figures
Figure 1 with 4 supplements
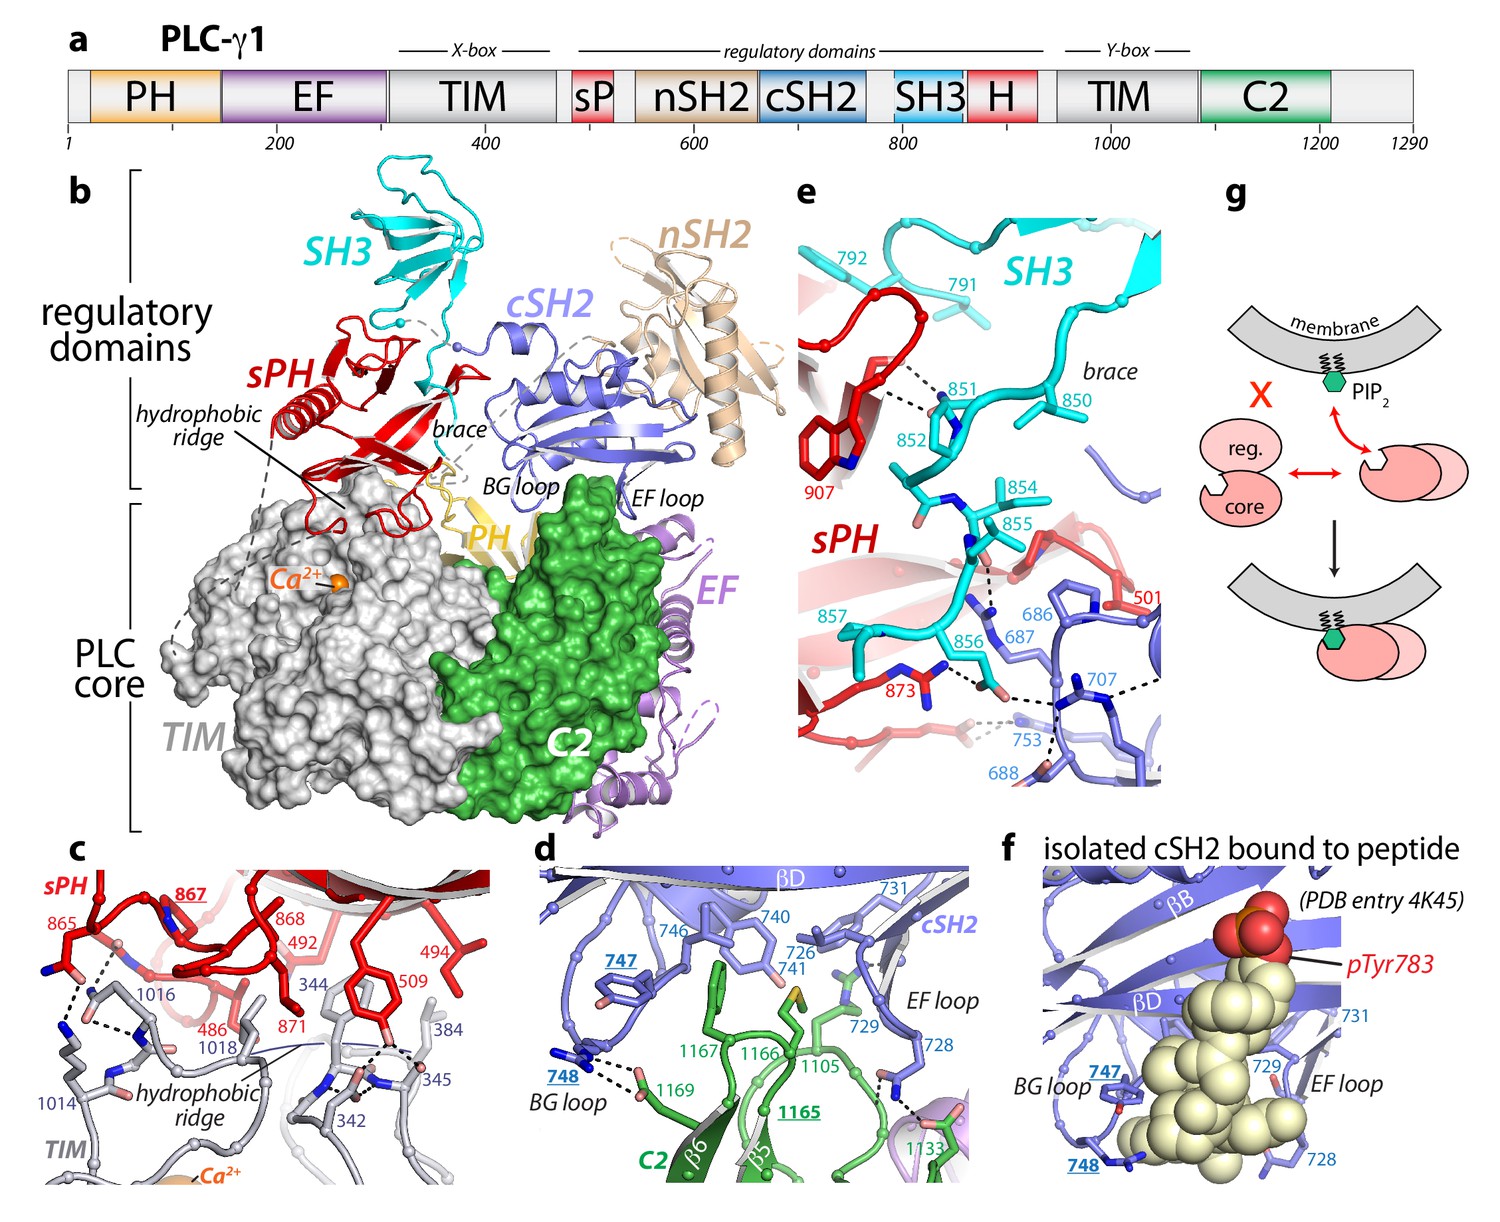
Crystal structure of autoinhibited PLC-γ1.
(a) Domain architecture of PLC-γ1 drawn to scale. (b) 2.5 Å resolution structure of PLC-γ1, domains are colored as in (a); TIM barrel and C2 domain are depicted as surfaces to highlight interactions with regulatory domains. The calcium cofactor (orange sphere) marks the active site and dashed lines indicate regions not built due to the absence of observable electron density. Borders of the Δ25 deletion (residues 766–790) used to facilitate crystallization are indicated with spheres. The hydrophobic ridge of the TIM barrel, which interacts with lipid membranes to facilitate catalysis, is occluded by the sPH domain. This arrangement of the sPH domain is supported by contacts with the cSH2 domain and further reinforced by a ‘brace’ formed by the C-terminal extension of the SH3 domain. (c–d) Structural details between the regulatory and core domains of PLC-γ1. (e) Expanded view of the SH3 domain. (f) Structure of the isolated cSH2 domain of PLC-γ1 bound to a peptide (spheres) encompassing phosphorylated Tyr783 (red) of PLC-γ1. Orientation is approximately the same as in panels (b) and (d). For panels (c–f) interfacial residues are numbered, dashed lines are hydrogen bonds, and residues mutated in Figure 3 are underlined. (g) Schematic emphasizing large conformational change that is proposed to occur before PLC-γ1 can access membrane-resident PIP2.
Figure 1—figure supplement 1
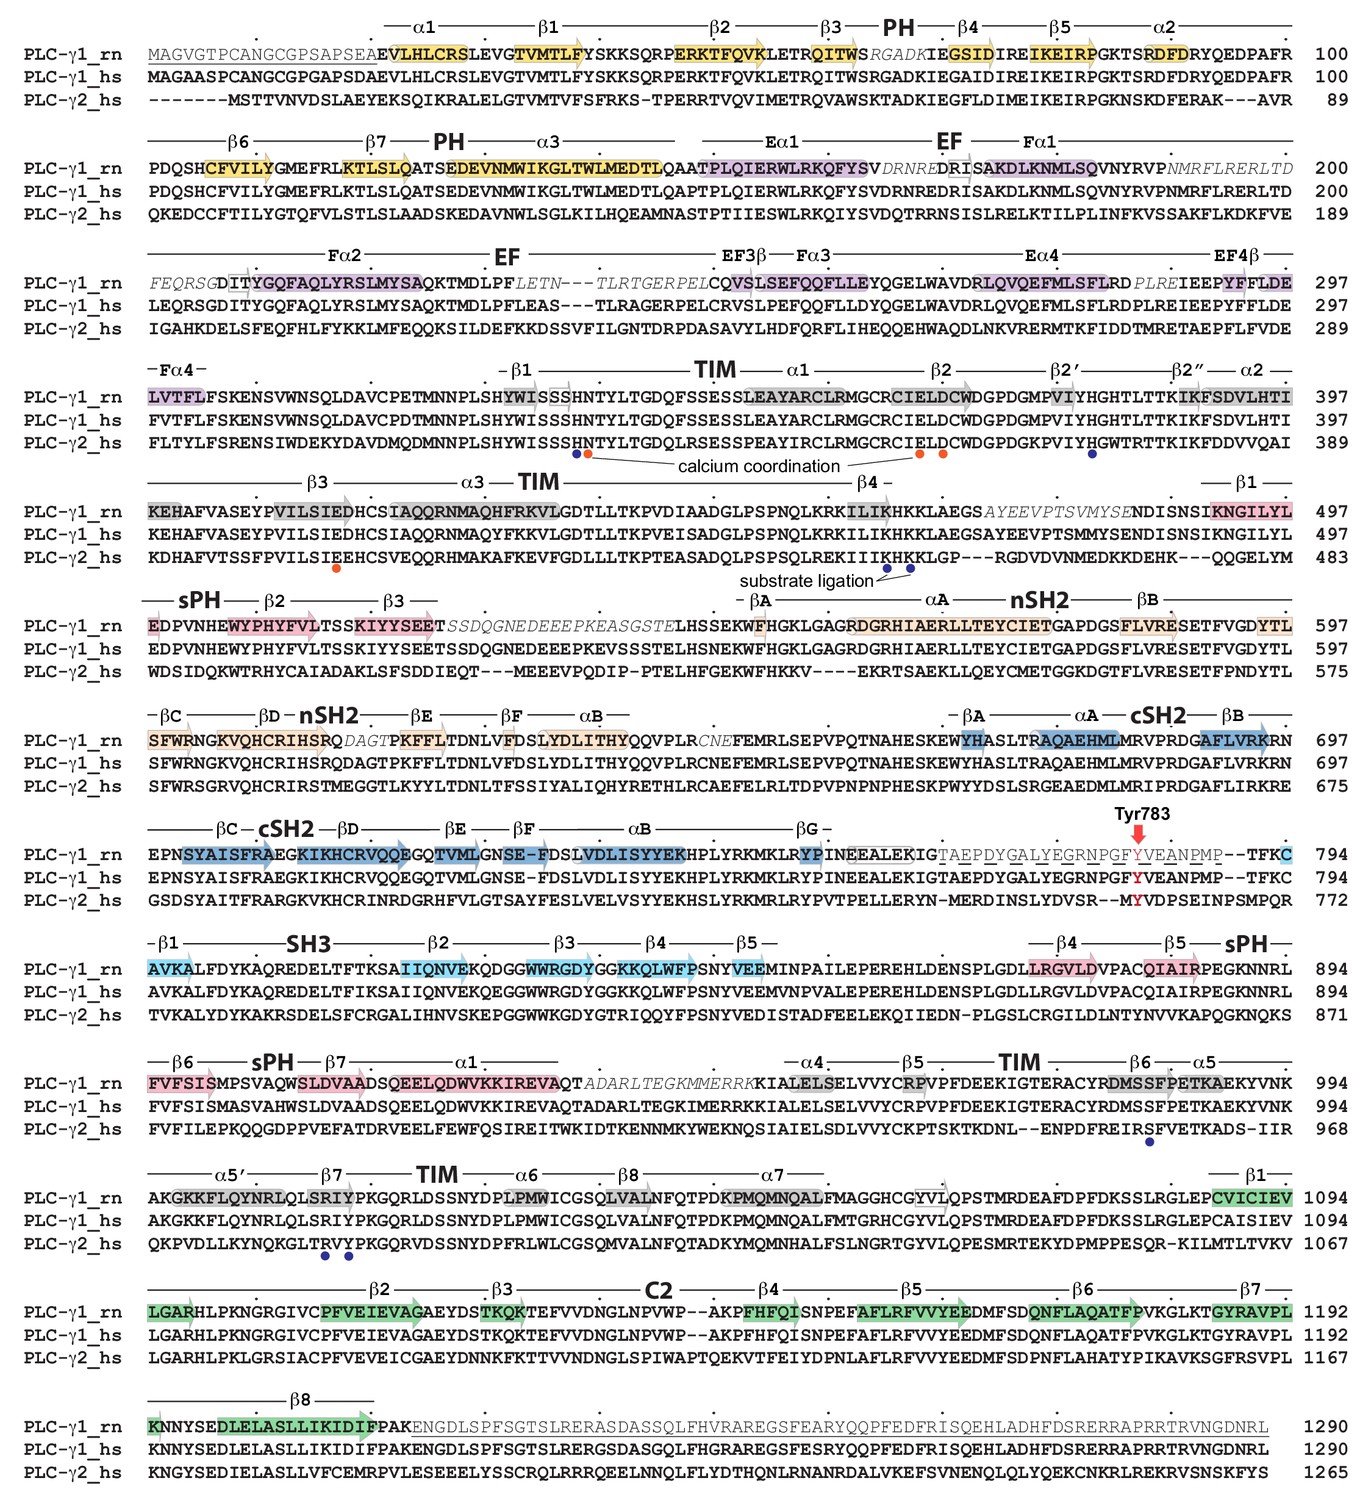
Primary sequence alignment of PLC-γ isozymes.
The sequence of rat PLC-γ1 (PLC-γ1_rn, UniProt accession number P10686), human PLC-γ1 (PLC-γ1_hs, P19174), and human PLC-γ2 (PLC-γ2_hs, P16885) were aligned using ClustalW. Dots denote every 10th residue. Underlined residues were removed from the crystallization construct and the Δ25 deletion is highlighted with a dashed underline. Electron density was not observed for residues in italics. Secondary structure (α-helices, cylinders; β-strands, arrows) was assigned using DSSP. Tyr783 in PLC-γ1 and Tyr759 in PLC-γ2 are highlighted in red. Substrate ligation defined based on structural homology to PLC-δ1 and -β2.
Figure 1—figure supplement 2
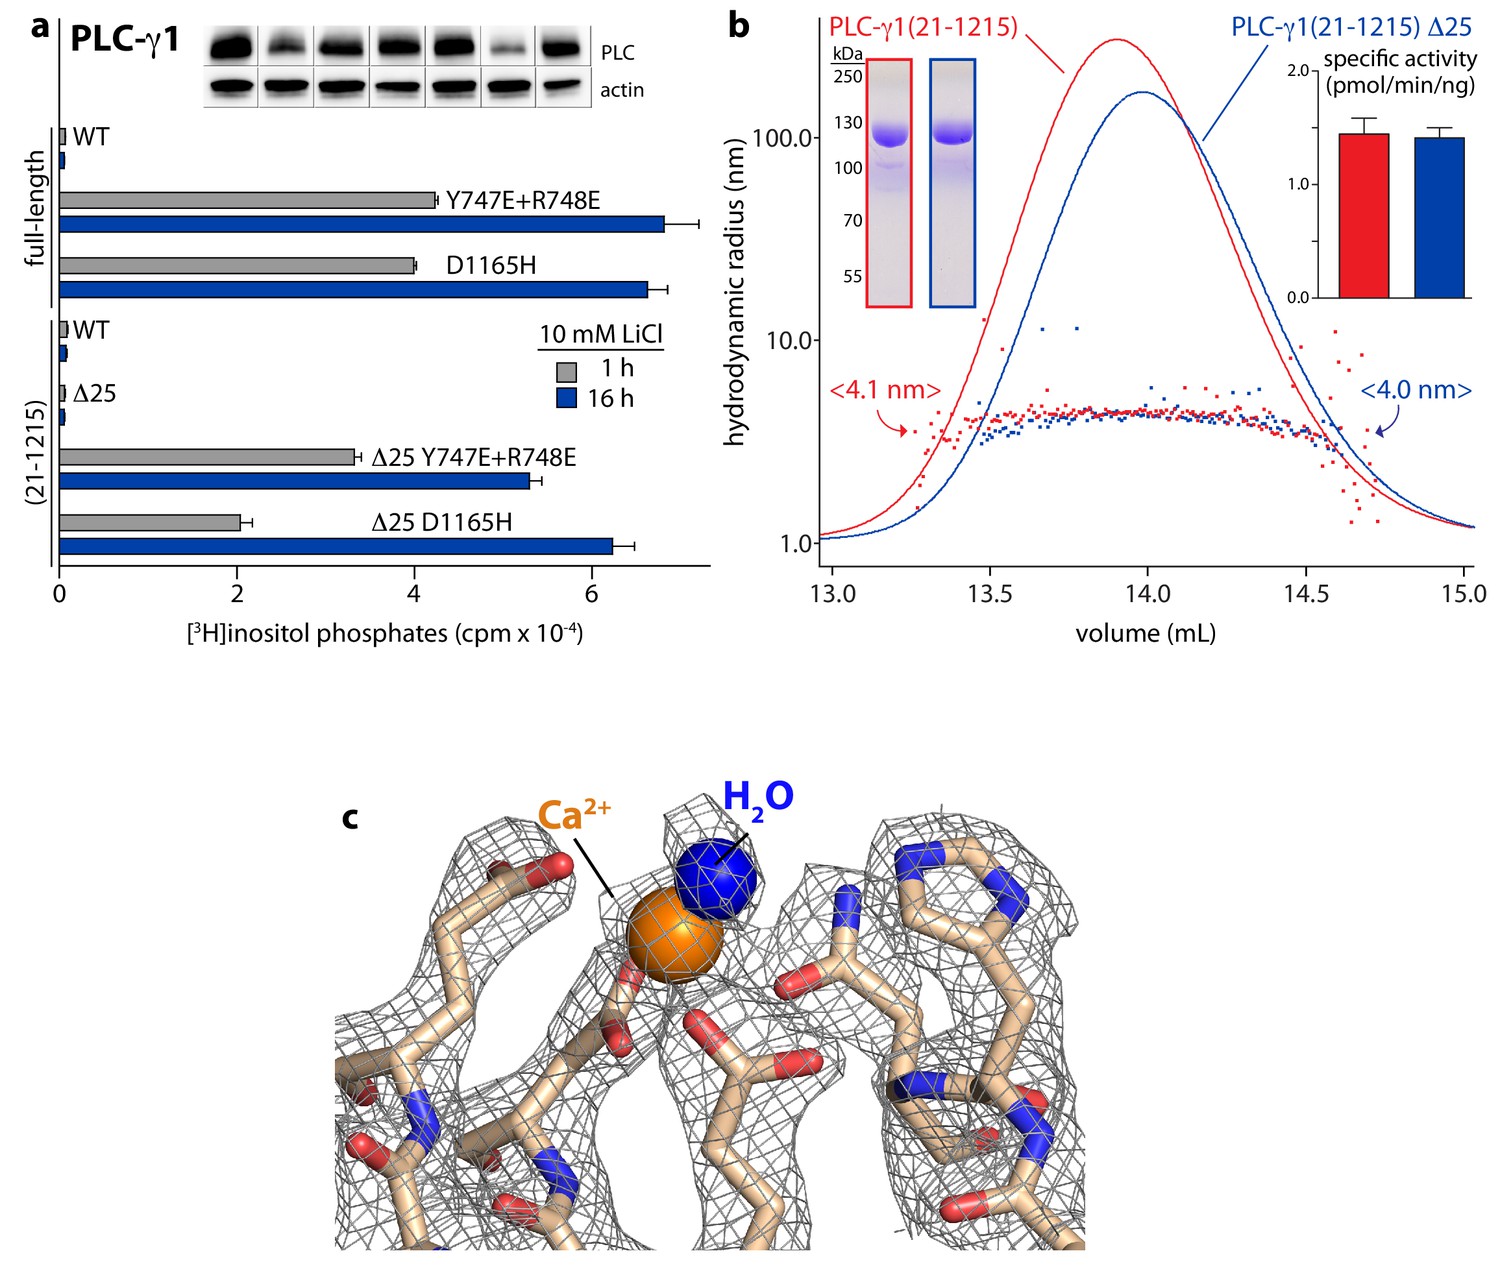
Crystallographic-grade PLC-γ1(21–1215) Δ25 is fully autoinhibited in cells and in vitro.
(a) Phospholipase activity of various forms of PLC-γ1 in cells. Data are the mean ± SEM of triplicate samples from a single experiment that is representative of data obtained in two independent experiments. Immunoblots of cell lysates are presented in the same order as the bar graph. (b) Analysis of purified PLC-γ1(21–1215) and PLC-γ1(21–1215) Δ25 by size exclusion chromatography coupled to multi-angle light scattering. One hundred micrograms of the indicated protein were applied to a Superdex 200 size exclusion column. Elution was monitored by UV absorbance (colored lines) and simultaneously analyzed by multi-angle light scattering to determine hydrodynamic radius (colored squares). The mean radius for each protein is indicated in angle brackets. Two micrograms of each protein were separated by SDS-PAGE and stained with Coomassie Brilliant blue (left inset) to assess purity. Specific activities were quantified using phospholipid vesicles containing 200 μM PE and 20 μM [3H]PIP2 (right inset). Data are presented as the mean ± SEM and were pooled from three independent experiments. (c) Electron density map (wire mesh) of the active site of PLC-γ1(21–1215) Δ25 (2Fo – Fc contoured at 1.5 σ).
Figure 1—figure supplement 3
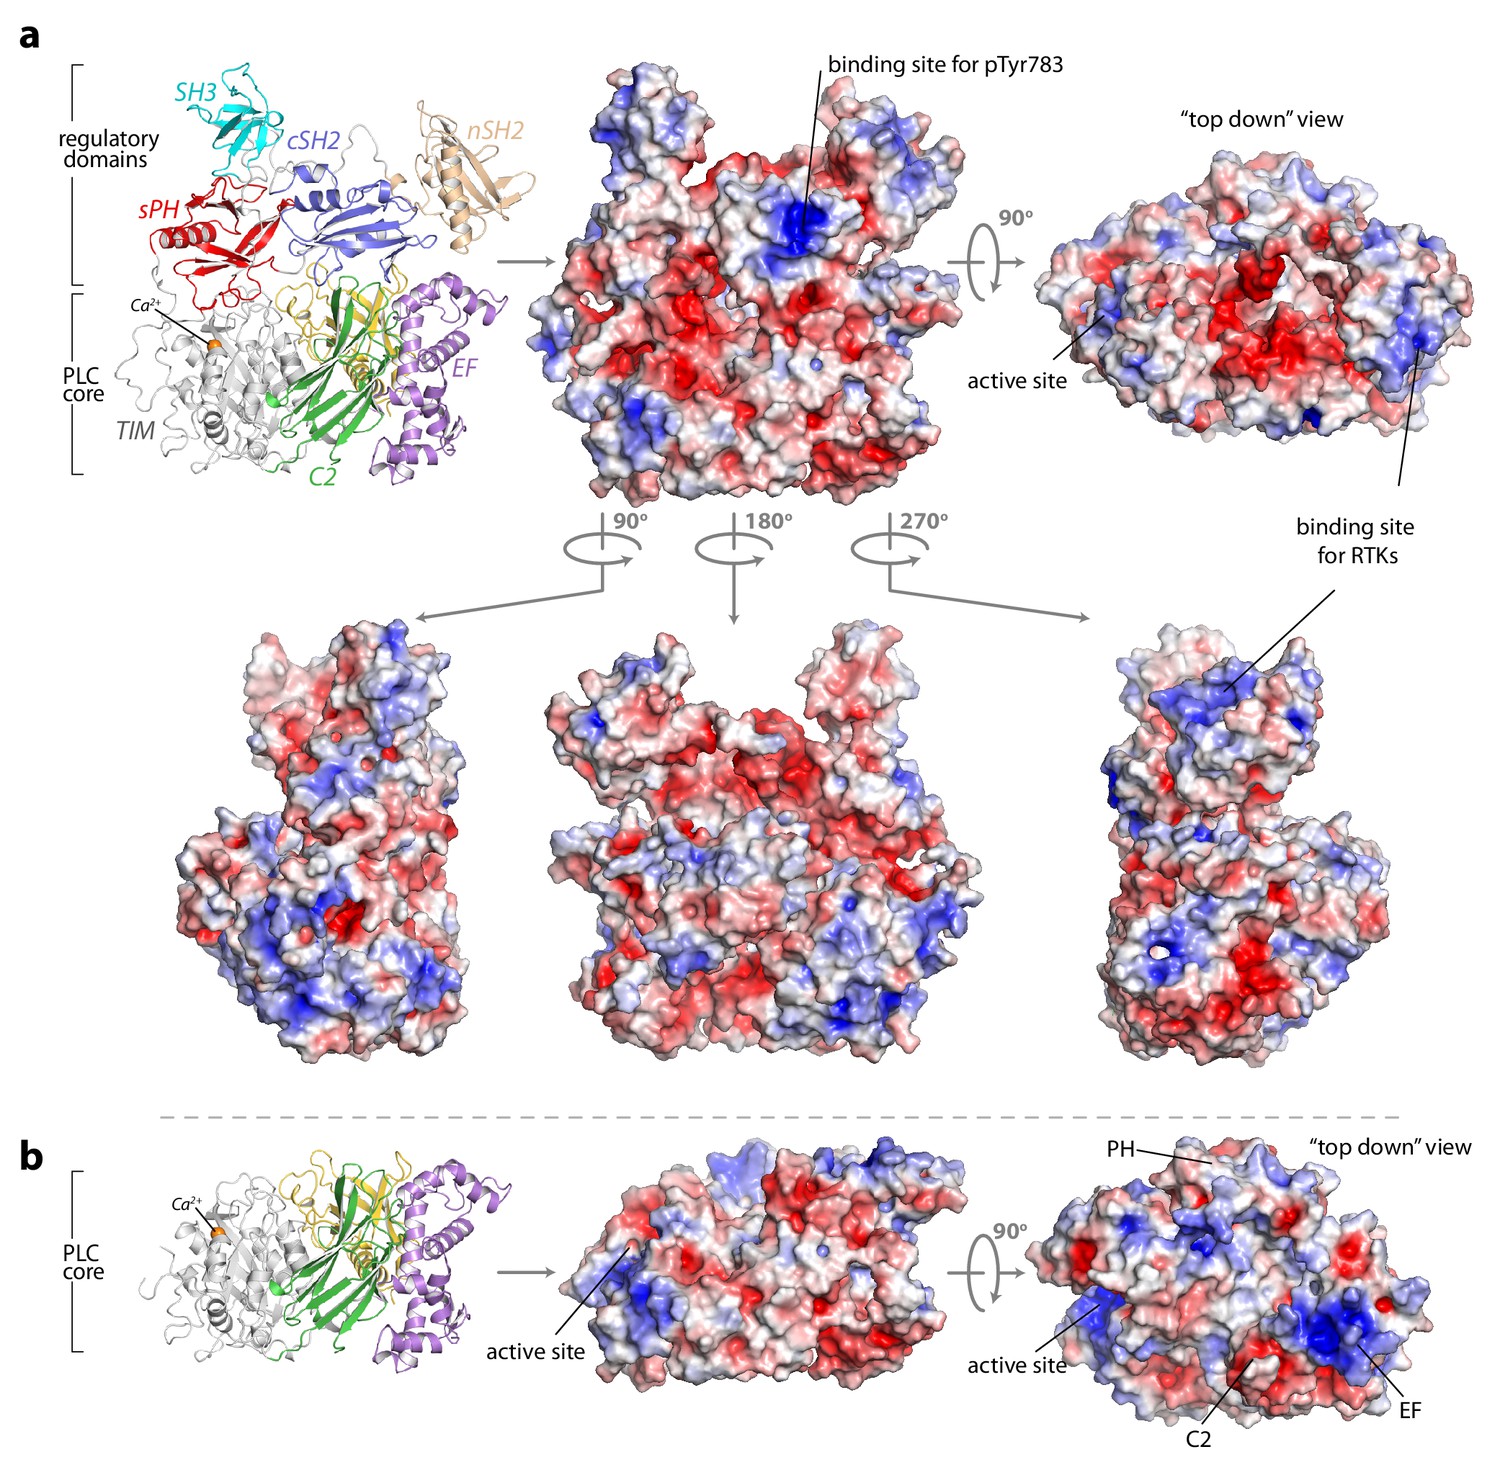
The surface of autoinhibited PLC-γ1 is electronegative and unlikely to bind biological membranes.
The solvent-accessible surface area of PLC-γ1 (a) or the core of the protein (b) was calculated and colored according to electrostatic potential (red, −5 kT/e; blue, 5 kT/e). Charges were calculated using AMBER and electrostatic surfaces were calculated using APBS executed within PyMOL.
Figure 1—figure supplement 4
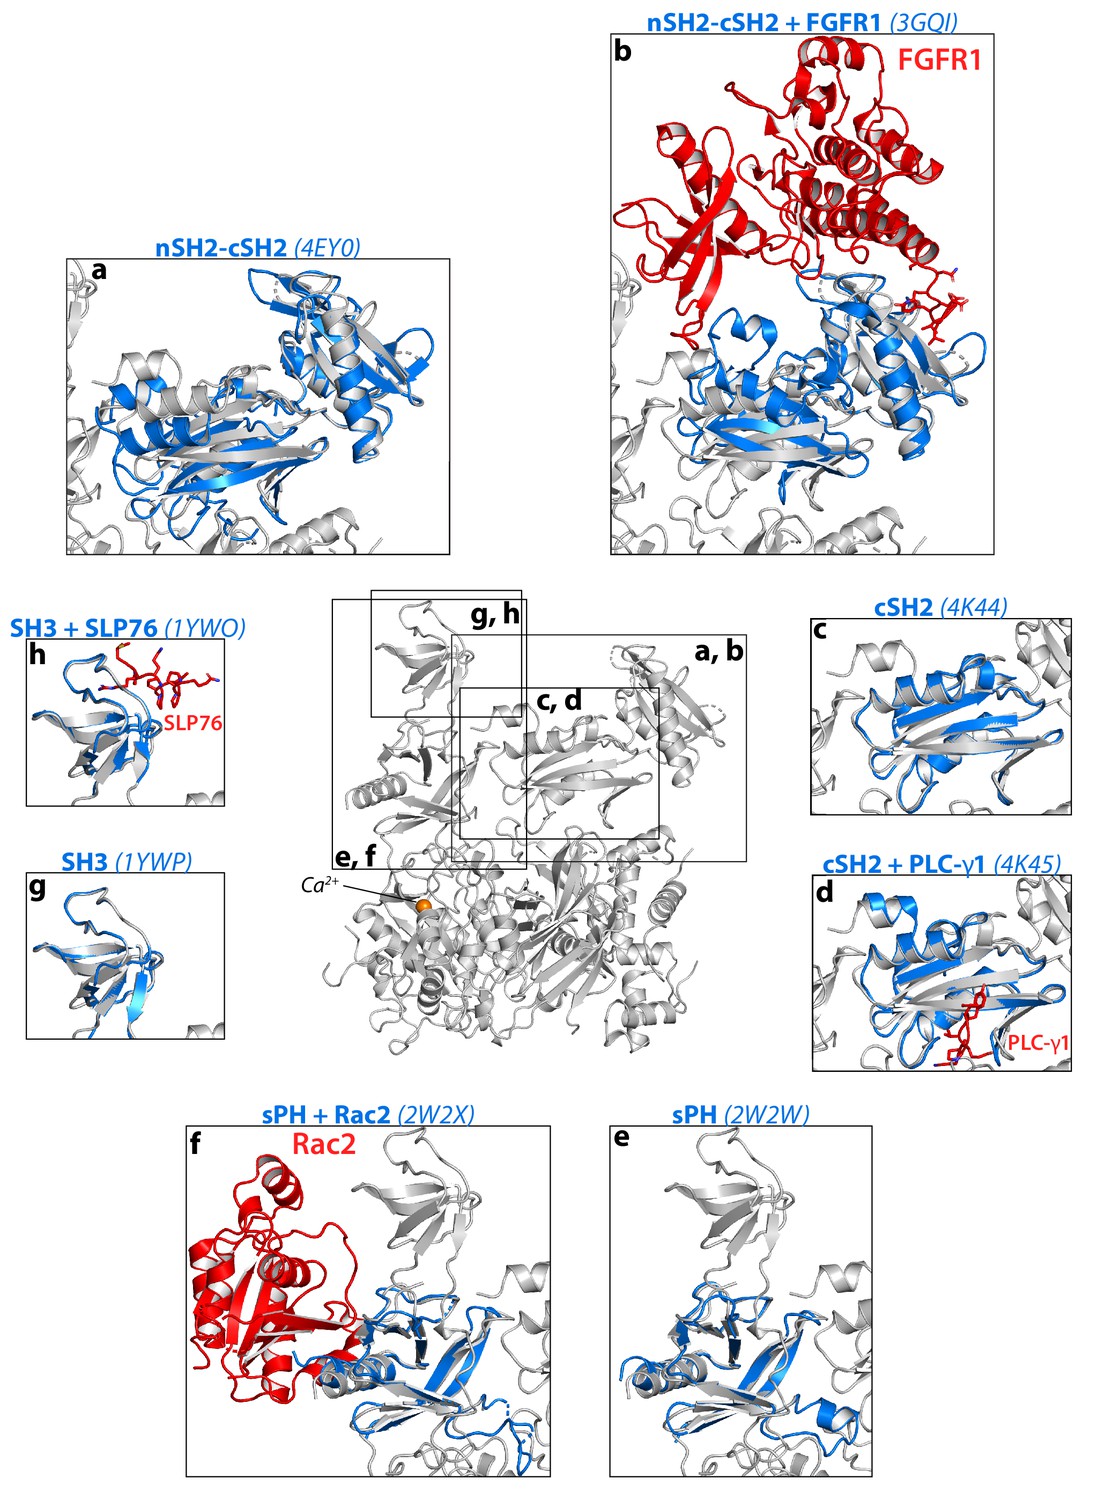
Structural comparisons between autoinhibited PLC-γ1 and fragments of the PLC-γ isozymes.
(a-h) The structure of autoinhibited PLC-γ1 (gray) was aligned with the indicated structures of isolated domains from PLC-γ1 or PLC-γ2 (blue). Binding partners co-crystallized with isolated domains are red. PDB accession numbers are listed in parentheses. In a–b, the tandem SH2 domains were aligned using the nSH2 domain.
Figure 2
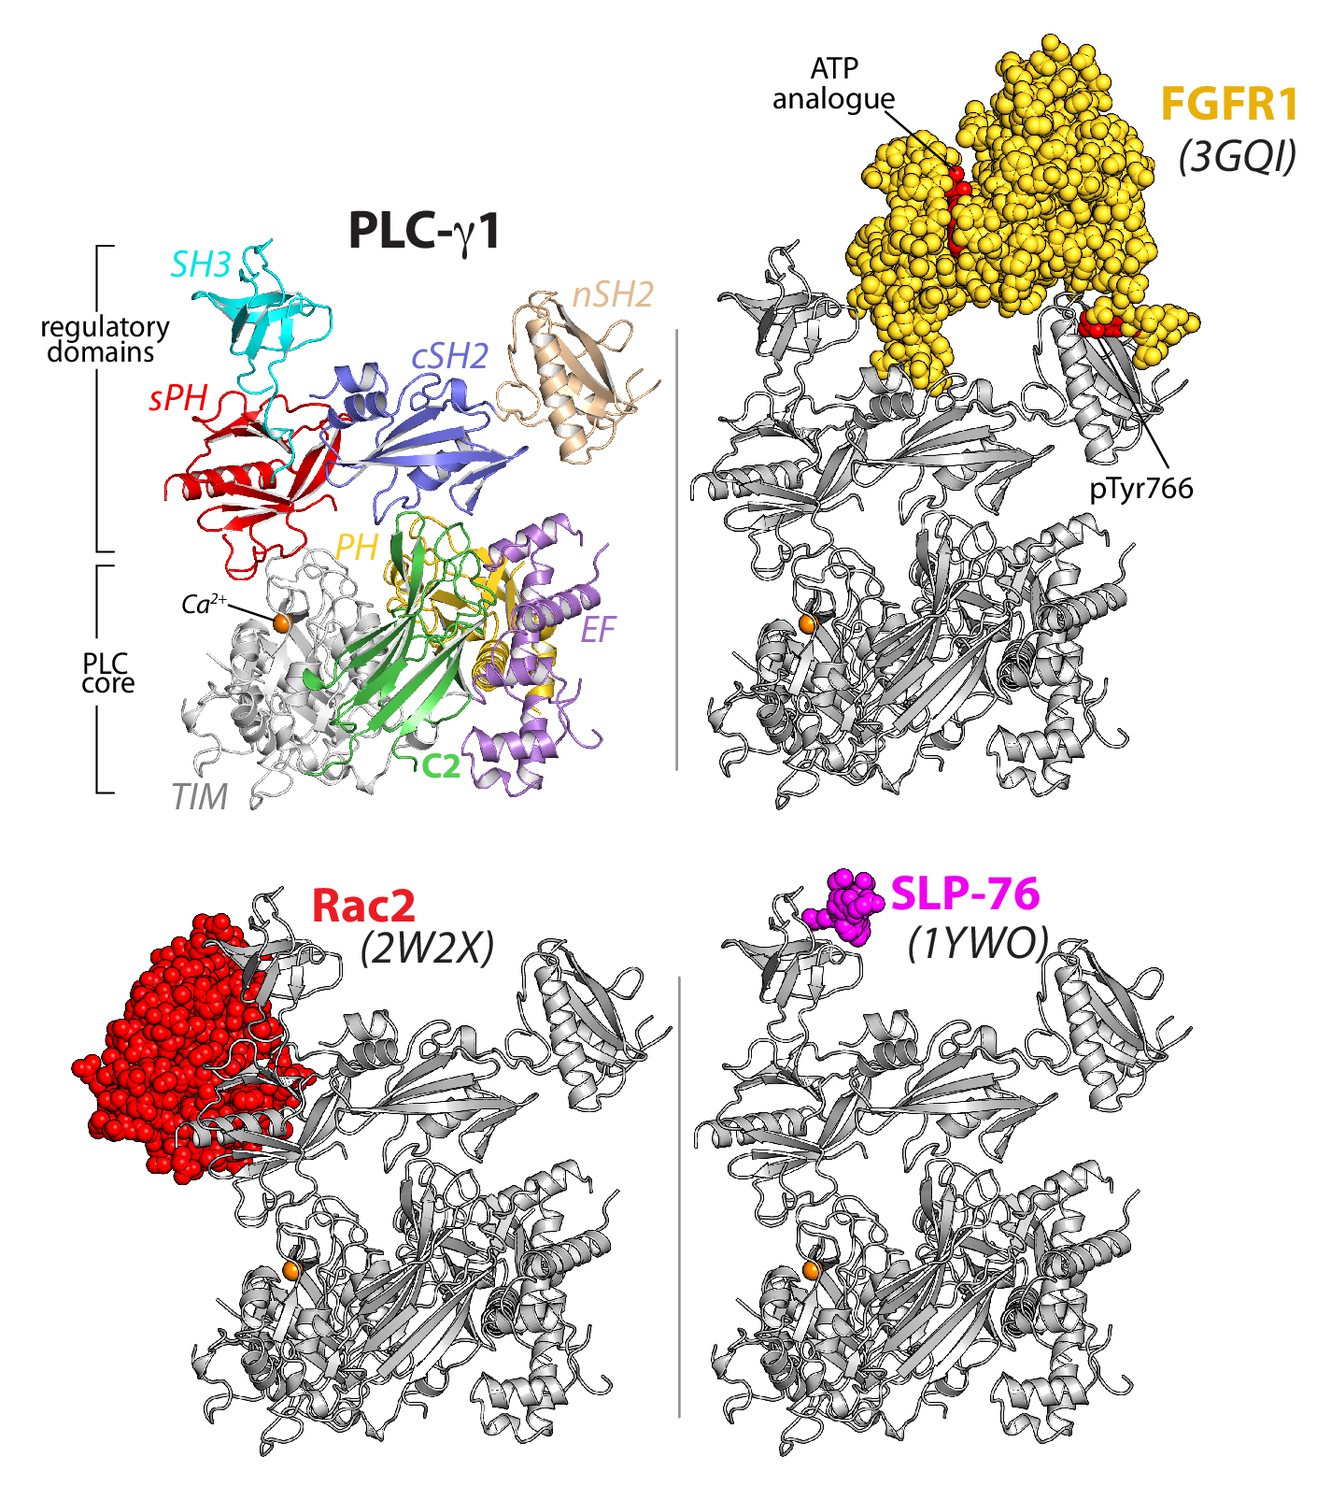
The regulatory domains of PLC-γ1 are organized to integrate multiple inputs simultaneously.
Structures of fragments of PLC-γ1 or -γ2 bound to biologically relevant proteins were superimposed on the structure of PLC-γ1 (gray ribbon) and partner proteins highlighted in color as space filling models. PDB accession numbers are listed in parentheses and the domain architecture of PLC-γ1 is shown at upper left in the same orientation.
Figure 3
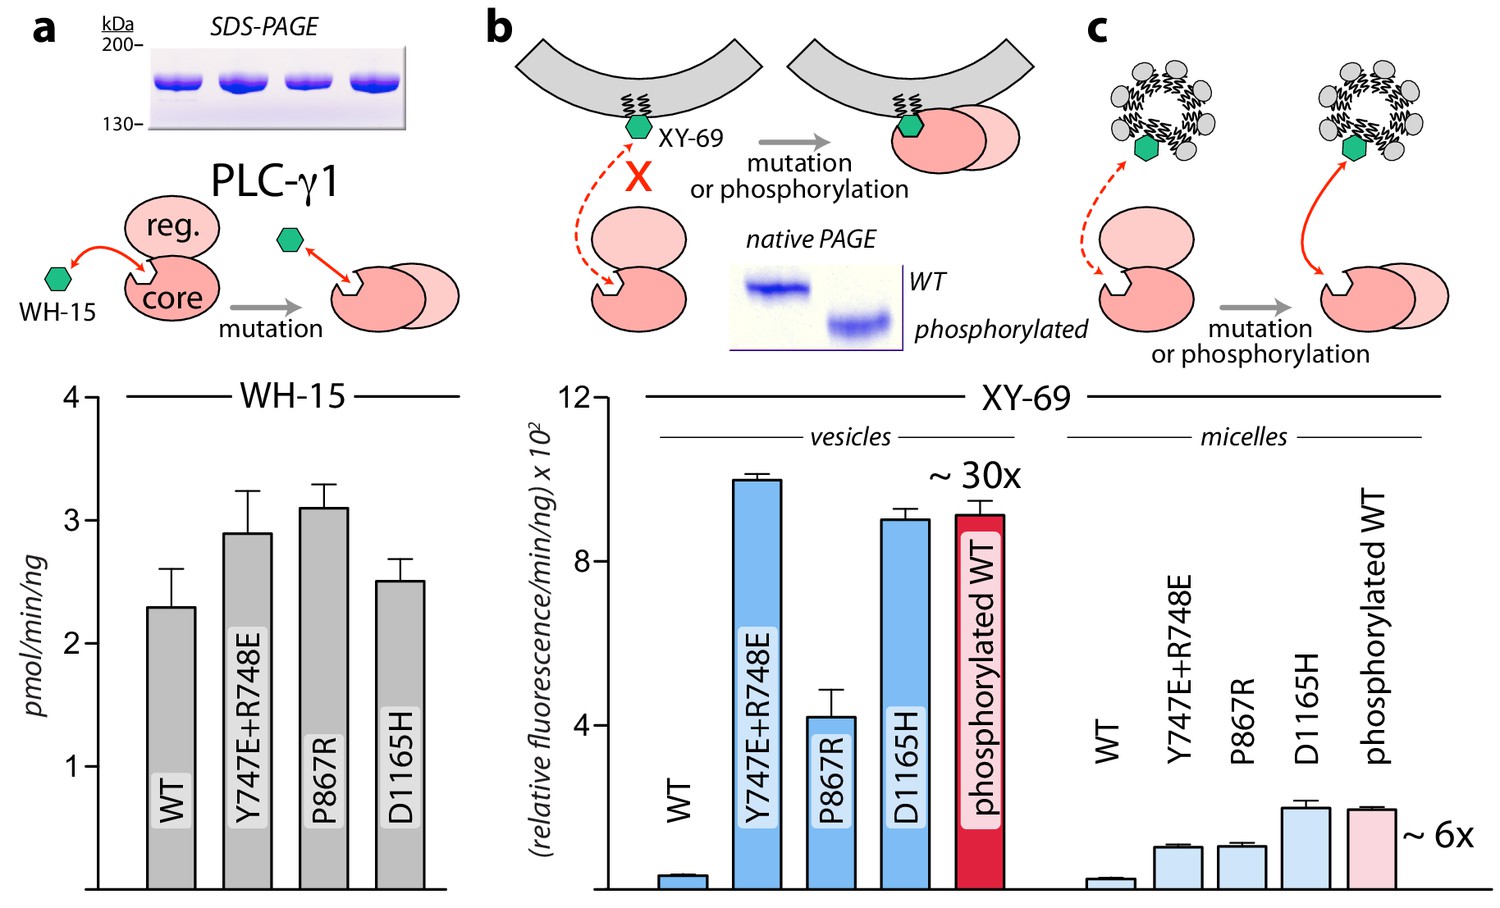
Interfacial regulation of purified forms of PLC-γ1.
(a) Specific activities measured with the soluble substrate, WH-15 (3 μM). Purified PLC-γ1 variants (2 μg) shown in inset in the same order as bar chart. Data represent the mean ± SEM calculated from three independent experiments. (b–c) Quantification of phospholipase activity at lipid interfaces. The membrane-associated substrate XY-69 (5 μM) was incorporated into phospholipid vesicles containing 220 μM PE and 20 μM PIP2 (vesicles) or detergent-mixed micelles containing 0.5% w/v sodium cholate (micelles) prior to the addition of indicated forms of PLC-γ1 (wild-type PLC-γ1, 1 nM; mutant forms, 0.5 nM). Phospholipase activity determined by quantifying XY-69 hydrolysis in real-time and presented as the mean ± SEM of three independent experiments. Phosphorylation of PLC-γ1 by a constitutively active version of the FGFR2 kinase domain confirmed by native PAGE followed by Coomassie Brilliant blue staining (inset).
Figure 4 with 3 supplements
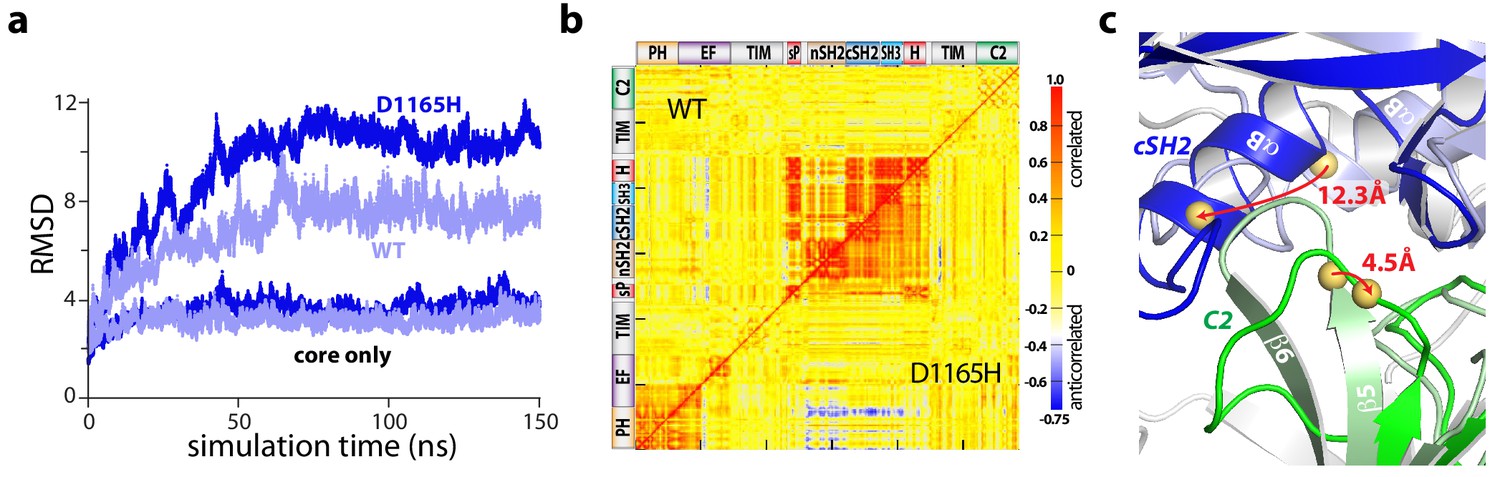
The regulatory domains of PLC-γ1 are dynamic in aMD simulations.
(a) Root mean square deviations (RMSD) of backbone atoms for the indicated trajectories relative to the starting model of autoinhibited PLC-γ1. For comparison, the equivalent RMSDs for the PLC core (‘core only’) are also shown. (b) Correlation matrix for pairs of residues in PLC-γ1 and PLC-γ1(D1165H). Correlated motions were calculated over the first 75 nanoseconds of each simulation. (c) Superimposition of the average structures of PLC-γ1 and PLC-γ1(D1165H). Structures were calculated over 75–150 nanoseconds of each simulation. Domains in wild-type PLC-γ1 and PLC-γ1(D1165H) are shown in light and dark colors, respectively; the remainder of the proteins are gray. Red arrows indicate displacement of select Cα atoms (yellow spheres).
Figure 4—figure supplement 1
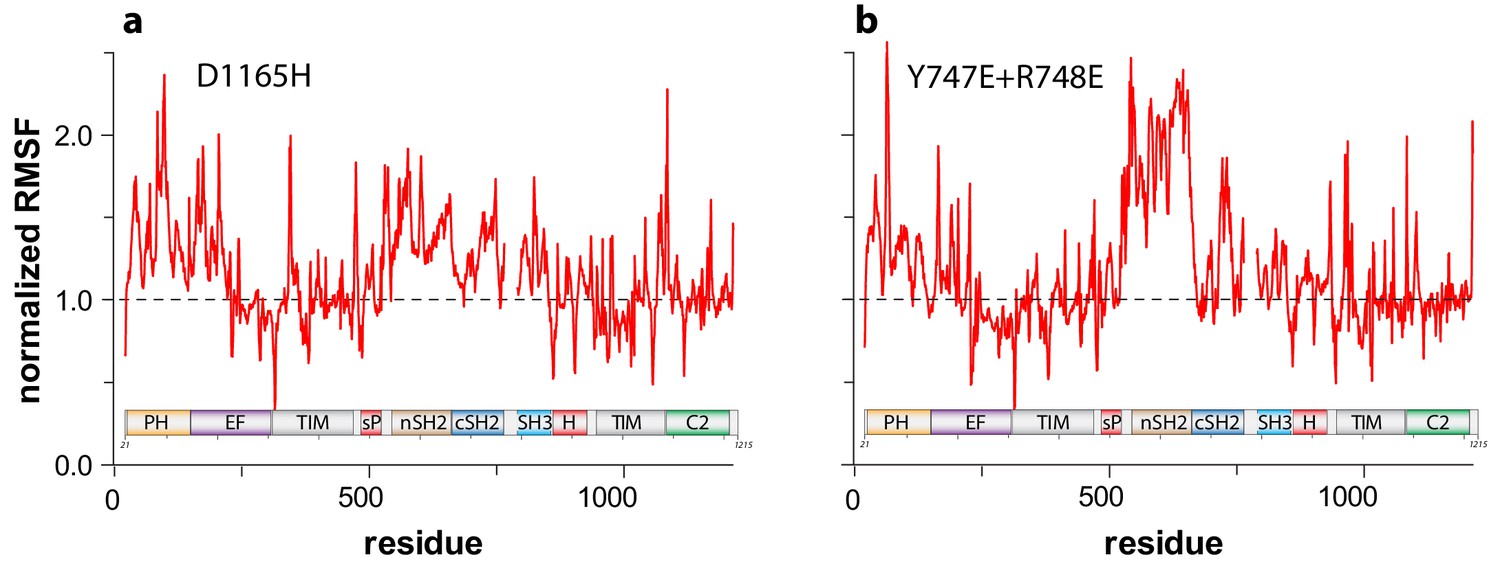
Activated forms of PLC-γ1 have highly mobile regulatory domains in aMD simulations.
Root mean square fluctuations (RMSF) about the average structure of (a) PLC-γ1(D1165H) or (b) PLC-γ1(Y747E+R748E) were calculated for each Cα atom and divided by the equivalent RMSF of wild-type PLC-γ1.
Figure 4—figure supplement 2
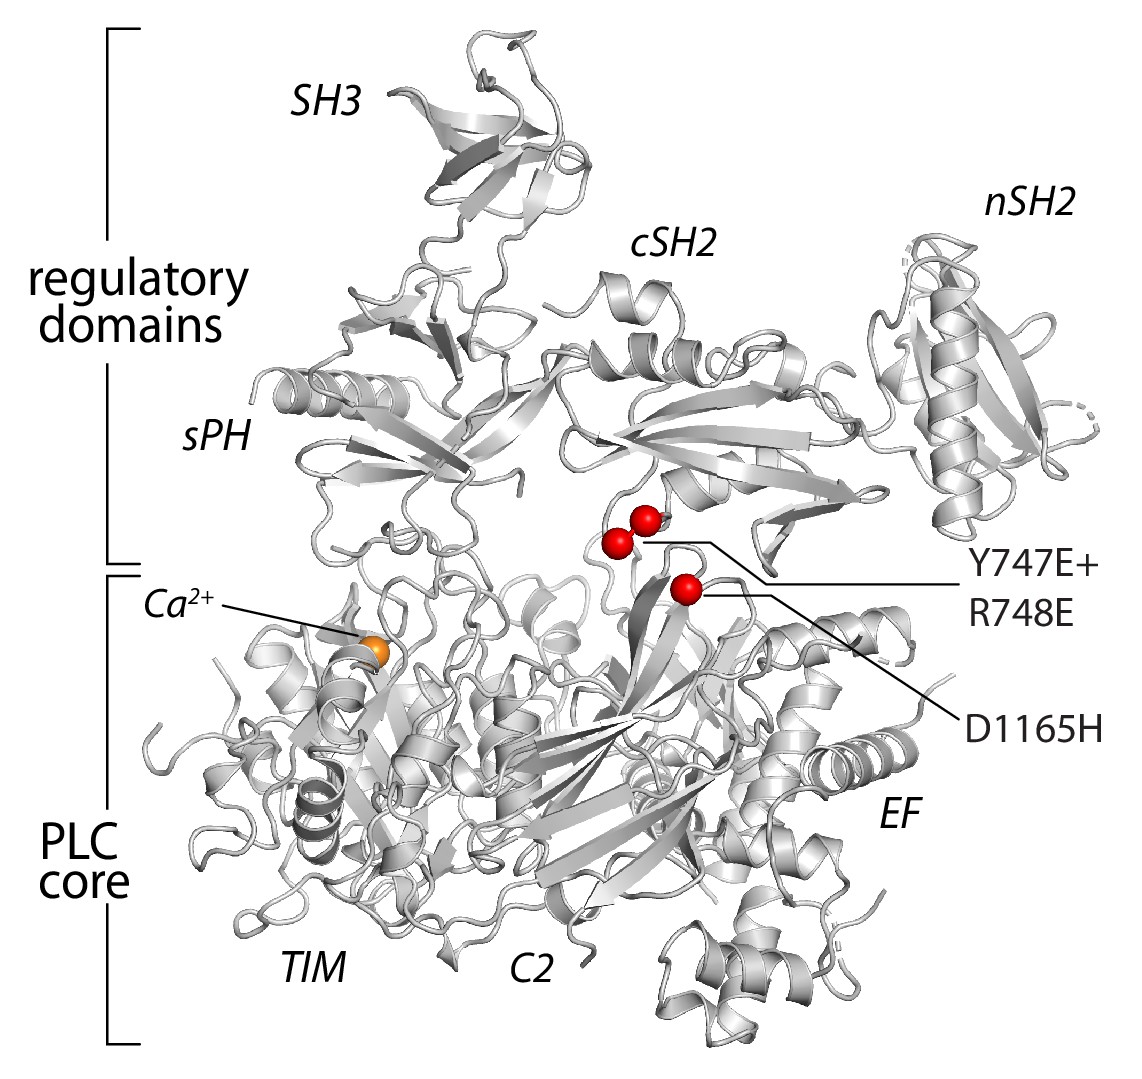
Substitutions of PLC-γ1 analyzed in aMD simulations.
The positions of substitutions (red spheres) studied are mapped onto the structure of PLC-γ1.
Figure 4—figure supplement 3
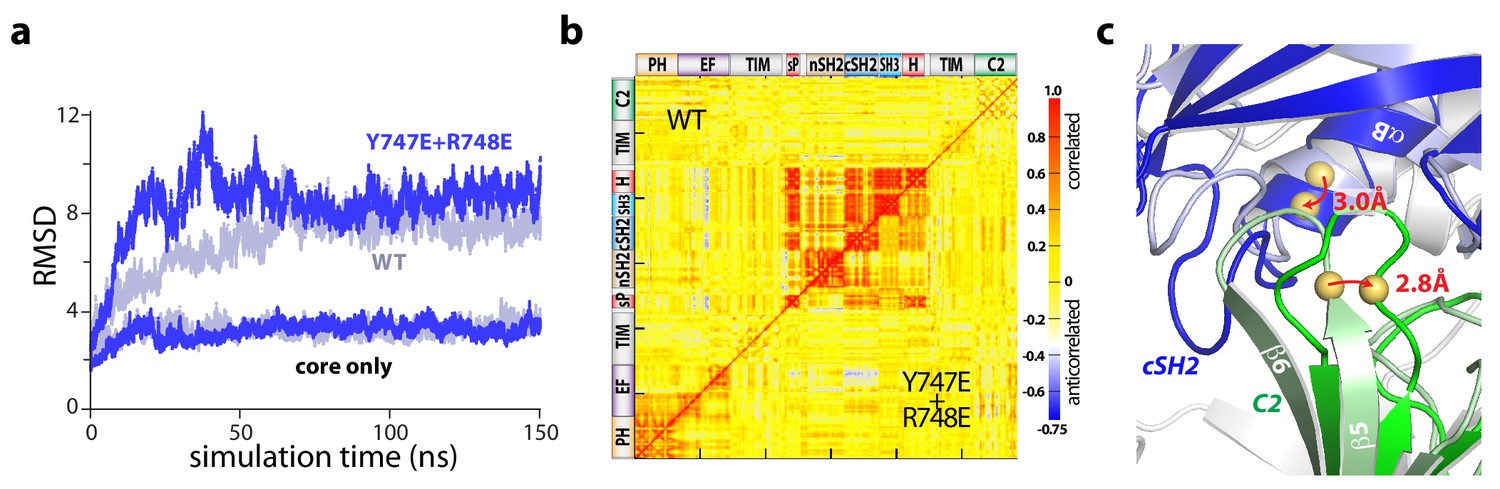
Point mutations in the cSH2 domain recapitulate the dynamics of the regulatory domains in aMD simulations.
(a) Root mean square deviations (RMSD) of backbone atoms for the indicated trajectories relative to the starting model of auto-inhibited PLC-γ1. For comparison, the equivalent RMSDs for the PLC core (‘core only’) are also shown. (b) Correlation matrix for pairs of residues in PLC-γ1 and PLC-γ1(Y747E+R748E) calculated over the first 75 nanoseconds of each simulation. (c) Superimposition of the average structures of PLC-γ1 and PLC-γ1(Y747E+R748E) calculated over 75–150 nanoseconds of each simulation. Domains in wild-type PLC-γ1 and PLC-γ1(Y747E+R748E) are shown in light and dark colors, respectively; the remainder of the proteins are gray. Red arrows indicate displacement of select Cα atoms (yellow spheres).
Figure 5 with 2 supplements
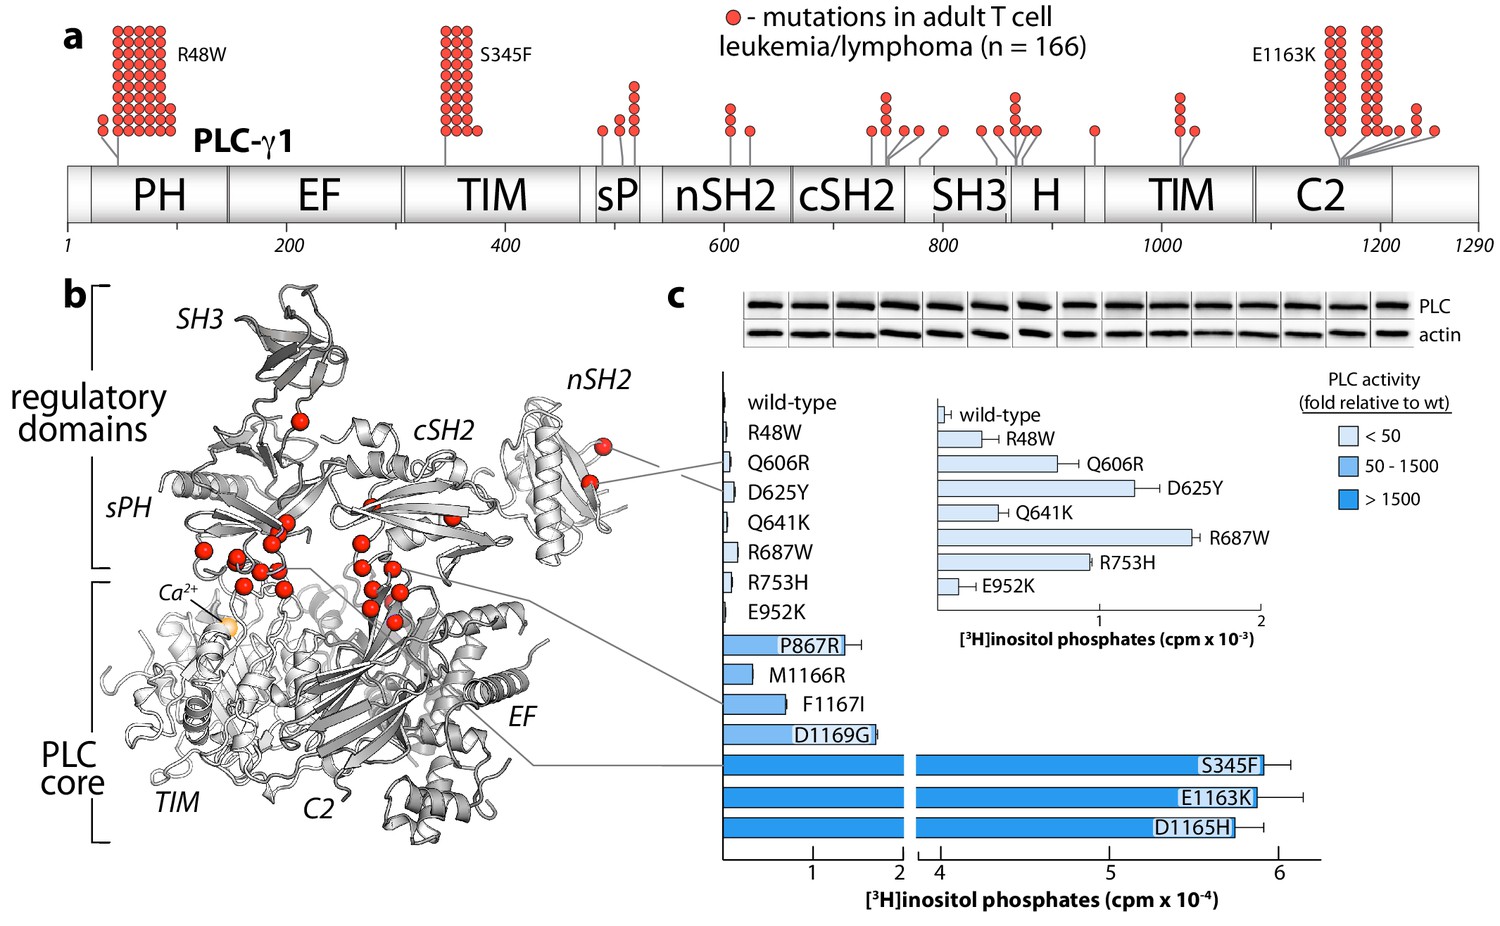
Substitutions of PLC-γ1 found in cancers activate the enzyme.
(a) Position (n = 26) and frequency of substitutions (red spheres) in PLC-γ1 for a cohort of 370 patients with adult T cell leukemia/lymphoma. (b) Mutations from (a) mapped onto the structure of PLC-γ1. (c) Basal phospholipase activity of mutant forms of PLC-γ1 in cells. Data represent the mean ± SEM of triplicate samples from a single experiment representative of three independent experiments. Inset shows mutant forms of PLC-γ1 with the lowest relative basal activity. Immunoblots of cell lysates are presented in the same order as the bar graph.
Figure 5—figure supplement 1
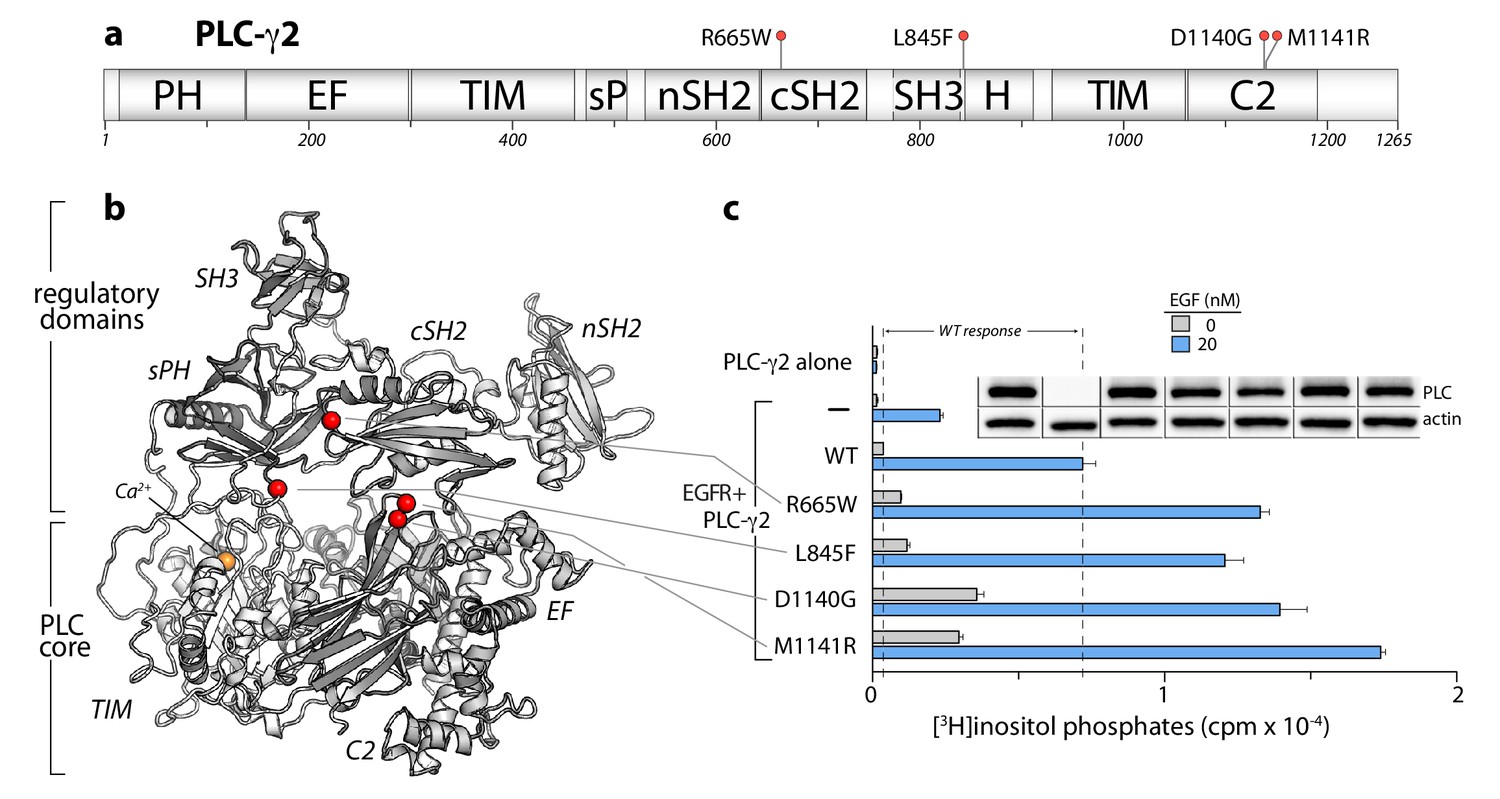
PLC-γ2 is constitutively activated by substitutions found in cancers.
(a) Domain architecture of PLC-γ2 drawn to scale. Position of substitutions (red spheres) in PLC-γ2 in patients with chronic lymphocytic leukemia are indicated. (b) Substitutions (red spheres) mapped onto a homology model of PLC-γ2. (c) Basal and receptor-dependent activation of PLC-γ2 mutants in cells. Data are presented as the mean ± SEM of triplicate samples from one experiment representative of three independent experiments. Immunoblots of cell lysates are presented in the same order as the bar graph.
Figure 5—figure supplement 2
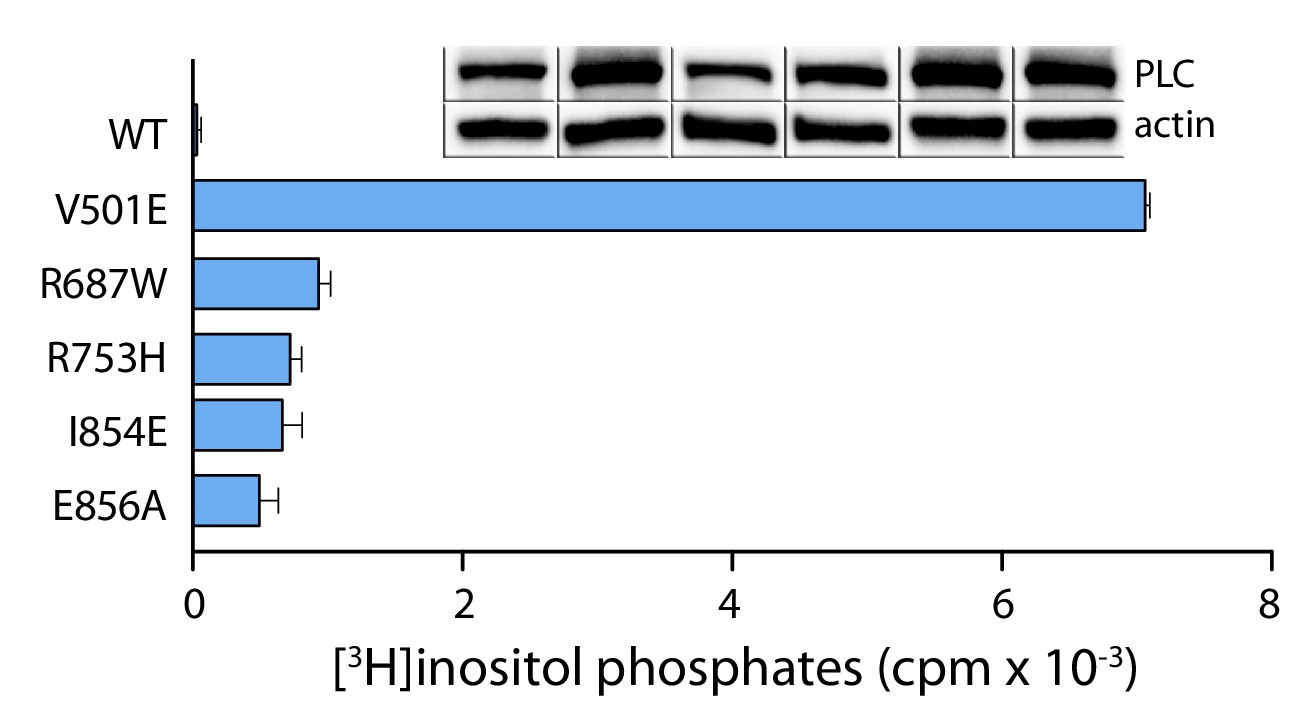
Cancer-associated substitutions within the ‘keystone’ residues of the SH3 domain activate PLC-γ1.
(a) Basal phospholipase activities of the indicated mutant forms of PLC-γ1 were quantified after transient overexpression in cells. Data represent the mean ± SEM of triplicate samples from a single experiment representative of three independent experiments. Immunoblots of cell lysates are presented in the same order as the bar graph.
Figure 6
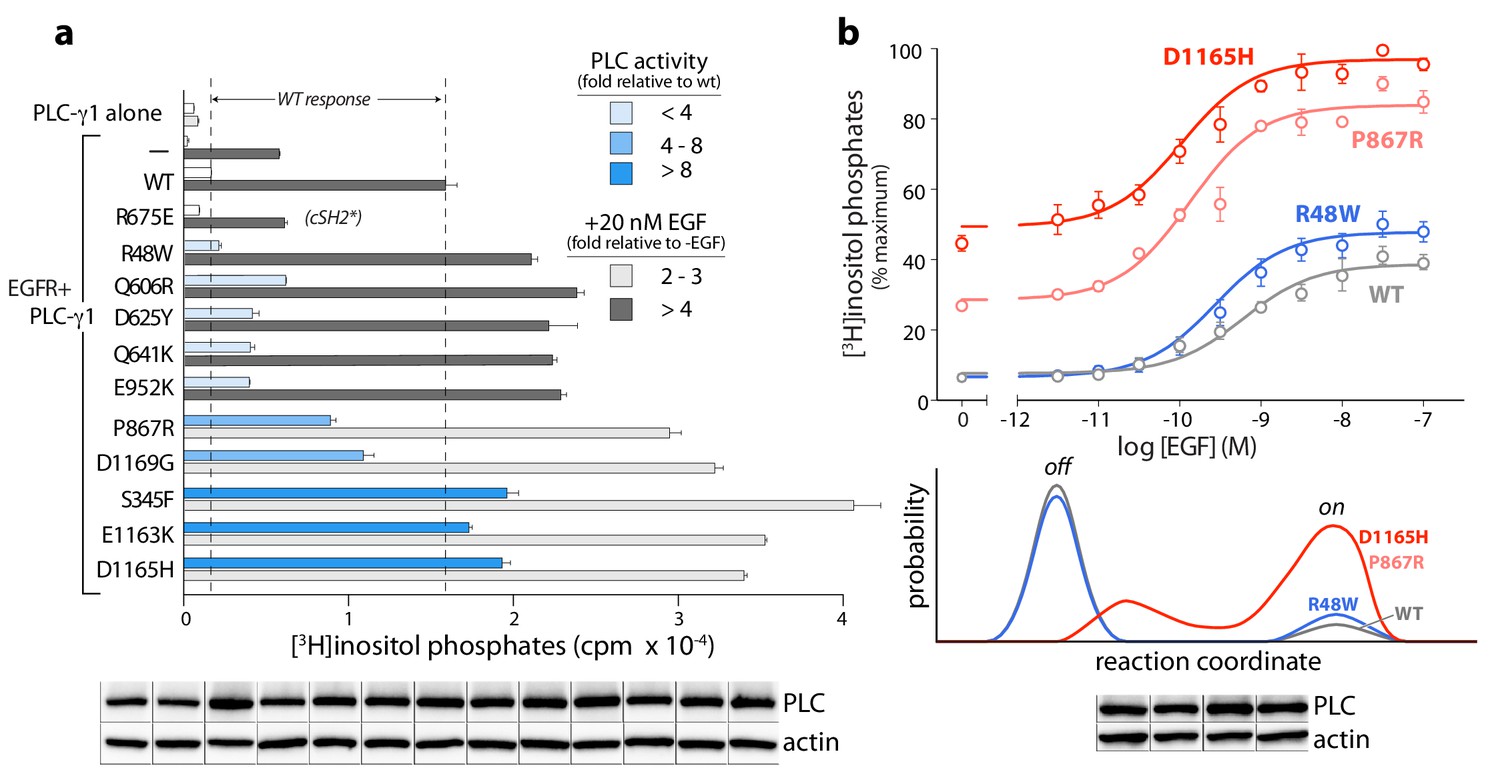
Cancer-associated substitutions prime PLC-γ1 for activation by EGFR in cells.
(a) Receptor-dependent activation of mutant forms of PLC-γ1. A substitution that abolishes phosphorylation-dependent activation of PLC-γ1 is indicated (cSH2*). Data are the mean ± SEM of triplicate samples from one experiment representative of two independent experiments. (b) EGF concentration-effect curves for wild-type and select mutant forms of PLC-γ1. Data are presented as the mean ± SEM of single data sets pooled from three independent experiments. Hypothetical reaction coordinates for each form of PLC-γ1 are shown below. In both panels, immunoblots of cell lysates transfected with PLC-γ1 are presented in the same order as the bar chart (top to bottom).
Figure 7 with 1 supplement
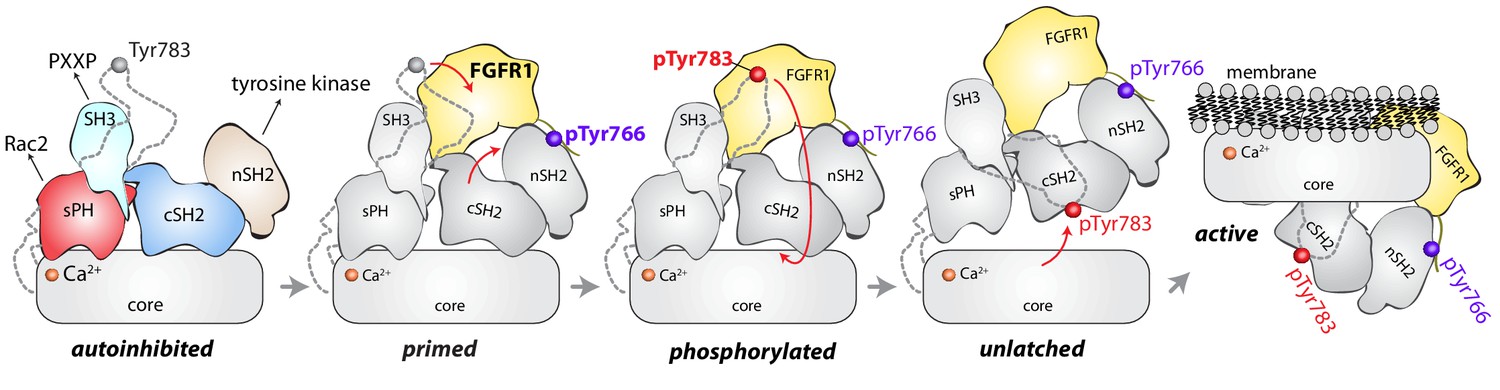
Model for phosphorylation-induced activation of PLC-γ1.
In the basal state, the nSH2 domain of PLC-γ1 mediates recruitment of the autoinhibited enzyme to activated receptor tyrosine kinases, for example FGFR1. The nSH2 domain binds to phosphorylated Tyr766 (pTyr766) in the C-terminal tail of FGFR1, and its kinase domain acts as a lever to destabilize the interaction between the cSH2 and C2 domains of PLC-γ1, priming the lipase for phosphorylation-dependent activation. PLC-γ1 is subsequently phosphorylated on Tyr783, and the engagement of pTyr783 by the cSH2 domain results in the full dissociation of the cSH2 domain from the C2 domain. Importantly, the phosphorylation of Tyr783 and its subsequent engagement by the cSH2 domain is predicted to induce a large-scale rearrangement of the regulatory domains with respect to the core before the phospholipase can hydrolyze membrane-resident PIP2.
Figure 7—figure supplement 1
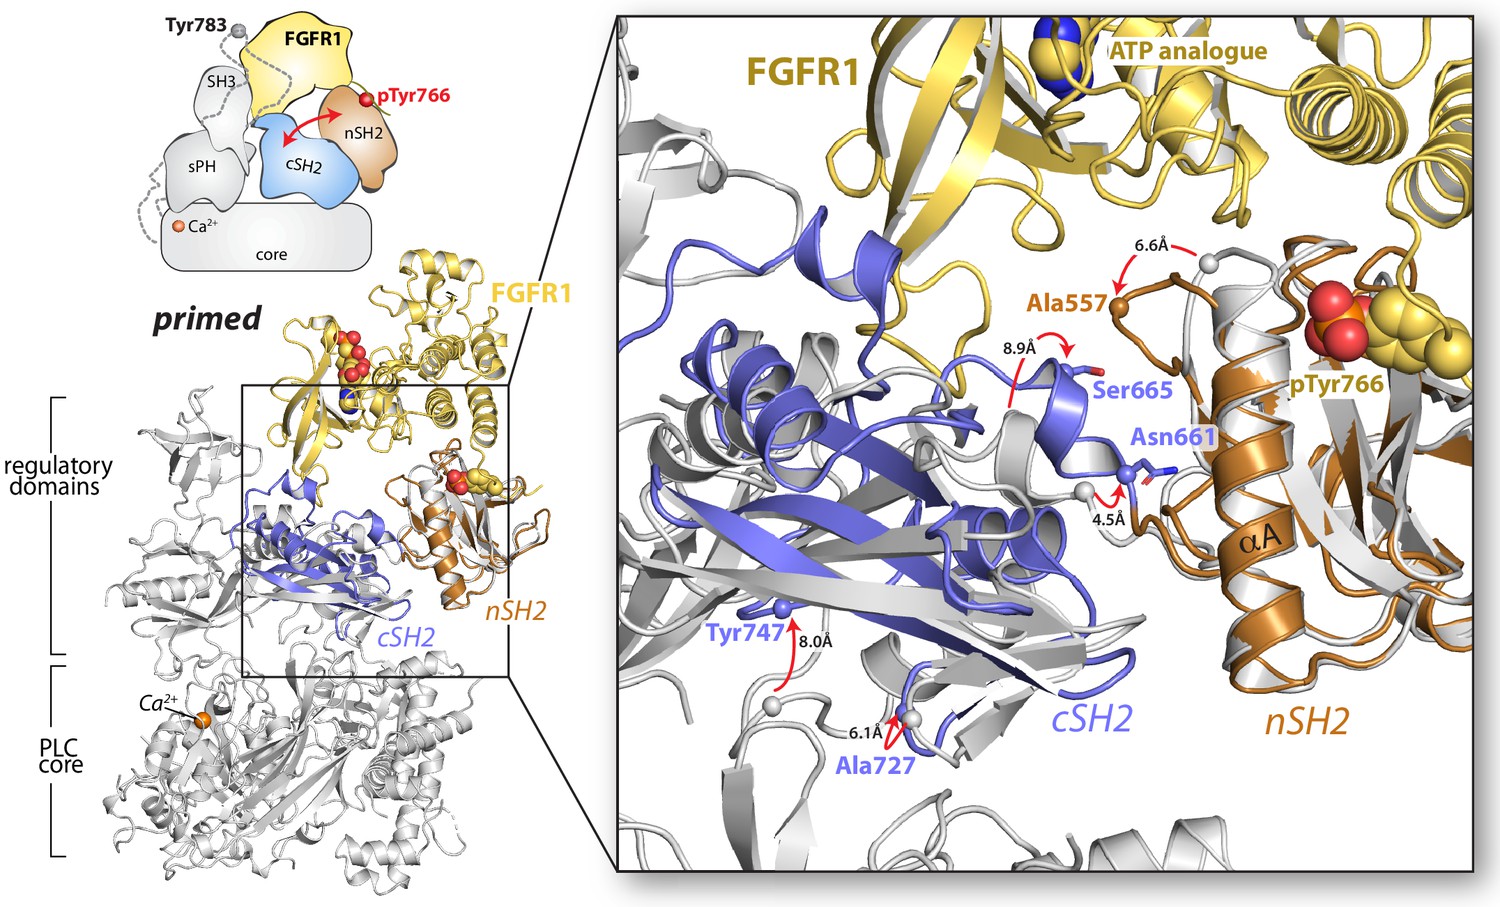
Proposed mechanism for priming of PLC-γ1 by FGFR1.
The structure of the SH2 domain array of PLC-γ1 bound to the kinase domain of FGFR1 (nSH2 domain, orange; cSH2 domain, blue; FGFR1 kinase domain, yellow; PDB code: 3GQI) was superimposed on the structure of autoinhibited PLC-γ1 (gray) using the nSH2 domain. Red arrows indicate displacement of select residues (spheres represent Cα atoms).
Tables
Key resources table
| Reagent type (species) or resource | Designation | Source or reference | Identifiers | Additional information |
|---|---|---|---|---|
| Strain, strain background (Escherichia coli) | Rosetta2 (DE3) pLysS | Novagen | Cat# 71403 | Chemically competent cells |
| Cell line (Homo sapiens) | HEK293 | American Type Culture Collection | Cat# CRL-1573 RRID:CVCL_0045 | |
| Cell line (Trichoplusia ni) | HighFive | Invitrogen | Cat# B85502 RRID:CVCL_C190 | |
| Antibody | anti-HA epitope (mouse monoclonal) | BioLegend | Cat# 901513 RRID:AB_2565335 | WB (1:1000) |
| Antibody | anti-β-actin (mouse monoclonal) | SigmaAldrich | Cat# A1978 RRID:AB_476692 | WB (1:4000) |
| Recombinant DNA reagent | pcHALIC-PLC-γ1 (plasmid) | this paper | Vector is a modified version of pcDNA3.1 containing HA tag | |
| Recombinant DNA reagent | pcHALIC-PLC-γ2 (plasmid) | this paper | Vector is a modified version of pcDNA3.1 containing HA tag | |
| Recombinant DNA reagent | p15LIC2-FGFR2K E565A (plasmid) | PMID: 20807769 | Vector is a modified version of pET15b containing His6tag and TEV cleavage sequence | |
| Recombinant DNA reagent | pFBLIC2-PLC-γ1(21–1215) (plasmid) | this paper | Vector is a modified version of pFastBacHT1 containing His6 tag and TEV cleavage sequence | |
| Recombinant DNA reagent | pFBLIC2-PLC-γ1(21–1215) Δ25 (plasmid) | this paper | Vector is a modified version of pFastBacHT1 containing His6 tag and TEV cleavage sequence | |
| Recombinant DNA reagent | pcDNA3-EGFR (plasmid) | this paper | Original source: Dr. H. Shelton Earp, UNC-Chapel Hill | |
| Peptide, recombinant protein | human epidermal growth factor | Invitrogen | Cat# PHG0313 | |
| Software, algorithm | HKL2000 | PMID: 27799103 | ||
| Software, algorithm | Phenix | PMID: 20124702 | RRID:SCR_014224 | Version 1.10.1–2155 |
| Software, algorithm | WinCoot | PMID: 20383002 | RRID:SCR_014222 | Version 0.8.2 |
| Software, algorithm | PyMOL | pymol.org | RRID:SCR_000305 | Version 1.8.2 |
| Software, algorithm | Modeller | PMID: 10940251 | RRID:SCR_008395 | Version 9.16 |
| Software, algorithm | Amber | ambermd.org | RRID:SCR_014230 | Version 14 |
| Other | WH-15 | PMID: 21158426 | Fluorescent PIP2 analogue, soluble | |
| Other | XY-69 | PMID: 29263090 | Fluorescent PIP2 analogue, membrane-associated |
Additional files
-
Supplementary file 1
Crystallization statistics for PLC-γ1.
- https://cdn.elifesciences.org/articles/51700/elife-51700-supp1-v2.docx
-
Transparent reporting form
- https://cdn.elifesciences.org/articles/51700/elife-51700-transrepform-v2.pdf
Download links
A two-part list of links to download the article, or parts of the article, in various formats.
Downloads (link to download the article as PDF)
Open citations (links to open the citations from this article in various online reference manager services)
Cite this article (links to download the citations from this article in formats compatible with various reference manager tools)
Structural basis for the activation of PLC-γ isozymes by phosphorylation and cancer-associated mutations
eLife 8:e51700.
https://doi.org/10.7554/eLife.51700


