Coordination of humoral immune factors dictates compatibility between Schistosoma mansoni and Biomphalaria glabrata
- Beibu Gulf University, China
- University of Alberta, Canada
- Zhejiang University, China
Figures
Figure 1 with 1 supplement
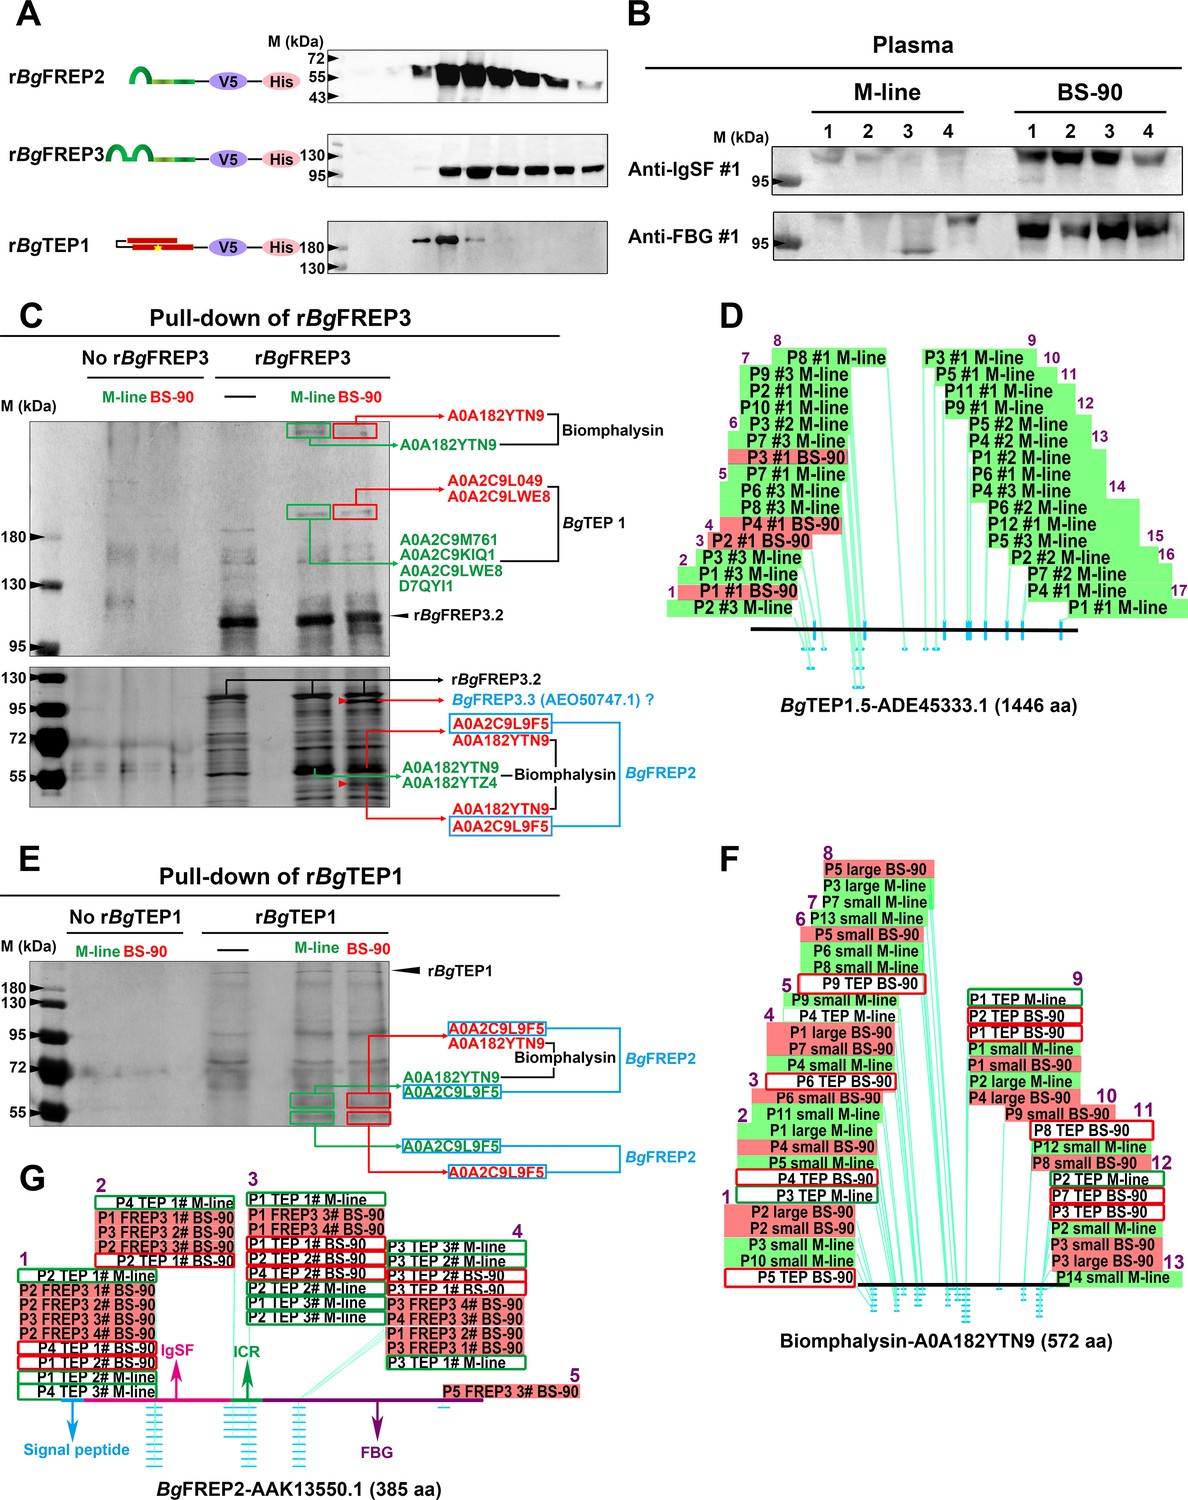
BgFREP3, which had special high abundance in BS-90 plasma, interacted with BgTEP1 and Biomphalysin derived from both M-line and BS-90 plasma, while uniquely associated with BgFREP2 and a BgFREP3 variant from BS-90 plasma.
(A) Schematic diagram and Western blot analysis of recombinant proteins, the ends of which are coupled to the tags V5 and ploy-His for protein immunoassay and purification operations. The yellow star in the schematic structure of rBgTEP1 represents the thioester motif. (B) The background expression of BgFREP3 in BS-90 snail plasma was significantly higher than that in M-line plasma. The haemolymph of four snails from each M-line and BS-90 strain was independently extracted, and haemocytes were removed by centrifugation to obtain plasma samples. After the plasma of each snail was quantified, the same amount of plasma was used for SDS-PAGE electrophoresis and Western blot analysis. Anti-IgSF #1 and anti-FBG #1 antibodies of BgFREP3 were used as primary antibodies. (C) The rBgFREP3 associated with BgTEP1 and Biomphalysin in both M-line and BS-90 plasma, but exclusively interacted with a BgFREP3 variant and BgFREP2 in BS-90 plasma. The eluent of rBgFREP3 pull-downs was collected and separated on 6% (upper panel) and 10% (lower panel) SDS-PAGE gels before silver staining. (E) The rBgTEP1 interacted with Biomphalysin and BgFREP2 in both M-line and BS-90 plasma. The eluent of pull-down experiments with rBgTEP1was separated on 10% SDS-PAGE gels. In the pull-down experiments with rBgFREP3 (C) and rBgTEP1 (E), cell-free plasma from M-line (green) or BS-90 (red) B. glabrata snails was incubated with Sf9 cell lysates expressing rBgFREP3 or concentrated medium containing rBgTEP1 together (interactome experiments, last two lanes) or alone (controls, first three lanes). Bands that differ between control and interactome experiments were cut, proteins submitted to tryptic digest and analyzed by LC-MS/MS for identification. In interactome experiments, bands that differ between M-line and BS-90 lanes were marked with red arrows. The results of mass spectrometry analysis are shown in the figure. Proteins (BgTEP1 and Biomphalysin) represented by black font interacted with rBgFREP3 in both M-line and BS-90 plasma. Proteins (BgFREP2 and BgFREP3.3) represented by blue font specially interacted with rBgFREP3 only in BS-90. (D, F and G) Distribution of peptides identified by LC-MS/MS on BgTEP1.5 (ADE45333.1), Biomphalysin (A0A182YTN9) and BgFREP2 (AAK13550.1). The text on the panels describes the peptides identified from different Pull-down experiments, and most peptides were identified multiple times. The text with the green background describes peptides identified from the plasma of M-line strain in the rBgFREP3 pull-down experiments, and corresponding the text with the red background represents the peptides from the plasma of BS-90 strain. Similarly, the text in the green frame box represents the peptides from the plasma of the M-line strain in the rBgTEP1 pull-down experiments, and corresponding the text in the red frame box represents the peptides from the plasma of the BS-90 strain. The horizontal lines in panels D, F and G represent the full-length amino acid sequences of BgTEP1.5, Biomphalysin and BgFREP2. The light blue dots and dashes indicate the location of the peptides. The purple Arabic numerals represent the number of identified peptide fragments that differ from each other.
-
Figure 1—source data 1
Nucleotide sequence for cloning rBgFREP3.
This sequence is derived from GenBank AY028461.1. There are differences in nucleotide sequence but the amino acids match 100%. The differences are due to codon-optimization for expression in insect Sf9 cells. GenBank annotations are used to locate the individual BgFREP3.2 domains: underline, signal peptide; gray shading, IgSF1 domain; double underline, small connecting region; gray shading plus frame, IgSF2 domain; wavy underline, ICR; bold underline, FBG domain; delete line, termination codon.
- https://cdn.elifesciences.org/articles/51708/elife-51708-fig1-data1-v2.docx
-
Figure 1—source data 2
The peptides identified by LC-MS/MS were distributed over the full-length BgTEP, but could not be used to distinguish which BgTEP variant was present.
Peptides identified by LC-MS/MS from rBgFREP3 pull-down experiments are highlighted in gray. The GenBank accession numbers of each entry are: BgTEP, ACL00841.1; BgTEP1.1, ADE45332.1; BgTEP1.2, ADE45339.1; BgTEP1.3, ADE45340.1; BgTEP1.4, ADE45341.1 and BgTEP1.5, ADE45333.1.
- https://cdn.elifesciences.org/articles/51708/elife-51708-fig1-data2-v2.docx
-
Figure 1—source data 3
The two Biomphalysin variants (UniProtKB/TrEMBL: A0A182YTN9 and A0A182YTZ4) identified by LC-MS/MS shared high sequence identities but were different from the previously published Biomphalysin (GenBank: AGG38744.1).
(A) Alignment analysis of AGG38744.1 and A0A182YTN9. (B) Alignment analysis of AGG38744.1 and A0A182YTZ4. (C) Multiple sequence alignment of AGG38744.1, A0A182YTN9 and A0A182YTZ4. The identified peptides in A, B and C are highlighted in gray. The yellow squares and red plus signs in A and B represent sites with differing amino acids. The red frame in A, B and C representing differences in peptide sequences that distinguish two Biomphalysin variants (A0A182YTN9 and A0A182YTZ4).
- https://cdn.elifesciences.org/articles/51708/elife-51708-fig1-data3-v2.docx
-
Figure 1—source data 4
The identified protein (UniProtKB/TrEMBL: A0A2C9L9F5) represented a variant of BgFREP2 members that was distinct from other BgFREP members, but was indistinguishable from other BgFREP2 variants.
(A) The amino acid sequence information of protein A0A2C9L9F5 derived from the B. glabrata proteome database (Genome Accession: GCA_000457365). Peptides identified by LC-MS/MS are highlighted in gray. (B) Alignment of multiple BgFREP amino acid sequences and distribution of identified peptides. Peptides identified by LC-MS/MS are highlighted in gray. The GenBank accession numbers of each entry are: BgMFREP1 partial, AAK13549; BgMFREP2 precursor, AAK13550; BgFREP3-2 precursor, AAK28656; BgMFREP4 precursor, AAK13551; BgMFREP5 partial, AAK13546; BgMFREP6 partial, AAK13552; BgFREP7.1 precursor, AAK28657; BgMFREP8 partial, AAK13553; BgMFREP9 partial, AAK13554; BgMFREP10 partial, AAK13555; BgMFREP11 partial, AAK13556; BgFREP12.1 precursor, AAO59918; BgFREP12-FBG2, AAT58639; BgFREP13.1 precursor, AAO59922 and BgFREP14, ABO61860. (C) Blast analysis of protein A0A2C9L9F5 in NCBI database. The top 30 proteins with the highest scores are listed. (D) Multiple sequence alignment of 30 BgFREP2 family proteins listed in C. Peptides identified by LC-MS/MS are highlighted in gray.
- https://cdn.elifesciences.org/articles/51708/elife-51708-fig1-data4-v2.docx
-
Figure 1—source data 5
Alignment of multiple BgFREP3 amino acid sequences and distribution of identified peptides.
Peptides identified by LC-MS/MS are highlighted in gray, the overlapping region of peptides are bold underline. GenBank annotations of BgFREP3.2 (AAK28656.1) are used for locate the individual BgFREP3 domains: orange, signal peptide; green, IgSF1 domain; blue, small connecting region; pink, IgSF2 domain; black, ICR; red, FBG domain.
- https://cdn.elifesciences.org/articles/51708/elife-51708-fig1-data5-v2.docx
Figure 1—figure supplement 1

Normalized transcript abundance of BgTEP1 in unchallenged M-line (black bar, n = 5) and BS-90 (gray bar, n = 5) snails indicating a lack of significant difference (p>0.05) between the two strains.
Figure 2 with 1 supplement
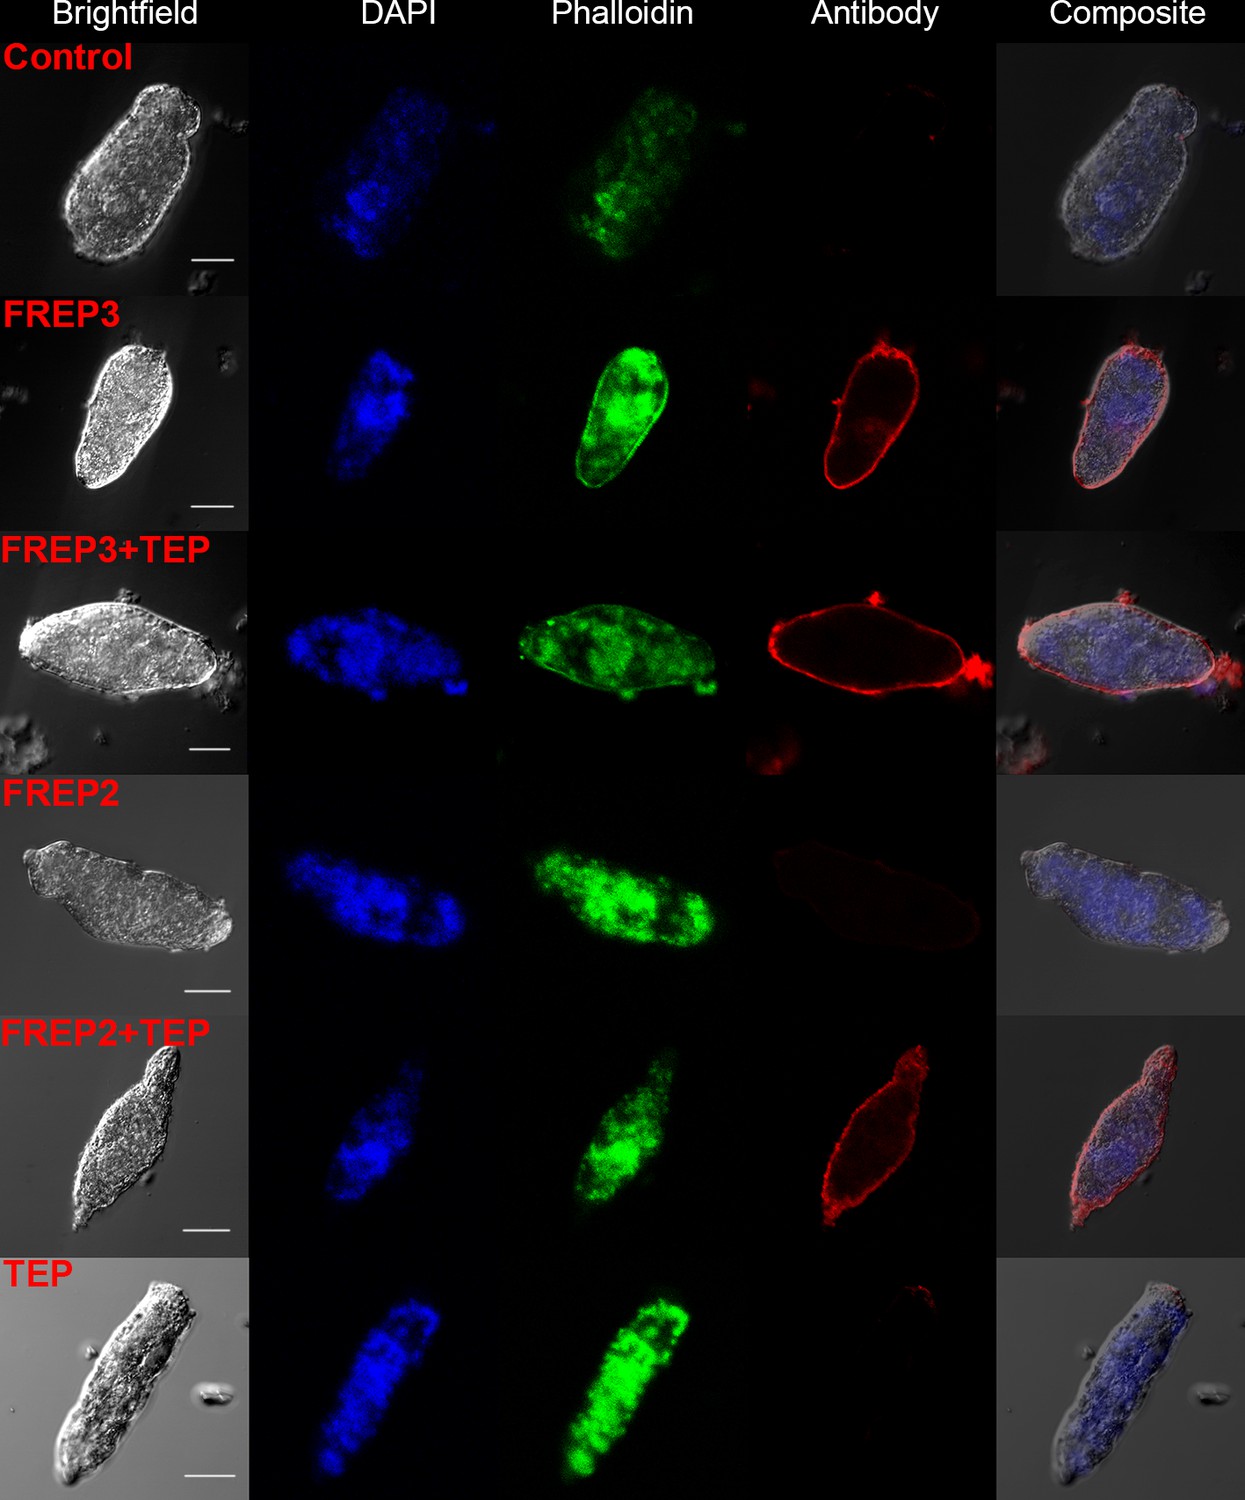
A combination of rBgFREP2 + rBgTEP1, and rBgFREP3 in the presence and absence of rBgTEP1, are capable of binding to the surface of S. mansoni sporocysts.
Fixed sporocysts were incubated with a vehicle control or recombinant proteins (rBgFREP3, rBgFREP2, and rBgTEP1 alone) and combinations of rBgFREP2+rBgTEP1 or rBgFREP3+rBgTEP, followed by immunostaining with anti-V5 primary IgG and Alexa Fluor 633 goat anti-mouse secondary antibody. White bar in the bright field column represents 25 μm.
Figure 2—figure supplement 1
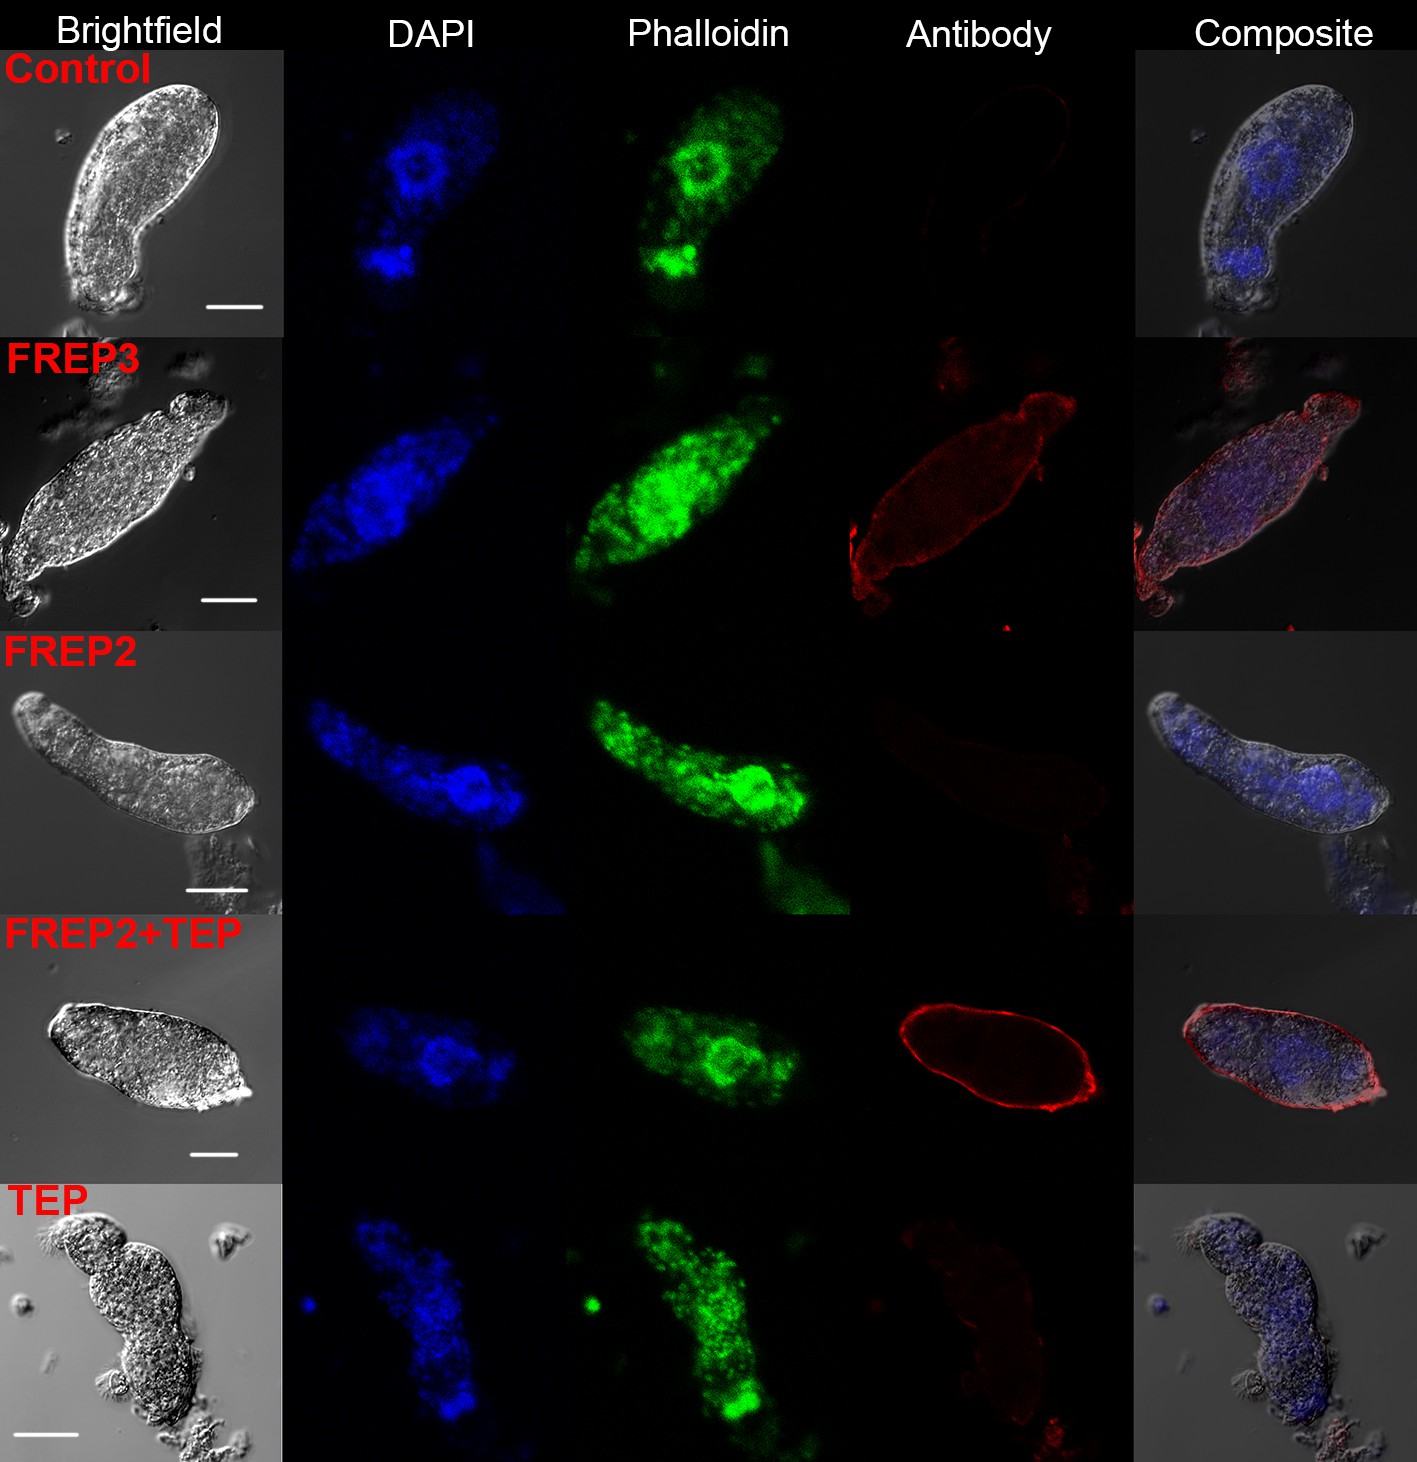
Recombinant proteins rBgFREP3, rBgFREP2 and rBgTEP1 bound to the outer tegument of live S. mansoni sporocysts.
Live sporocysts were incubated with vehicle (control) or recombinant proteins (rBgFREP3, rBgFREP2, and rBgTEP1 alone) and combination (rBgFREP2+ rBgTEP1) and immunostained using anti-V5 primary IgG and Alexa Fluor 633 goat anti-mouse secondary antibody. White bar in the bright field column represents 25 μm.
Figure 3
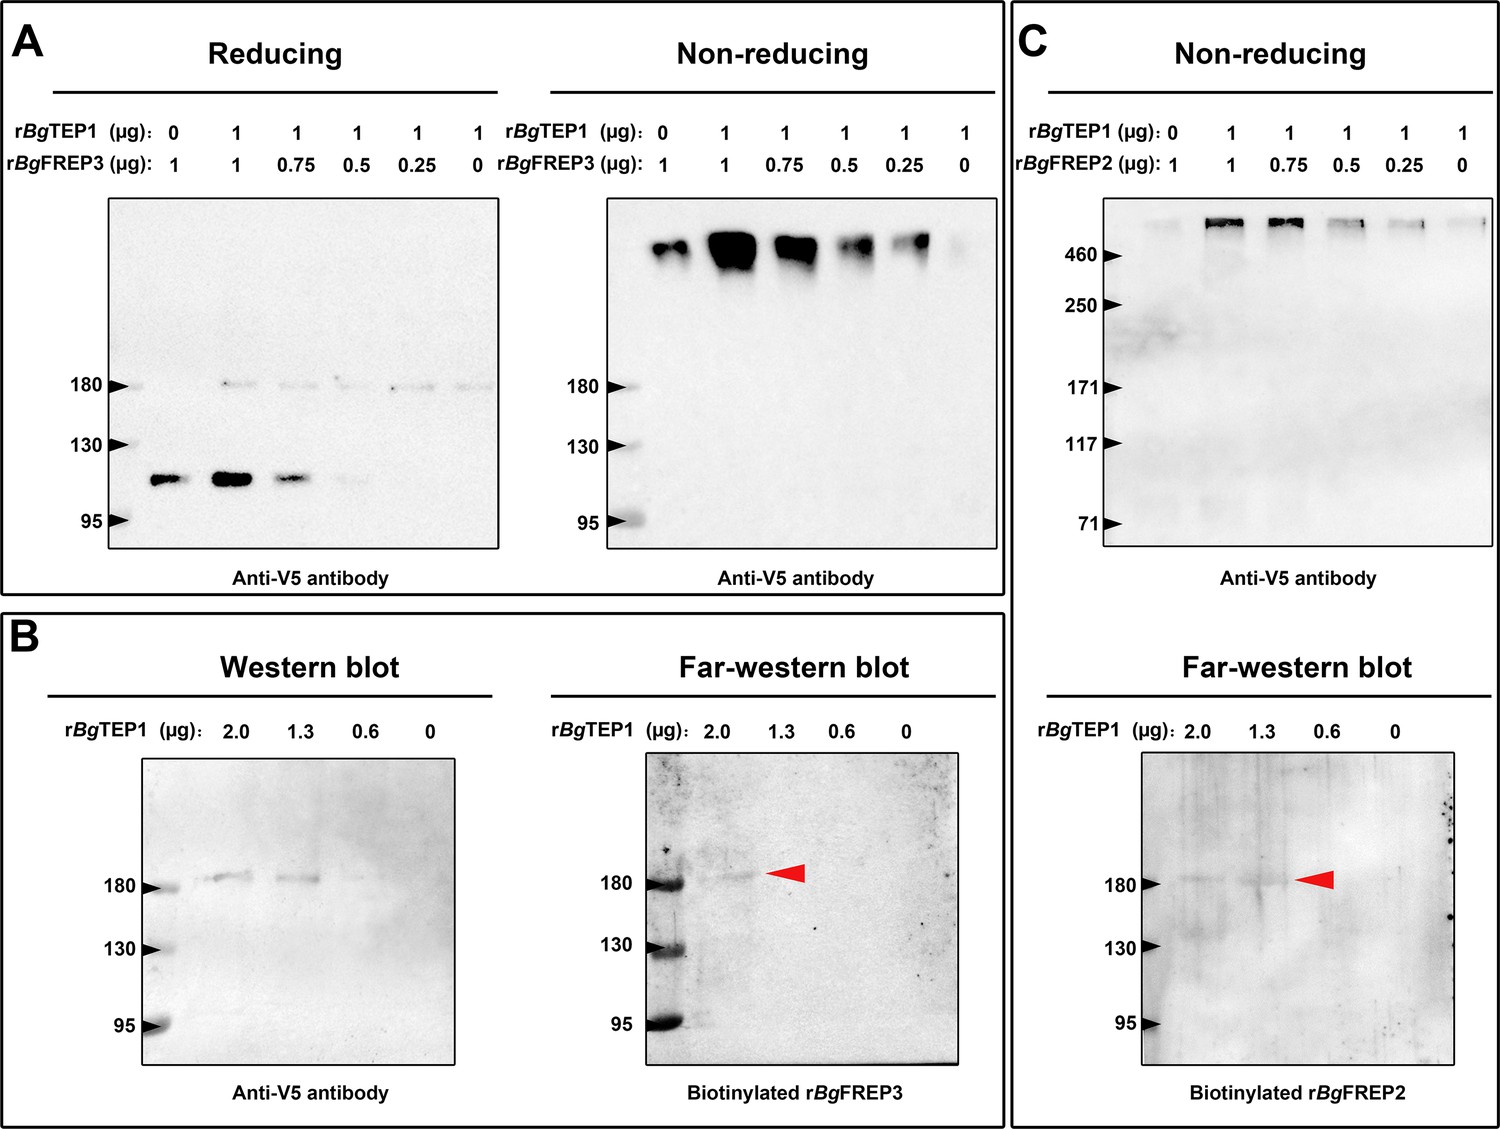
Both rBgFREP3 and rBgFREP2 interacted with rBgTEP1 to form complexes.
(A) Purified rBgTEP1 was incubated with rBgFREP3 in the indicated ratios (wt/wt in µg) for 2 hr at room temperature. After the incubation, Western blot analysis was carried out under denaturing (heating with reducing agent, the right) and non-denaturing (no heating, no reducing agent, the left) conditions, respectively. (B) Decreasing amounts of rBgTEP1 were blotted onto the membrane and then subjected to standard Western blot (the left) and far-Western blot (the right) analysis. (C) The interaction between rBgFREP2 and rBgTEP1. Western blot analysis under non-denaturing (the upper) and far-Western blot analysis (the below) was carried out, respectively. In the far-Western blot, the biotinylated rBgFREP3 and rBgFREP2 acts as a primary antibody and the secondary antibody is a streptavidin-HRP; the red arrow indicates the band that symbolizes the interaction between BgTEP1 and rBgFREP3 or rBgFREP2.
Figure 4 with 1 supplement
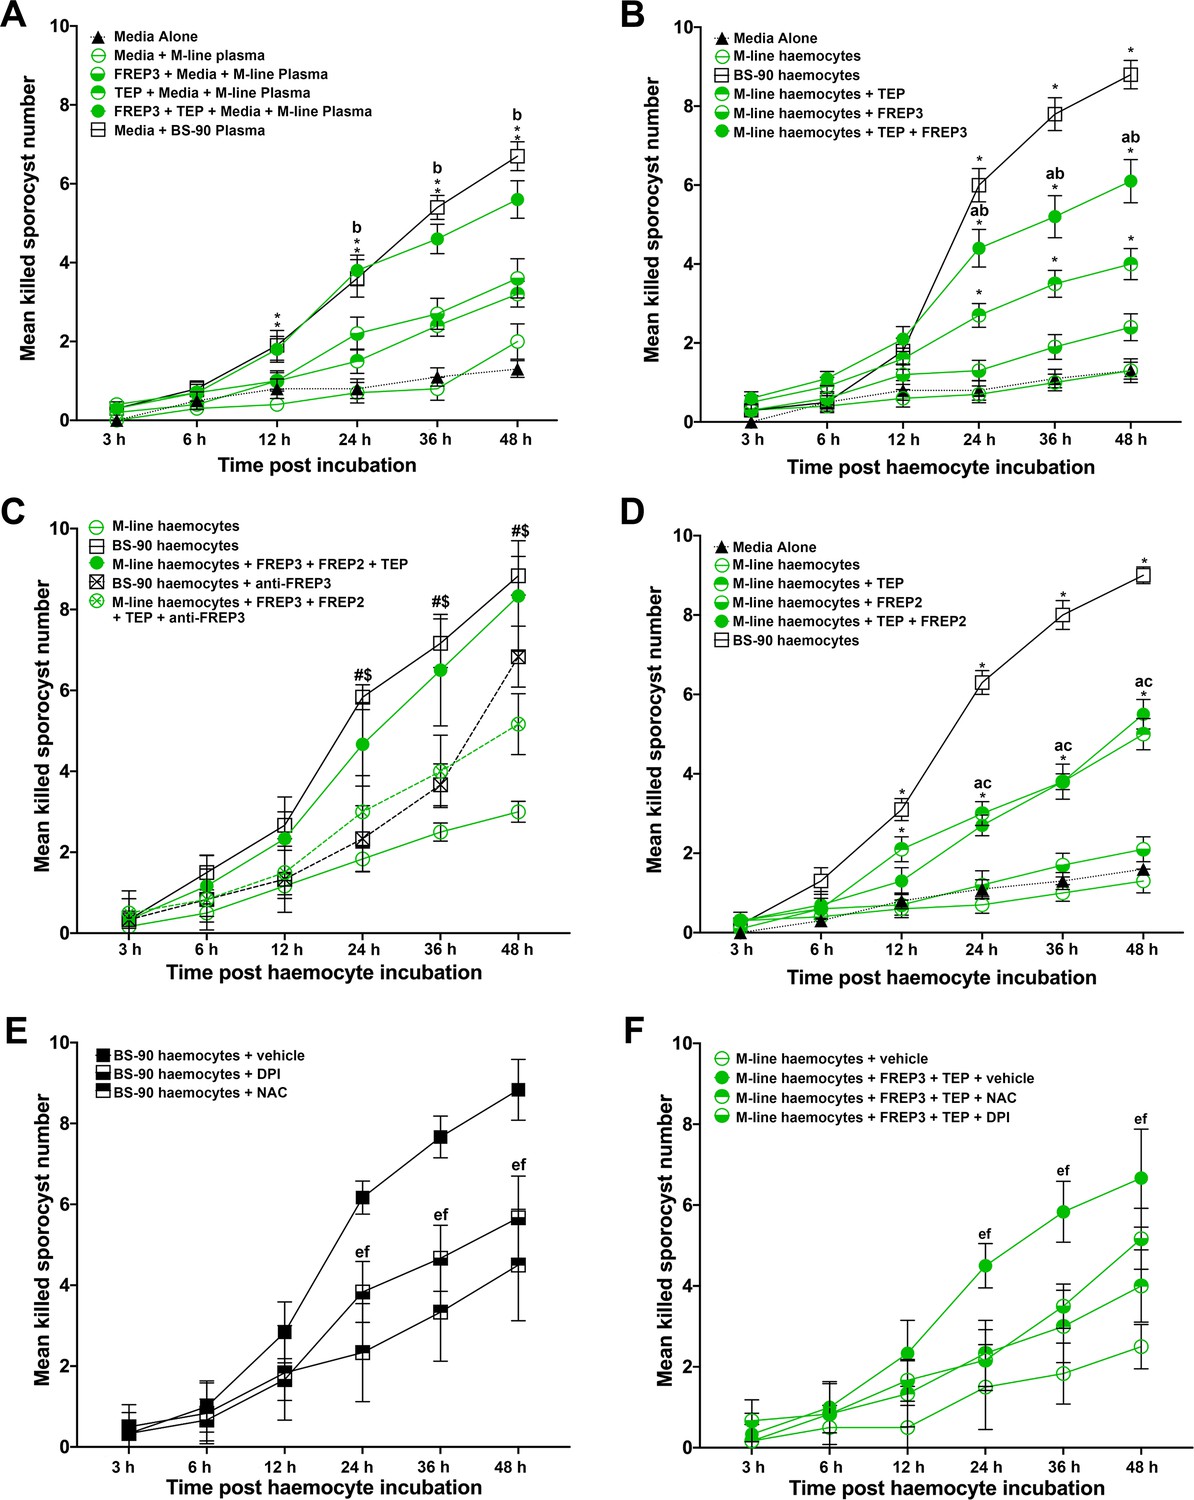
Association of rBgFREP3, rBgTEP1 and rBgFREP2 increased the ability of M-line snails to kill S. mansoni sporocysts.
Effects of rBgFREP3, rBgTEP1 and rBgFREP3-rBgTEP1 complex on killing of S. mansoni sporocysts by M-line plasma (A) and haemocytes (B). (C) Before being exposed to sporocysts, M-line haemocytes were pre-incubated with rBgFREP3-rBgTEP1-rBgFREP2 combination in presence or in absence of anti- BgFREP3 antibodies (abrogation treatment). BS-90 haemocytes were incubated with anti-BgFREP3 antibodies. (D) The effect of rBgFREP2, rBgTEP1 and rBgFREP2-rBgTEP1 complex on the destruction of sporocysts by M-line haemocytes. (E and F) The role of ROS in killing of S. mansoni sporocysts by haemocytes from B. glabrata snails. (E) The addition of ROS inhibitors NAC and DPI abolished the ability of BS-90 haemocytes to destroy sporocysts. (F) Killing sporocysts of M-line haemocytes rendered by rBgFREP3-rBgTEP1 complex was annulled by pre-incubation with ROS inhibitors NAC and DPI. Statistically significant difference symbols in A, B and D: asterisk (*) represents comparison with M-line haemocytes or plasma, *p<0.05, **p<0.01; a represents comparison with BS-90 haemocytes or plasma, p<0.05; b represents comparison with both single treatment (rBgTEP1/rBgFREP3 or rBgFREP2), p<0.05; c represents comparison with only BgFREPs treatment, p<0.05; bars represent SEM, n = 10. Statistically significant difference symbols in C: # represents comparison BS-90 haemocytes with BS-90 haemocytes+anti-rBgFREP3 antibodies, p<0.05; $ represents comparison M-line haemocytes+rBgFREP3+rBgFREP2+rBgTEP1 with M-line haemocytes+rBgFREP3+rBgFREP2+rBgTEP1+anti-rBgFREP3 antibodies, p<0.05; bars represent SEM, n = 10. Statistically significant difference symbols in E and F e represents comparison NAC treatment with BS-90 haemocytes or M-line haemocytes+rBgFREP3+rBgTEP1, p<0.05; f represents comparison DPI treatment with BS-90 haemocytes or M-line haemocytes+rBgFREP3+rBgTEP1, p<0.05; bars represent SEM, n = 6.
-
Figure 4—source data 1
S. mansoni sprorcyst killing assay raw data.
- https://cdn.elifesciences.org/articles/51708/elife-51708-fig4-data1-v2.xls
Figure 4—figure supplement 1
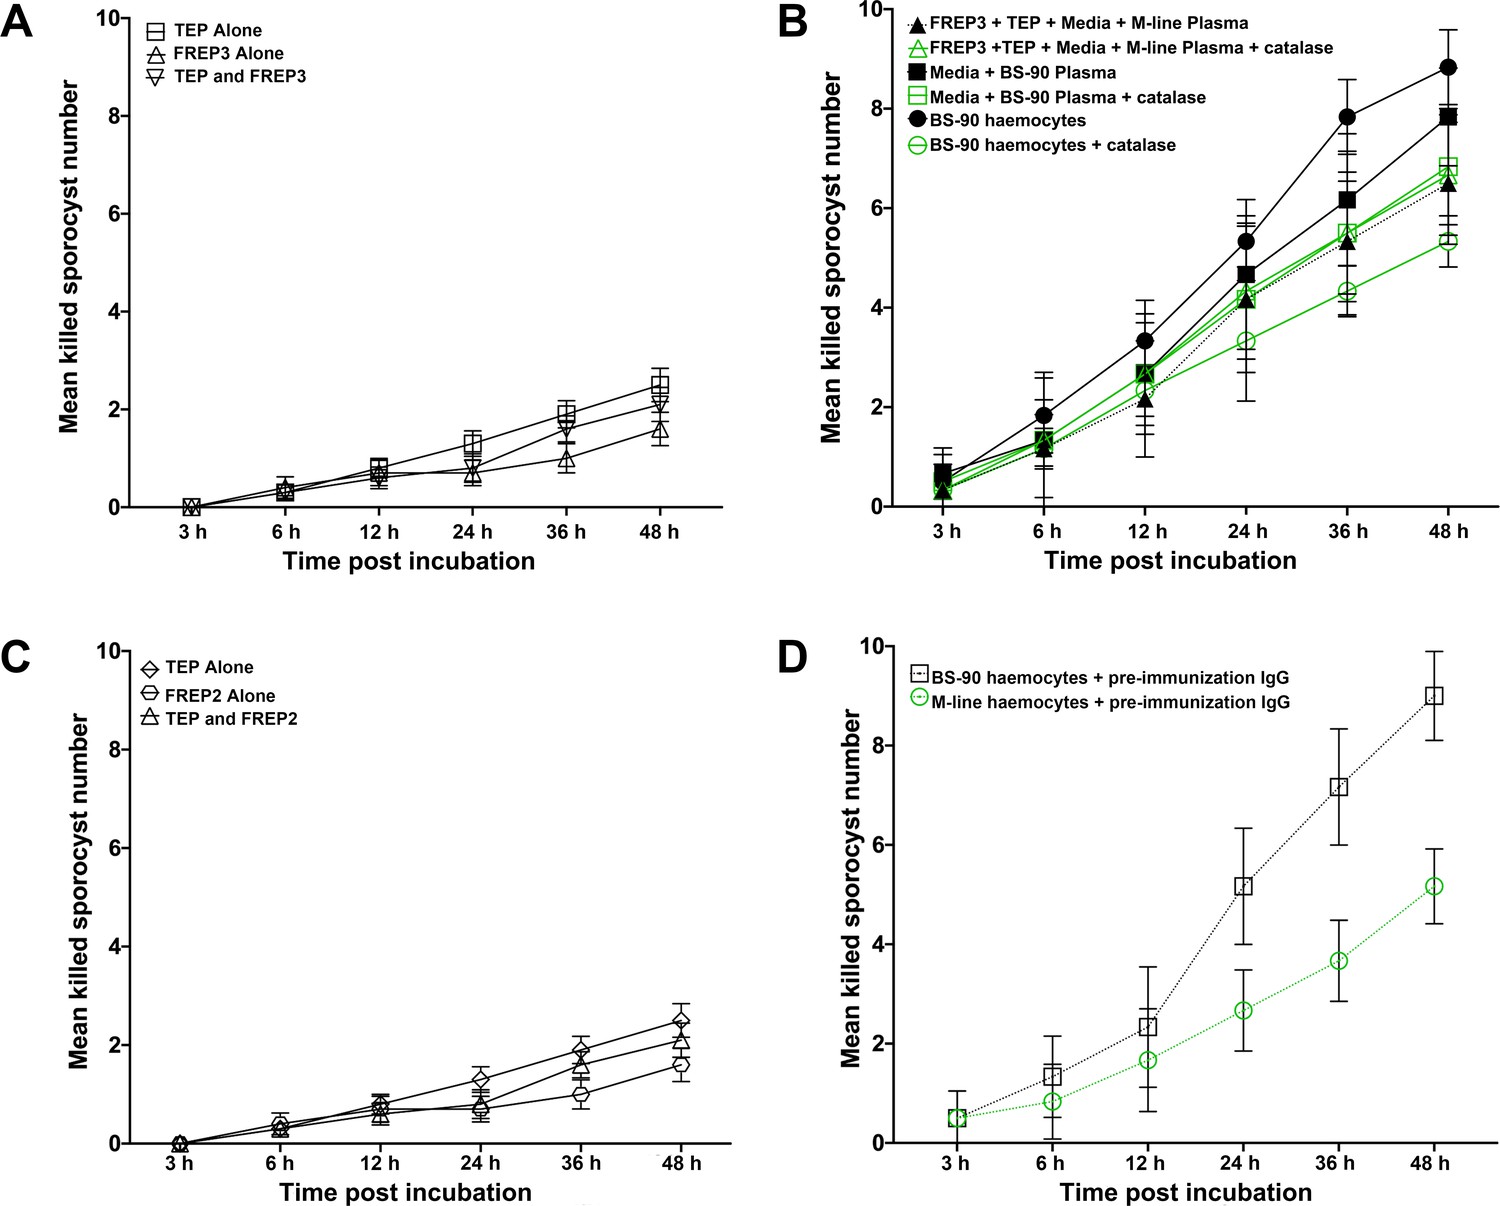
Controls of in vitro S. mansoni sporocyst killing assays.
(A) Only the media and recombinant proteins rBgFREP3 and rBgTEP1 were present, without snail plasma or haemocytes, to control the sporocyst killing assay of rBgFREP3, rBgTEP1 and the combination of both. (B) BS-90 plasma and M-line plasma containing rBgFREP3 and rBgTEP did not significantly reduce their ability to kill sporocysts due to the addition of catalase (a ROS scavenger). However, catalase reduced the sporocyst killing capacity of BS-90 haemocytes. (C) The controls of the sporocyst killing assay of rBgFREP2, rBgTEP1 and rBgFREP2-rBgTEP1 complex. (D) Pre-immune serum from the same rabbit which raised the anti-rBgFREP3 antibodies were incubated with BS-90 and M-line haemocytes for control.
Figure 5
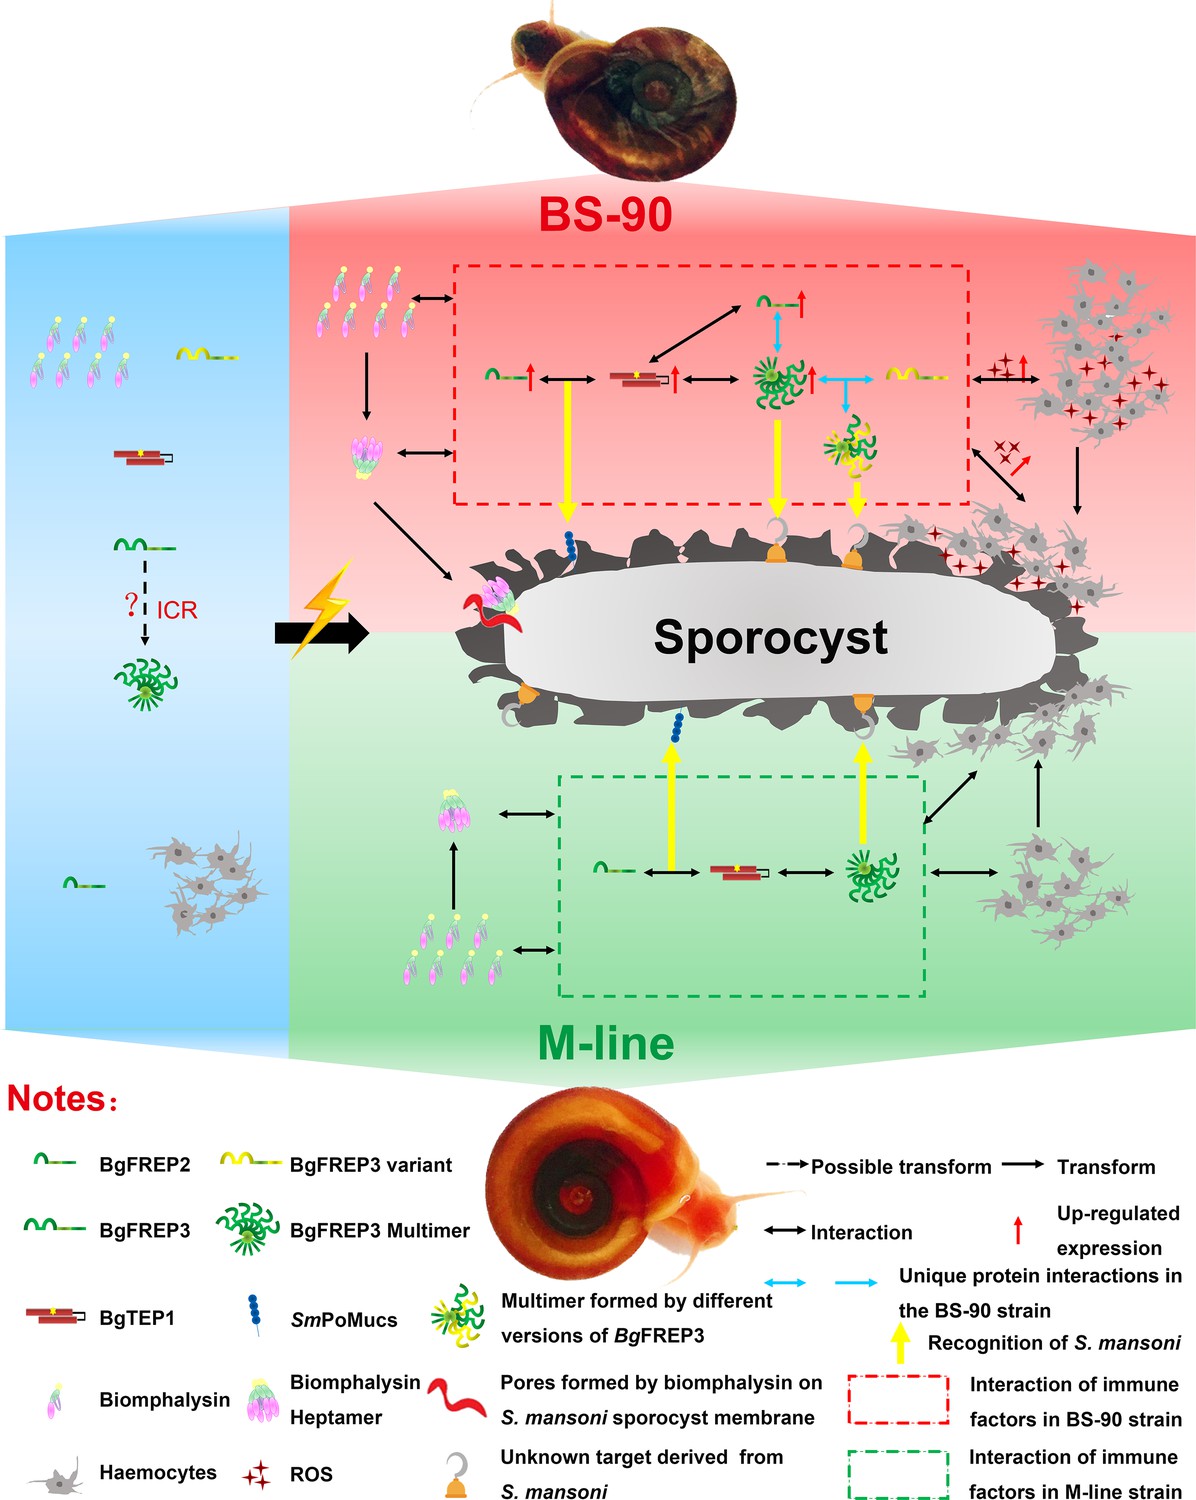
Interaction of BgFREP3, BgFREP2, BgTEP1 and Biomphalysin in B. glabrata snail haemolymph and possible functional mechanisms against S. mansoni infection.
This figure is a schematic drawing based on the results of previous studies and our work. In the absence of S. mansoni invasion (blue background area), both M-line and BS-90 B. glabrata snail hemolymphs contain BgFREPs, BgTEP1 and Biomphalysin and other immune factors. Upon S. mansoni infection, BS-90 strain (red background area) and M-line (green background area) strains demonstrate different protein interaction repertoires (red dotted frame in BS-90, green dotted frame in M-line). According to our pull-down results, BgFREP3 in BS-90 plasma specifically interacts with BgFREP2 and other versions of BgFREP3 (blue horizontal one-way or two-way arrows). In addition, compared with the M-line strain, the BS-90 strain has more haemocytes (immune effector cells) in the snail haemolymph, and BgFREP3, BgFREP2, and BgTEP1 are all up-regulated (red upward arrow). The more complex interactome of immune factors in BS-90 plasma results in higher levels of ROS (with cytotoxic activity) secreted by haemocytes. In conclusion, different coordination of humoral immune factors between BS-90 and M-line strains aids in dictating compatibility to S. mansoni infection.
Additional files
-
Supplementary file 1
Primer list for cloning and quantitative RT-PCR.
- https://cdn.elifesciences.org/articles/51708/elife-51708-supp1-v2.docx
-
Supplementary file 2
The identified peptides of BgTEP1, Biomphalysin, BgFREP2 and BgFREP3.3 by LC-MS/MS.
- https://cdn.elifesciences.org/articles/51708/elife-51708-supp2-v2.docx
-
Transparent reporting form
- https://cdn.elifesciences.org/articles/51708/elife-51708-transrepform-v2.docx
Download links
A two-part list of links to download the article, or parts of the article, in various formats.
Downloads (link to download the article as PDF)
Open citations (links to open the citations from this article in various online reference manager services)
Cite this article (links to download the citations from this article in formats compatible with various reference manager tools)
Coordination of humoral immune factors dictates compatibility between Schistosoma mansoni and Biomphalaria glabrata
eLife 9:e51708.
https://doi.org/10.7554/eLife.51708


