Independent evolution of ancestral and novel defenses in a genus of toxic plants (Erysimum, Brassicaceae)
- Institute of Plant Sciences, University of Bern, Switzerland
- Boyce Thompson Institute, United States
- Division of Biological Sciences, University of Missouri, United States
- Institut für Insektenbiotechnologie, Justus-Liebig-Universität Giessen, Germany
- Department of Functional and Evolutionary Ecology, Estación Experimental de Zonas Áridas (EEZA-CSIC), Spain
- Research Unit Modeling Nature, Department of Genetics, University of Granada, Spain
- Department of Chemical Ecology, Bielefeld University, Germany
Figures
Figure 1
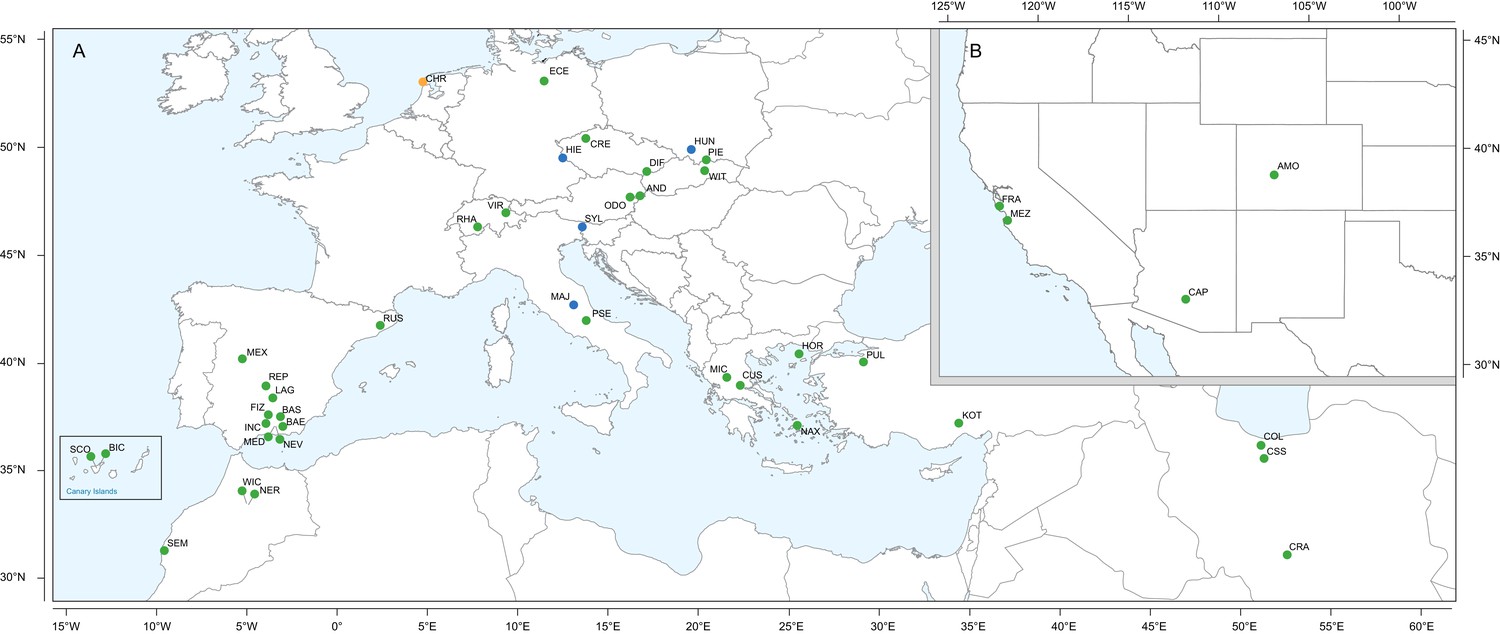
Geographic location of Erysimum species source populations used for transcriptome sequencing.
(A) Source populations in Europe. Inset: The Canary Islands (28°N, 16°W) are located further westward and southward than drawn in this map. Green symbols are exact collection locations, while blue symbols indicate approximate locations based on species distributions. Seeds of the originally Mediterranean species E. cheiri (CHR, orange symbol) were collected from a naturalized population in the Netherlands. (B) Source populations in North America. Five species/accessions (ALI, ER1, ER2, ER3, ER4) could not be placed on the map due to uncertain species identity. See Supplementary file 1 for more details.
Figure 2 with 5 supplements

Visualization of the E.cheiranthoides genome assembly.
(A) Circos plot of the E. cheiranthoides genome with gene densities (outer circle) and repeat densities (inner circle) shown as histogram tracks. Densities are calculated as percentages for 1 Mb windows. (B) Synteny plot of E. cheiranthoides and A. thaliana. Lines between chromosomes connect aligned sequences between the two genomes.
Figure 2—figure supplement 1
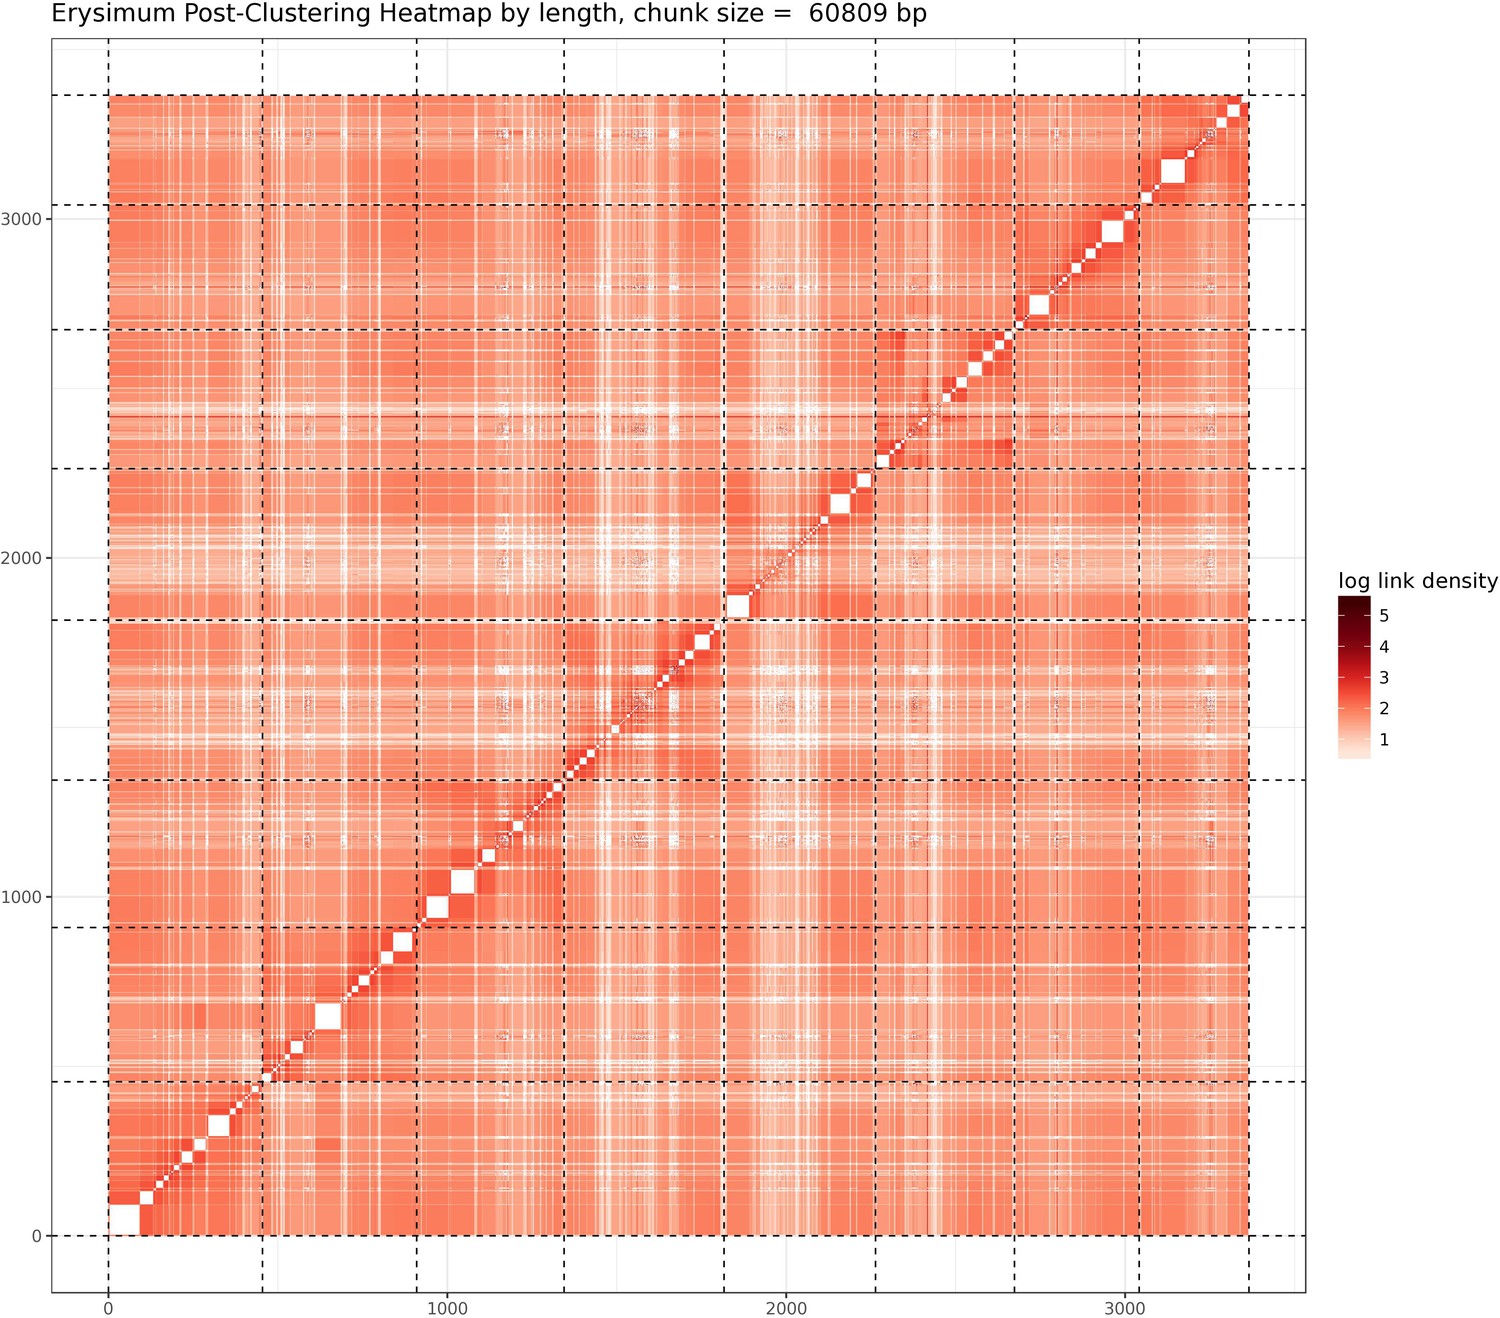
Post-clustering heatmap showing the density of Hi-C interactions between scaffolds used in the assembly.
Intensity corresponds to the total number of reads per interaction. Dashed lines delimit the eight identified pseudomolecules.
Figure 2—figure supplement 2
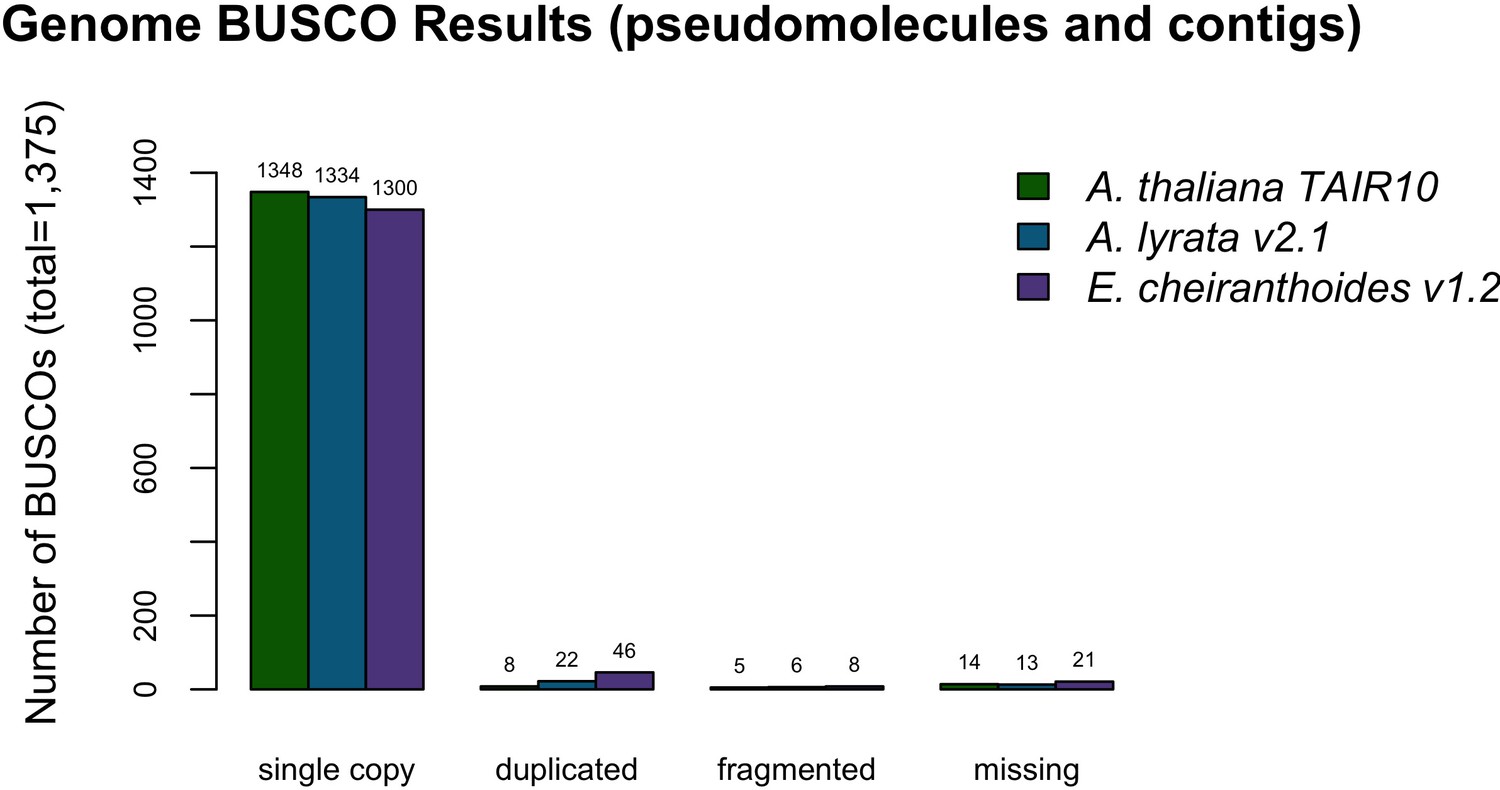
BUSCO completeness assessment for the EC1.2 genome assembly.
A. thaliana and A. lyrata results are provided for comparison to the EC1.2 genome assembly.
Figure 2—figure supplement 3

BUSCO completeness assessment for the EC1.2 genome annotation.
A. thaliana and A. lyrata results are provided for comparison to the EC1.2 genome annotation.
Figure 2—figure supplement 4
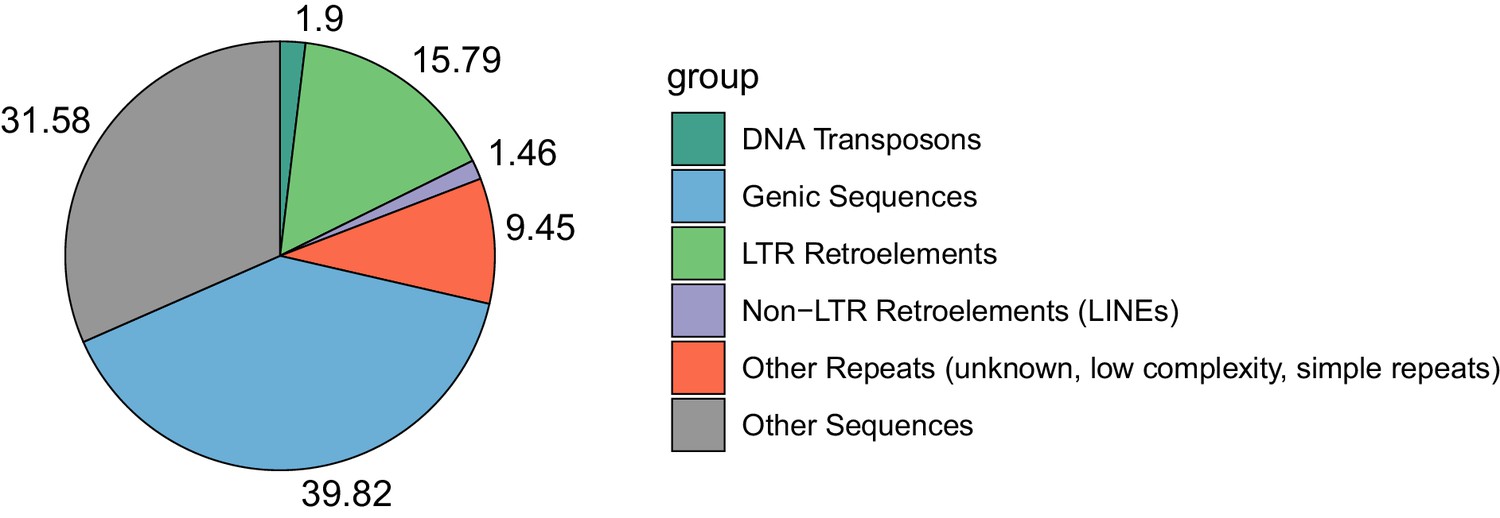
Proportional contributions of sequence classes to the genome sequence of E. cheiranthoides.
Figure 2—figure supplement 5
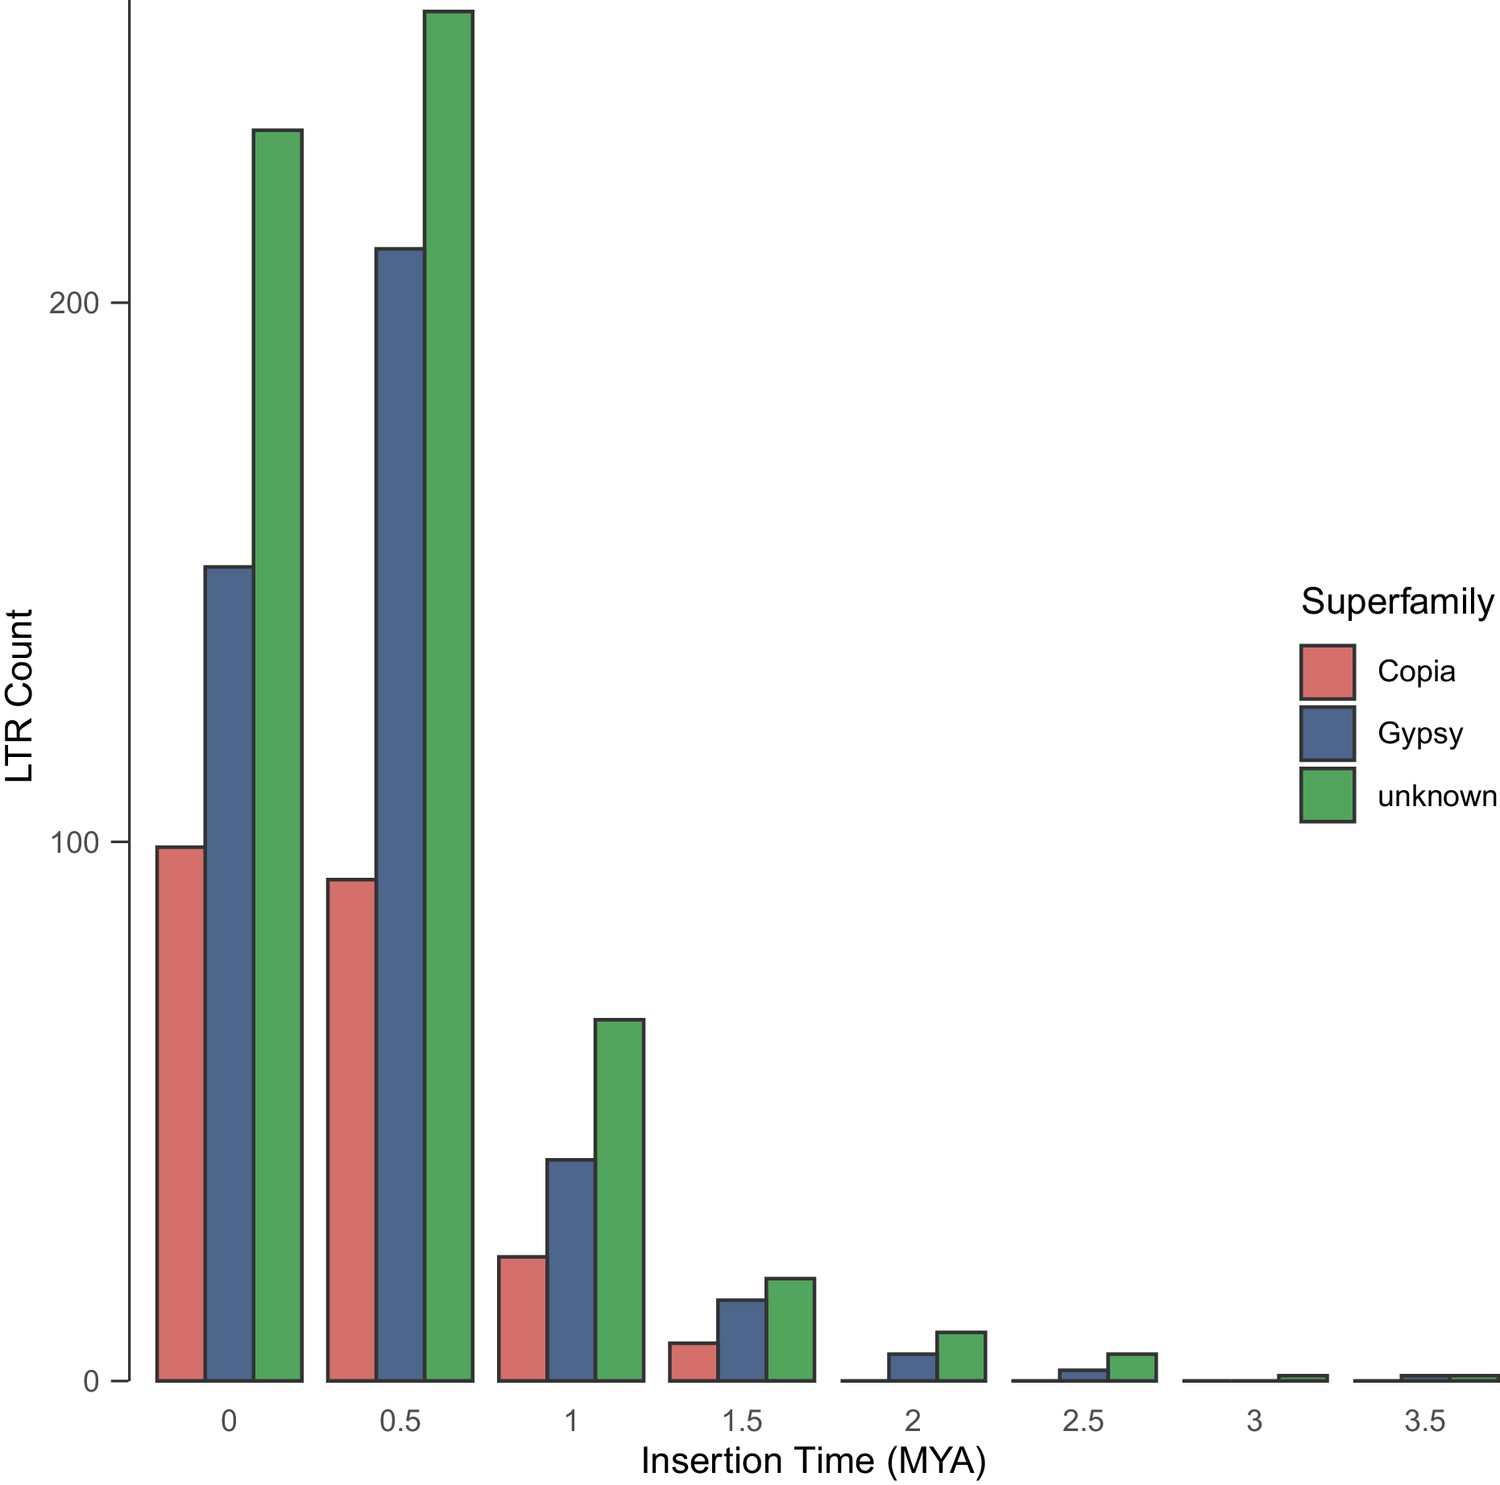
Age distributions of intact LTR-RTs identified by LTR_retriever in the genome of E. cheiranthoides.
Figure 3 with 7 supplements
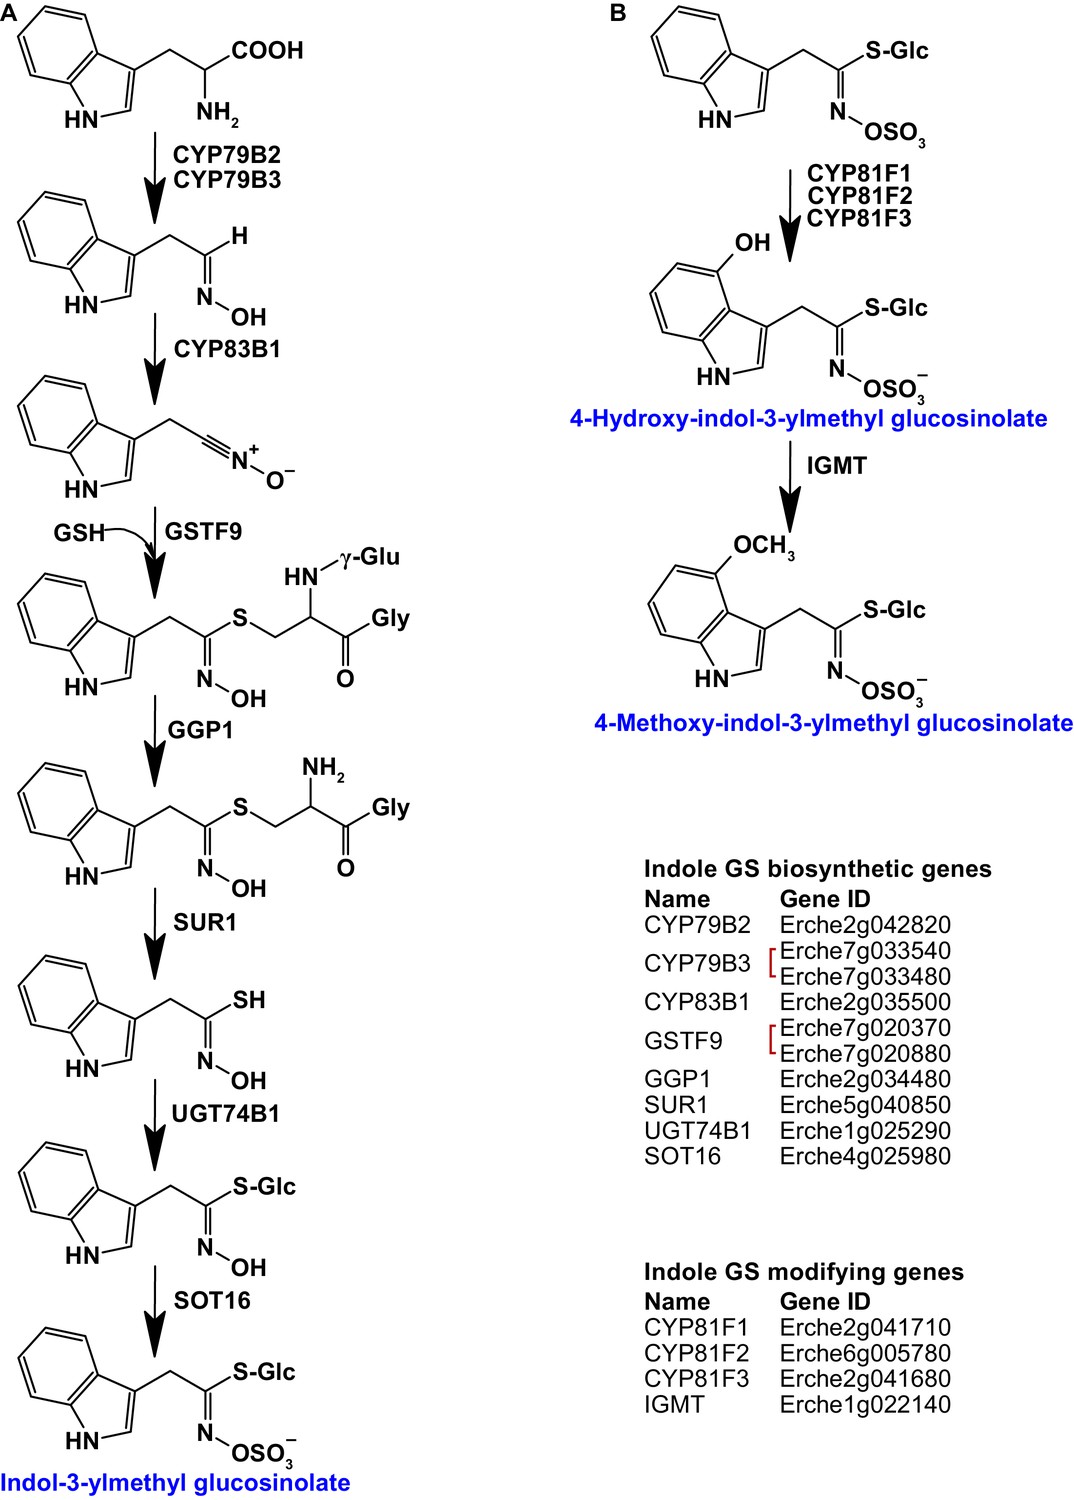
Identification of known indole glucosinolate biosynthetic genes and glucosinolate-modifying genes from Arabidopsis in Erysimum cheiranthoides.
(A) Starting with tryptophan, indole glucosinolates are synthesized using some enzymes that also function in aliphatic glucosinolate biosynthesis (GGP1; SUR1; UGT74B1) while also using indole glucosinolate-specific enzymes. (B) Indole glucosinolates can be modified by hydroxylation and subsequent methylation. Red square brackets indicate where gene copy numbers differ between Arabidopsis and E. cheiranthoides. Glucosinolates with names highlighted in blue were identified in Erysimum cheiranthoides var. Elbtalaue. Abbreviations: cytochrome P450 monooxygenase (CYP); glutathione S-transferase F (GSTF); glutathione (GSH); γ-glutamyl peptidase 1 (GGP1); SUPERROOT 1 C-S lyase (SUR1); UDP-dependent glycosyltransferase (UGT); sulfotransferase (SOT); glucosinolate (GS); indole glucosinolate methyltransferase (IGMT).
Figure 3—figure supplement 1
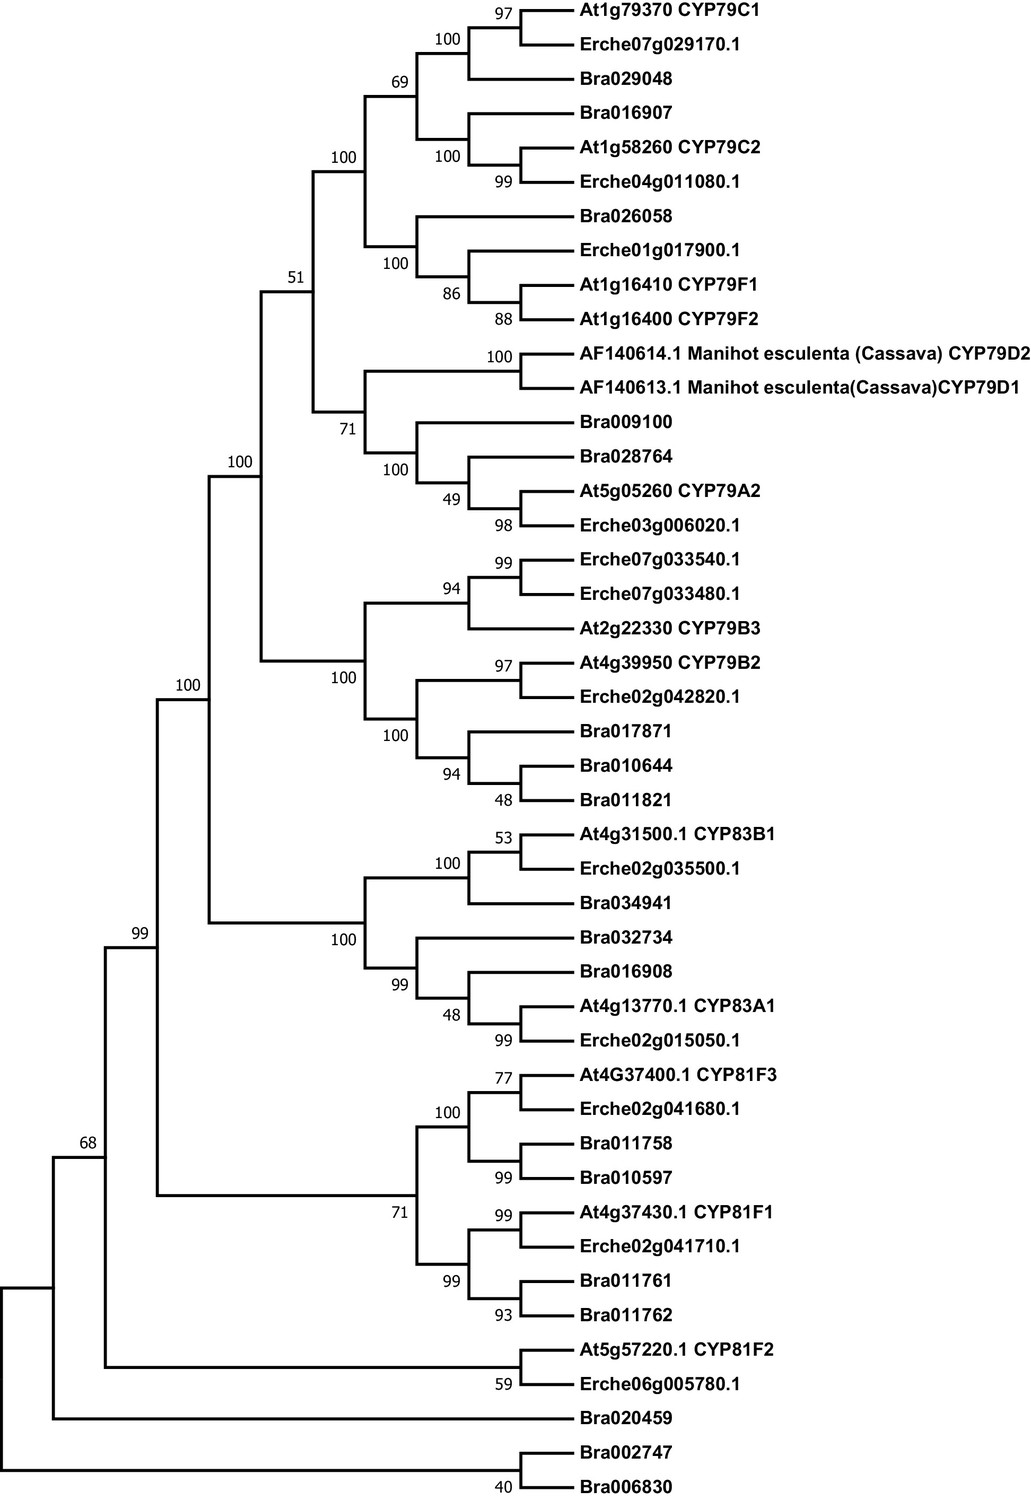
Phylogeny of cytochrome P450 monooxygenase (CYP) genes from E. cheiranthoides, A. thaliana, and B. oleracea.
The tree was generated using the Hasegawa-Kishino-Yano model with evolutionary rates modelled by Gamma distribution with invariant sites with five rate categories.
Figure 3—figure supplement 2
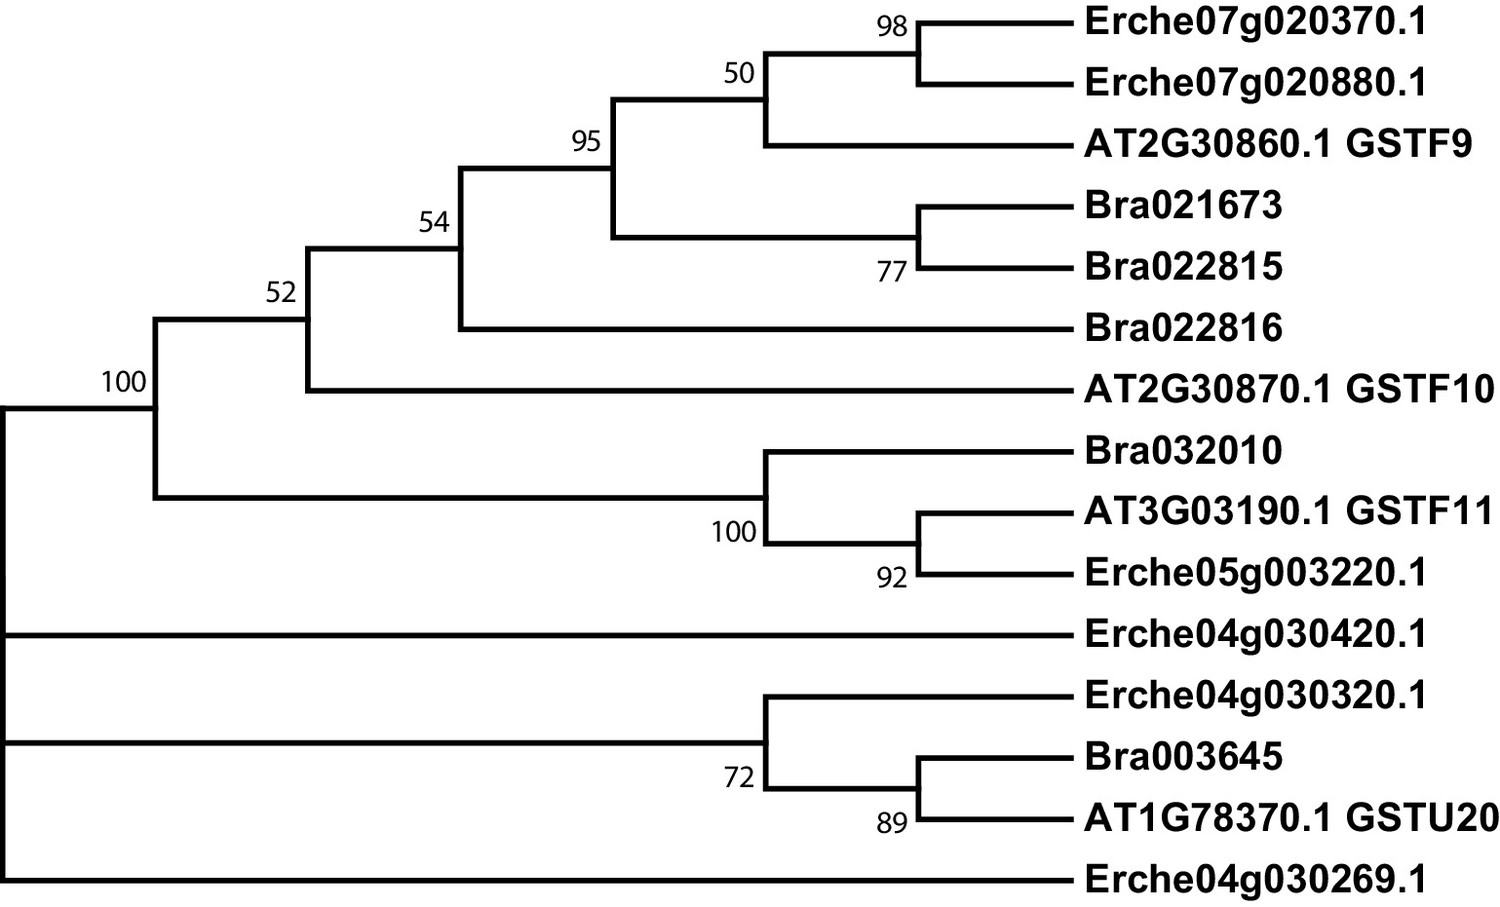
Phylogeny of glutathione S-transferase F (GSTF) and glutathione S-transferase Tau (GSTU) genes from E. cheiranthoides, A. thaliana, and B. oleracea.
The tree was generated using the Kimura 2-parameter model with evolutionary rates modelled by Gamma distribution with five rate categories.
Figure 3—figure supplement 3
Phylogeny of γ-glutamyl peptidase 1 (GGP1) genes from E. cheiranthoides, A. thaliana, and B. oleracea.
The tree was generated using the Kimura 2-parameter model with invariant sites.
Figure 3—figure supplement 4
Phylogeny of SUPERROOT 1 C-S lyase (SUR1) genes from E. cheiranthoides, A. thaliana, and B. oleracea.
The tree was generated using the Kimura 2-parameter model with invariant sites.
Figure 3—figure supplement 5
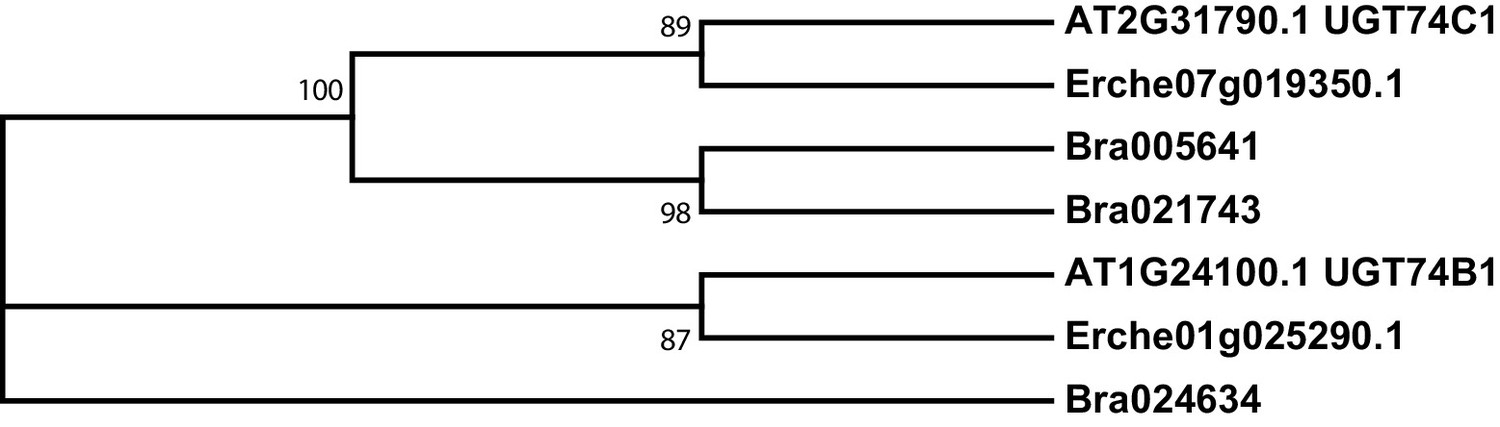
Phylogeny of UDP-dependent glycosyltransferase (UGT) genes from E. cheiranthoides, A. thaliana, and B. oleracea.
The tree was generated using the Tamura 3-parameter model with evolutionary rates modelled by Gamma distribution with five rate categories.
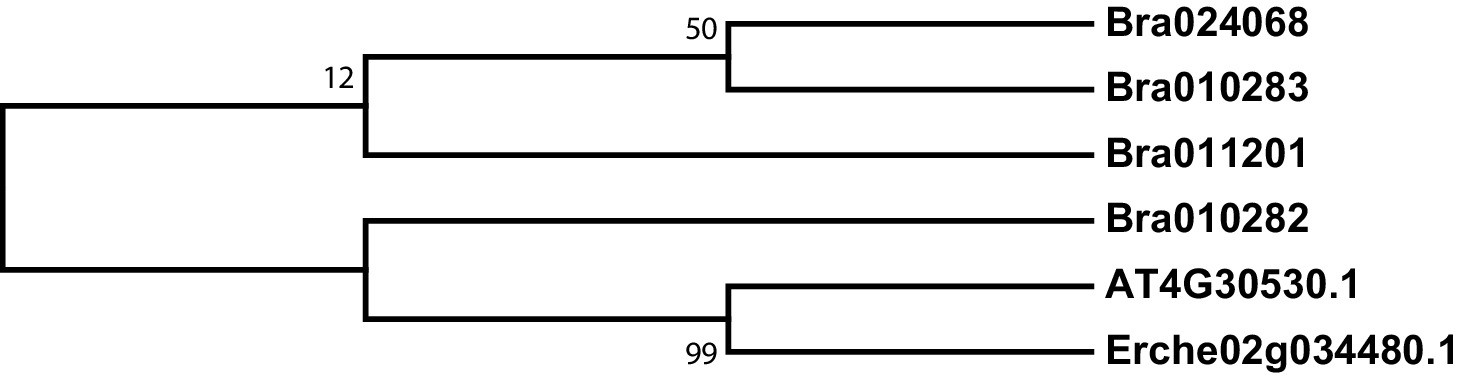
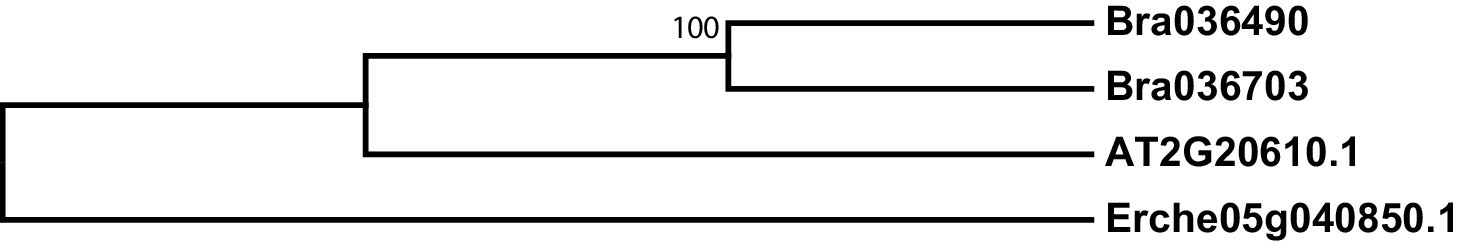
Figure 3—figure supplement 6
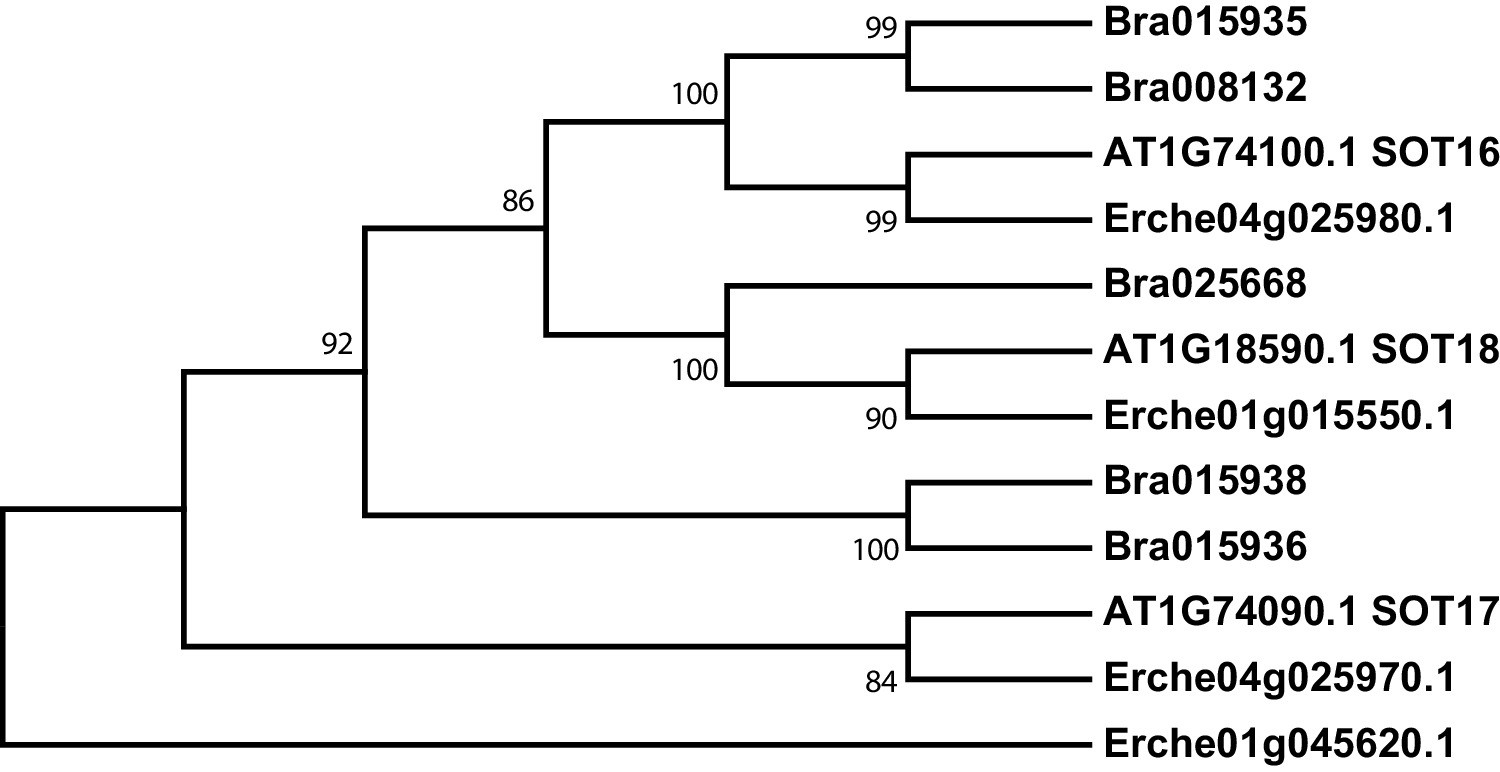
Phylogeny of sulfotransferase (SOT) genes from E. cheiranthoides, A. thaliana, and B. oleracea.
The tree was generated using the Kimura 2-parameter model with evolutionary rates modelled by Gamma distribution with five rate categories.
Figure 3—figure supplement 7
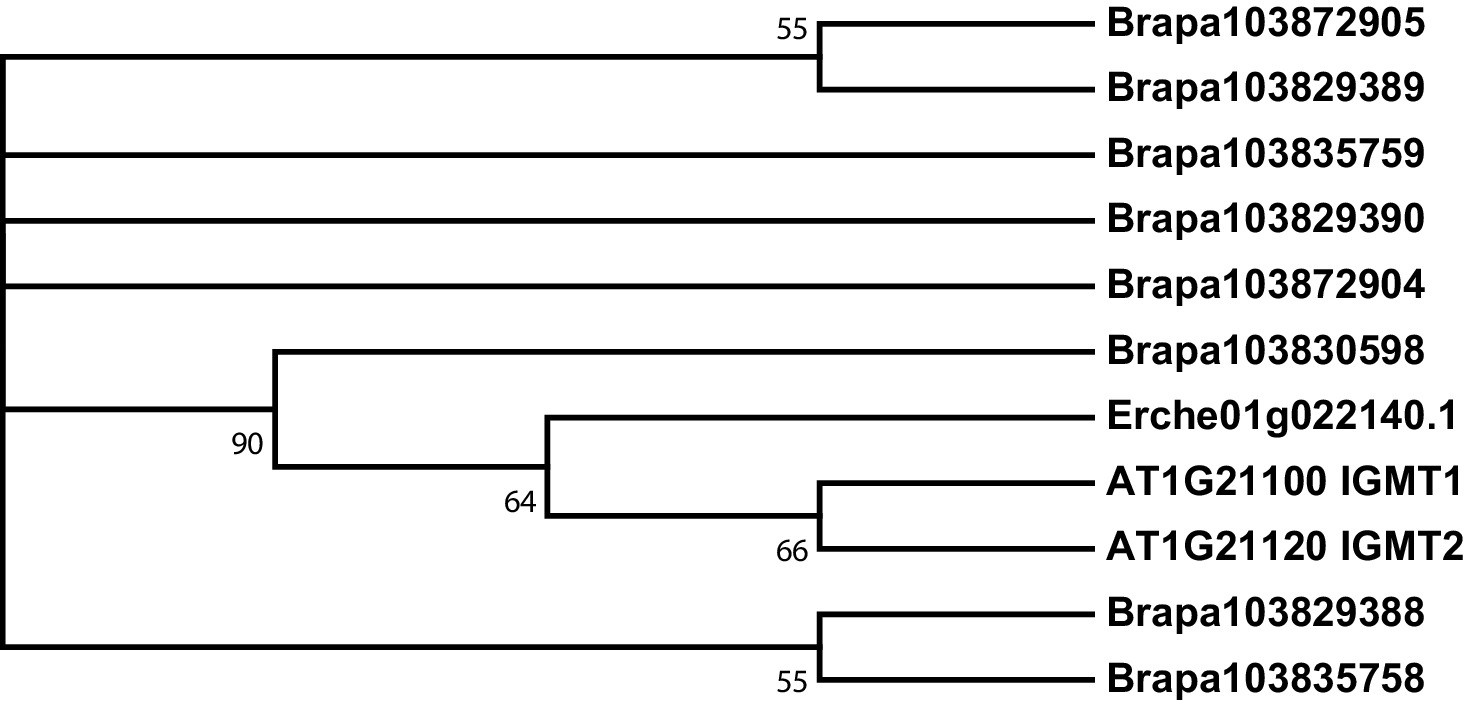
Phylogeny of indole glucosinolate methyltransferase (IGMT) genes from E. cheiranthoides, A. thaliana, and B. oleracea.
The tree was generated using the Tamura 3-parameter model with evolutionary rates modelled by Gamma distribution with five rate categories.
Figure 4 with 12 supplements
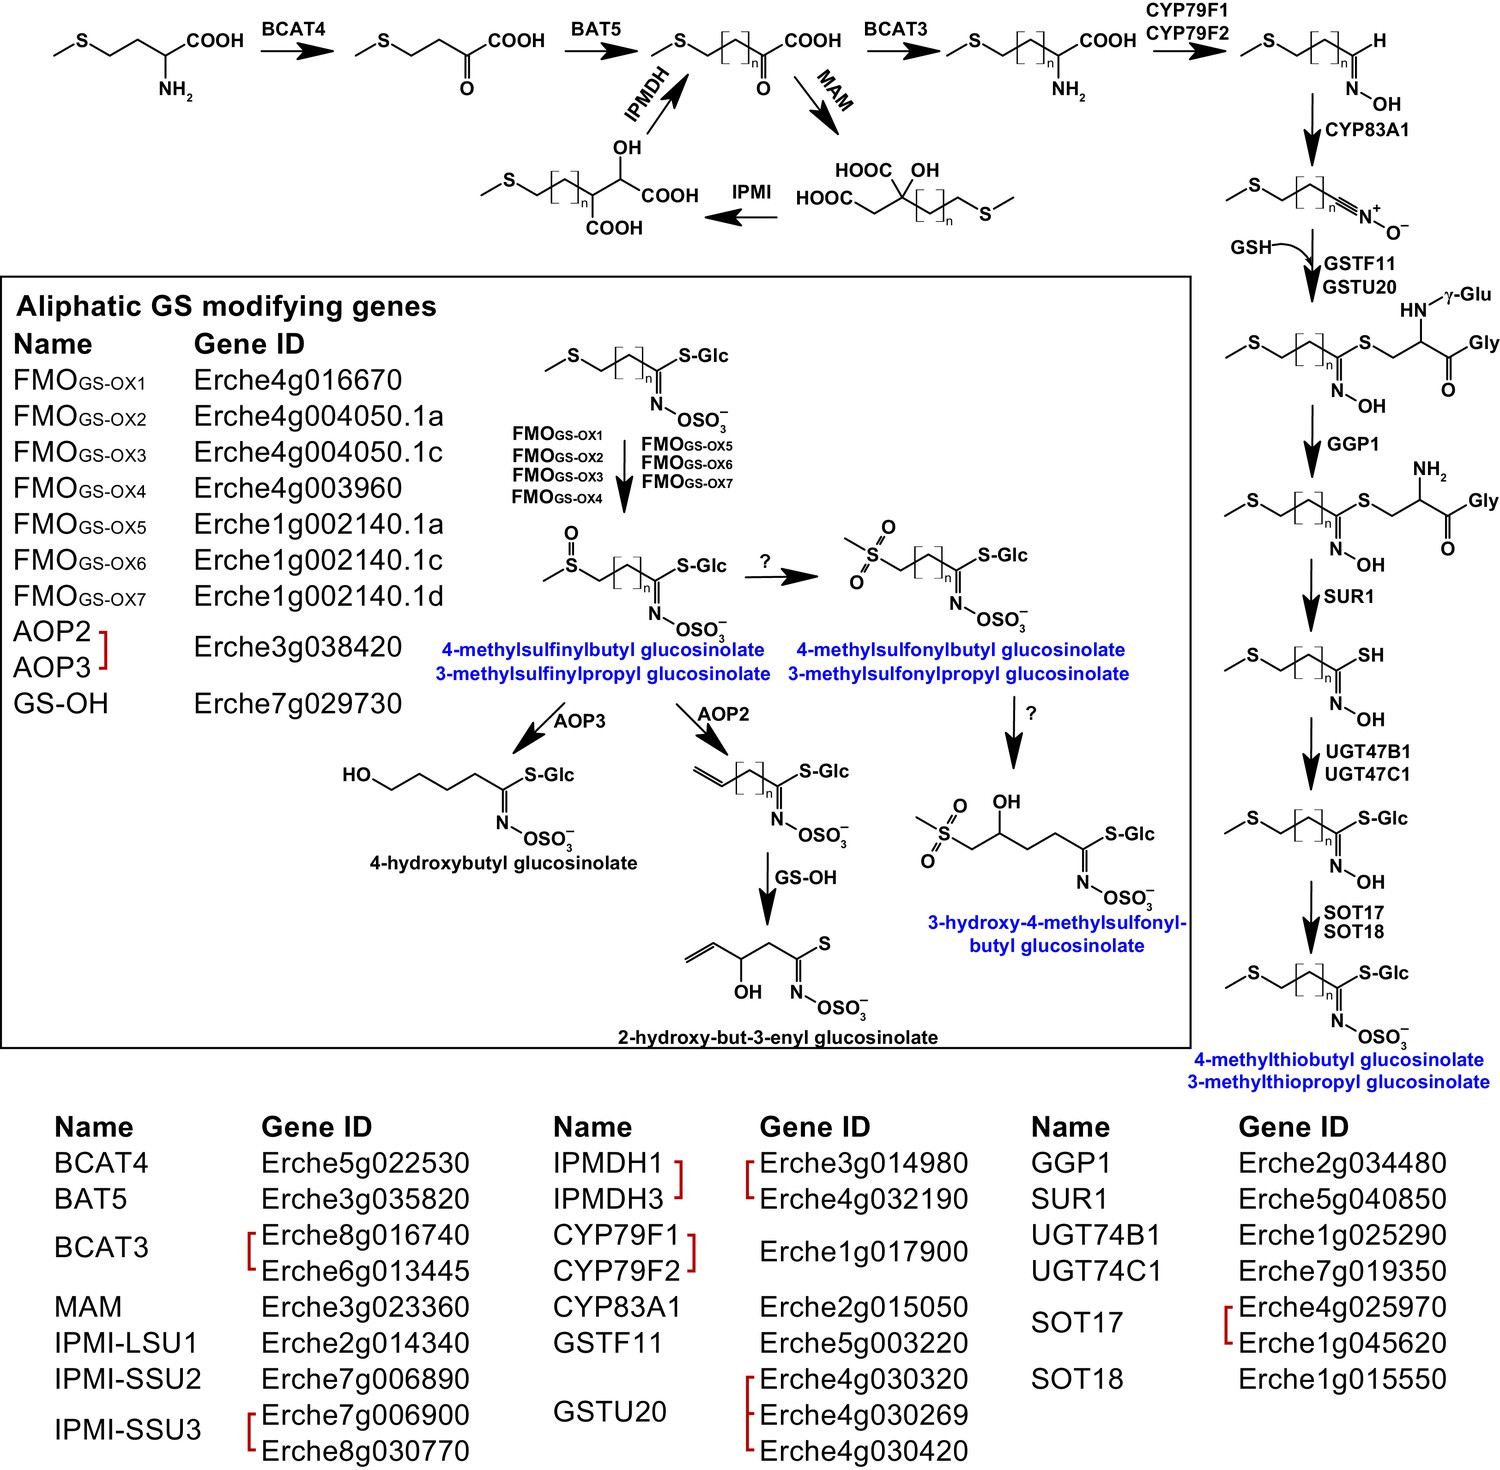
Identification of known aliphatic glucosinolate biosynthetic genes and glucosinolate-modifying genes from Arabidopsis in Erysimum cheiranthoides.
Aliphatic glucosinolates are synthesized from methionine by a series of enzymes, while additional enzymes are responsible for aliphatic glucosinolate modifications (black box). Red square brackets indicate where gene copy numbers differ between Arabidopsis and E. cheiranthoides, or where gene copies could not be matched unambiguously between species. Glucosinolates with names highlighted in blue were identified in Erysimum cheiranthoides var. Elbtalaue. Abbreviations: branched-chain aminotransferase (BCAT); bile acid transporter (BAT); methylthioalkylmalate synthase (MAM); isopropylmalate isomerase (IPMI); large subunit (LSU); small subunit (SSU); isopropylmalate dehydrogenase(IPMDH); cytochrome P450 monooxygenase (CYP); glutathione S-transferase F (GSTF); glutathione S-transferase Tau (GSTU); glutathione (GSH); γ-glutamyl peptidase 1 (GGP1); SUPERROOT 1 C-S lyase (SUR1); UDP-dependent glycosyltransferase (UGT); sulfotransferase (SOT); flavin monooxygenase (FMO); glucosinolate oxoglutarate-dependent dioxygenase (AOP); 3-butenyl glucosinolate 2-hydroxylase (GS-OH).
Figure 4—figure supplement 1
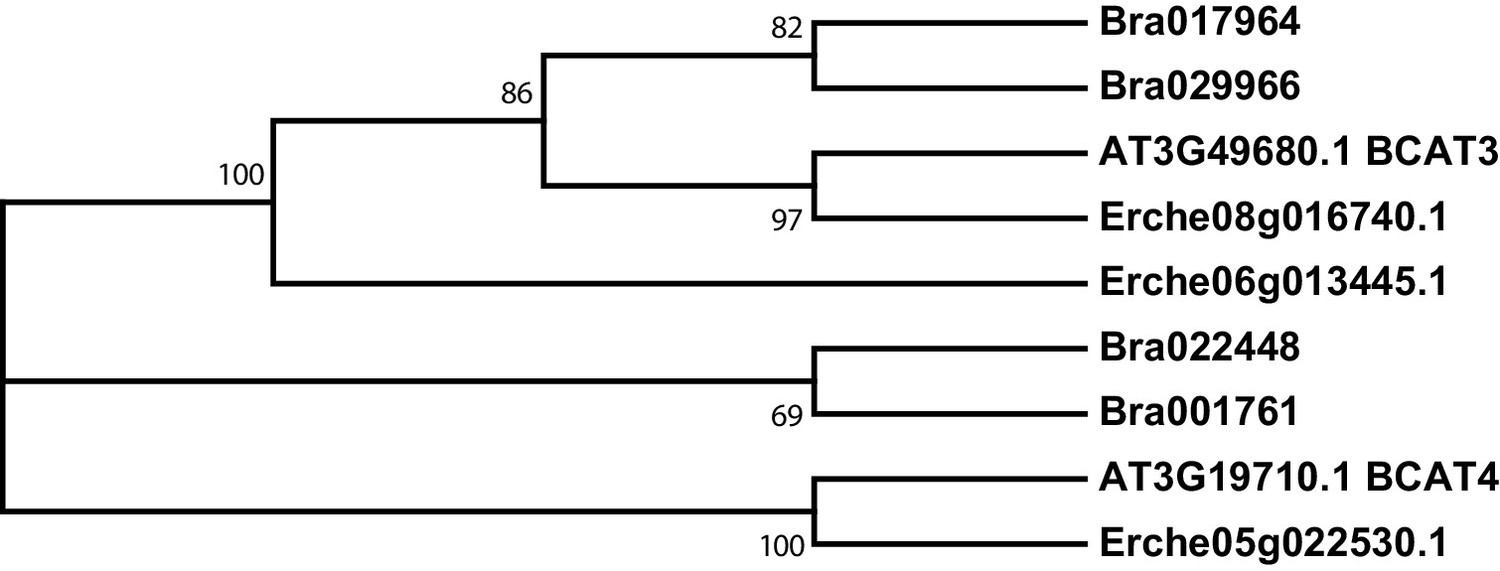
Phylogeny of branched-chain aminotransferase (BCAT) genes from E. cheiranthoides, A. thaliana, and B. oleracea.
The tree was generated using the Tamura 3-parameter model with evolutionary rates modelled by Gamma distribution with five rate categories.
Figure 4—figure supplement 2
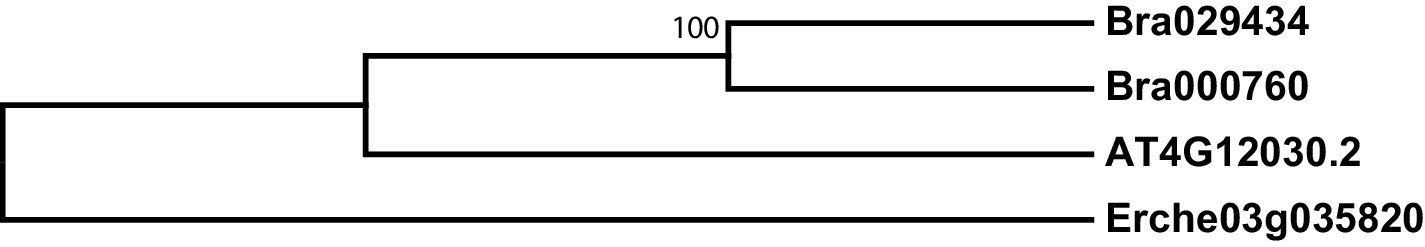
Phylogeny of bile acid transporter (BAT) genes from E. cheiranthoides, A. thaliana, and B. oleracea.
The tree was generated using the Hasegawa-Kishino-Yano model with evolutionary rates modelled by Gamma distribution with invariant sites with five rate categories.
Figure 4—figure supplement 3
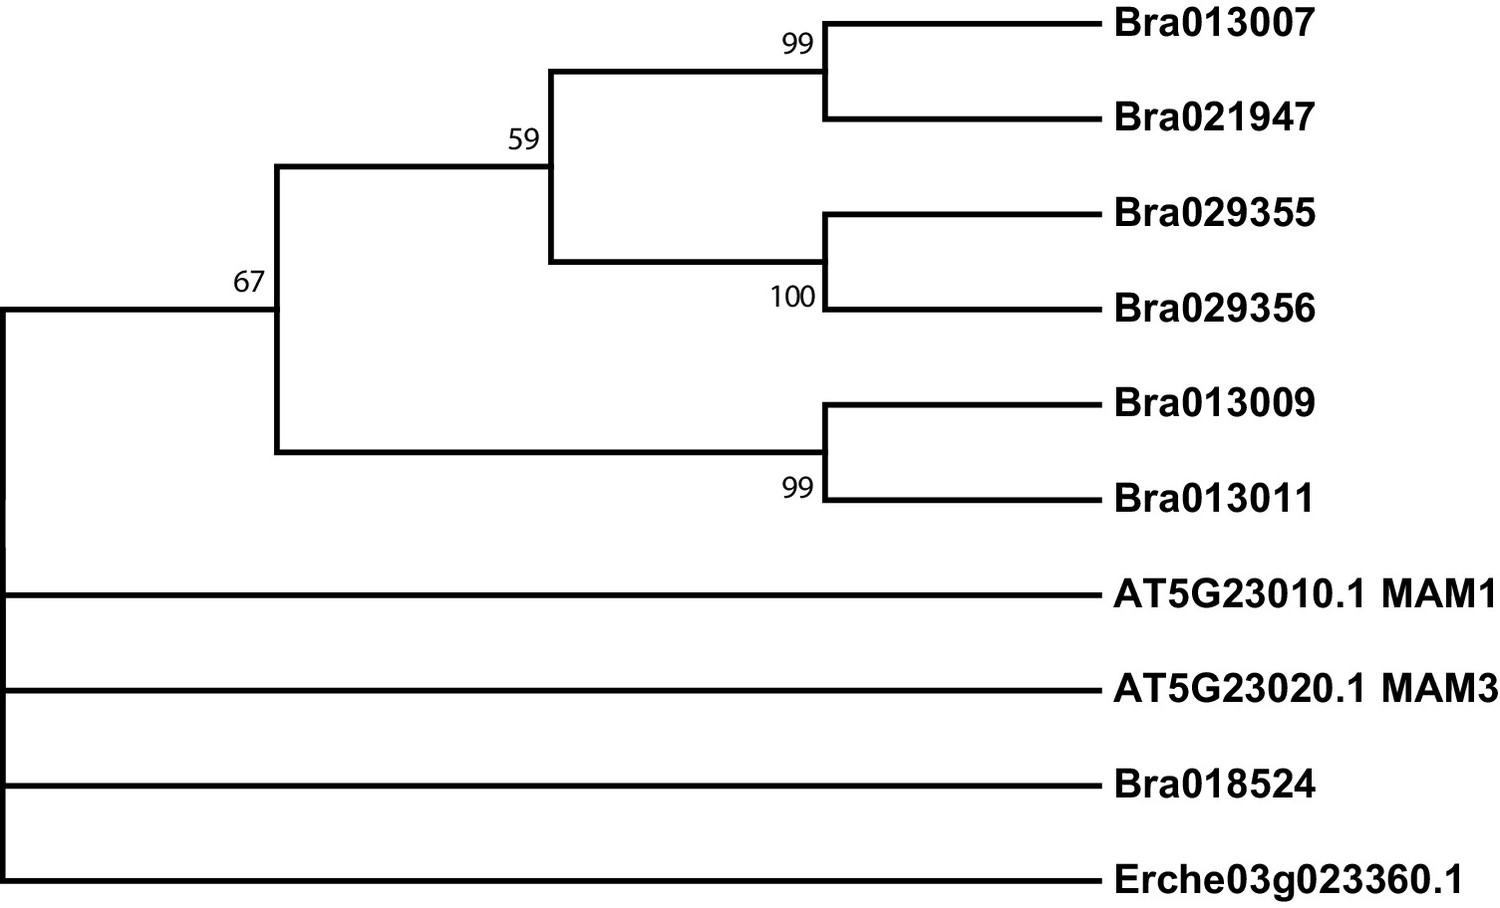
Phylogeny of methylthioalkylmalate synthase (MAM) genes from E. cheiranthoides, A. thaliana, and B. oleracea.
The tree was generated using the Tamura 3-parameter model with evolutionary rates modelled by Gamma distribution with five rate categories.
Figure 4—figure supplement 4
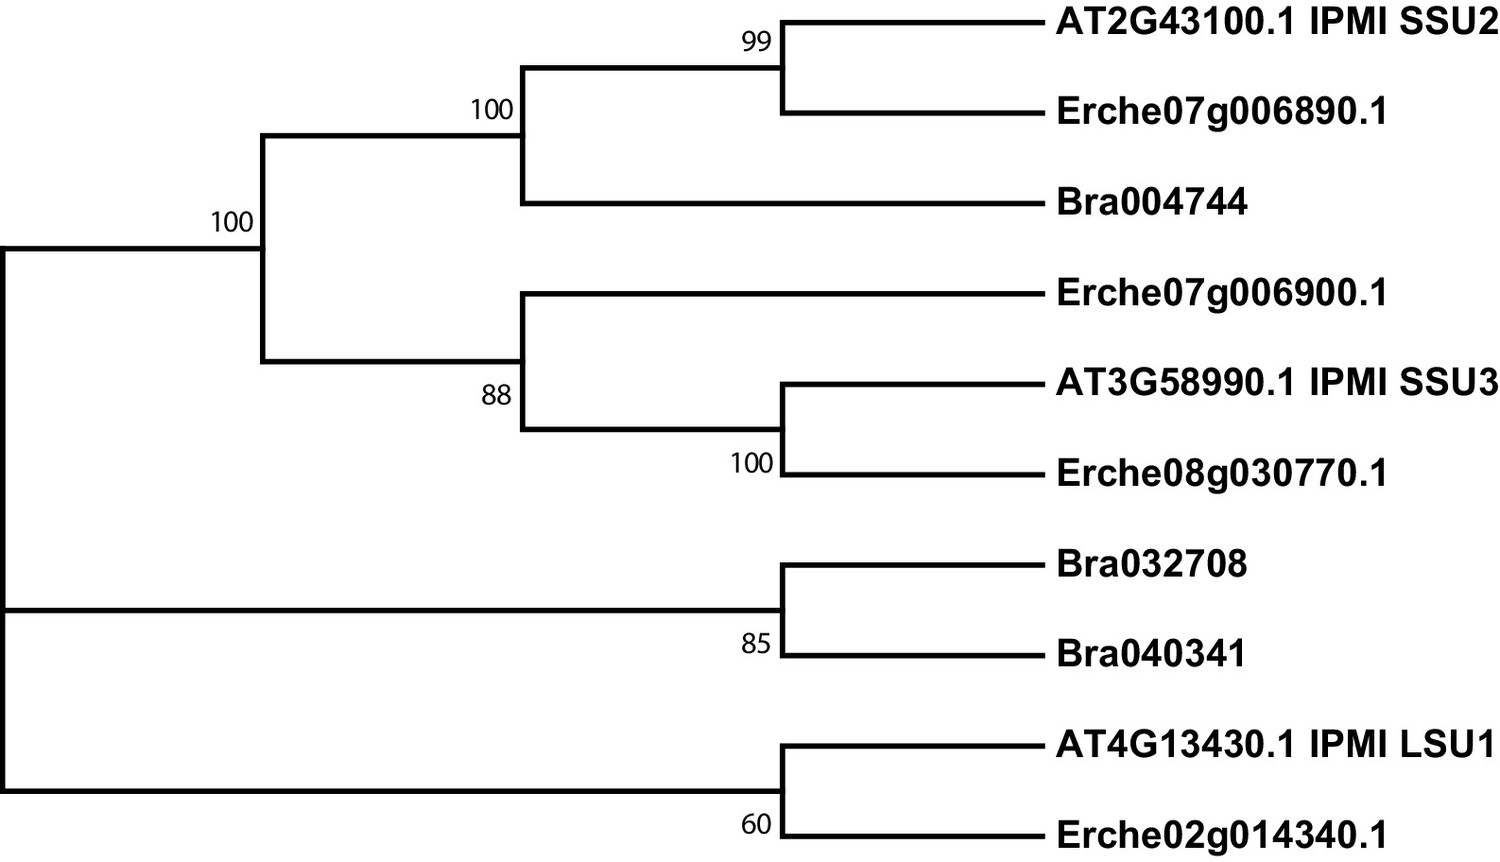
Phylogeny of isopropylmalate isomerase (IPMI) genes from E. cheiranthoides, A. thaliana, and B. oleracea.
The tree was generated using the Kimura 2-parameter model with evolutionary rates modelled by Gamma distribution with five rate categories.
Figure 4—figure supplement 5
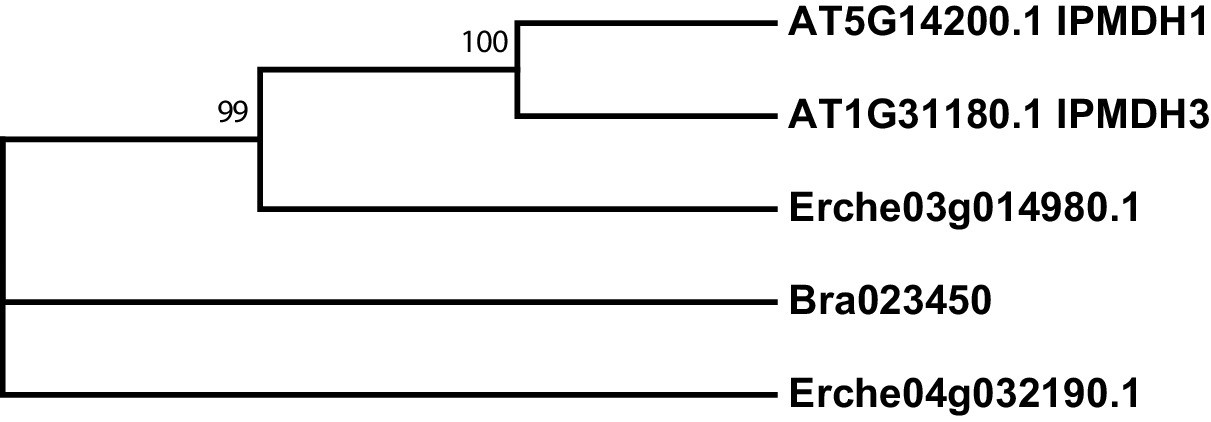
Phylogeny of isopropylmalate dehydrogenase (IPMDH) genes from E. cheiranthoides, A. thaliana, and B. oleracea.
The tree was generated using the Tamura 3-parameter model with evolutionary rates modelled by Gamma distribution with five rate categories.
Figure 4—figure supplement 6
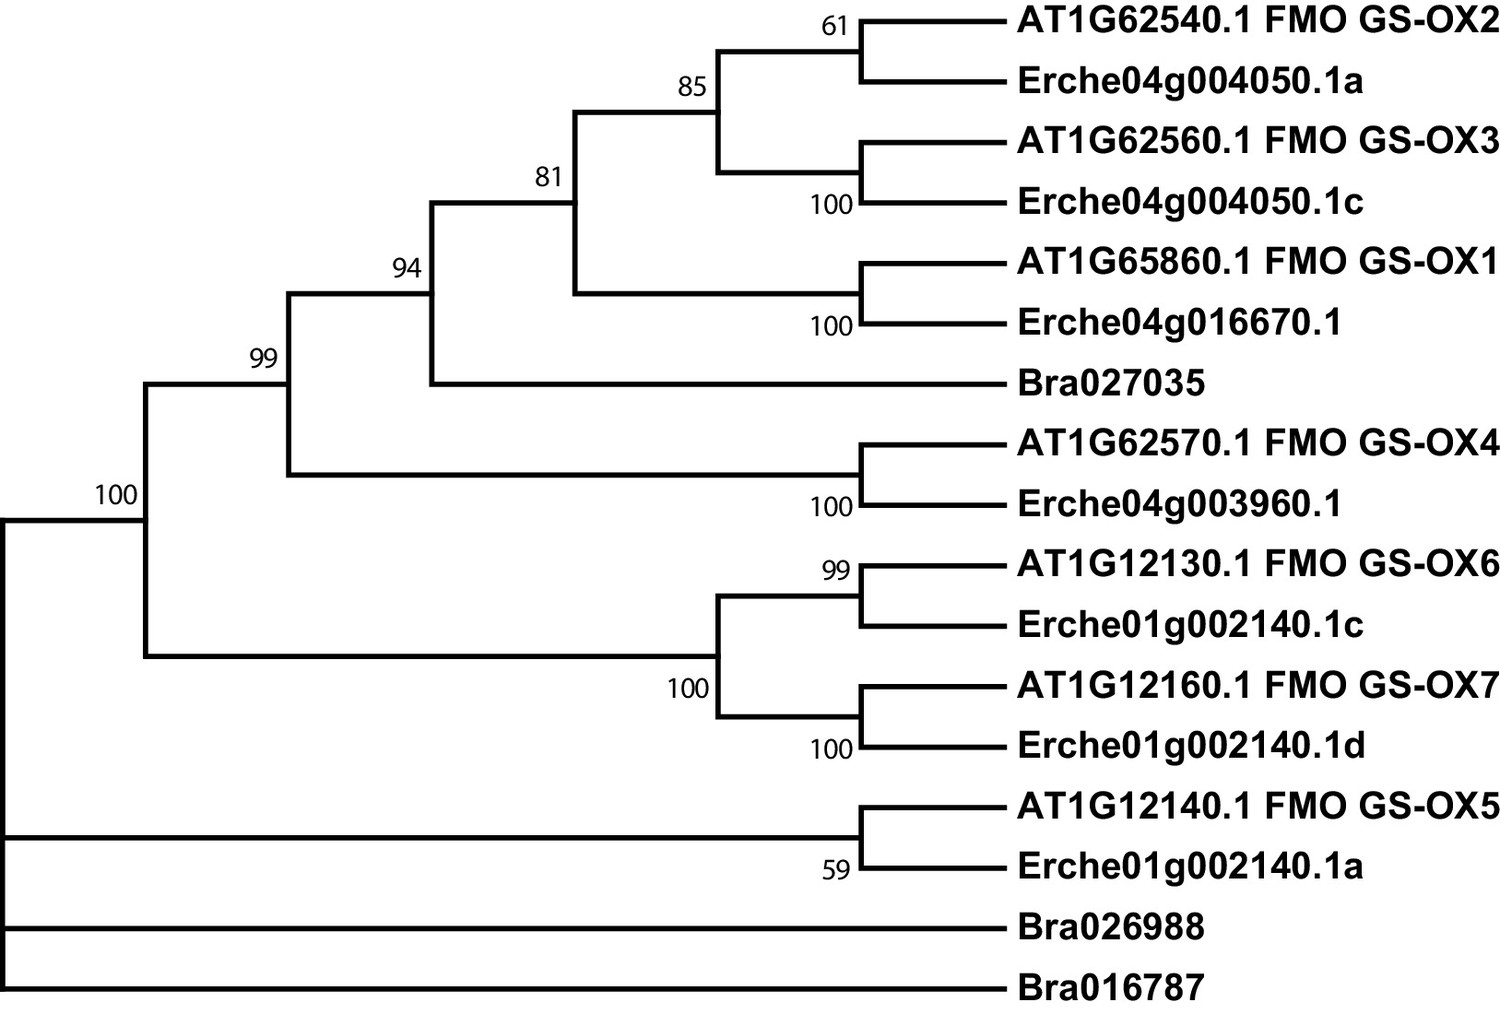
Phylogeny of flavin monooxygenase (FMO GS-OX) genes from E. cheiranthoides, A. thaliana, and B. oleracea.
The tree was generated using the Tamura 3-parameter model with evolutionary rates modelled by Gamma distribution with five rate categories.
Figure 4—figure supplement 7
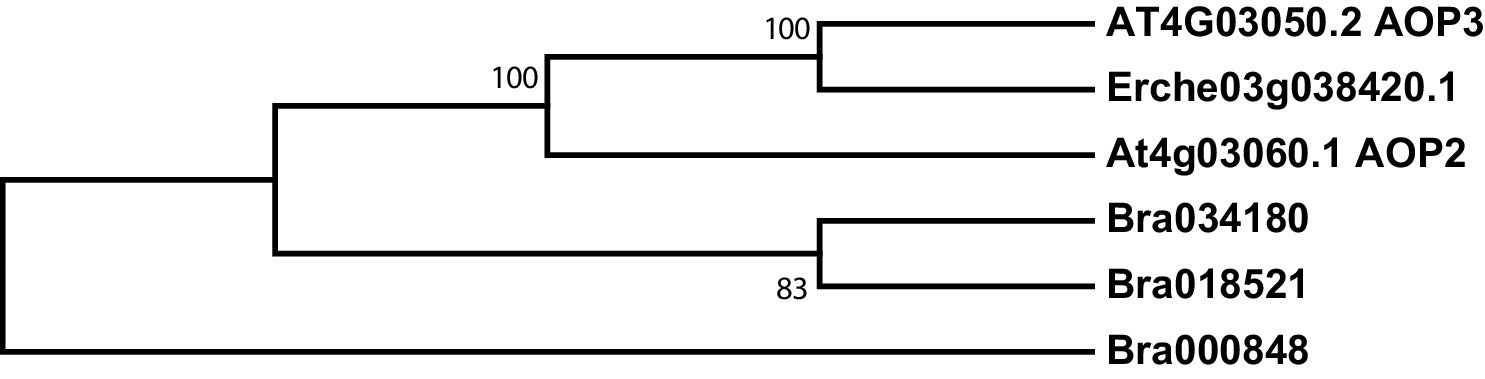
Phylogeny of glucosinolate oxoglutarate-dependent dioxygenase (AOP) genes from E. cheiranthoides, A. thaliana, and B. oleracea.
The tree was generated using the Tamura 3-parameter model with evolutionary rates modelled by Gamma distribution with five rate categories.
Figure 4—figure supplement 8

Phylogeny of 3-butenyl glucosinolate 2-hydroxylase (GS-OH) genes from E. cheiranthoides, A. thaliana, and B. oleracea.
The tree was generated using the Tamura 3-parameter model.
Figure 4—figure supplement 9
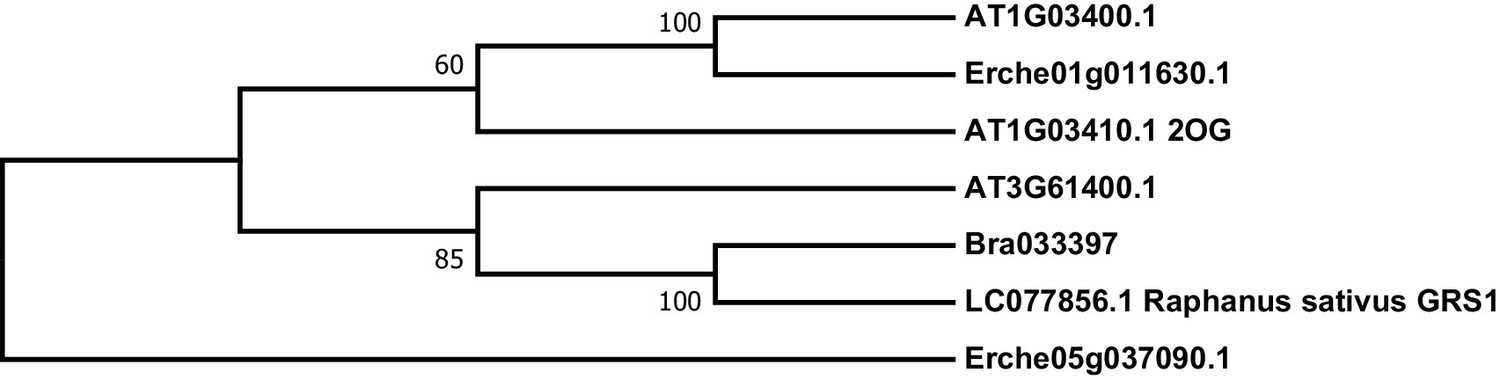
Phylogeny of E. cheiranthoides, A. thaliana, and B. oleracea genes with similarity glucoraphasitin synthase (GRS) from R. sativus.
The tree was generated using the Tamura 3-parameter model with evolutionary rates modelled by Gamma distribution with five rate categories.
Figure 4—figure supplement 10
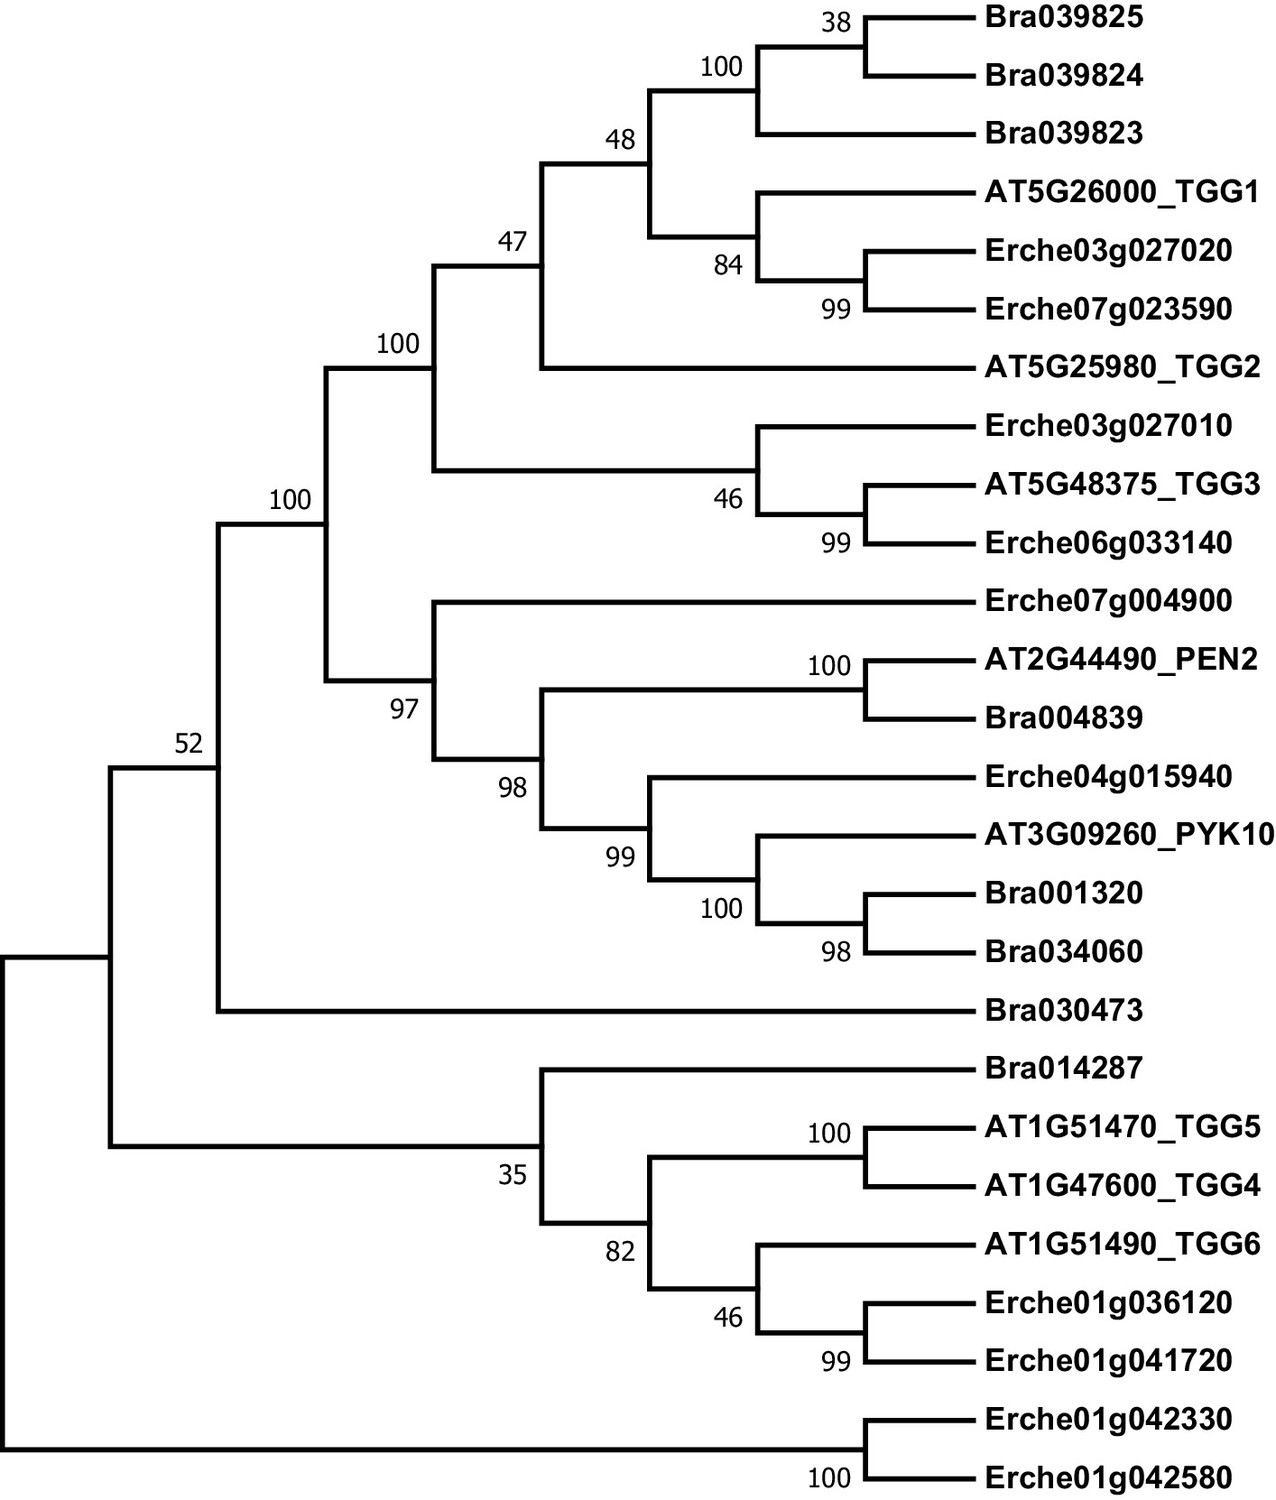
Phylogeny of myrosinase (thioglucoside glucohydrolase, TGG) genes from E. cheiranthoides, A. thaliana, and B. oleracea.
The tree was generated using the Tamura 3-parameter model with evolutionary rates modelled by Gamma distribution with five rate categories.
Figure 4—figure supplement 11
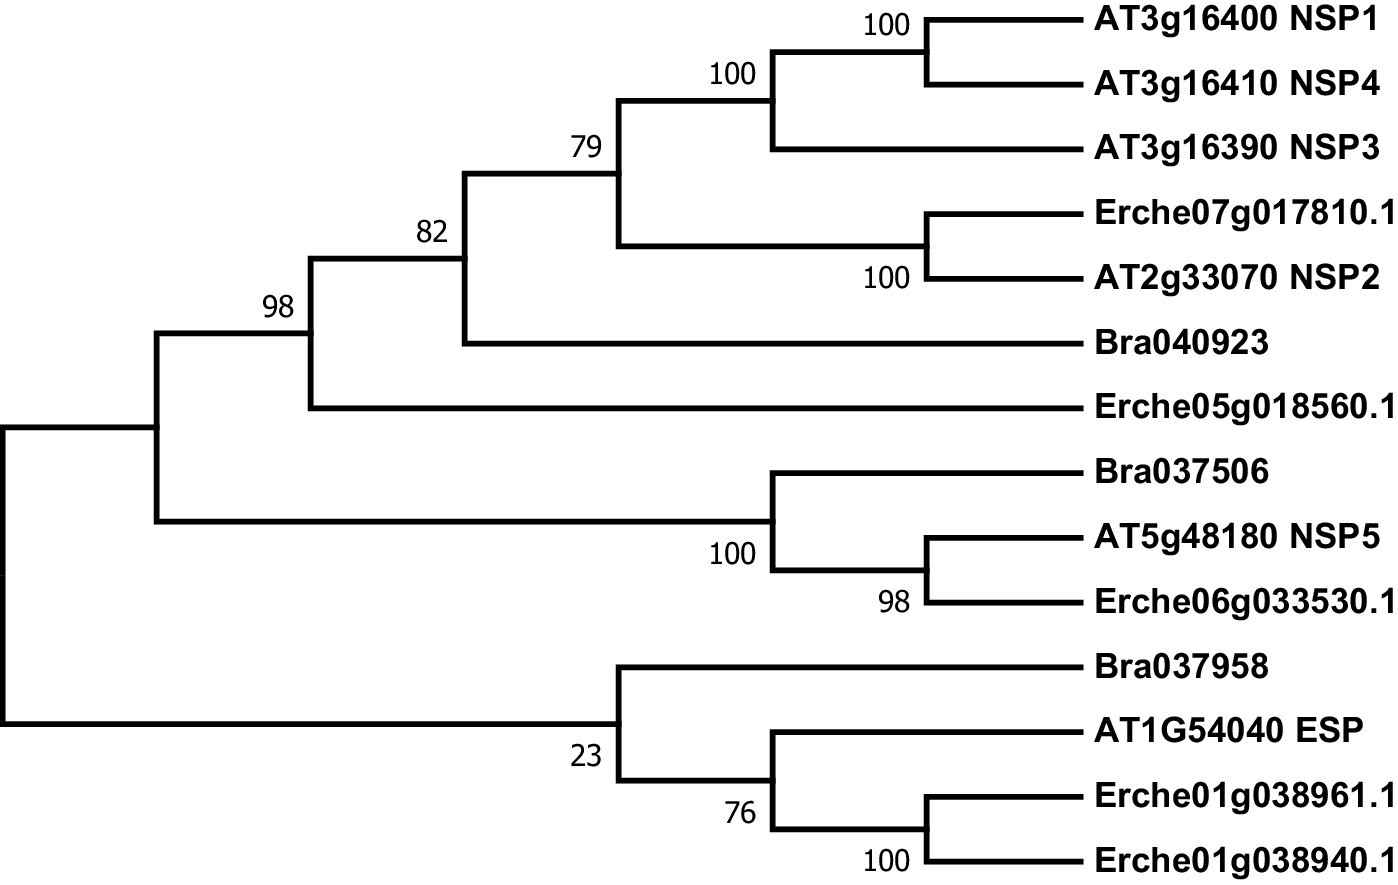
Phylogeny of epithiospecifier protein (ESP) and nitrile specifier protein (NSP) genes from E. cheiranthoides, A. thaliana, and B. oleracea.
The tree was generated using the Tamura 3-parameter model with evolutionary rates modelled by Gamma distribution with five rate categories.
Figure 4—figure supplement 12
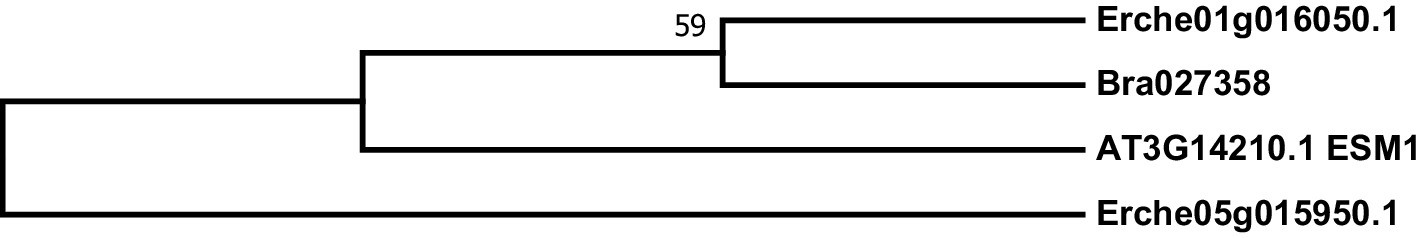
Phylogeny of epithiospecifier modifier (ESM) genes from E. cheiranthoides, A. thaliana, and B. oleracea.
The tree was generated using the Tamura 3-parameter model with evolutionary rates modelled by Gamma distribution with five rate categories.
Figure 5 with 4 supplements
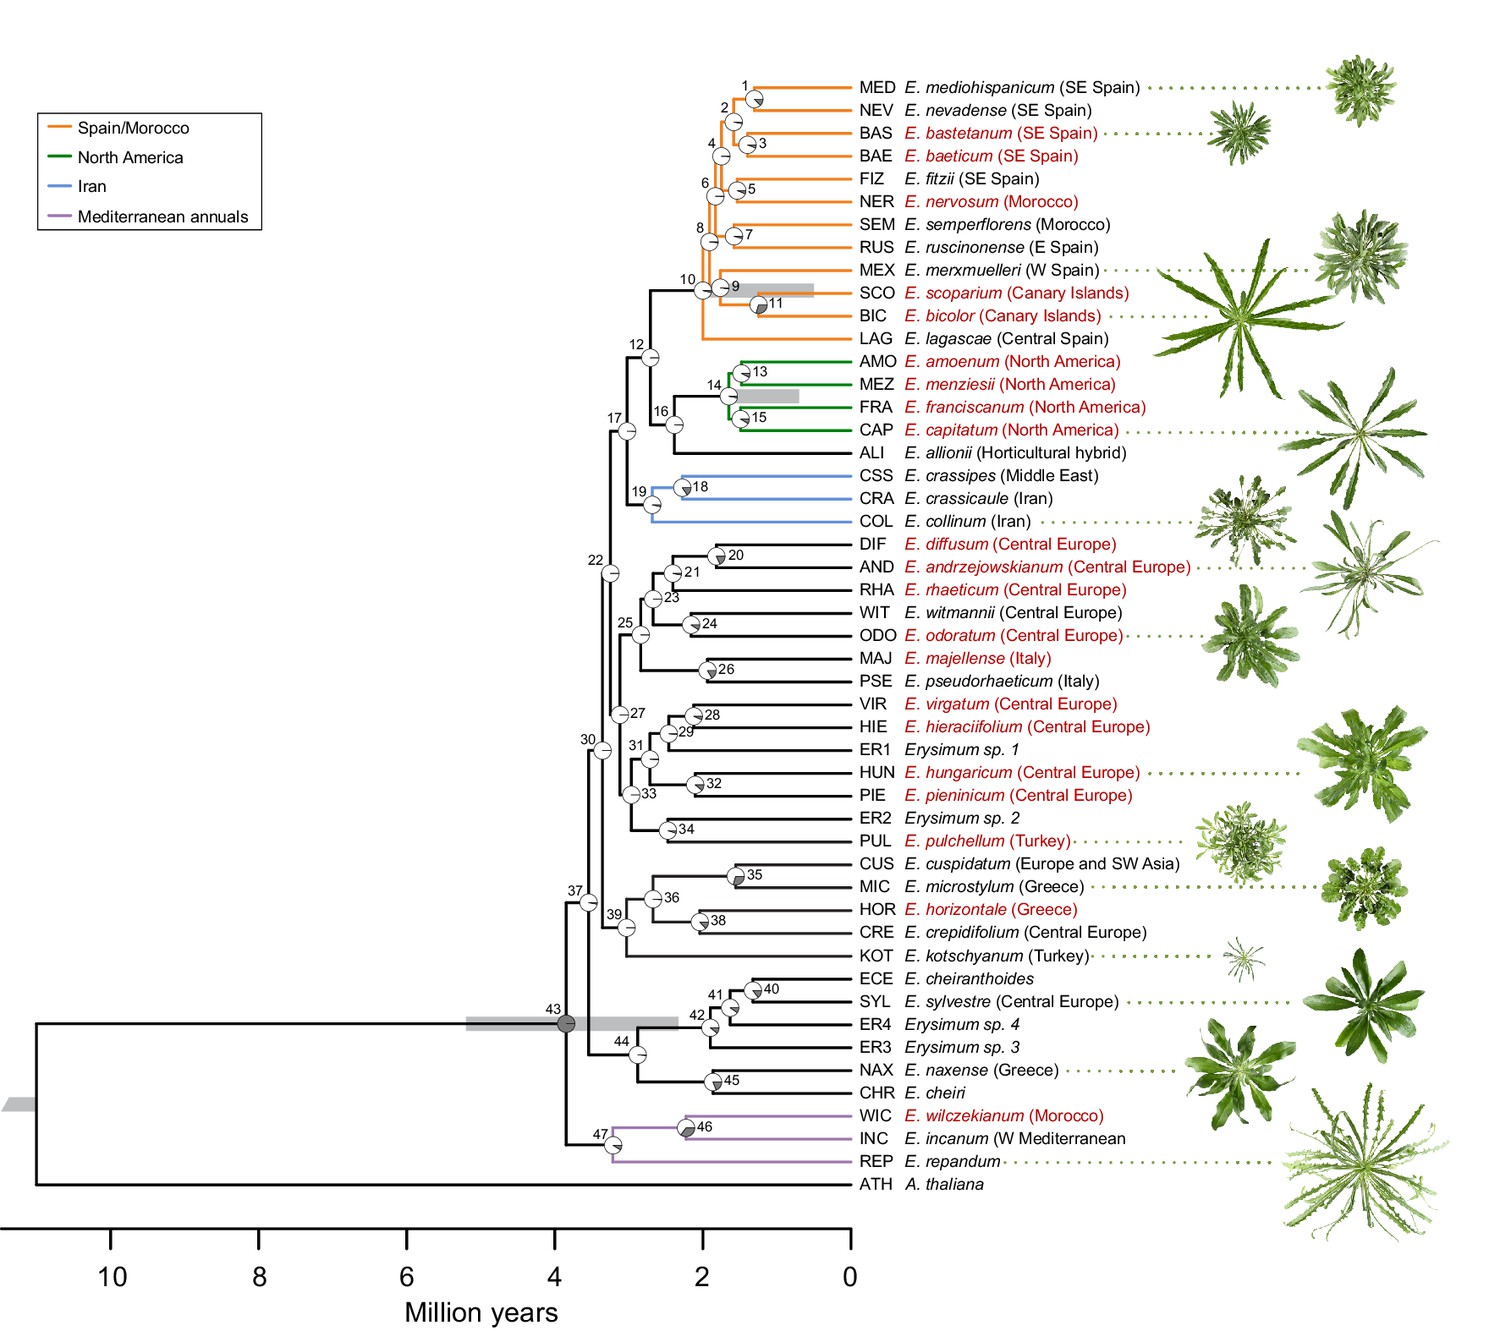
Genome-guided concatenated phylogeny of 48 Erysimum species.
Phylogenetic relationships were inferred from 9868 orthologous genes using ExaML with Arabidopsis thaliana as outgroup. Node depth corresponds to divergence time in million years. Pie charts on each internode show concordance factors, with gray segments corresponding to the proportion of gene tree supporting the main topology. Nodes are labelled as 1 to 47; see Supplementary file 5 for concordance factor values and number of decisive trees of each node. Four nodes were constrained using published divergence time estimates, with the range of constraints indicated by gray bars. Known polyploid species are highlighted in red. Approximate geographic range of species is provided in parentheses. The horticultural species E. cheiri and the weedy species E. cheiranthoides and E. repandum are of European origin but are now widespread across the Northern Hemisphere. Clades of species from shared geographic origins are highlighted in different colors. On the right, pictures of rosettes of a representative subset of species is provided to highlight the morphological diversity within this genus. Plants are of the same age and relative size differences are conserved in the pictures.
Figure 5—figure supplement 1
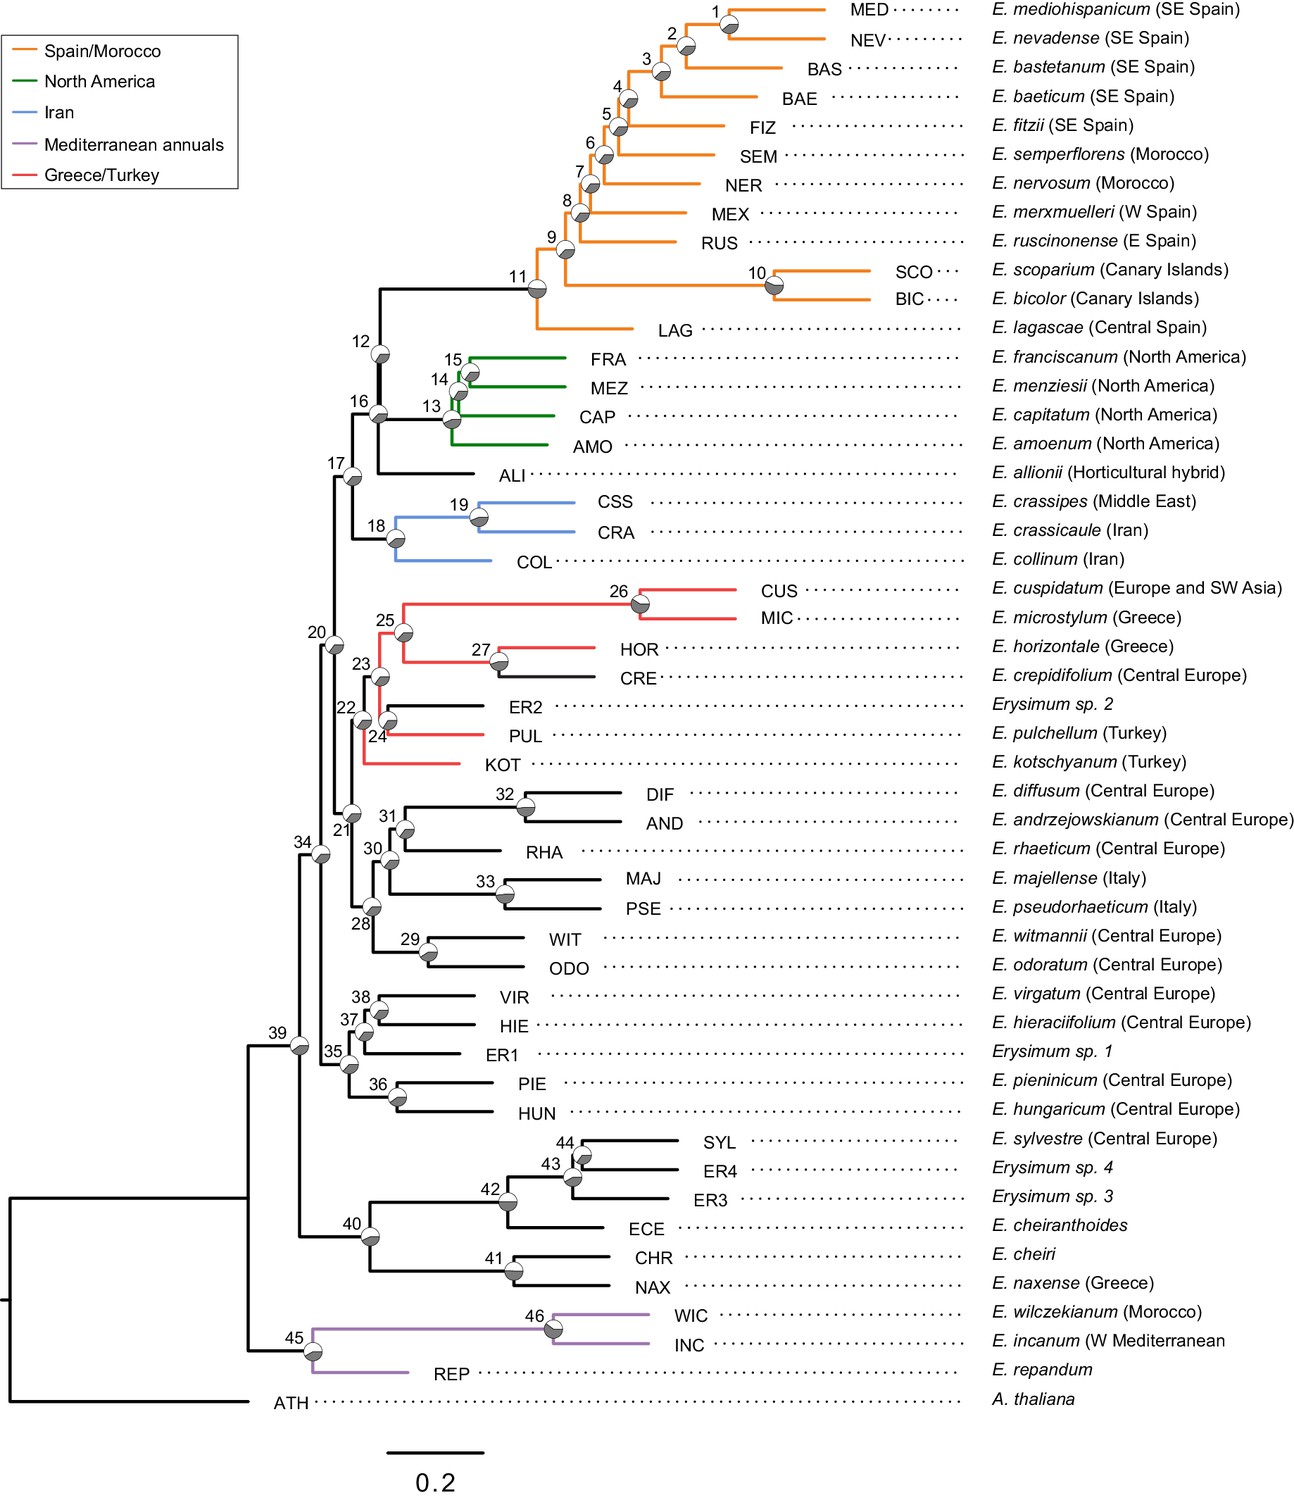
Genome-guided ASTRAL phylogeny of 48 Erysimum species.
Phylogenetic relationships were inferred from 9868 orthologous genes using ASTRAL-III with Arabidopsis thaliana as outgroup. Pie charts on each internode show proportional quartet support for the main topology (q1) relative to the first and second alternative. Note that maximal discordance is indicated by equivalent support for each alternative (1/3). Nodes are labelled as 1 to 46; see Supplementary file 4 for full quartet support values and local posterior probability scores. Terminal branch length was manually adjusted to 0.2 coalescent units.
Figure 5—figure supplement 2
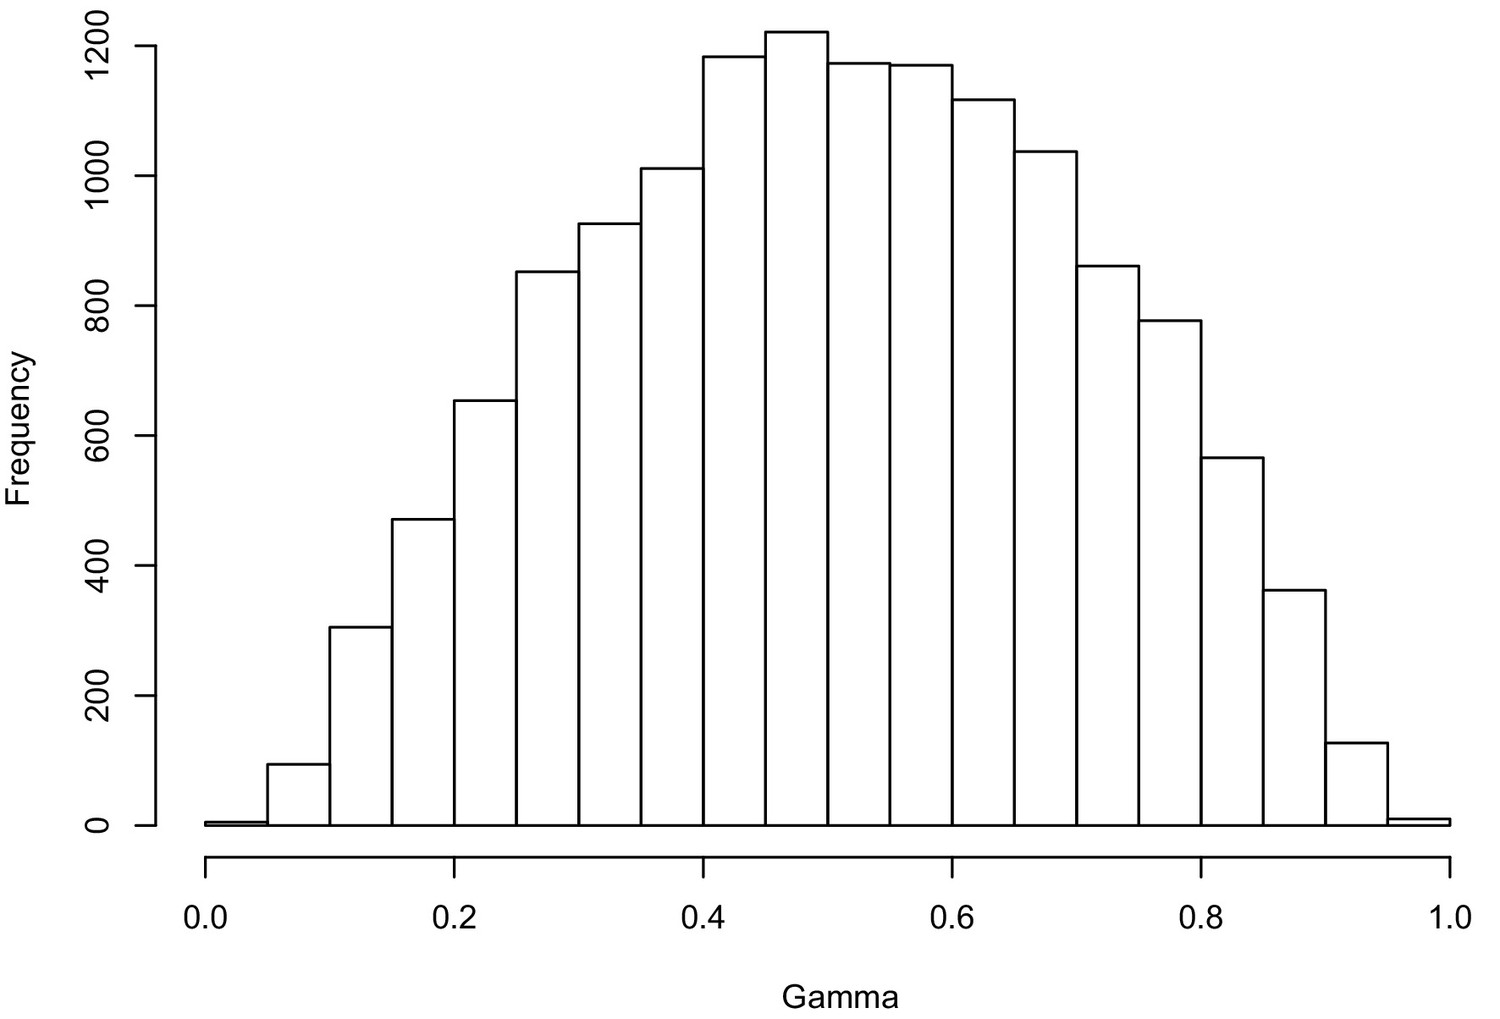
Hybridization levels among the 48 Erysimum species estimated by HyDe.
The histogram shows the gamma score (hybridization proportion) distribution in all the significant detections (13,922 out of 51,888 tests after Bonferroni correction). Scores of 0.3 to 0.7 indicate high levels of hybridization.
Figure 5—figure supplement 3
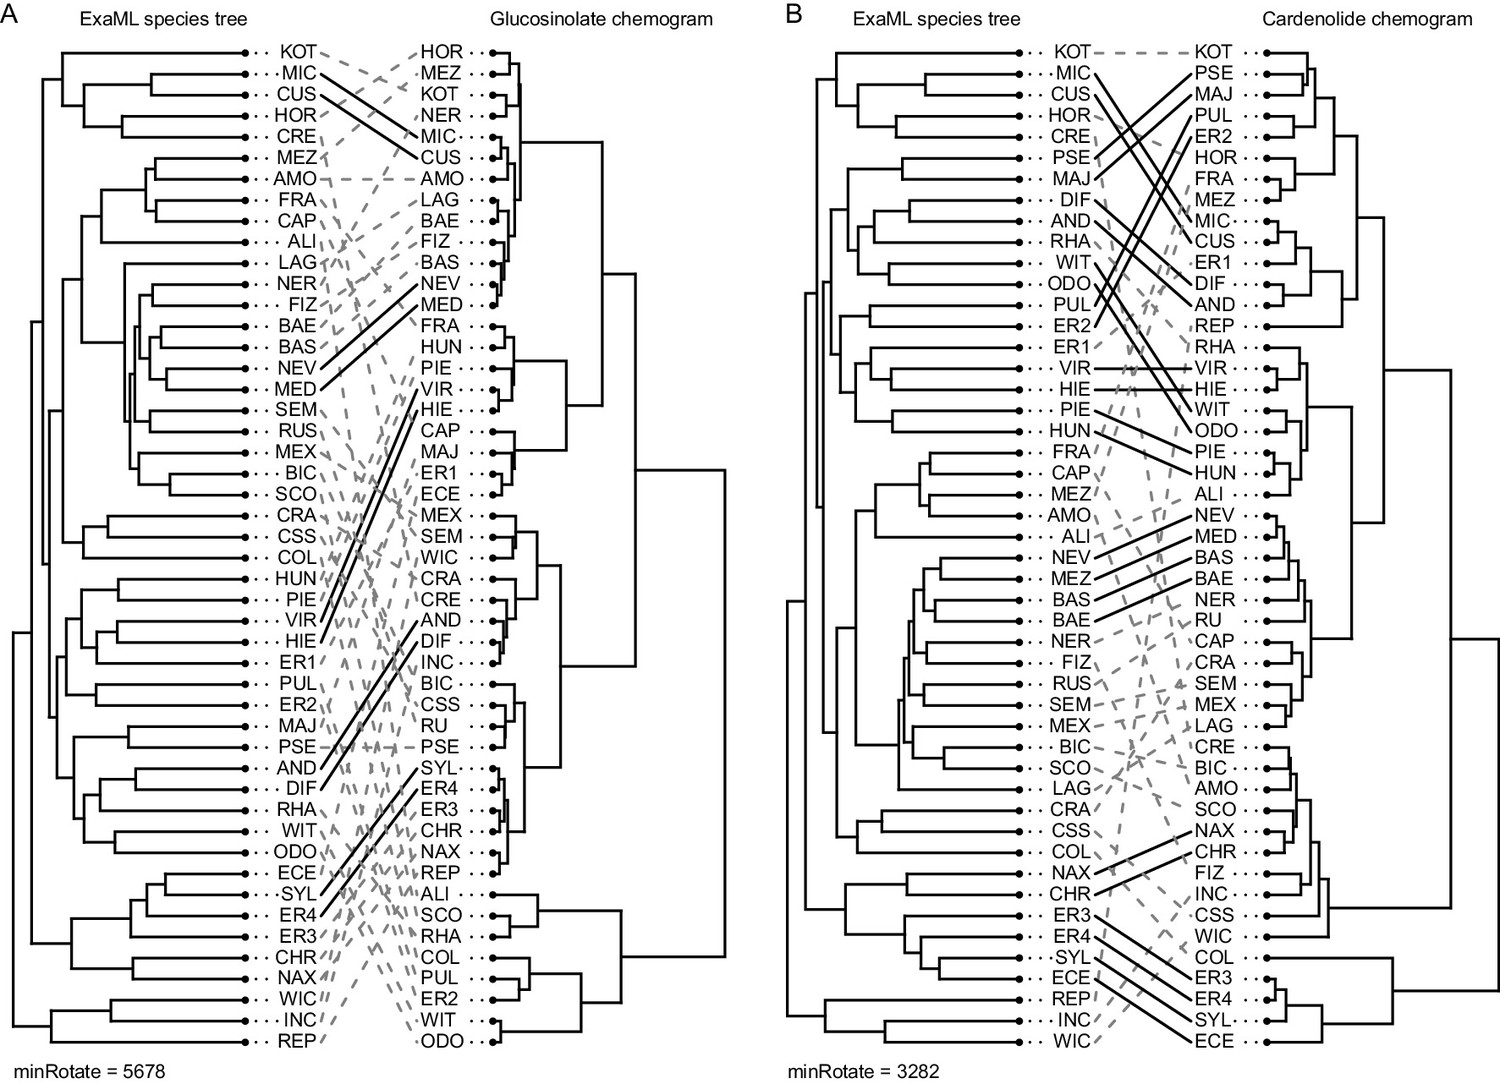
Co-phylogenetic plots of optimized matches between phylogenetic relatedness and chemical similarity in (A) glucosinolates and (B) cardenolides.
Nodes on both the concatenated ExaML species tree and each chemogram were rotated to minimize tip-to-tip distances between trees. Dashed gray lines connect the same species in the phylogenetic trees and the chemograms. Solid black lines highlight species pairs for which the closest phylogenetic neighbor is also the most chemically similar species. MinRotate values correspond to the minimal total length of links between tree tips, with a perfect match between trees having a length of zero.
Figure 5—figure supplement 4
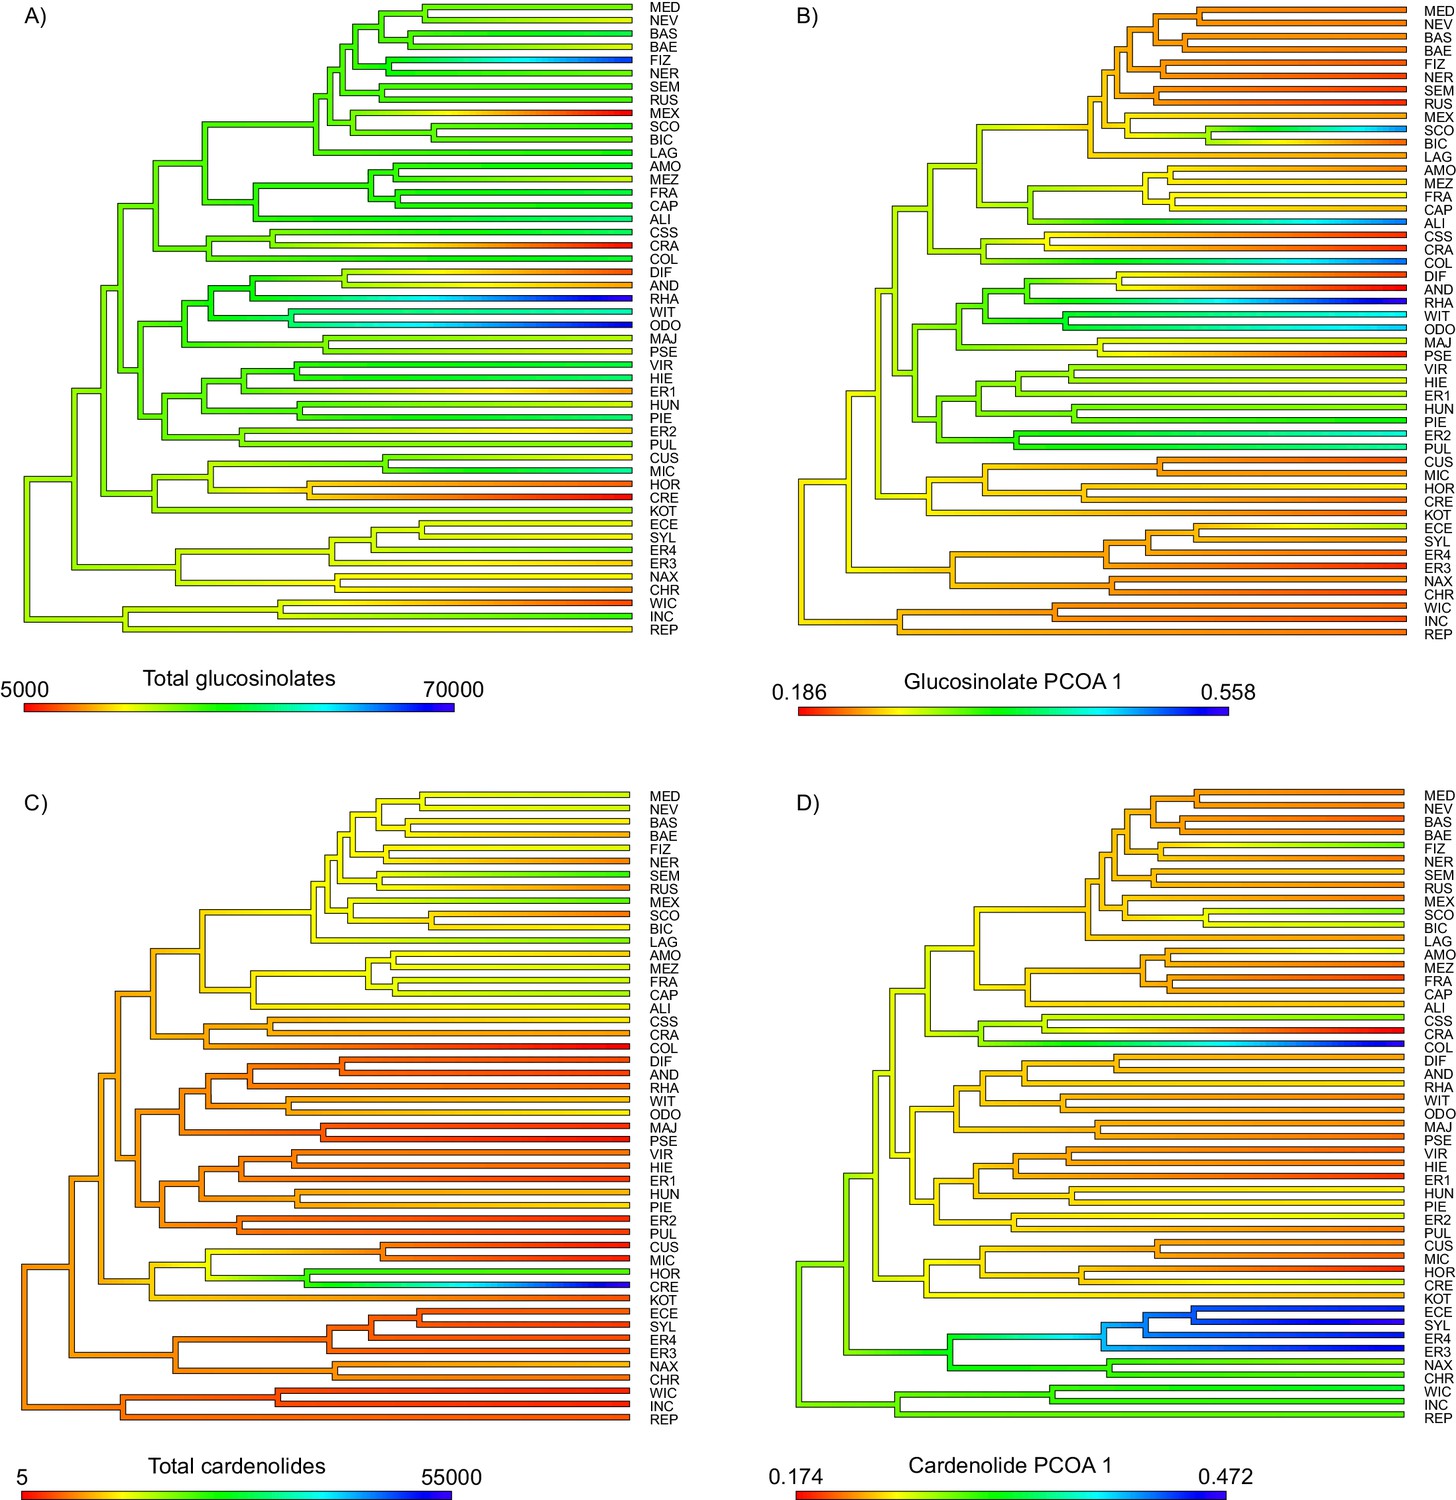
Ancestral state reconstruction of (A) total foliar glucosinolate content, (B) the first principal coordinate of the glucosinolate profile dissimilarity matrix, (C) total foliar cardenolide content, and (D) the first principal coordinate of the cardenolide profile dissimilarity matrix.
Figure 6 with 2 supplements

Mean defense traits of 48 Erysimum species, grouped by phylogenetic relatedness.
Not all traits could be quantified for all species. (A) Total number of glucosinolate compounds detected in each species. (B) Total glucosinolate concentration found in each species, quantified by total ion intensity in the mass spectrometry analyses. Values are means ±1 SE. (C) Quantification of glucosinolate-activating myrosinase activity. Enzyme kinetics were quantified against the standard glucosinolate sinigrin (2-propenyl glucosinolate) and are expressed per unit fresh plant tissue. Values are means ±1 SE. (D) Total number of cardenolide compounds detected in each species. (E) Total cardenolide concentrations found in each species, quantified by total ion intensity in mass spectrometry analyses. Values are means ±1 SE.
-
Figure 6—source data 1
Species means and standard errors (where applicable) for number of glucosinolate/cardenolide compounds, total compound concentrations, and myrosinase activity.
- https://cdn.elifesciences.org/articles/51712/elife-51712-fig6-data1-v2.txt
Figure 6—figure supplement 1
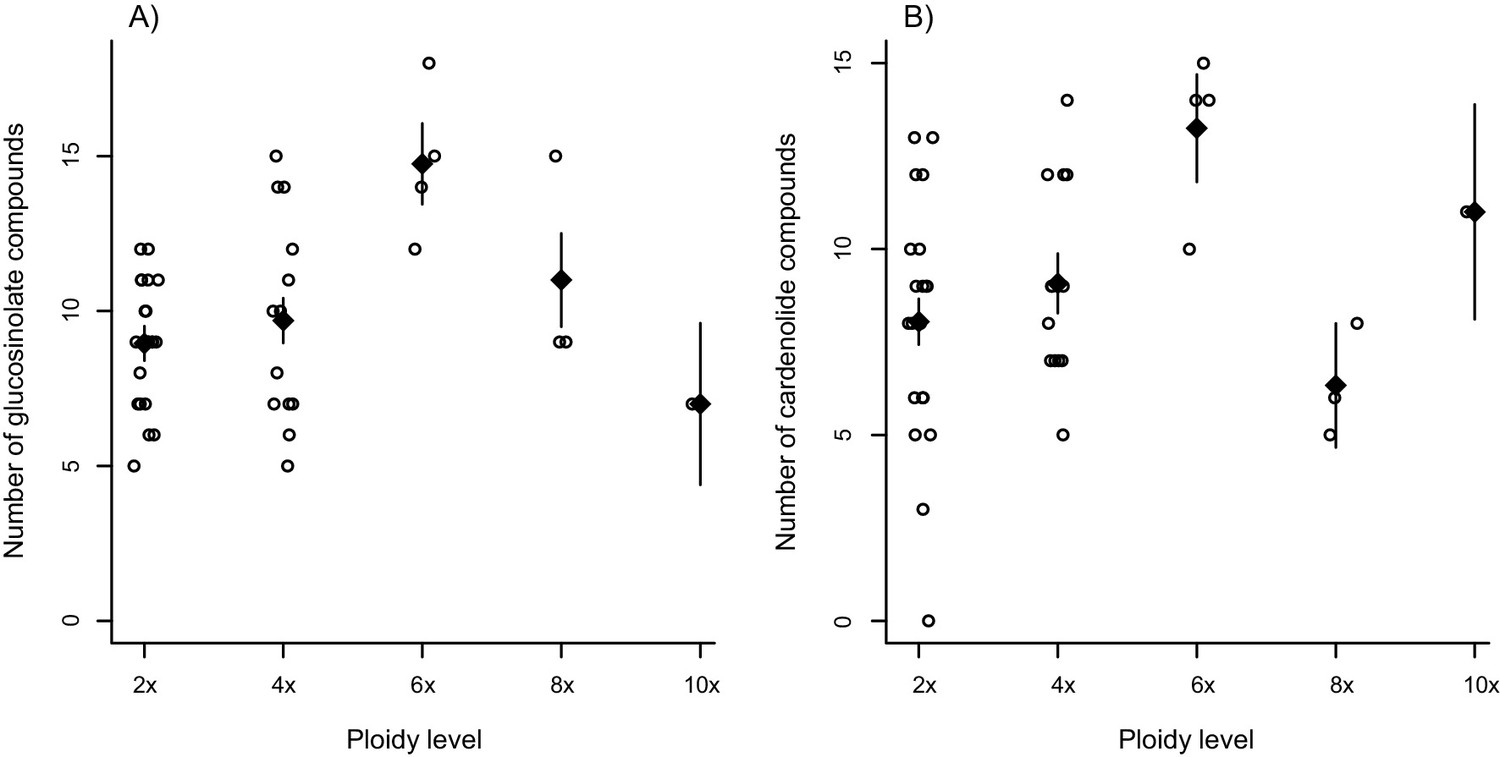
Effect of ploidy on compound diversity.
Open circles correspond to species, with ploidy inferred from literature reports. Black triangles are mean values ± 1 SE for each ploidy level. (A) Total number of glucosinolate compounds produced by each Erysimum species. (B) Number of cardenolide compounds that together constitute 80% of total cardenolide concentrations. As many cardenolide compounds were produced at very low concentrations, an effect of ploidy was obscured if the total number of cardenolide compounds was considered.
Figure 6—figure supplement 2
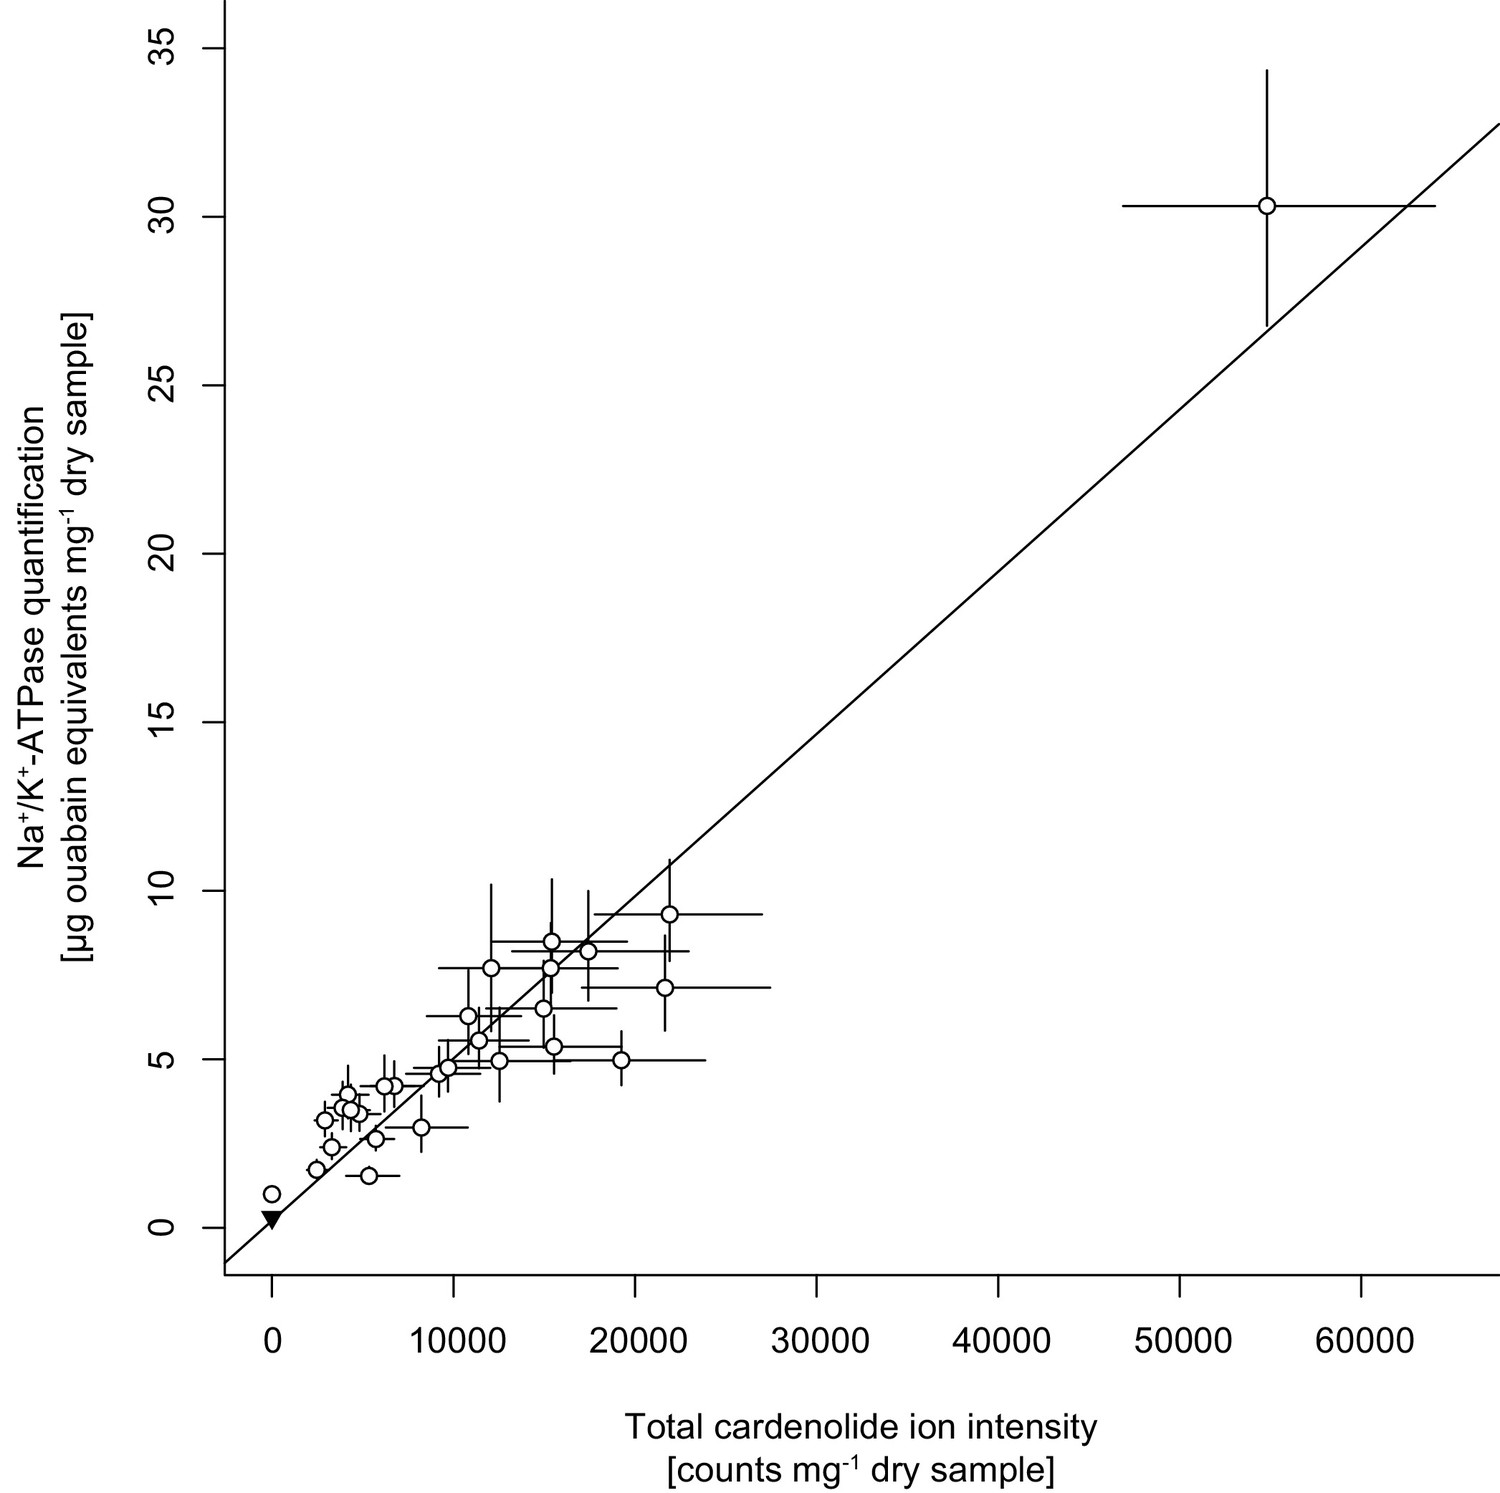
Correlation between cardenolide concentrations approximated by total cardenolide ion intensity and by inhibition of animal Na+/K+-ATPase.
Open circles are species means ±1 SE. The black triangle in the bottom left corner is the quantification of Sinapis arvensis tissue as a negative control. The solid line is the linear regression on species means.
Figure 7
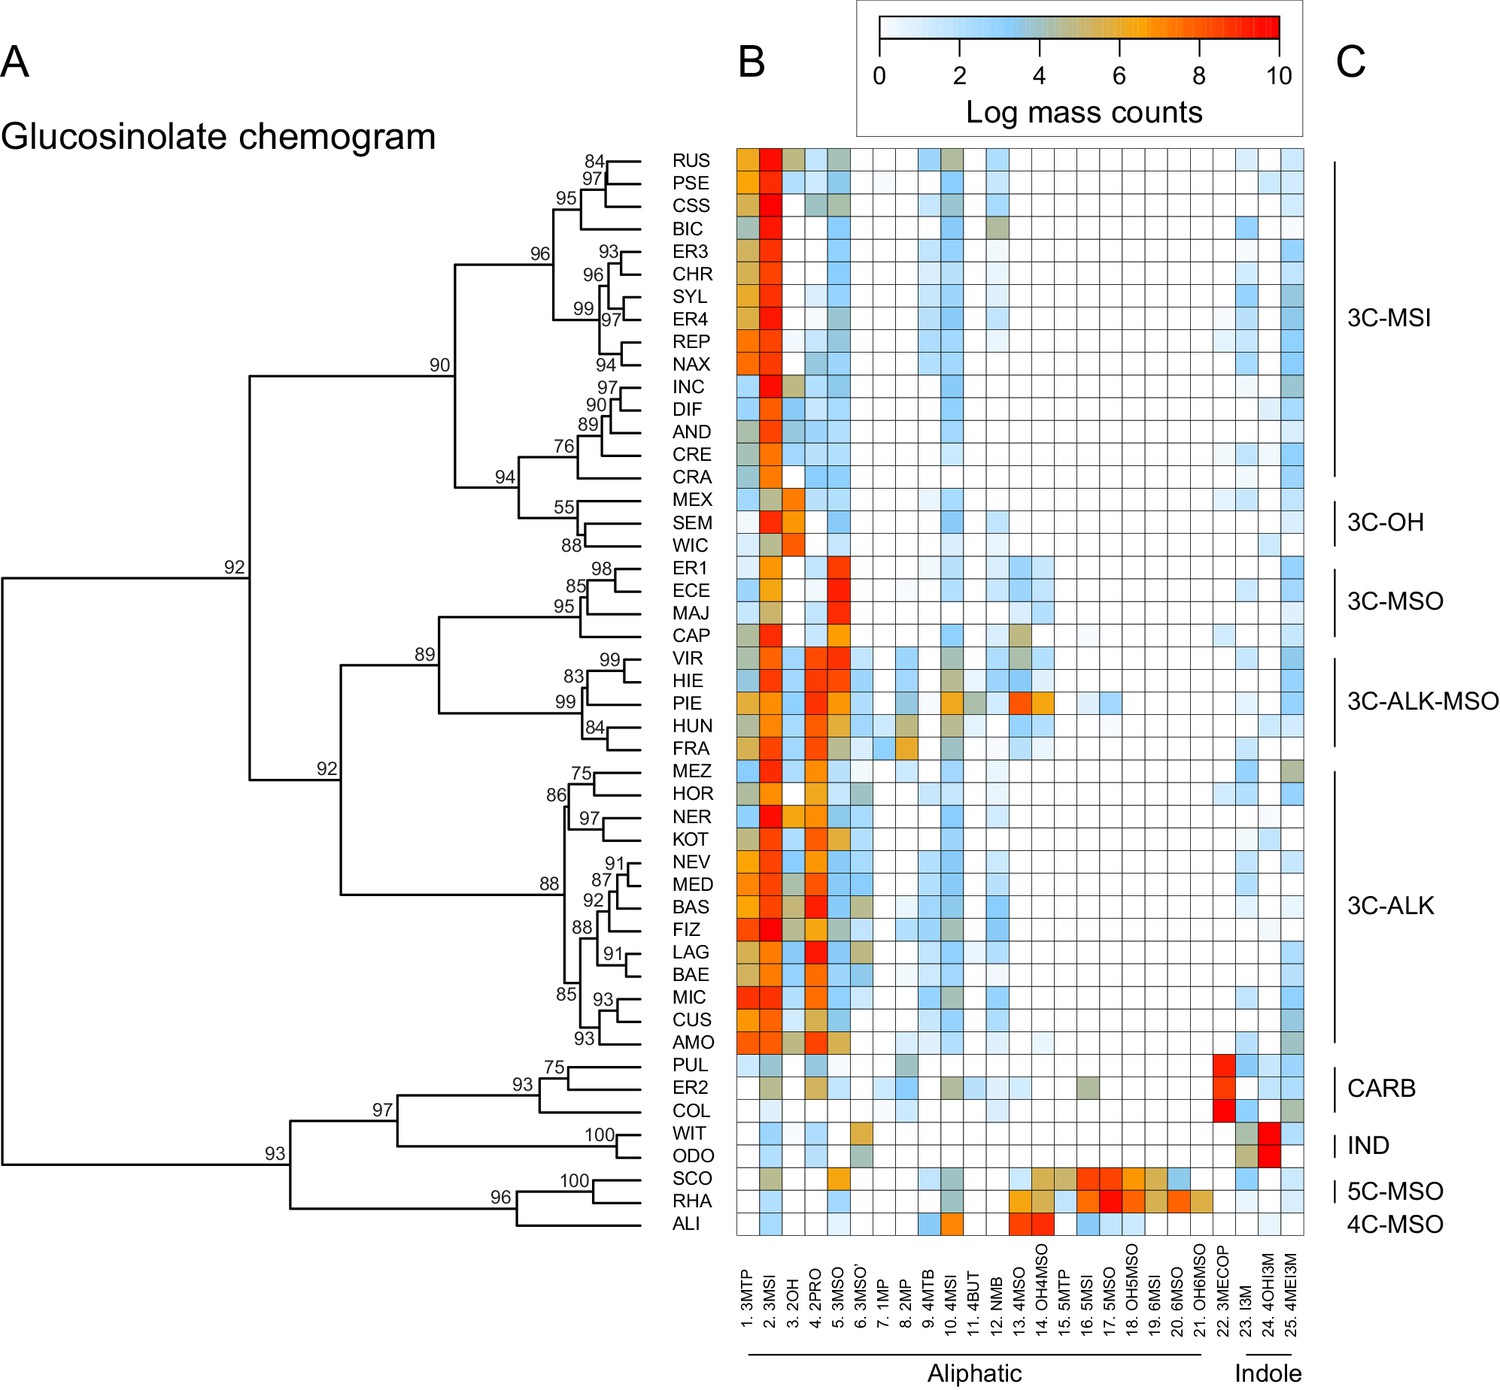
Glucosinolate compound diversity and abundance across 48 Erysimum species.
(A) Chemogram clustering species by dissimilarities in glucosinolate profiles. Values at nodes are confidence estimates (approximately unbiased probability value, function pvclust in R) based on 10,000 iterations of multiscale bootstrap resampling. (B) Heatmap of glucosinolate profiles expressed by the 48 Erysimum species. Color intensity corresponds to log-transformed integrated ion counts recorded at the exact parental mass ([M-H]-) for each compound, averaged across samples from multiple independent experiments. Compounds are grouped by major biosynthetic classes and labelled using systematic short names. See Supplementary file 6 for full glucosinolate names and additional compound information. (C) Classification of species chemotype based on predominant glucosinolate compounds. 3C/4C/5C = length of carbon side chain, MSI = methylsulfinyl glucosinolate, MSO = methylsulfonyl glucosinolate, OH = side chain with hydroxy group, ALK = side chain with alkenyl group, CARB = carboxylic glucosinolate, IND = indole glucosinolate.
Figure 8

Myrosinase activity of leaf extracts from 43 Erysimum species, grouped by glucosinolate chemotype.
Open circles are species means and black diamonds are chemotype means ± 1 SE. See also Figure 7 for chemotype information. 3C/4C/5C = length of carbon side chain, MSI = methylsulfinyl glucosinolate, MSO = methylsulfonyl glucosinolate, OH = side chain with hydroxy group, ALK = side chain with alkenyl group, CARB = carboxylic glucosinolate, IND = indole glucosinolate.
-
Figure 8—source data 1
Species means for myrosinase activity and glucosinolate chemotype classification.
- https://cdn.elifesciences.org/articles/51712/elife-51712-fig8-data1-v2.txt
Figure 9 with 2 supplements
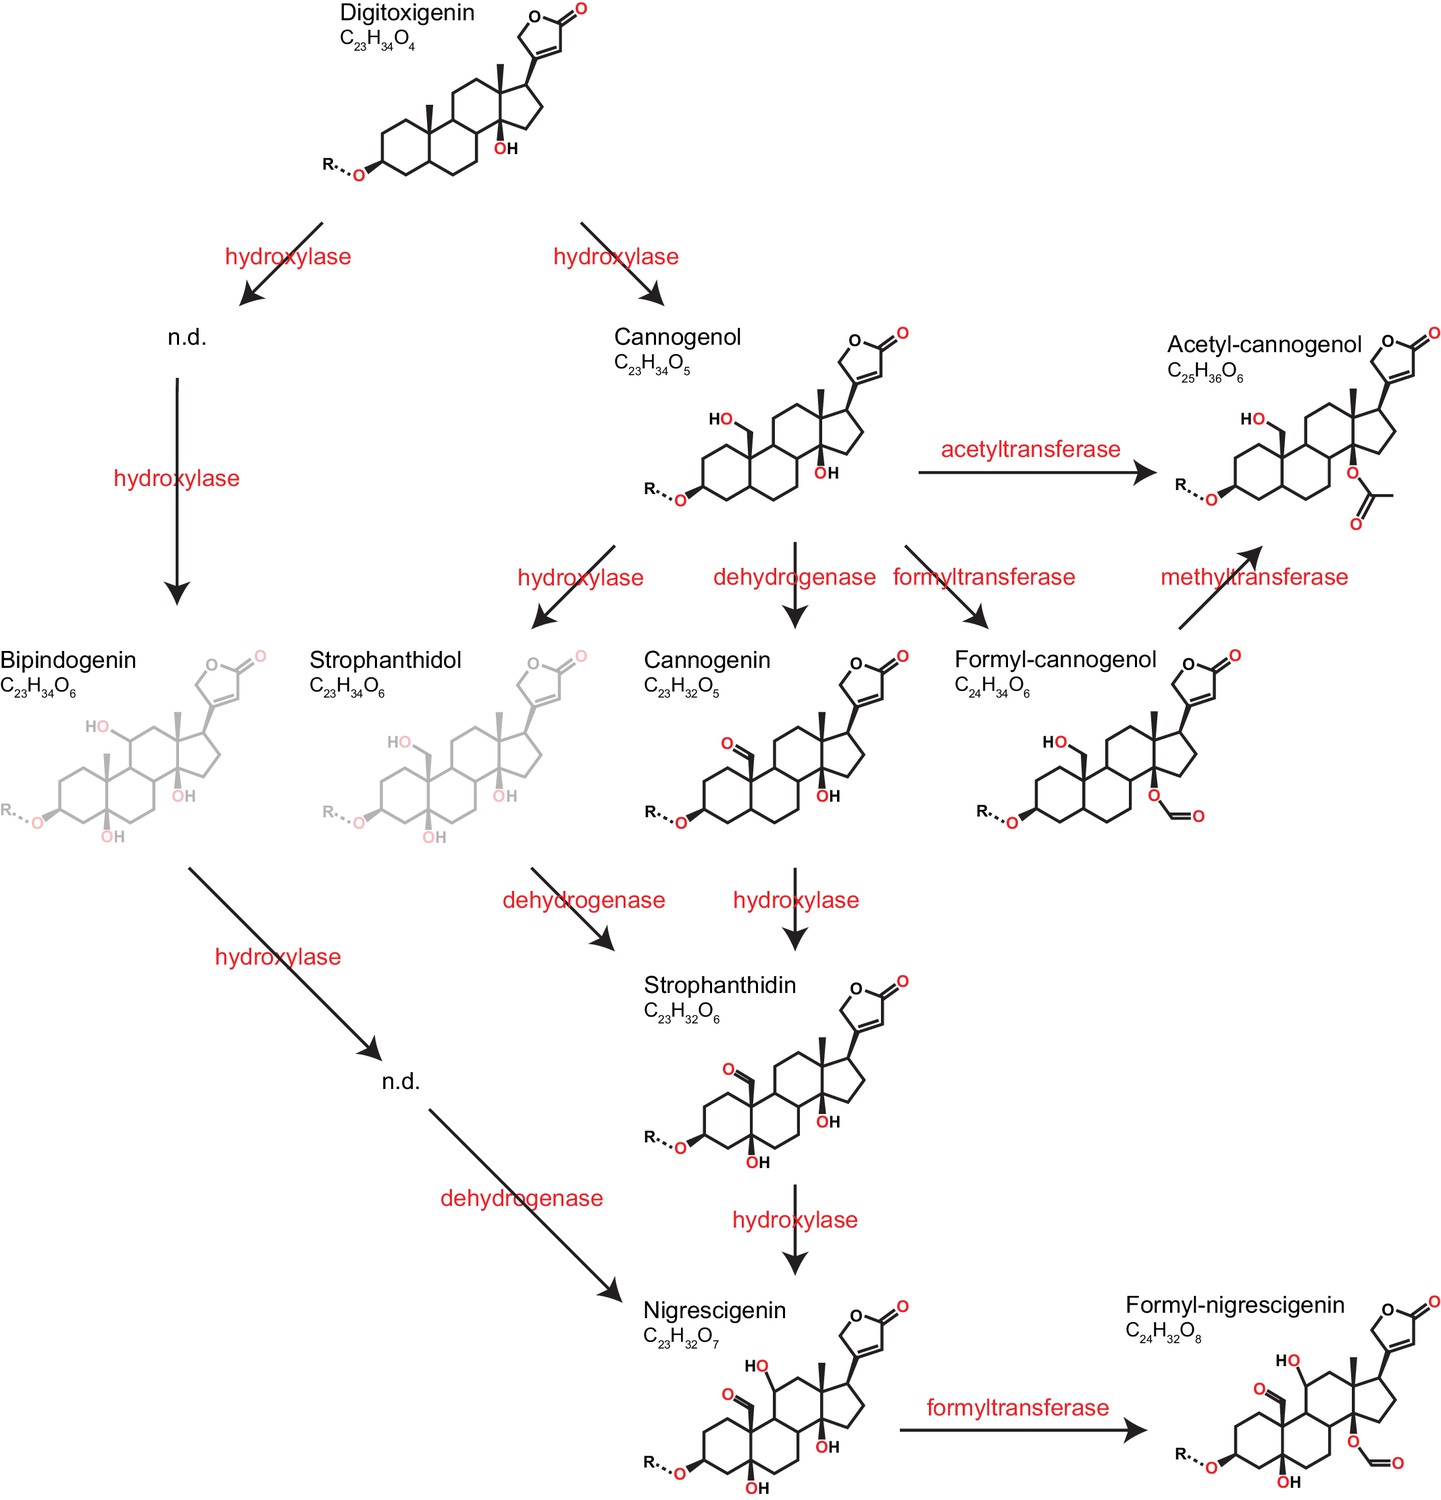
Predicted pathways of cardenolide genin modification in Erysimum.
Pathways are linearized for simplicity but more likely form a complex network. Genin diversity likely originates from digitoxigenin, which is transformed into more stucturally complex cardenolides by hydroxylases, dehydrogenases, and formyl-, methyl-, or acetyltransferases. Acetyl-cannogenol could be derived directly from cannogenol or from formyl-cannogenol, with the frequent co-occurrence of acetyl-cannogenol and formyl-cannogenol in leaf extracts suggesting the latter. According to their exact mass, frequently detected dihydroxy-digitoxigenin compounds (C23H34O6) could be either bipindogenin or strophanthidol (grayed out). While bipindogenin cardenolides have commonly been reported for Erysimum species in the literature, their structure would require additional intermediates that have not been detected (n.d.). Thus, strophanthidol appears to be the more likely isomer to occur in Erysimum. All cardenolide genins are further modified by glycosylation at a conserved position in the molecule (R). Note that all structures are putative, and particularly formyl- and acetyl-modifications could be attached to any free OH-group.
Figure 9—figure supplement 1
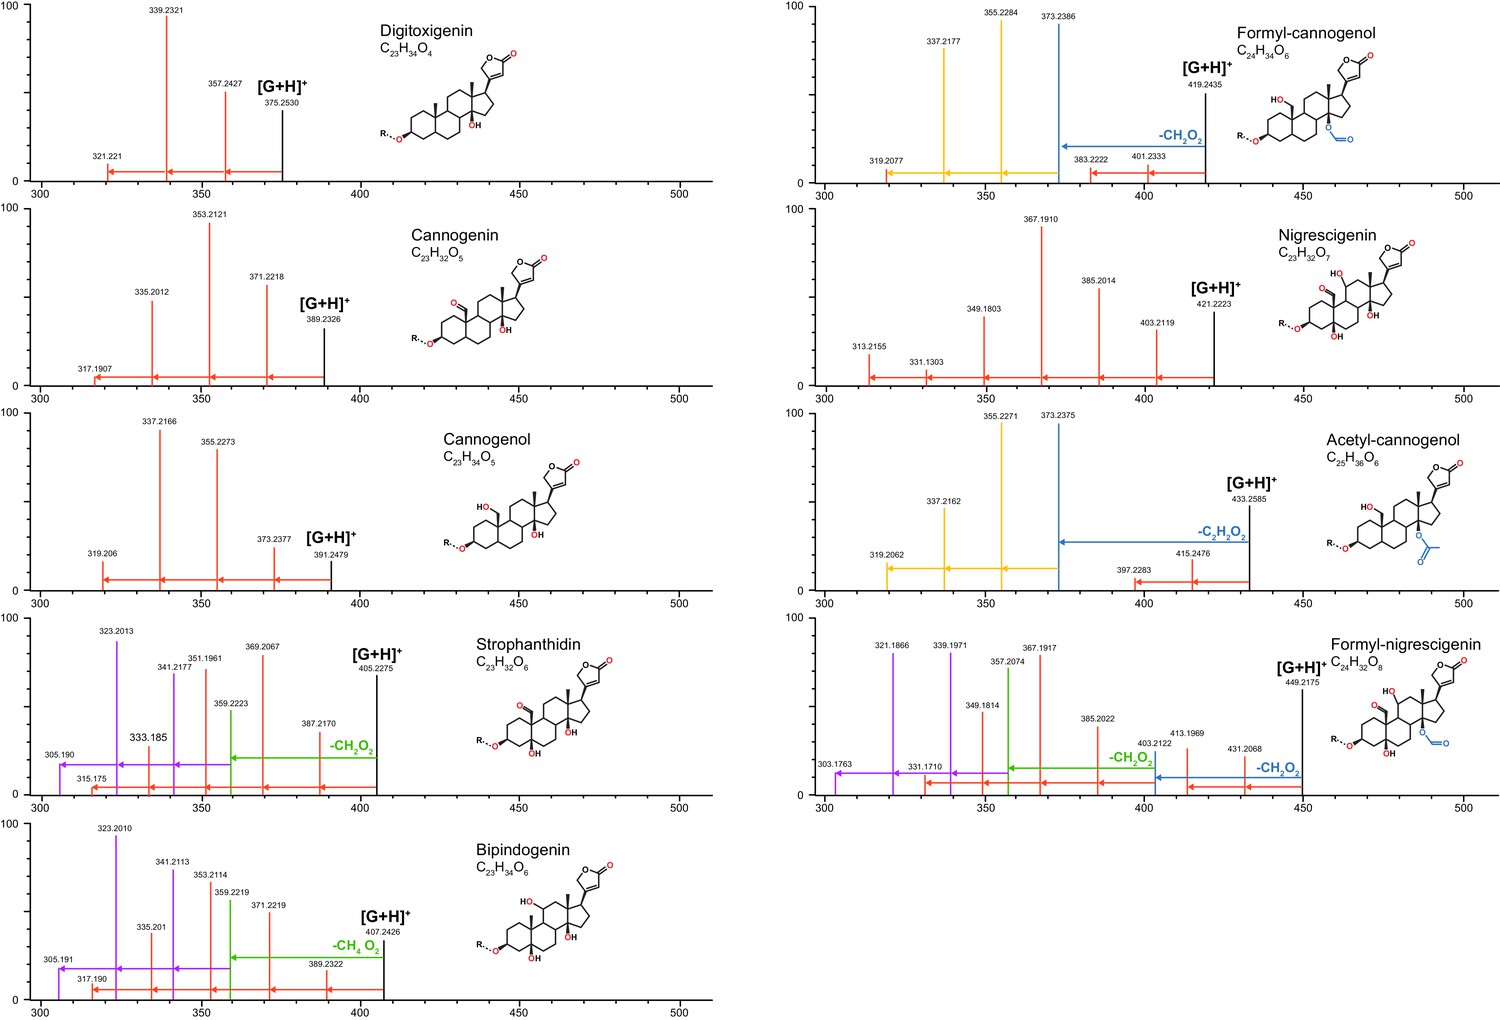
Characteristic MS fragmentation patterns of cardenolide genins used for putative identification of compounds.
Patterns are primarily generated by in-source fragmentation of compounds and are visible at standard MS conditions, but fragments are more abundant under MSE (high energy fragmentation) conditions. Height of vertical lines indicates relative ion intensities (in MSE) for representative compounds quantified in Erysimum spp. The mass and intensity of the intact genin ([G+H]+) in each panel is indicated by a vertical black line. Genin fragments are colored to highlight fragmentation series: red vertical lines linked by arrows represent serial losses of water molecules (−18.01 m/z per molecule), corresponding to the number of exposed OH groups of that molecule (red symbols). Acetyl and formyl groups are lost as intact units (blue lines/arrows and corresponding symbols), after which further loss of water molecules occurs (orange lines/arrows). In strophanthidin and bipindogenin, additional larger fragments are lost, perhaps by reconfiguration of the genin molecule (green lines/arrows), and again, further loss of water molecules occurs (purple lines/arrows). Fragmentation patterns for strophanthidin and digitoxigenin were confirmed by commercial standards. For remaining genins, likely identifications and structures were inferred from literature reports.
Figure 9—figure supplement 2
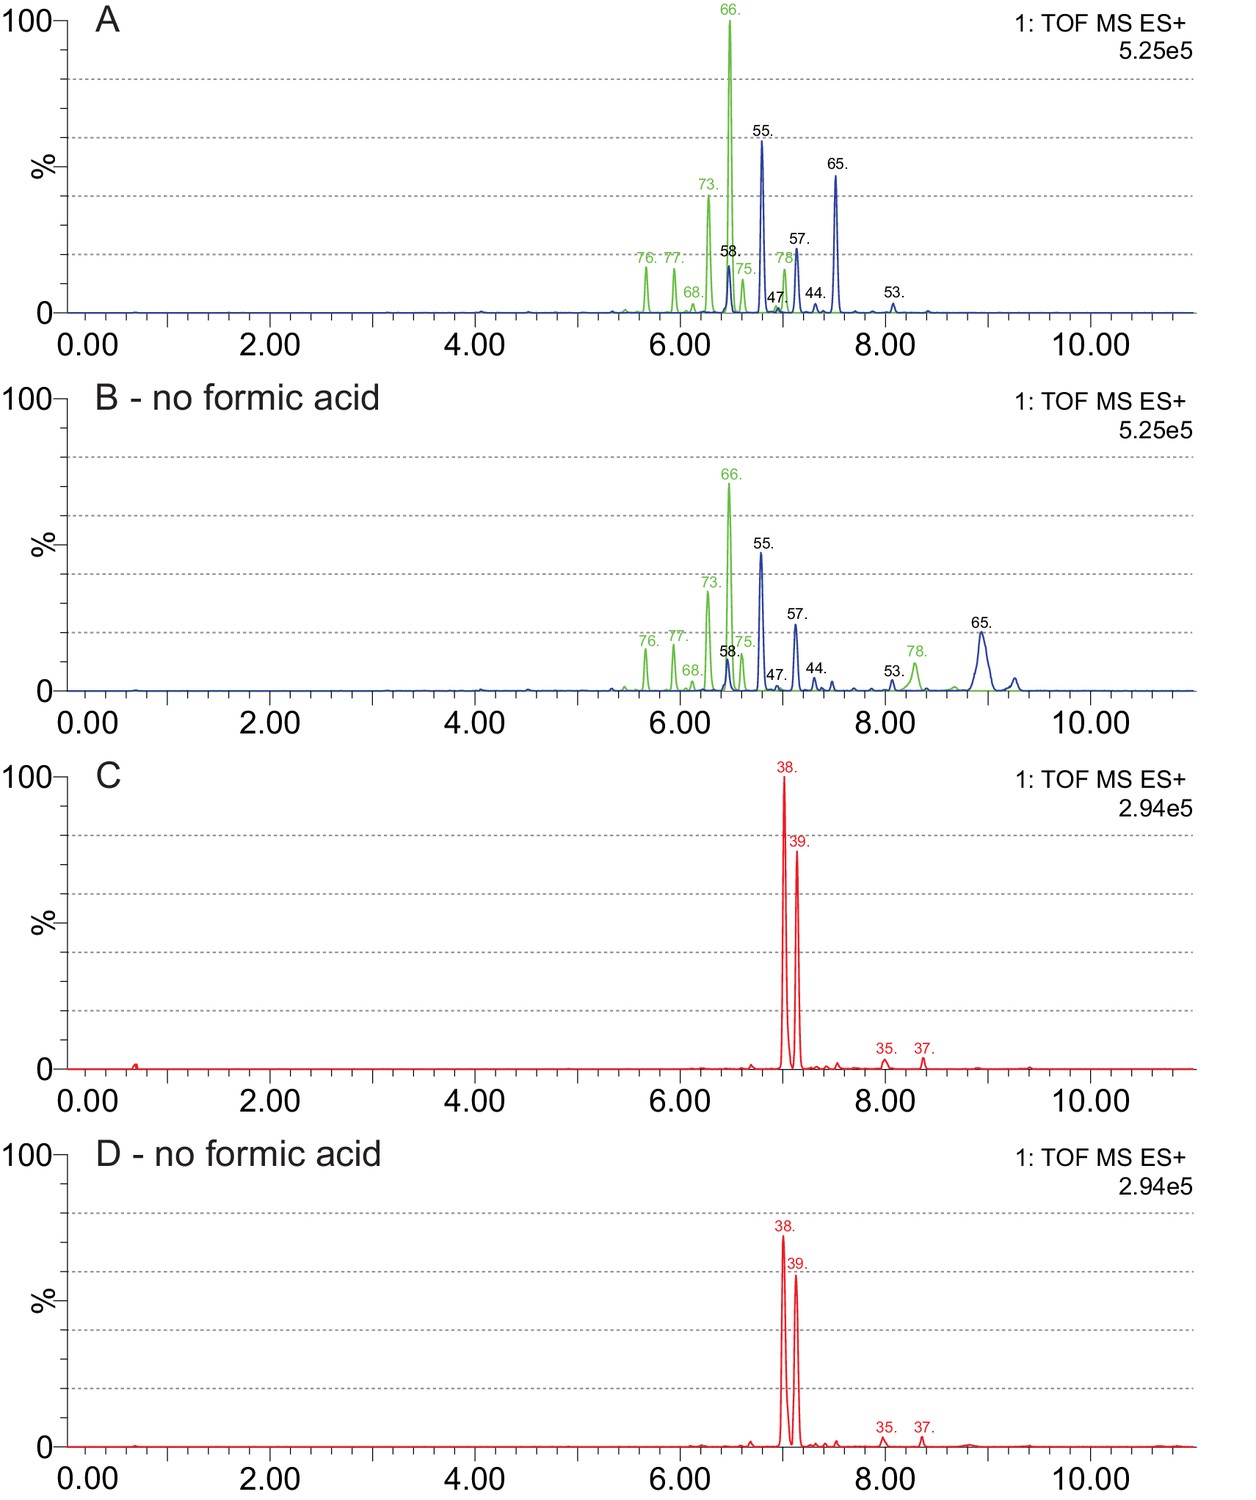
Effects of formic acid as a solvent additive in LC-MS analyses of cardenolide compounds.
(A–B) Chromatograms for the same leaf extract of E. bastetanum (BAS) analyzed with and without formic acid in the mobile phase. Shown are fragment traces for formyl-nigrescigenin (449.217 m/z, green) and strophanthidin (405.227 m/z, blue). Both panels share the same scale, and compounds are labelled according to the list in Supplementary file 7. Without formic acid, overall intensity is reduced, but glycosides of formyl-nigrescigenin are consistently detected. In contrast, two compounds with unusual adducts on their glycoside chain (#65 and #78, Supplementary file 7) appear to be changed by formic acid and were removed from the analysis. (C–D) Chromatograms for the same leaf extract of E. repandum (REP) analyzed with and without formic acid in the mobile phase. Shown are fragment traces for formyl-cannogenol (419.243 m/z, red). Both panels share the same scale, and compounds are labelled according to the list in Supplementary file 7.
Figure 10

Cardenolide compound diversity and abundance accross 48 Erysimum species.
(A) Chemogram clustering species by dissimilarities in cardenolide profiles. Values at nodes are confidence estimates (approximately unbiased probability value, function pvclust in R) based on 10,000 iterations of multiscale bootstrap resampling. (B) Heatmap of cardenolide profiles expressed by the 48 Erysimum species. Color intensity corresponds to log-transformed integrated ion counts recorded at the exact parental mass ([M+H]+ or [M+Na]+, whichever was more abundant) for each compound, averaged across samples from multiple independent experiments. The species E. collinum (COL) only expressed trace amounts of cardenolides, which are not visible on the color scale. Compounds are grouped by shared genin structures. Cgi. = Cannogenin, For-can.=Formyl cannogenol, Ac-can.=Acetyl cannogenol. See Supplementary file 7 for additional compound information.
Figure 11
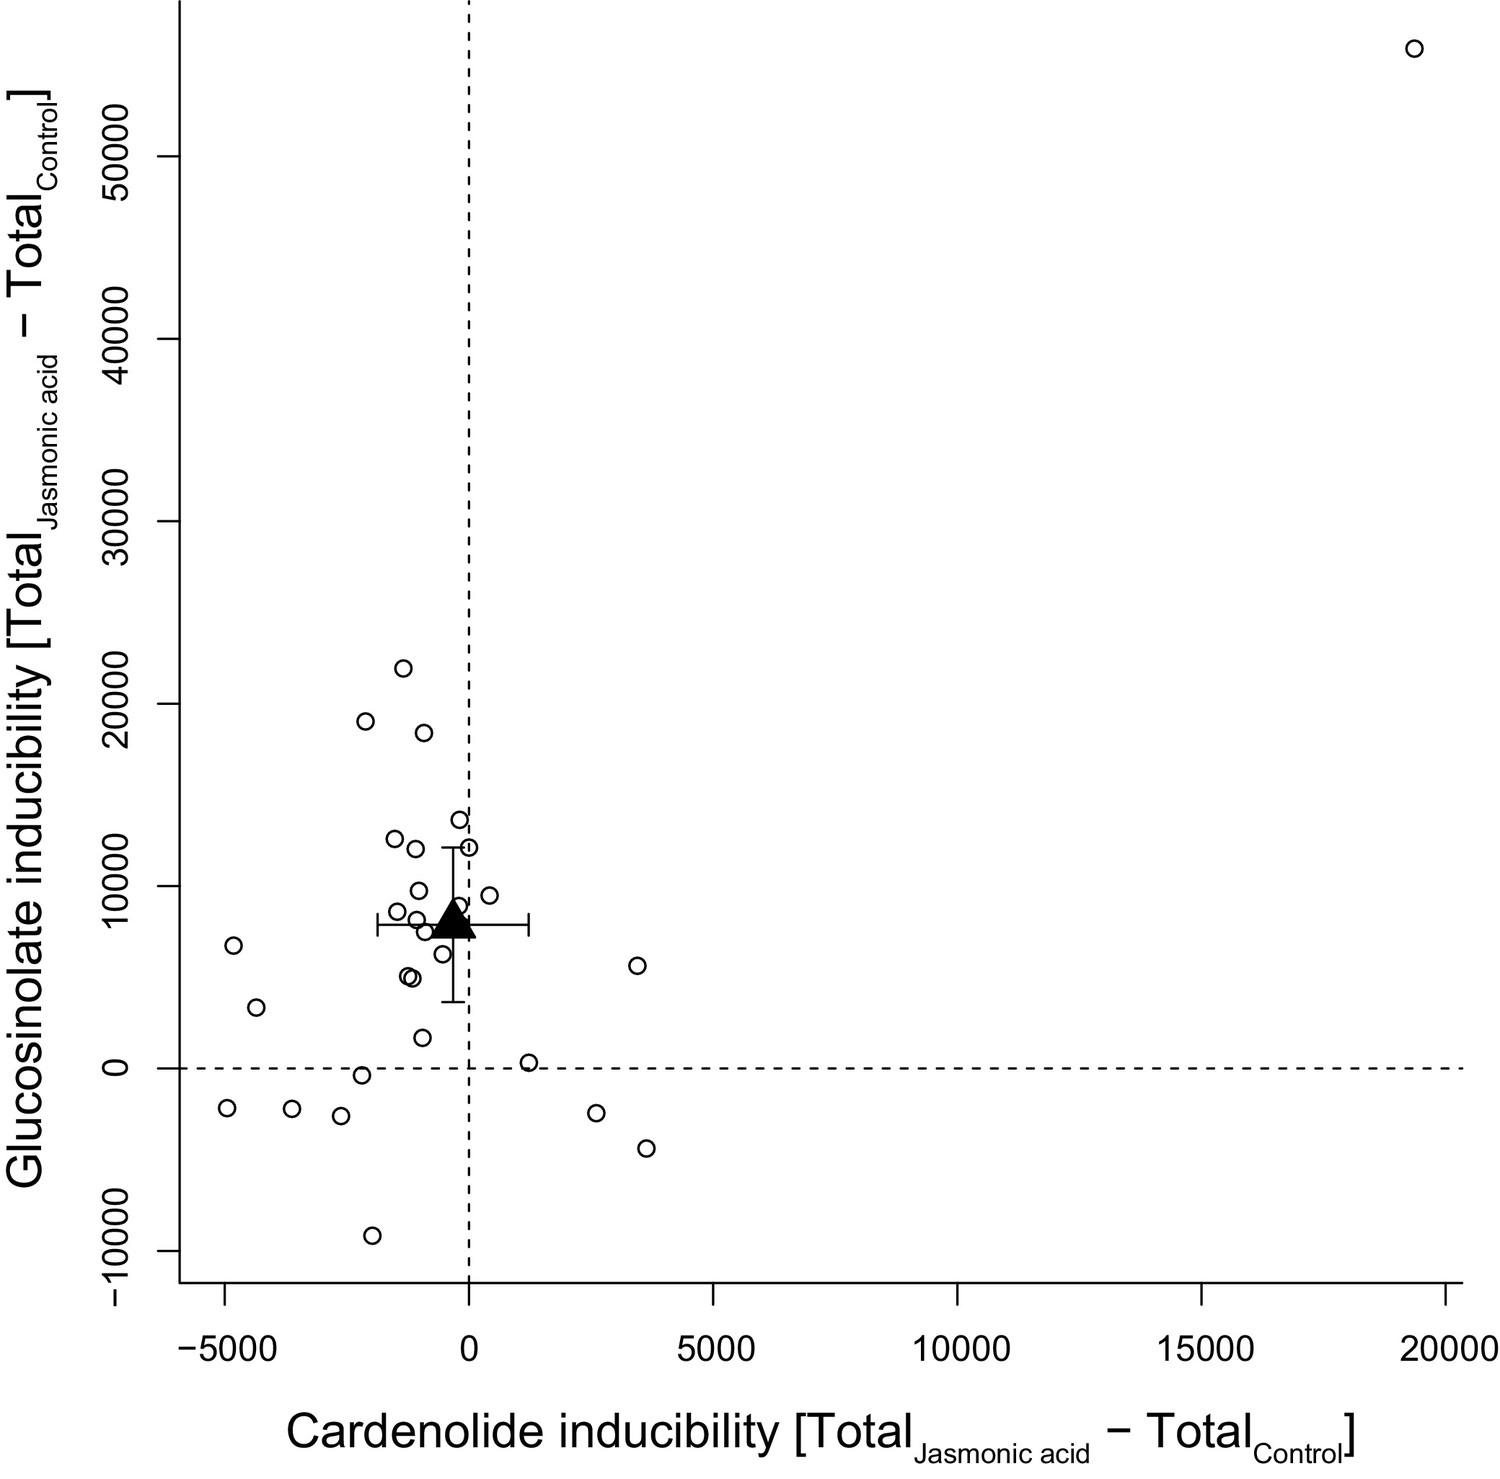
Inducibility of foliar glucosinolates and cardenolides in response to exogenous application of jasmonic acid (JA), expressed as absolute differences in total mass intensity between JA-treated and control plants.
Circles are species means, based on single pooled samples of multiple individual plants. The filled triangle is the average inducibility of all measured species with 95% confidence interval. Non-overlap with zero (dashed lines) corresponds to a significant effect. The species in the upper right corner is E. crepidifolium, an outlier and strong inducer of both glucosinolates and cardenolides.
-
Figure 11—source data 1
Species means for absolute inducibility of total glucosinolate and cardenolide concentrations.
- https://cdn.elifesciences.org/articles/51712/elife-51712-fig11-data1-v2.txt
Tables
Table 1
Assembly metrics for the E. cheiranthoides genome: v0.9=Falcon +Arrow assembly results, v1.2=genome assembly after Hi-C scaffolding and Pilon correction.
| v0.9 | v1.2 pseudomolecules and contigs | v1.2 pseudomolecules only | |
|---|---|---|---|
| total length (Mbp) | 177.4 | 177.2 | 174.5 |
| expected size (Mbp) | 205 | 205 | 205 |
| number of contigs | 1087 | 224 | 8 |
| N50 (Mbp) | 1.5 | 22.4 | 22.4 |
| complete BUSCOs (out of 1,375) | 1359 | 1346 | 1356 |
| complete and single copy BUSCOs (out of 1,375) | 1271 | 1300 | 1306 |
| complete and duplicated BUSCOs (out of 1,375) | 88 | 46 | 50 |
| fragmented BUSCOs (out of 1,375) | 5 | 8 | 6 |
| missing BUSCOs (out of 1,375) | 11 | 21 | 13 |
Table 2
Measure of phylogenetic signal for total defensive traits and principal coordinates of the cardenolide and glucosinolate dissimilarity matrices (PCO) using Blomberg’s K. Significant values (p<0.05) are highlighted in bold.
| Plant trait | K statistics | p-value (10,000 simulations) |
|---|---|---|
| Glucosinolate PCO1 (18.8%) | 0.86 | 0.038 |
| Glucosinolate PCO2 (13.6%) | 0.80 | 0.090 |
| Total glucosinolate concentrations | 0.81 | 0.076 |
| Number of glucosinolate compounds | 0.89 | 0.014 |
| Myrosinase activity | 0.88 | 0.038 |
| Cardenolide PCO1 (16.6%) | 1.79 | <0.001 |
| Cardenolide PCO2 (12.2%) | 1.04 | 0.002 |
| Total cardenolide concentrations | 1.03 | 0.015 |
| Number of cardenolide compounds | 1.25 | <0.001 |
Table 3
Correlations between plant traits and tip-specific speciation rates estimated from the main ExaML species tree.
Each trait is correlated against two estimates of speciation rates using phylogenetic least squares (PGLS) and a simulation-based method (SIM). Node density (ND) and equal split (ES) estimates of speciation rates are strongly correlated (r = 0.767, p<0.001) but differ in relative weighting of recent and more distant evolutionary history. For 1000 sets of randomly generated traits, only three resulted in more than one significant correlation, suggesting that multiple significant tests per trait (bold) are unlikely to arise by chance.
| Nd-pgls | Nd-sim | Es-pgls | Es-sim | |
|---|---|---|---|---|
| Total glucosinolate concentrations | F1,46 = 0.79, p=0.379 | rPearson = 0.29, p=0.300 | F1,46 = 0.00, p=0.990 | rPearson = 0.09, p=0.737 |
| Number of glucosinolate compounds | F1,46 = 1.16, p=0.286 | rPearson = 0.23, p=0.412 | F1,46 = 0.87, p=0.356 | rPearson = 0.14, p=0.603 |
| Total cardenolide concentrations | F1,46 = 0.29, p=0.593 | rPearson = 0.25, p=0.373 | F1,46 = 0.01, p=0.908 | rPearson = 0.23, p=0.398 |
| Number of cardenolide compounds | F1,46 = 5.87, p=0.019 | rPearson = 0.53, p=0.030 | F1,46 = 1.93, p=0.17 | rPearson = 0.42, p=0.093 |
Additional files
-
Supplementary file 1
Origin of Erysimum species and seed material.
- https://cdn.elifesciences.org/articles/51712/elife-51712-supp1-v2.docx
-
Supplementary file 2
Repetitive sequences and transposable elements in the E. cheiranthoides genome.
- https://cdn.elifesciences.org/articles/51712/elife-51712-supp2-v2.docx
-
Supplementary file 3
Transcriptome assembly metrics.
- https://cdn.elifesciences.org/articles/51712/elife-51712-supp3-v2.docx
-
Supplementary file 4
Discordance metrics for the ASTRAL phylogeny.
- https://cdn.elifesciences.org/articles/51712/elife-51712-supp4-v2.docx
-
Supplementary file 5
Discordance metrics for the ExaML phylogeny.
- https://cdn.elifesciences.org/articles/51712/elife-51712-supp5-v2.docx
-
Supplementary file 6
List of identified glucosinolate compounds.
- https://cdn.elifesciences.org/articles/51712/elife-51712-supp6-v2.docx
-
Supplementary file 7
List of identified cardenolide compounds.
- https://cdn.elifesciences.org/articles/51712/elife-51712-supp7-v2.docx
-
Transparent reporting form
- https://cdn.elifesciences.org/articles/51712/elife-51712-transrepform-v2.docx
Download links
A two-part list of links to download the article, or parts of the article, in various formats.
Downloads (link to download the article as PDF)
Open citations (links to open the citations from this article in various online reference manager services)
Cite this article (links to download the citations from this article in formats compatible with various reference manager tools)
Independent evolution of ancestral and novel defenses in a genus of toxic plants (Erysimum, Brassicaceae)
eLife 9:e51712.
https://doi.org/10.7554/eLife.51712


