Reversal of contractility as a signature of self-organization in cytoskeletal bundles
- Université Paris-Saclay, CNRS, LPTMS, France
- PMMH, CNRS, ESPCI Paris, PSL University, Sorbonne Université, Université de Paris, France
Figures
Figure 1
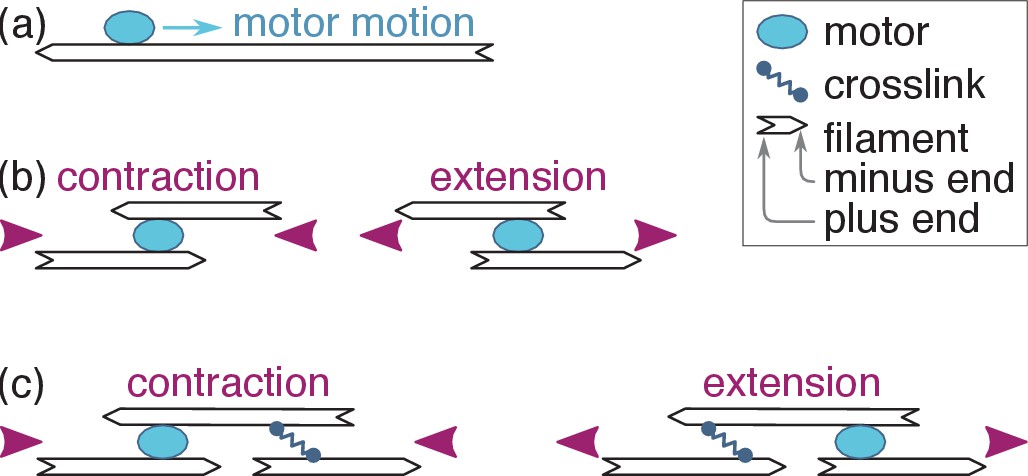
Active motor-filament bundle dynamics involves a competition between contraction and extension.
(a) Motors bind filaments and move towards their plus ends. (b) This motion results in local contraction or extension depending on the local arrangement of the filaments. (c) In a full bundle, a given filament arrangement can generate contraction or extension depending on the localization of the motors and crosslinks. The present work shows that motor and crosslink self-organization can bring about either outcome.
Figure 2
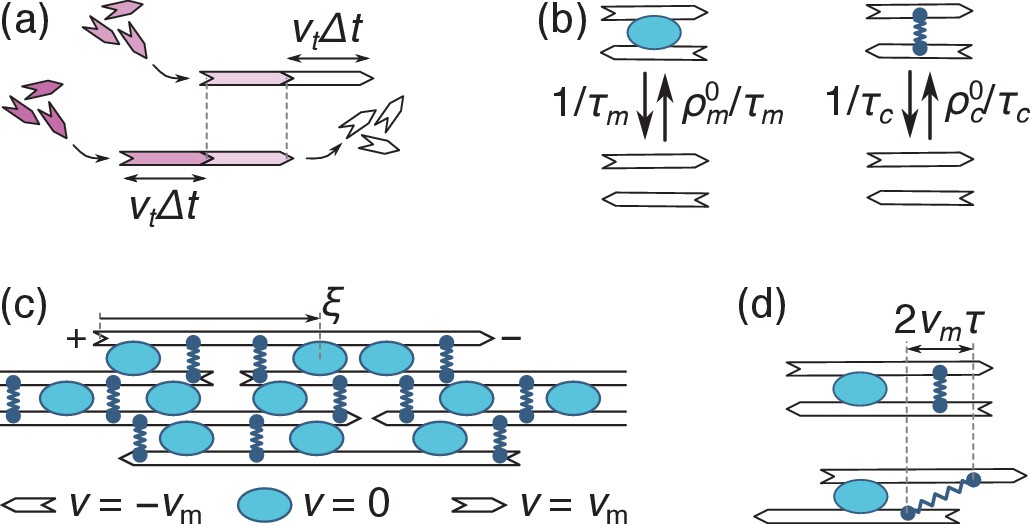
Principles of filament, motor and cross-link dynamics.
(a) Simultaneous polymerization at the plus end (incoming purple monomers) and depolymerization from the minus end (outgoing white monomers) induce a leftwards ‘treadmilling’ motion of the filament. The top and bottom images respectively correspond to times and . (b) Motors come on and off a pair of filaments with constant rates (on the left), and so do crosslinks (on the right). (c) In an assembly of identical filaments of mixed polarities where motors slide with a velocity , a right-(left-)pointing filament moves with a velocity () relative to any motor. Note that the coordinate is measured from the filament’s plus end. (d) Crosslinks that remain bound to two antiparallel filaments throughout this dynamics stretch with a velocity (the top and bottom panels represent the same system with a time interval ).
Figure 3
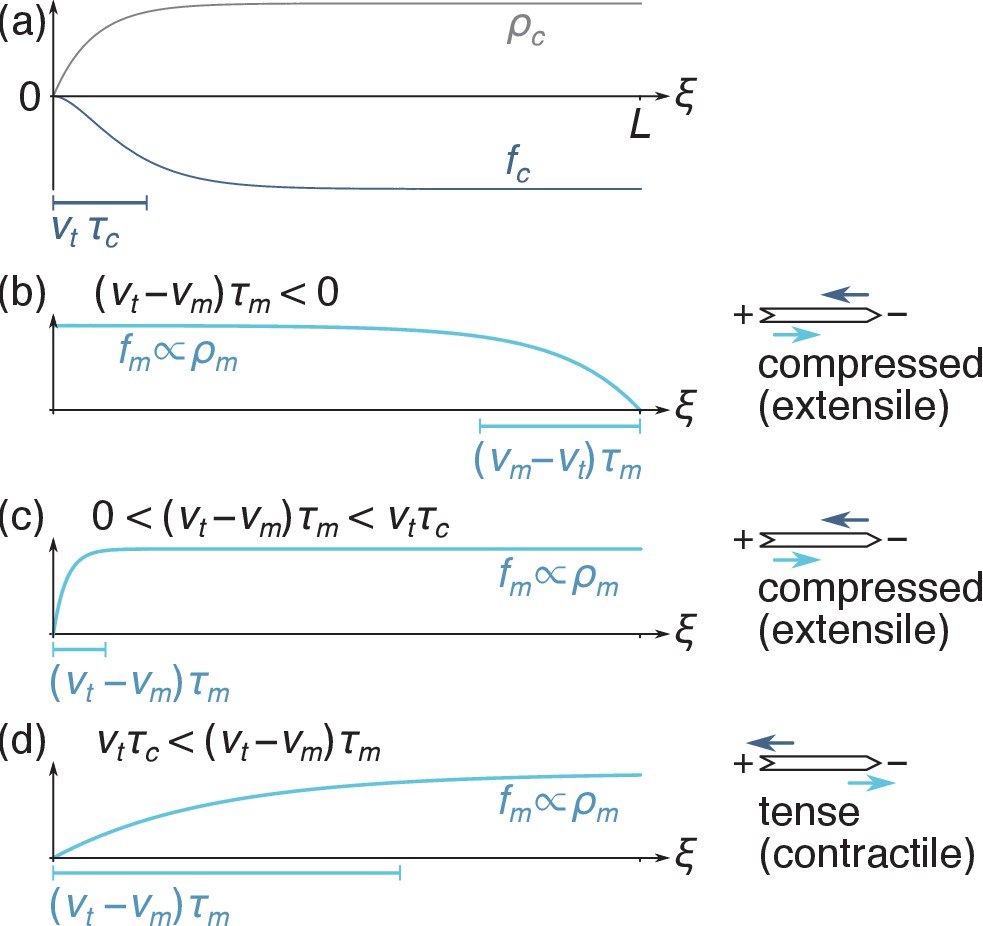
Filament force density profiles as in Equation 3.
(a) The crosslink density is suppressed near the plus end, implying that the crosslink force is predominantly applied to the right-hand-side of the filament. (b) When motors are faster than treadmilling (), they are depleted from the minus end and right-directed motor forces are predominantly applied on the left-hand side of the filament. As schematized on the right-hand-side, the fact that the crosslink force (dark blue arrow) is applied more to the right than the motor force (light blue arrow) implies that the filament is under compression. (c) When barely exceeds , motor forces are applied relatively uniformly over the filament, which also results in filament compression. (d) When , the motor depletion zone is larger than the crosslink depletion zone and motor forces are significantly shifted to the right. The filament is tensed in that case.
Figure 4
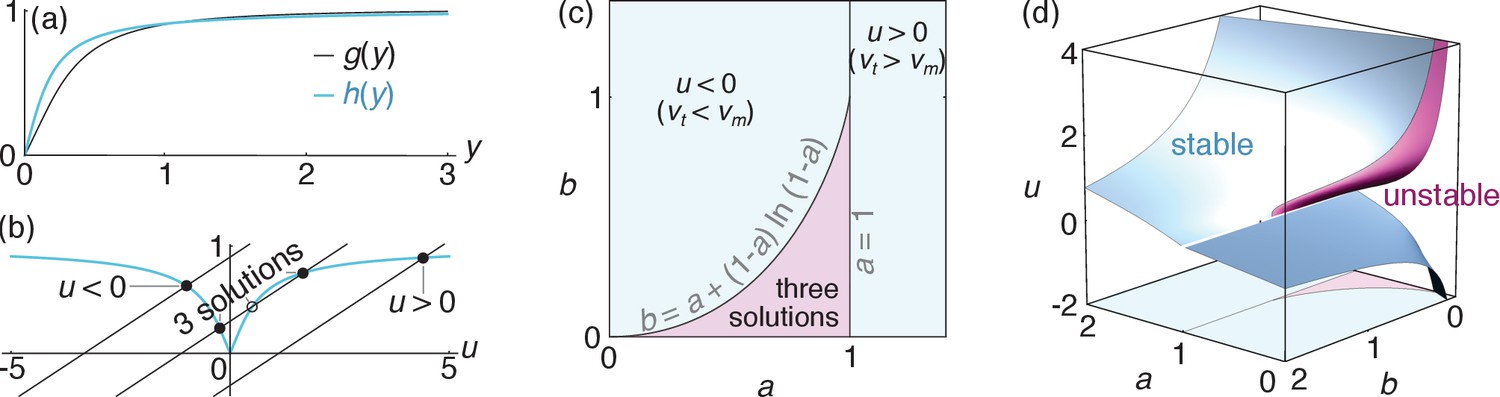
Velocity selection in the bundle.
(a) Profiles of the functions and , both of which go monotonically from 0 to 1 as goes from 0 to +∞. (b) Graphical illustration of the velocity selection condition Equation 4 as the intersection between two curves. The blue curve represents the left-hand side of Equation 4, and the black lines represent three possible parameter regimes for the right-hand side (here b = 0.27 and a = 0.1, 0.7 and 1.3 from left to right). Solid (open) circles represent stable (unstable) solutions. (c) Phase diagram presenting these three regimes as a function of parameters and . (d) Values of the rescaled apparent filament velocity selected by the system, with colors indicating the stability of the solutions. The phase diagram of panel (c) is reproduced on the bottom face of the plot to facilitate comparisons.
Figure 5

Bundle tension.
(a) Level curves for the dimensionless bundle tension as a function of the apparent velocity determined from Equation 4 and pictured in Figure 4d, and the ratio . The purple line separates contraction from extension. (b) Contraction regimes associated with the stable solution (purple surface) and velocity regimes as in Figure 4c (blue surfaces) as a function of the dimensionless parameters , and . The blue surfaces are plotted separately on the bottom left to facilitate visualization (axes are as in the main figure), and cuts through the 3D diagram are shown in the appendix. As discussed above the ‘three solutions’ regime comprised between these two surfaces has coexisting stable and solutions. The light blue line outlines the intersection between the two blue surfaces. The dashed line materializes one set of reasonable experimental parameters (see text), and goes from to through the coexistence (‘three solutions’) region, implying a first-order transition. By contrast, a similar vertical line shifted to smaller values of would describe a second-order transition.
Figure 6
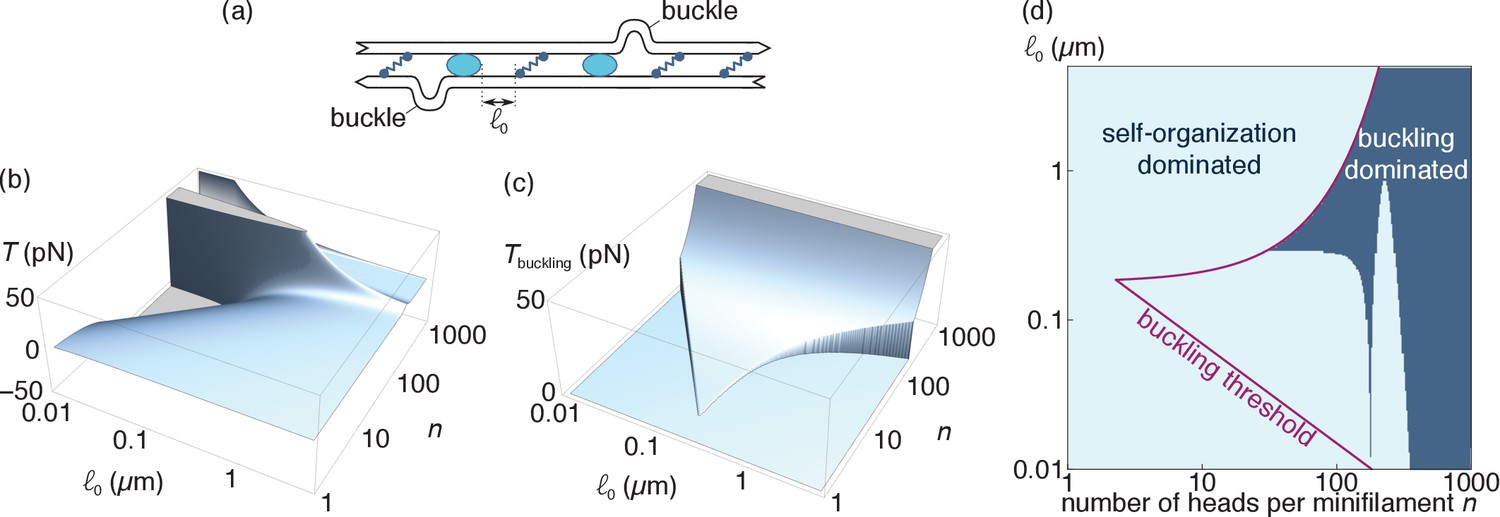
Comparison of the self-organization and buckling mechanisms (relevant for actin).
(a) At length scales of the order of the distance between consecutive motors and crosslinks (i.e., much smaller than those considered in the main text), filament buckling can generate an additional source of bundle contraction (Lenz et al., 2012a) (b). Specifically, the random juxtaposition of motors and crosslinks within a bundle create regions of alternating compressive and extensile stresses along individual filaments, which can result in filament buckling if the compressive forces exceed the buckling threshold of a filament section. Following buckling, the bent part of the filament becomes essentially irrelevant elastically and the tensile force exerted by the motor on the non-buckled filament sets the tension of the bundle. (b) Tension per filament induced by the self-organization mechanism and (c) the buckling mechanism. Note that can take both positive and negative values, denoting contraction and extension respectively, while is always positive. We set to zero outside of the interval where buckling is allowed. (d) Bounds of the interval where buckling is allowed (purple line) and the parameter regimes where (light blue region).
Figure 7
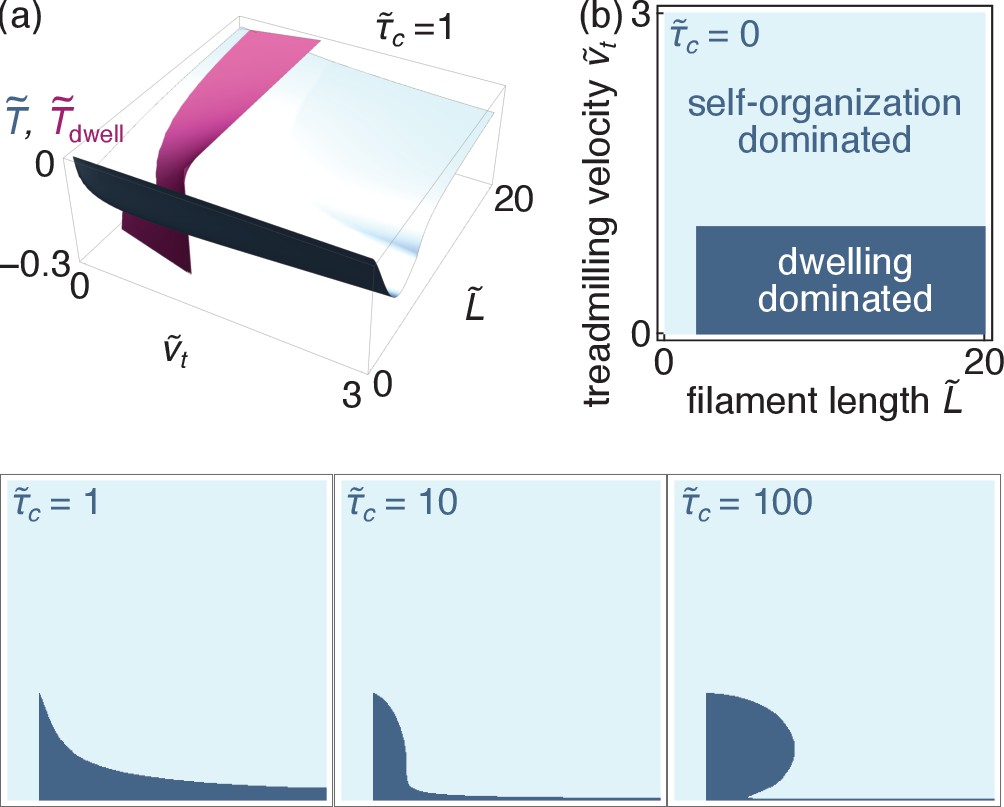
Comparison of the self-organization and dwelling mechanisms (relevant for microtubules).
(a) Dimensionless tensions induced by the self-organization (blue) and the dwelling (purple) mechanisms for . (b) Parameter regimes where either regime dominates for different values of (all four panels use identical axes).
Appendix 1—figure 1

Cuts through Figure 5b along constant- planes.
Additional files
Download links
A two-part list of links to download the article, or parts of the article, in various formats.
Downloads (link to download the article as PDF)
Open citations (links to open the citations from this article in various online reference manager services)
Cite this article (links to download the citations from this article in formats compatible with various reference manager tools)
Reversal of contractility as a signature of self-organization in cytoskeletal bundles
eLife 9:e51751.
https://doi.org/10.7554/eLife.51751


