A MAC2-positive progenitor-like microglial population is resistant to CSF1R inhibition in adult mouse brain
- Gladstone Institute of Neurological Diseases, United States
- Helen and Robert Appel Alzheimer’s Disease Institute, Brain and Mind Research Institute, Weill Cornell Medicine, United States
- Neuroscience Graduate Program, University of California, San Francisco, United States
- Medical Scientist Training Program, University of California at San Francisco, United States
Figures
Figure 1 with 4 supplements
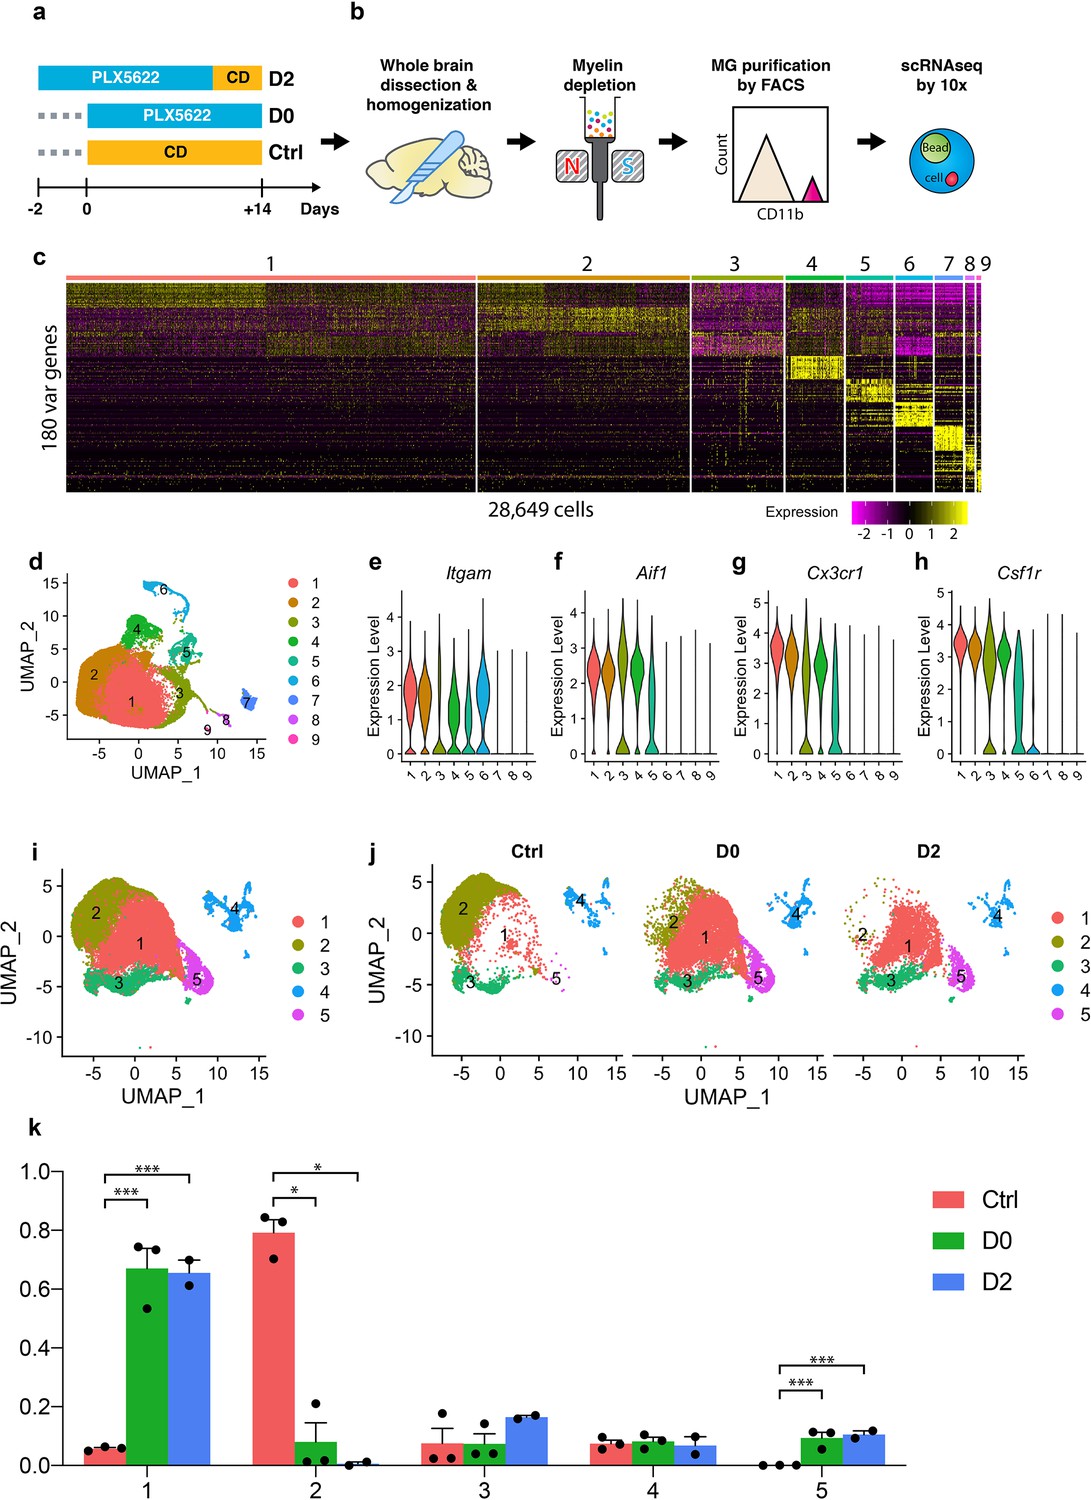
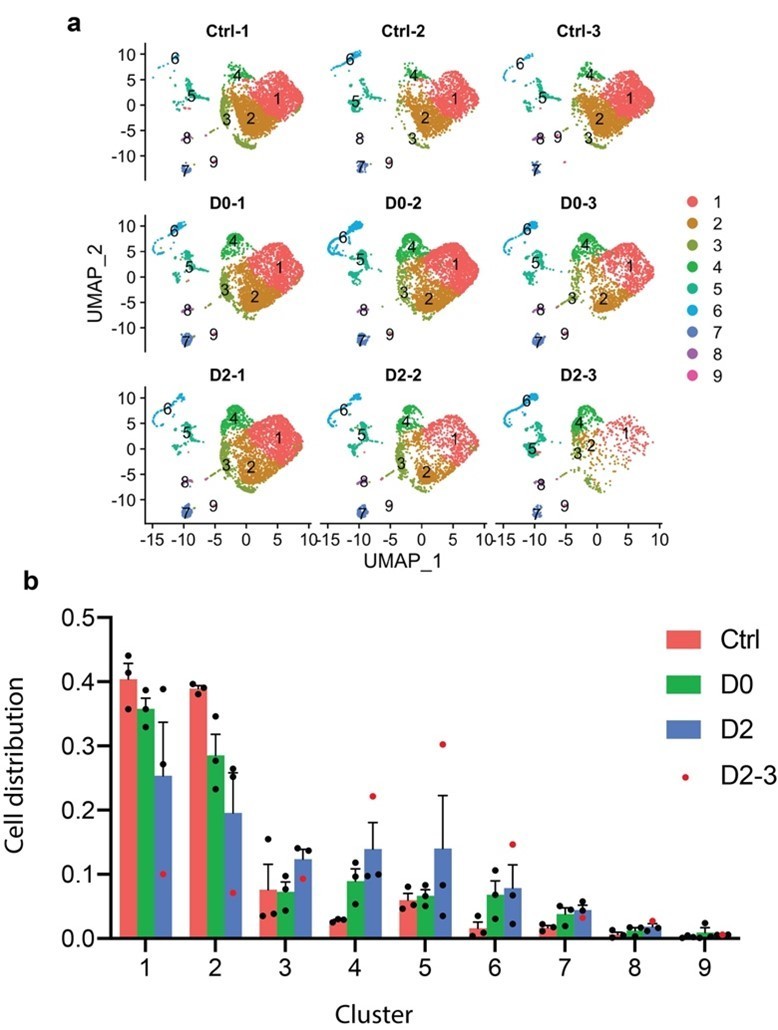
Single-cell RNA-seq profiling of microglia under CSF1R inhibition and early repopulation.
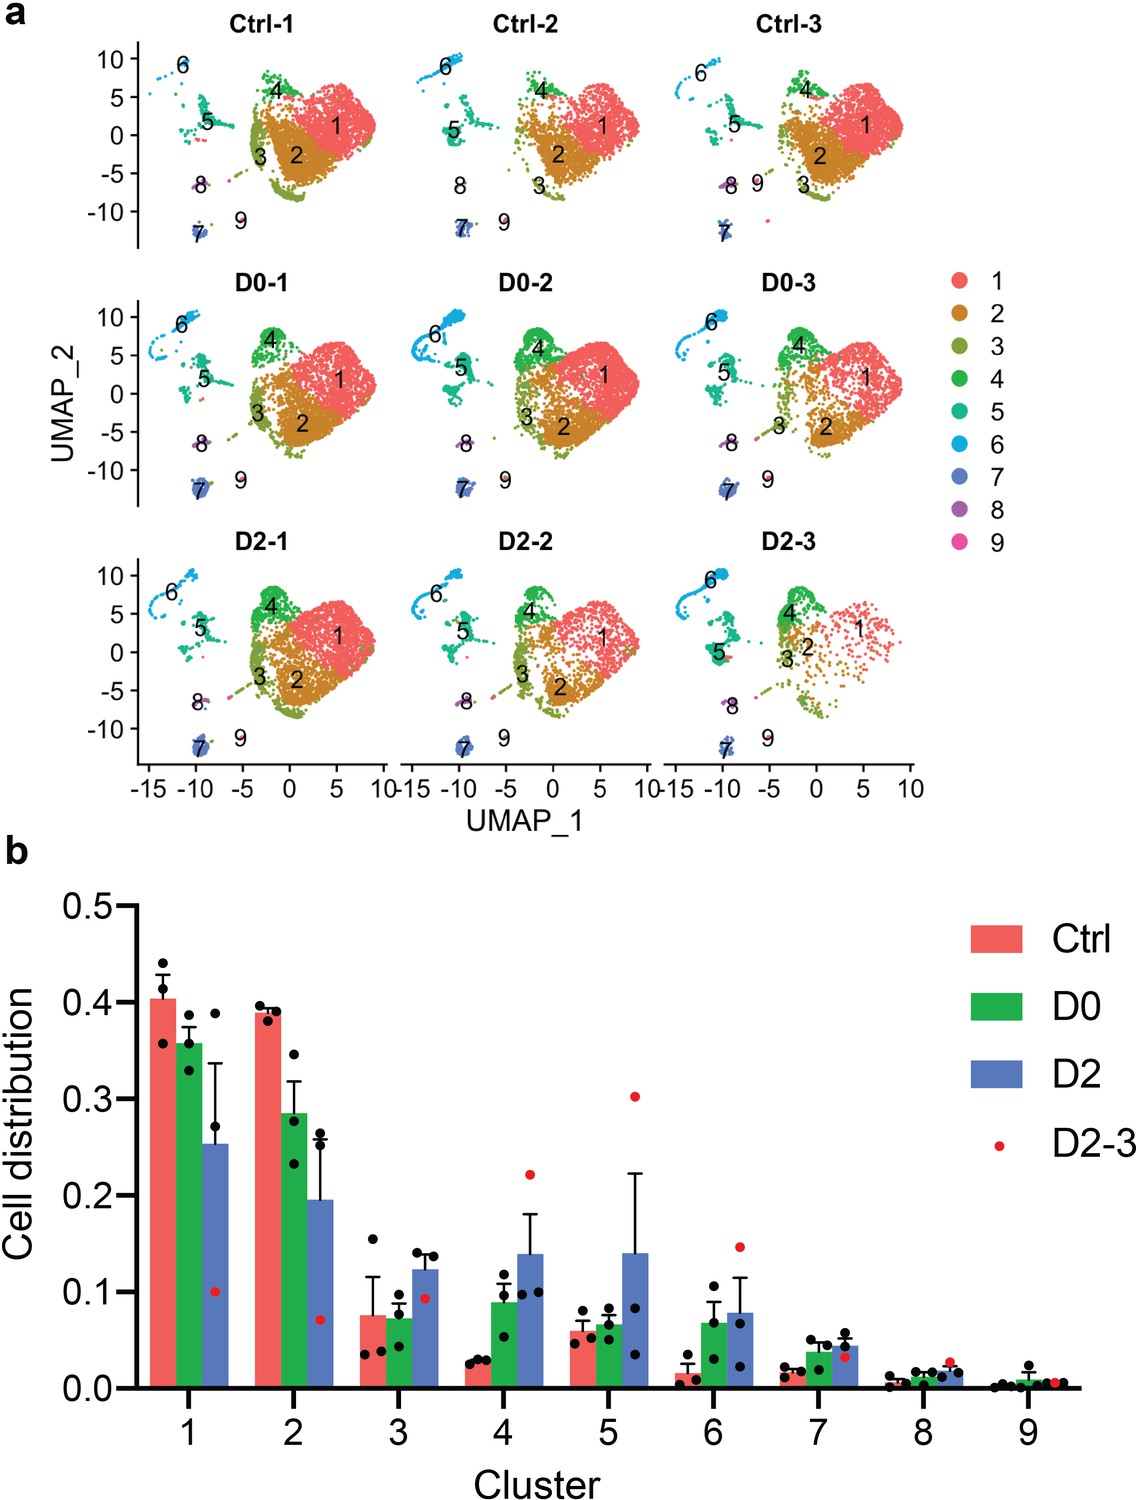
(a) Experimental design for microglia depletion and repopulation. Mice were placed on PLX diet (1200 mg/kg) for 14 days to deplete microglia (D0). The early stage microglial repopulation (D2) group was switched to control diet (CD) for 2 days. Microglia from each mouse were collected on the same day. A total of 15 female C57BL/6J mice (5 Mo) were used: Ctrl (n = 3); D0 (n = 6, two brains pooled together for FACS); D2 (n = 4, two brains pooled together for FACS); (b) Workflow of adult microglia isolation procedures for scRNA-seq capture. Detailed description in methods. (c) Heatmap showing the top 180 variable genes detected from 28,649 cells after initial data filtering. (d) UMAP plot showing nine distinctive clusters identified from the scRNA-seq data. (e–h) Violin plot showing expression of Itgam, Aif1, Cx3cr1, and Csf1r in all clusters. Clusters 6, 7, 8, and 9 were removed from downstream data analysis. (i) Reclustered UMAP after removal of clusters 6–9 showing five distinctive clusters. (j) UMAP split by experimental conditions. (k) Ratio of cells from three treatment groups distributed in each cluster. Ratio of cells was calculated by normalizing to the total number of cells captured in each sample (n = 3 for Ctrl and D0, two for D2). Data shown as mean ± SEM. p-values were calculated using the negative binomial generalized linear model from EdgeR. *p≤0.05; ***p≤0.001.
-
Figure 1—source data 1
Cell distribution in each cluster.
- https://cdn.elifesciences.org/articles/51796/elife-51796-fig1-data1-v2.xlsx
Figure 1—figure supplement 1
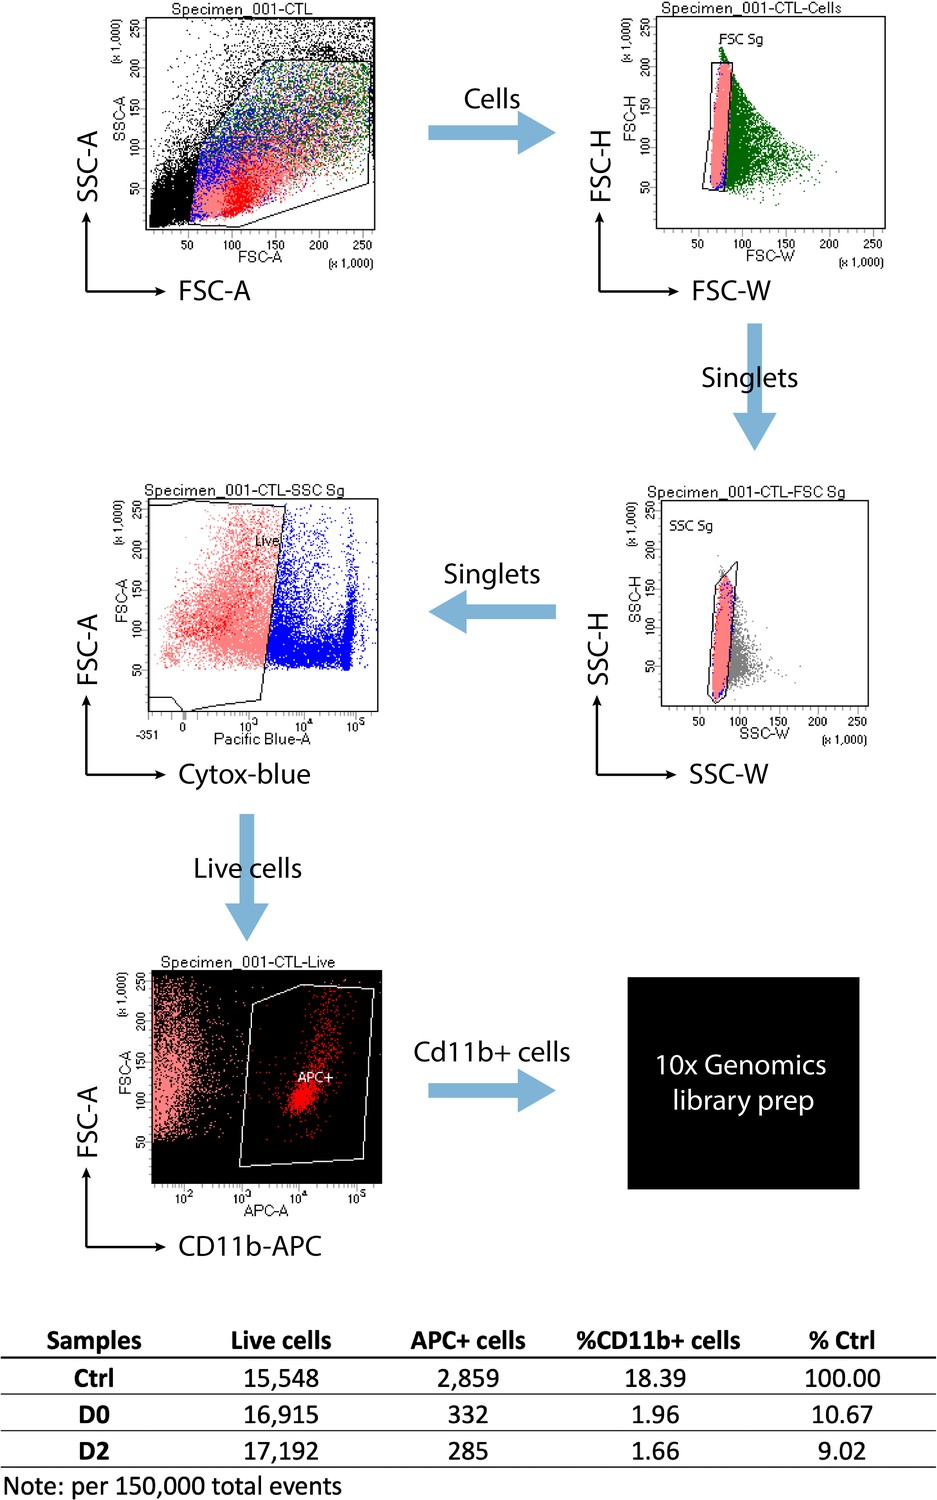
FACS strategy for single-cell microglia isolation.
Gating plots used for cell sorting are shown. Plots were generated using BD FACSDiva software. The table at bottom shows the summary from 150,000 events recorded.
Figure 1—figure supplement 2
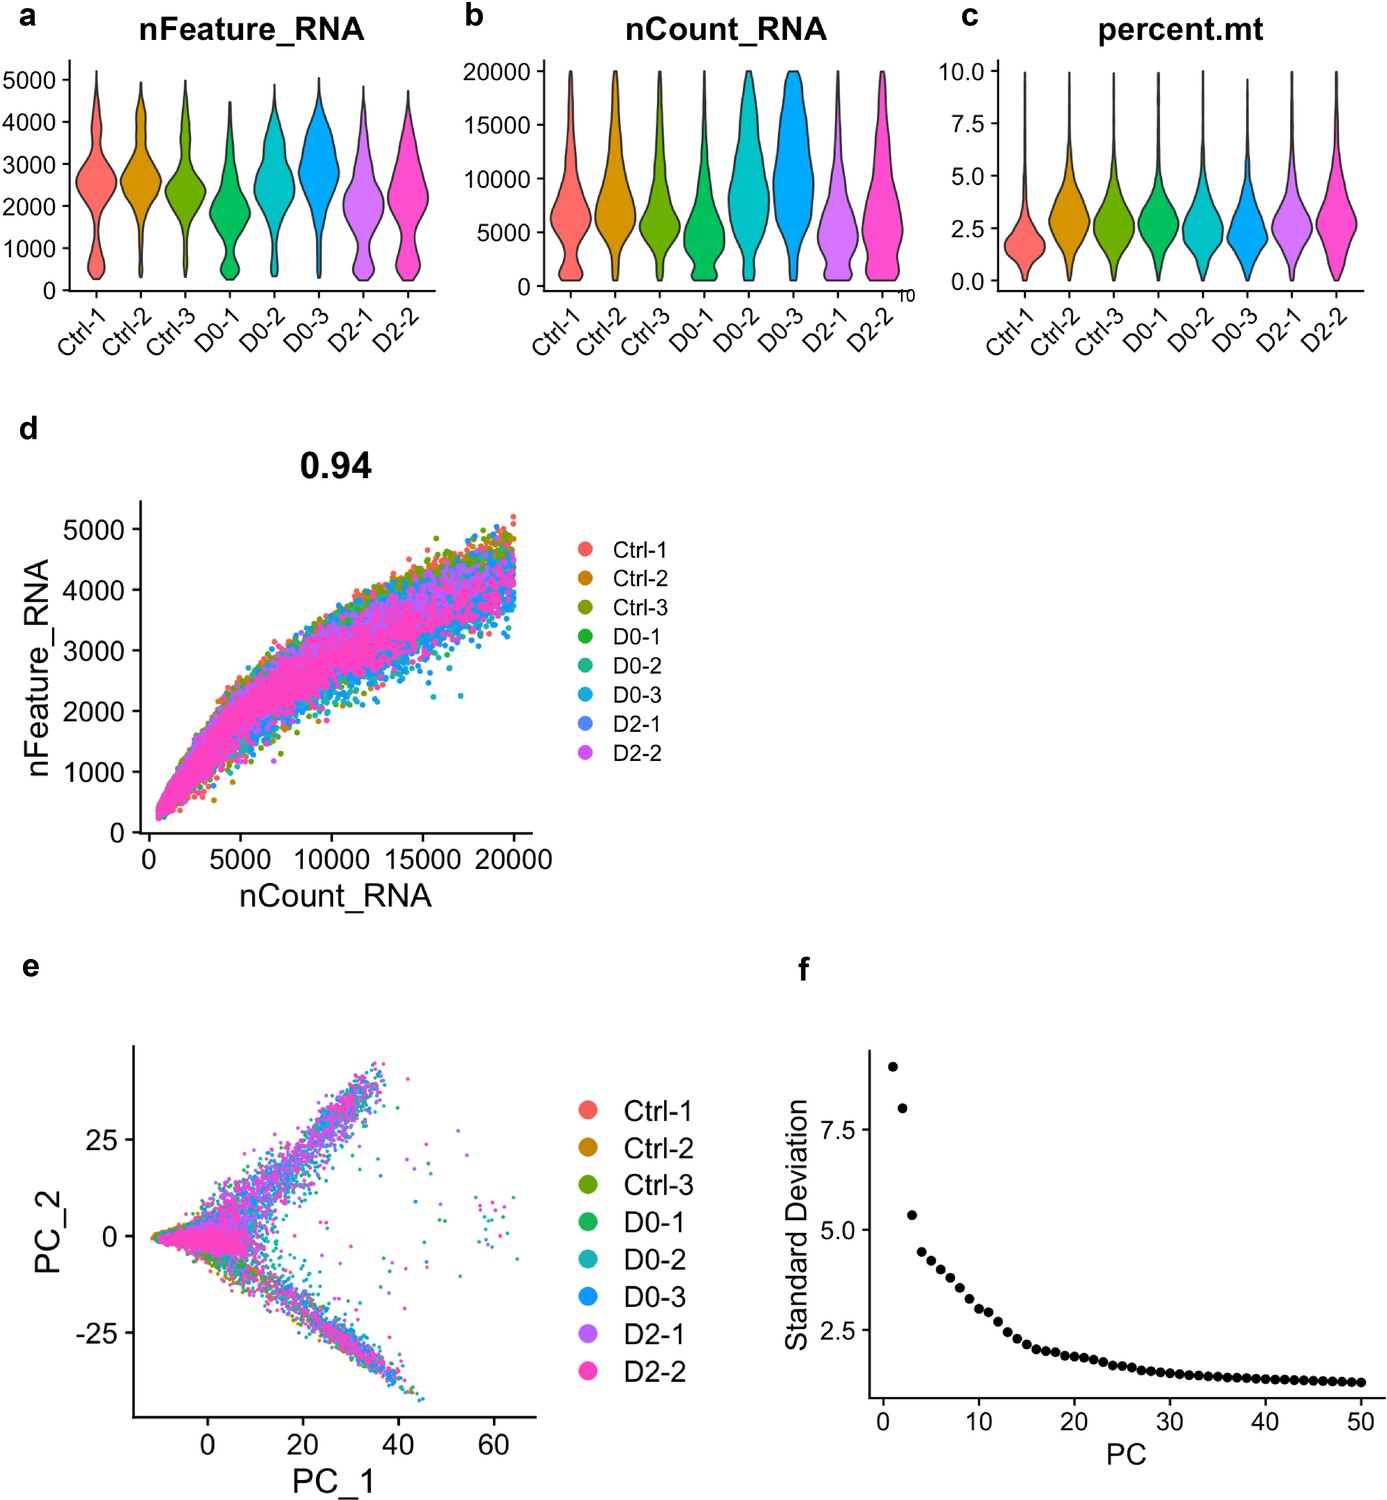
scRNA-seq data quality-control metrics.
(a) Violin plot showing UMI counts for each treatment group. (b) Violin plot showing total number of genes for each treatment group. (c) Violin plot showing the parentage of mitochondrial genes per cell for each treatment group. (d) Scatter plot showing the correlation between total number of genes detected and total number of UMI counts. Pearson correlation (0.93) is shown. (e) Scatter plot from principle component analysis (PCA). PC1 and PC2 are shown. (f) Elbow plot showing standard deviation of the first 50 principle components from PCA. Principle components 1 to 10 were used as input for downstream UMAP analysis.
Figure 1—figure supplement 3
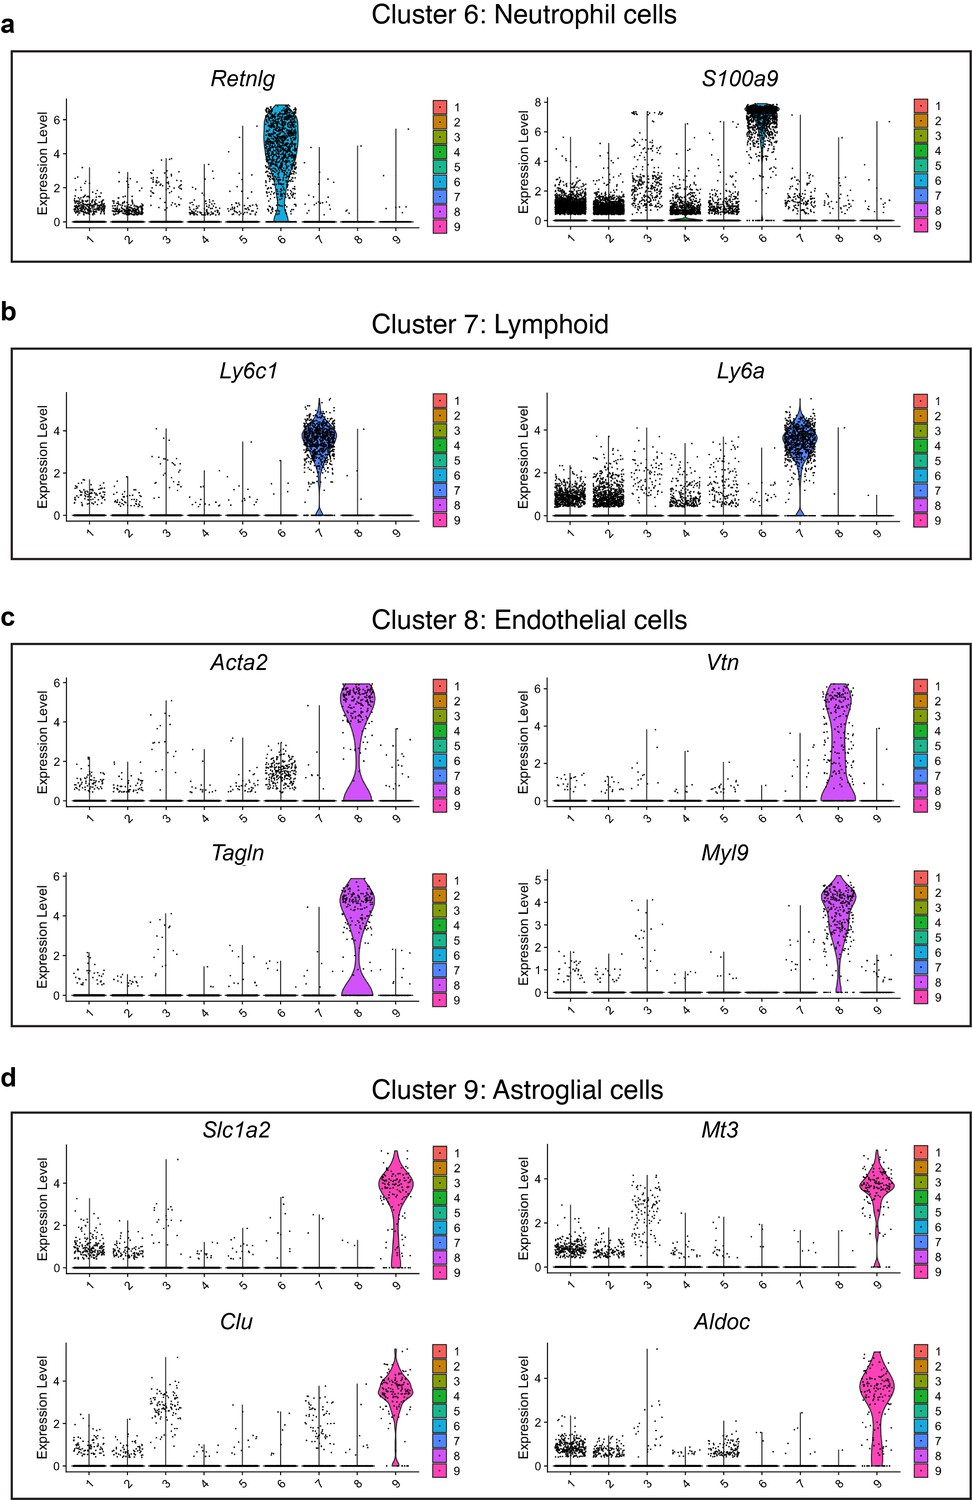
Expression of selected marker genes in clusters 6, 7, 8, and 9.
(a–c) Violin plots showing the expression of selected marker genes in Cluster-6 (a), Cluster-7 (b), Cluster-8 (c) and Cluster-9 (d).
Figure 1—figure supplement 4
Justification of the removal of sample D2-3.
(a) UMAP split by samples showing that D2-3 had fewer cells than the other samples. (b) Ratio of cells from three treatment groups distributed in each cluster. Ratio of cells was calculated by normalizing to the total number of cells captured in each sample. Red dots represent sample D2-3.
Figure 2 with 1 supplement
Cluster identity reveals heterogenous microglial population.
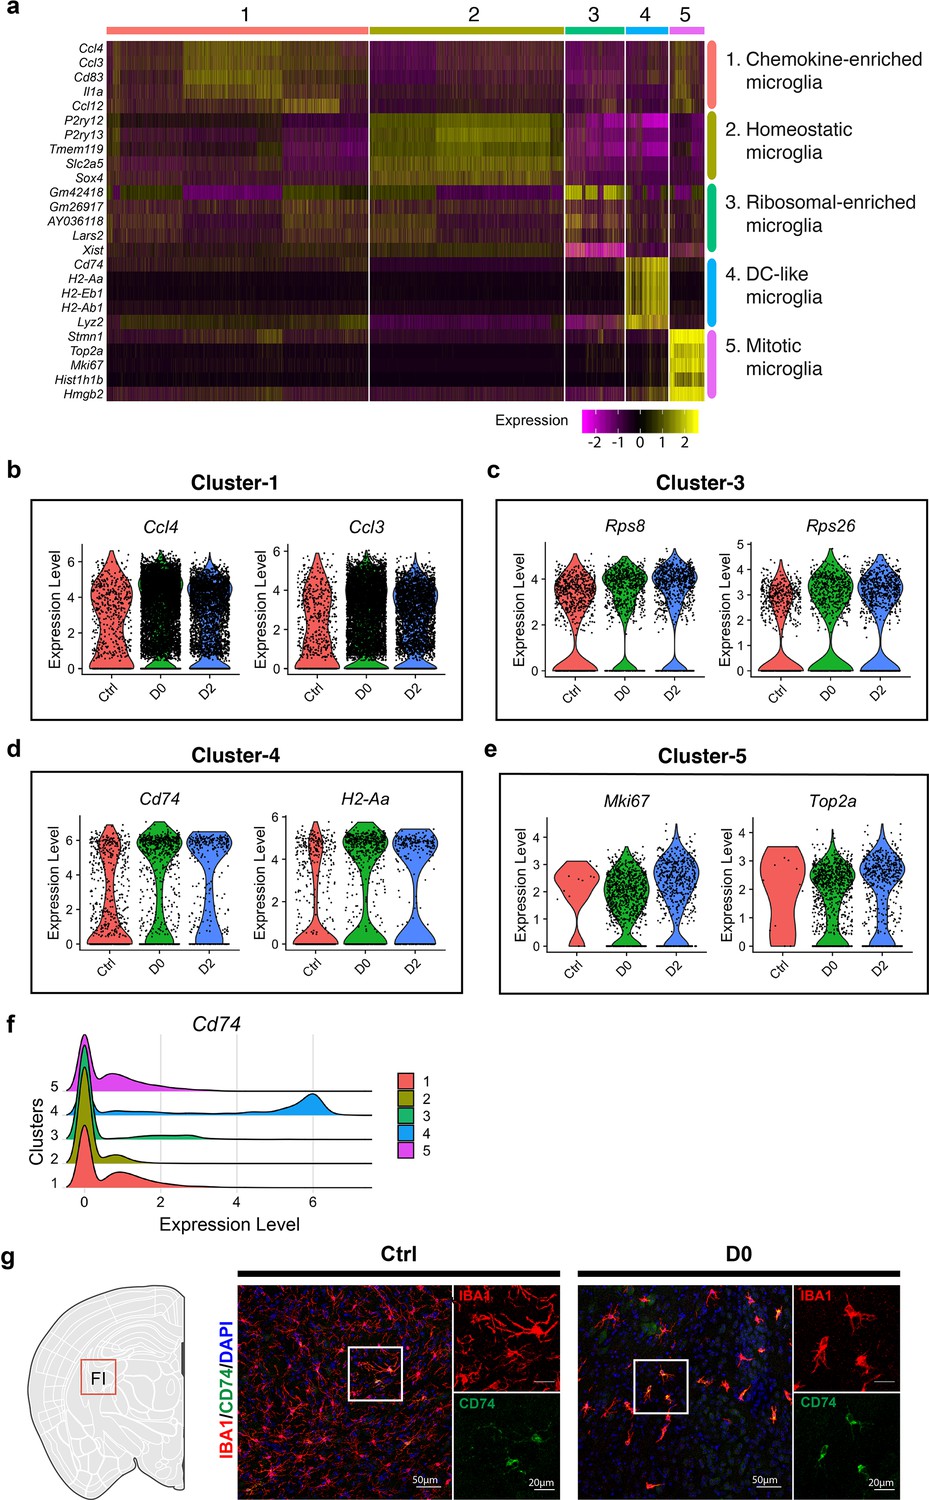
(a) Heatmap showing top-5 marker genes identified from each cluster. Complete list of marker genes can be found in Figure 2—source data 1. Annotation for each cluster is shown on the right. (b–e) Violin plot showing expression of selected marker genes in Cluster-1 (b), Cluster-3 (c), Cluster-4 (d) and Cluster-5 (e) in naïve C57BL/6J mice (Ctrl), PLX-treated mice (D0, 2 weeks of PLX diet) and repopulating (D2, 2 days after the end of treatment) brains. (f) Ridge plot showing expression of Cd74 in clusters 1–5. (g) Representative confocal images showing immunofluorescence staining of CD74 (green) and IBA1(red) in Ctrl and D0 brains. Images were taken from the fimbria (FI).
-
Figure 2—source data 1
DEGs for each cluster vs all other clusters.
- https://cdn.elifesciences.org/articles/51796/elife-51796-fig2-data1-v2.xlsx
Figure 2—figure supplement 1

Expression of Top DEGs in microglial clusters 1–5.
Violin plots showing the expression of top 10 differentially expressed genes in Cluster-1,–2, −4 and −5. For Cluster-3, top differentially expressed genes are shown except for non-coding and mitochondrial genes. Details in Figure 2—source data 1.
Figure 3 with 1 supplement

Microglial homeostatic signatures are down-regulated under CSF1R inhibition.
(a–f) Violin plots showing expression level (log-transformed total UMI) of selected homeostatic genes: (a) Tmem119; (b) P2ry12; (c) P2ry13; (d) Selplg; (e) Cx3cr1; (f) Csf1r. (g) Representative confocal images showing P2RY12 and TMEM119 expression in naive mice (Ctrl) and PLX-treated mice (D0, 2 weeks of PLX diet). IBA1 was used as marker for microglia. Images were taken from the hippocampal region. (h) Quantification of relative P2RY12 expression level per microglial cell. Number of C57BL/6J mice (3–5 Mo) used: Ctrl (n = 5), D0 (n = 5). Unpaired t-test with Welch's correction was used. (i) Quantification of relative TMEM119 expression level per microglial cell. Number of C57BL/6J mice (3–5 Mo) used: Ctrl (n = 5), D0 (n = 5). Unpaired t-test was used. p-value summary is shown as ns (p>0.05); * (p≤0.05); ** (p≤0.01); *** (p≤0.001); **** (p≤0.0001).
Figure 3—figure supplement 1

Microglial homeostatic signatures are down-regulated across all clusters.
Violin plots showing expression level (log-transformed total UMI) of selected homeostatic genes in each cluster: (a) Tmem119; (b) P2ry12; (c) P2ry13; (d) Selplg; (e) Cx3cr1; (f) Csf1r.
Figure 4
Microglia populations resistant to CSF1R inhibition express MAC2 (Galectin-3).
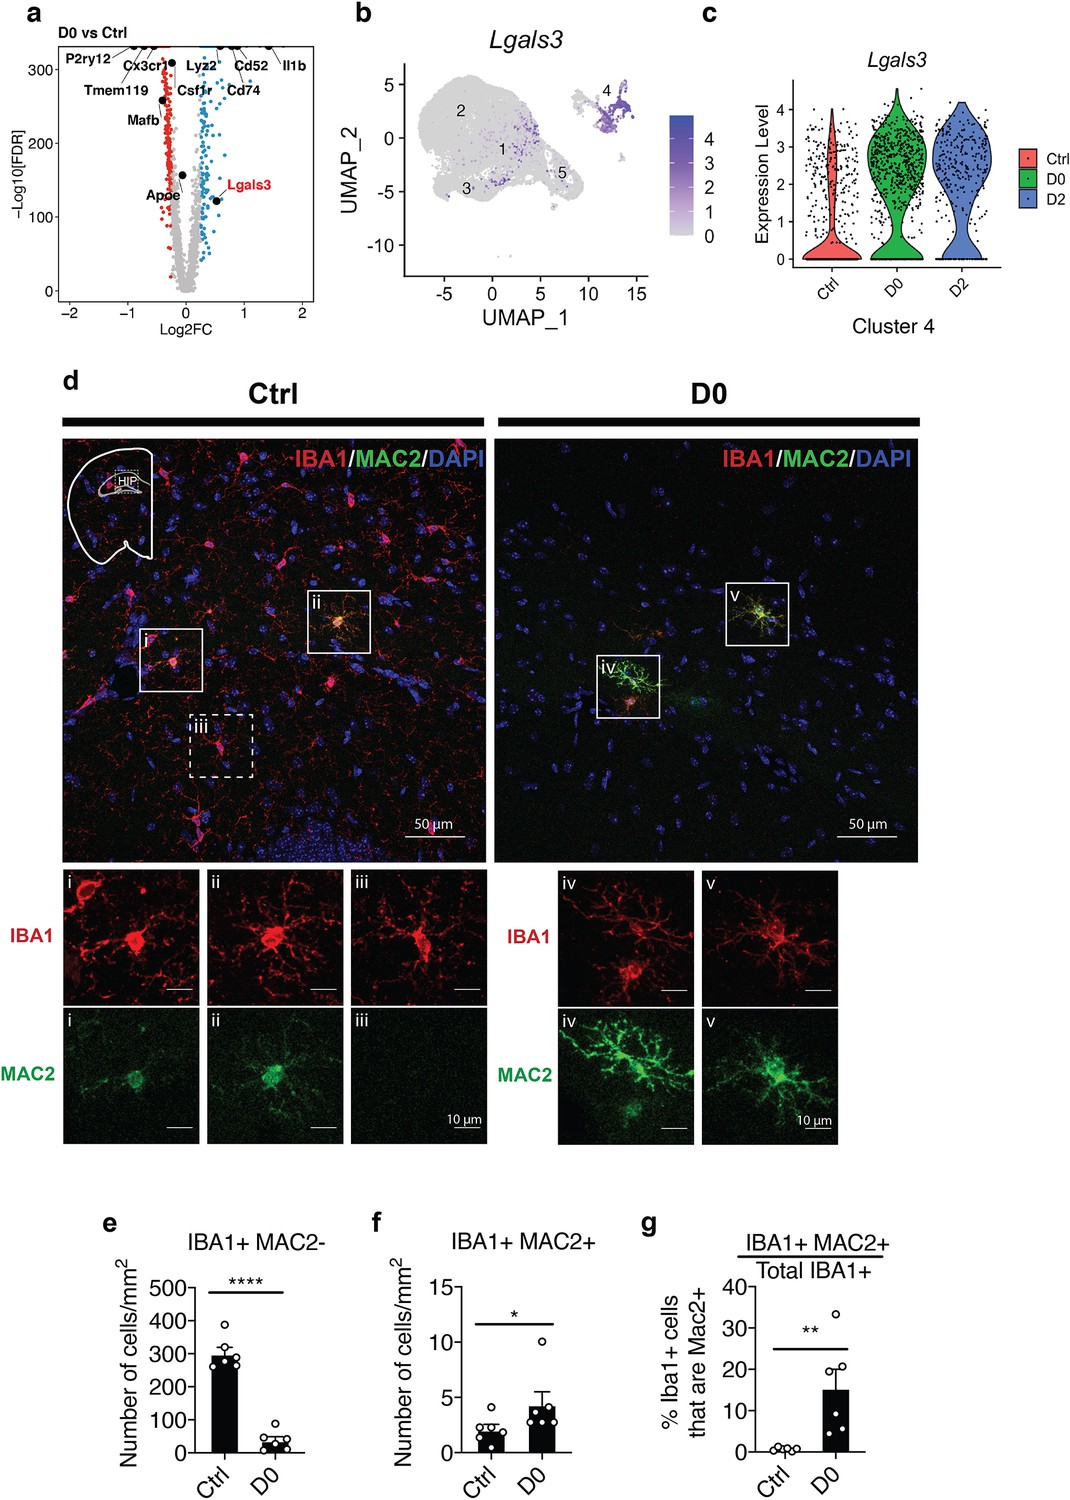
(a) Volcano plot showing differentially expressed genes identified by comparison of D0 vs. Ctrl. Genes of interest are in text, with Lgals3 (encodes for the MAC2 protein) highlighted in red. Upregulated DEGs are colored in red and downregulated DEGs are colored in blue (log fold change >0.25 or<−0.25). Complete list of DEGs can be found in Figure 2—source data 1. (b) UMAP plot showing expression distribution of Lgals3 in all clusters. Log-transformed total UMI was plotted. (c) Violin plot showing expression of Lgals3 in Cluster-4 in each treatment group. (d) Representative confocal images showing colocalization of IBA1 and MAC2 in native mice (Ctrl) and PLX-treated mice (D0, 2 weeks of PLX diet). Images were collected from the hippocampal region (shown in mini-map). Solid box highlights cell that is IBA1+MAC2+ and dotted box highlights cell that is IBA1+MAC2-. Enlarged images from the boxed area are shown in separate channels (panel i-v). (e) Quantification of IBA1+MAC2- cell numbers. Unpaired t-test was used. (f) Quantification of IBA1+MAC2+ cell numbers. Mann Whitney test was used. (g) Quantification of the percentage of MAC2+ cells among all IBA1+ microglia. Unpaired t-test was used. Number of C57BL/6J mice (2.5–4 Mo) used (panel e-g): Ctrl (n = 5); D0 (n = 6). Quantification in (panel e-g) was performed on images (1131.56 μm x 1938.59 μm) collected at the hippocampus using the VERSA automated slide scanner (Leica, 20x lens).
-
Figure 4—source data 1
DEGs for D0 vs Ctrl.
- https://cdn.elifesciences.org/articles/51796/elife-51796-fig4-data1-v2.xlsx
Figure 5 with 1 supplement
Lineage mapping shows MAC2+ microglia are not derived from circulating monocytes.
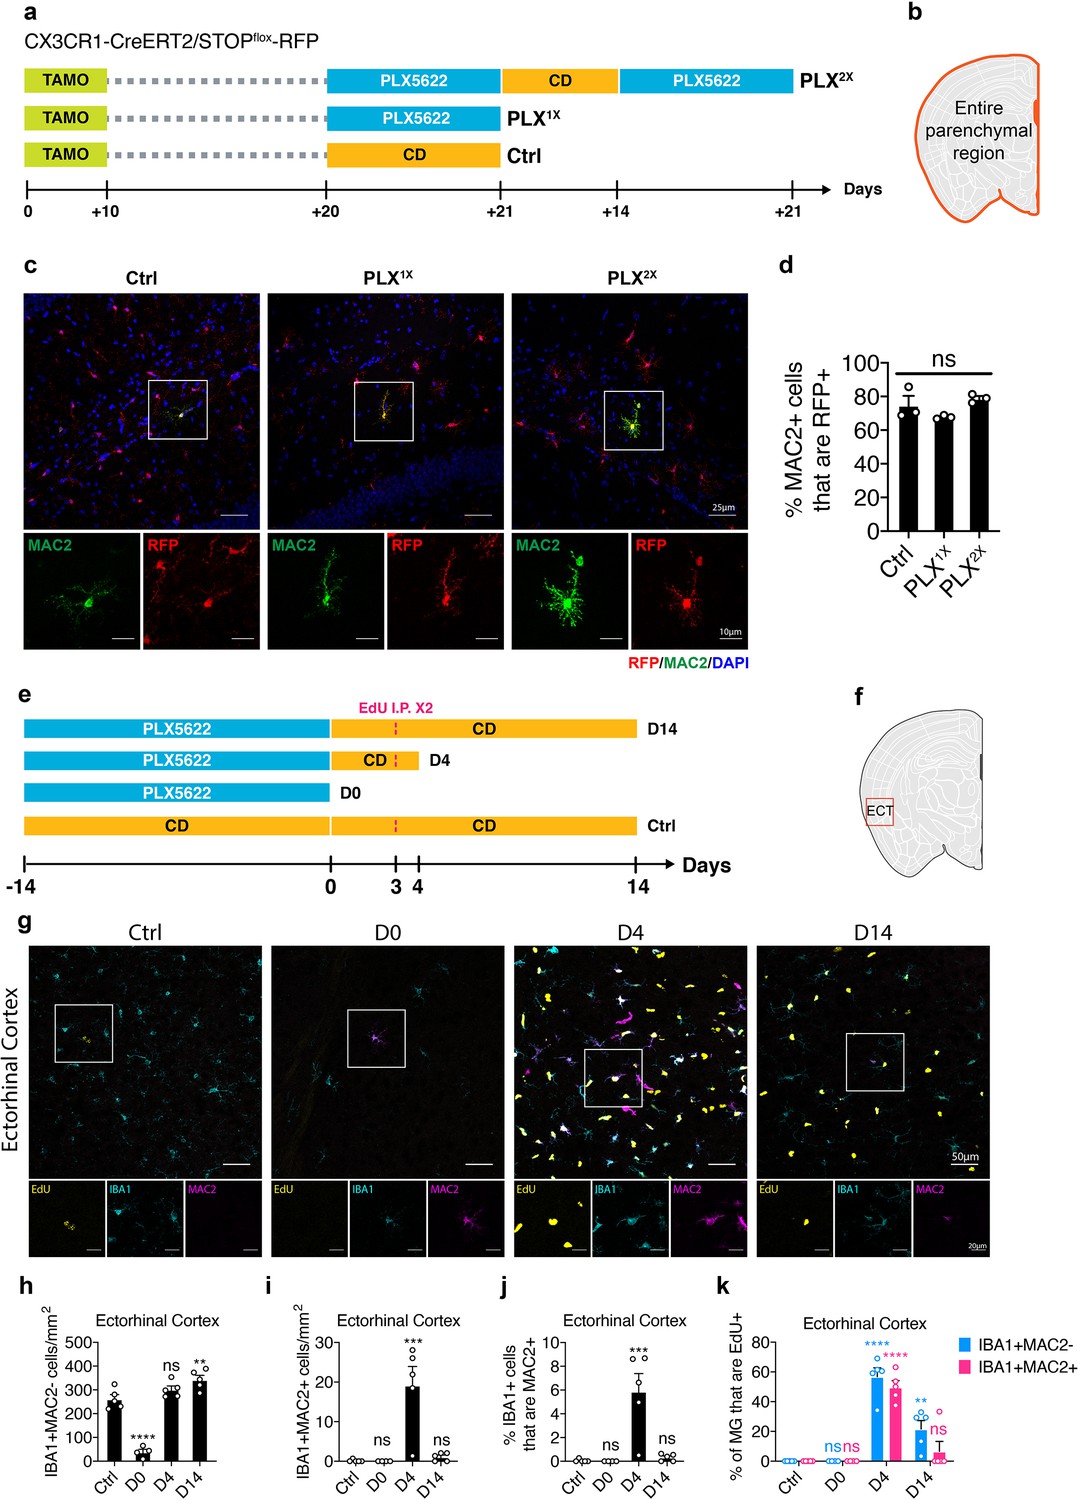
(a) Experimental design of the lineage mapping. Cx3Cr1-CreERT2/Rosa26-stop-DsRed mice were injected with tamoxifen (10 days) to label microglia with RFP. Mice are either treated with PLX diet for 3 weeks (PLX1X) or underwent repopulation for 2 weeks and treated with PLX diet again for another 3 weeks (PLX2X). (b) Quantification area was performed on the entire parenchymal region. (c) Representative confocal images showing colocalization of MAC2 and RFP expression. Boxed area is enlarged and separated by each channel. Images were collected from the hippocampal region. (d) Quantification of the percentage of MAC2+ cell that are RFP+. Number of CX3CR1-CreERT2/Rosa26-stop-DsRed mice (7–9 Mo) used: Ctrl (n = 3); PLX1X (n = 3); PLX2X (n = 3). One-way ANOVA was used. p-value summary is shown as ns (p>0.05); * (p≤0.05); ** (p≤0.01); *** (p≤0.001); **** (p≤0.0001). (e) Experimental design of microglial repopulation timeline and EdU injections. C57BL/6J mice were treated with PLX diet for 2 weeks (D0) and switched to control diet (CD) to start repopulation for 4 days (D4) or 14 days (D14). EdU was injected on repopulation day 3. (f) Brain region used for quantification. Quantification in panel (h–k) was performed on images (1292.23 μm x 1130.7 μm) collected at the Eentorhinal cortex (ECT) using the VERSA automated slide scanner (Leica, 20x lens). (g) Representative confocal images showing immunofluorescence staining of EdU (yellow), IBA1 (cyan), and MAC2 (magenta) in the entorhinal region. Boxed area is shown by separated channels at the bottom. (h) Quantification of IBA1+MAC2- cells in the ECT. (i) Quantification of IBA1+MAC2+ cells in the ECT. (j) Quantification of the percentage of IBA1+ microglia that are MAC2+ in the ECT. (k) Quantification of the percentage of EdU+ labeling in either IBA1+MAC2- cells (blue bar) or IBA1+MAC2+ cells (red bar). Number of C57/BL6 mice (2–3.5 Mo) used: Ctrl (n = 5); D0 (n = 4); D4 (n = 5); D14 (n = 5). Statistical tests used: (1) In panels (h–j), one-way ANOVA with Dunnett's multiple comparisons test was used to compare with Ctrl; (2) In panels (k), two-way ANOVA with Dunnett's multiple comparisons test was used to compare with Ctrl for each cell population. p-value summary is shown as ns (p>0.05); * (p≤0.05); ** (p≤0.01); *** (p≤0.001); **** (p≤0.0001).
Figure 5—figure supplement 1
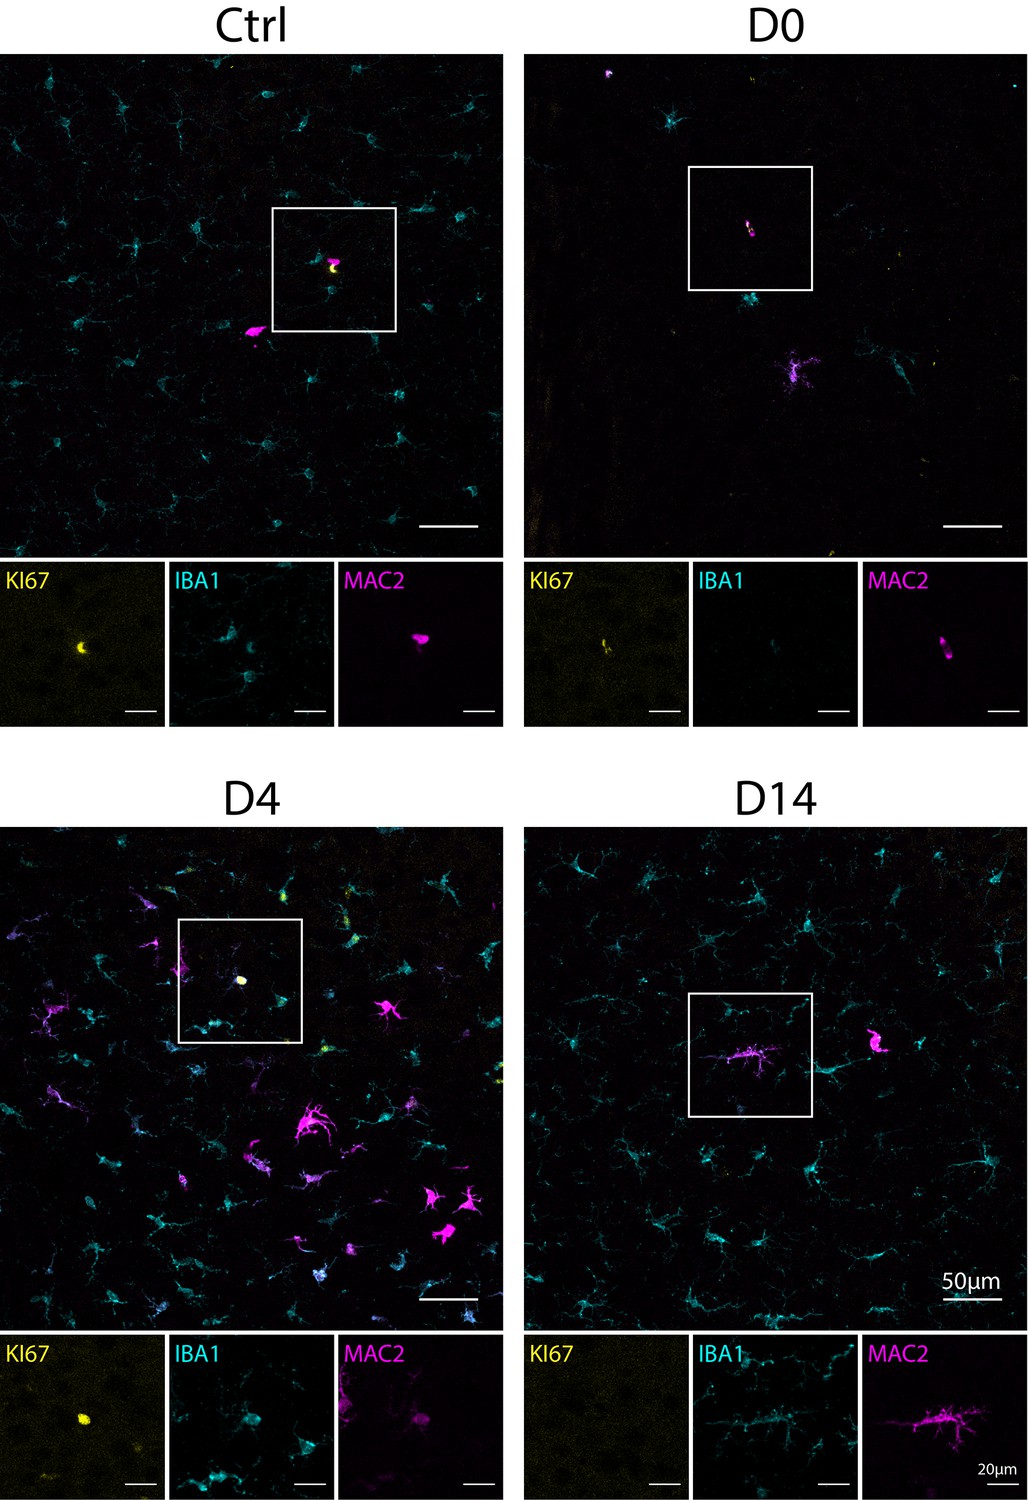
IBA1+MAC2+ cells express mitotic marker KI67 during early repopulation.
Representative confocal images showing immunofluorescence staining of KI67 (yellow), IBA1 (cyan), and MAC2 (magenta) in naïve C57BL/6J mice (Ctrl), PLX-treated mice (D0), mice that underwent short-term microglial repopulation (D4) and longer-term repopulation (D14). Boxed area of image is shown in separated channels for each marker at the bottom.
Figure 6 with 1 supplement
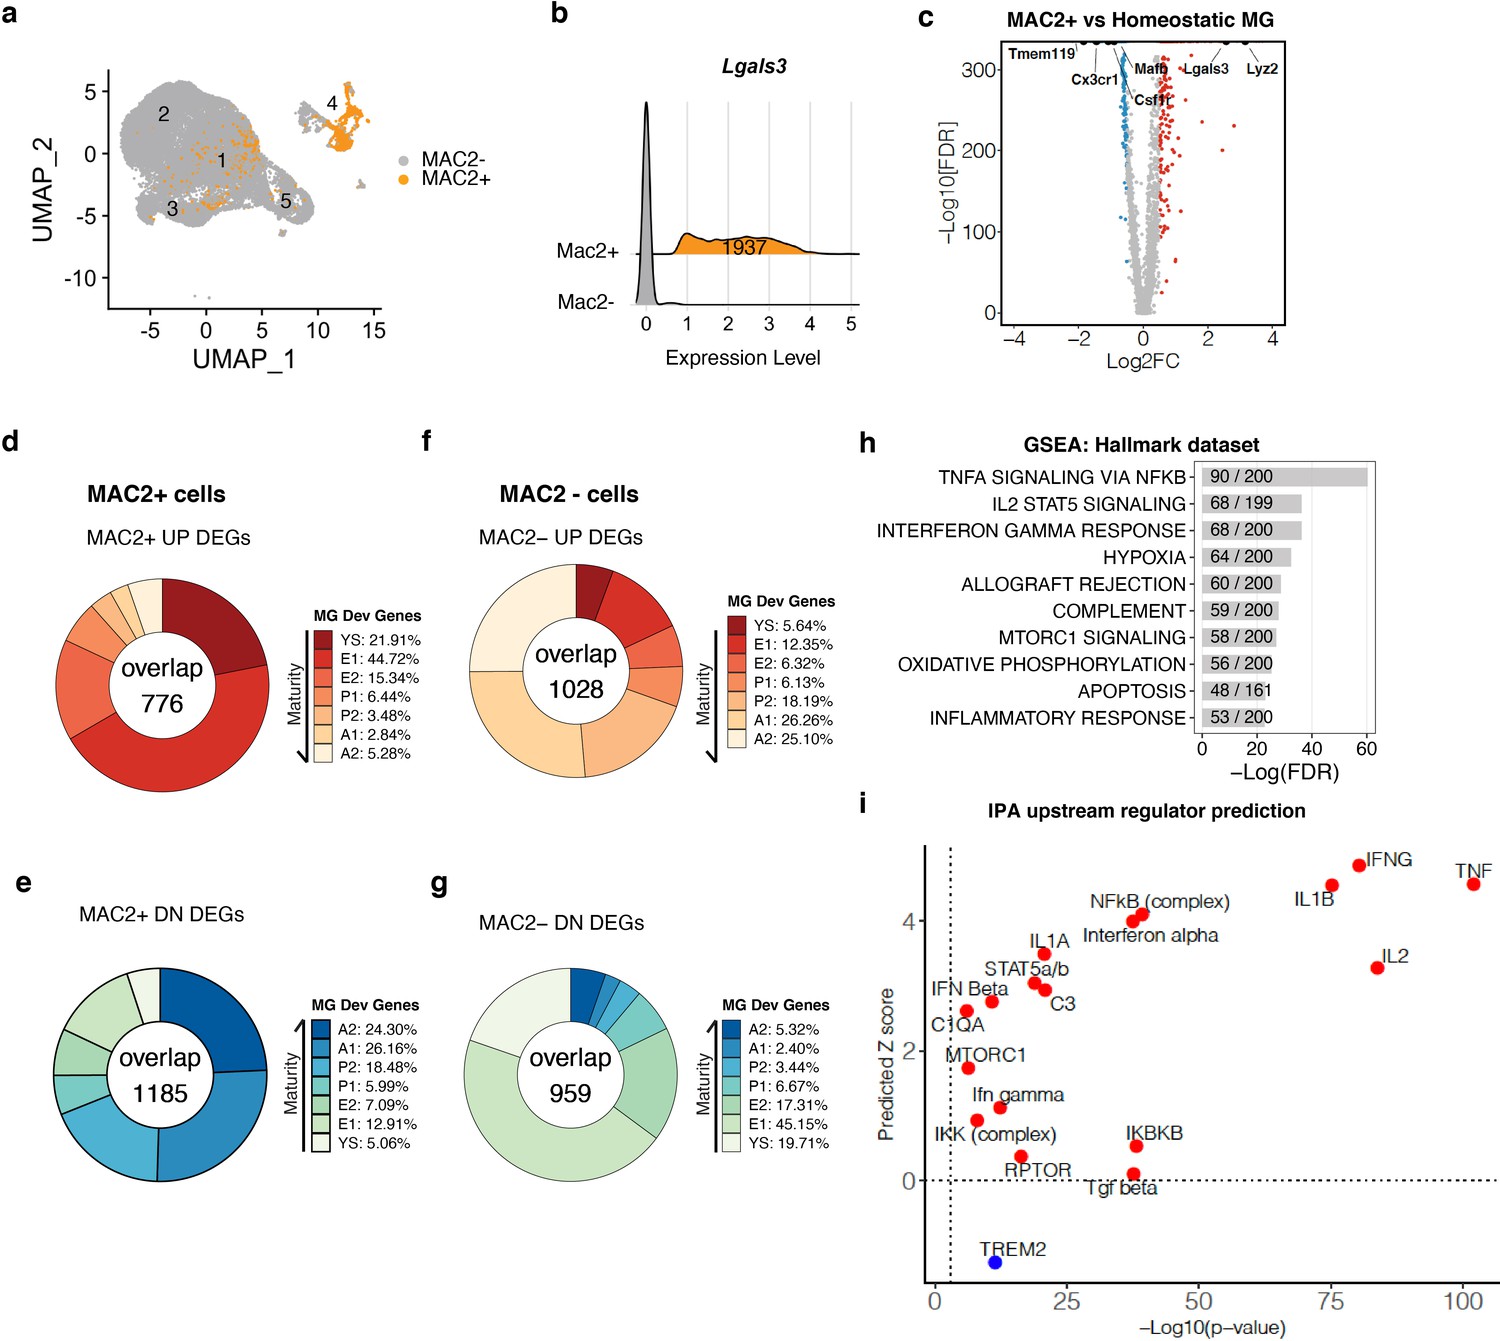
MAC2+ cells display immature microglial signatures (a) UMAP plot showing the spatial distribution of MAC2+ cells in different clusters.
(b) Ridge plot showing isolation of MAC2+ cells from all clusters. MAC2+ cells were separated based on high Lgals3 expression (mean plus one SD). (c) Volcano plot showing differentially expressed genes (DEGs) in MAC2+ cells compared to homeostatic microglia from Control condition (Cluster 2). Upregulated DEGs are colored in red and downregulated DEGs are colored in blue (log fold change >0.5 or <−0.5). Genes of interest are highlighted in text. (d,e) Donut chart showing the percentage of upregulated DEGs (d) and downregulated DEGs (e) in MAC2+ cells overlapping with developmental marker genes identified in Matcovitch-Natan and Winter et al. (f,g) Same analysis as in d,e, for DEGs in MAC2- cells. (h) Bar plot showing top-10 hallmark pathways enriched in all MAC2+ DEGs from Gene Set Enrichment Analysis (GSEA). The fraction in the bar shows the number of genes found in the DEGs (numerator) over the number of total genes curated for the corresponding pathway (denominator). (i) Scatterplot showing selected upstream regulators and their predicted z scores against the -Log10(p-value) based on all MAC2+ DEGs using Ingenuity Pathway Analysis (IPA).
-
Figure 6—source data 1
DEGs for MAC2+ cells vs homeostatic microglia and DEGs for MAC2- vs MAC2+ cells.
- https://cdn.elifesciences.org/articles/51796/elife-51796-fig6-data1-v2.xlsx
Figure 6—figure supplement 1

Microglia developmental gene signature analysis in MAC2+ cells.
(a,b) Donut chart showing the percentage of upregulated DEGs (a) and downregulated DEGs (b) in MAC2+ cells overlapping with upregulated DEGs and downregulated DEGs, respectively, for each developmental stage identified in Hammond et al. White and Monocyte represent marker genes from white matter injury experiments and monocyte cell markers.
Figure 7
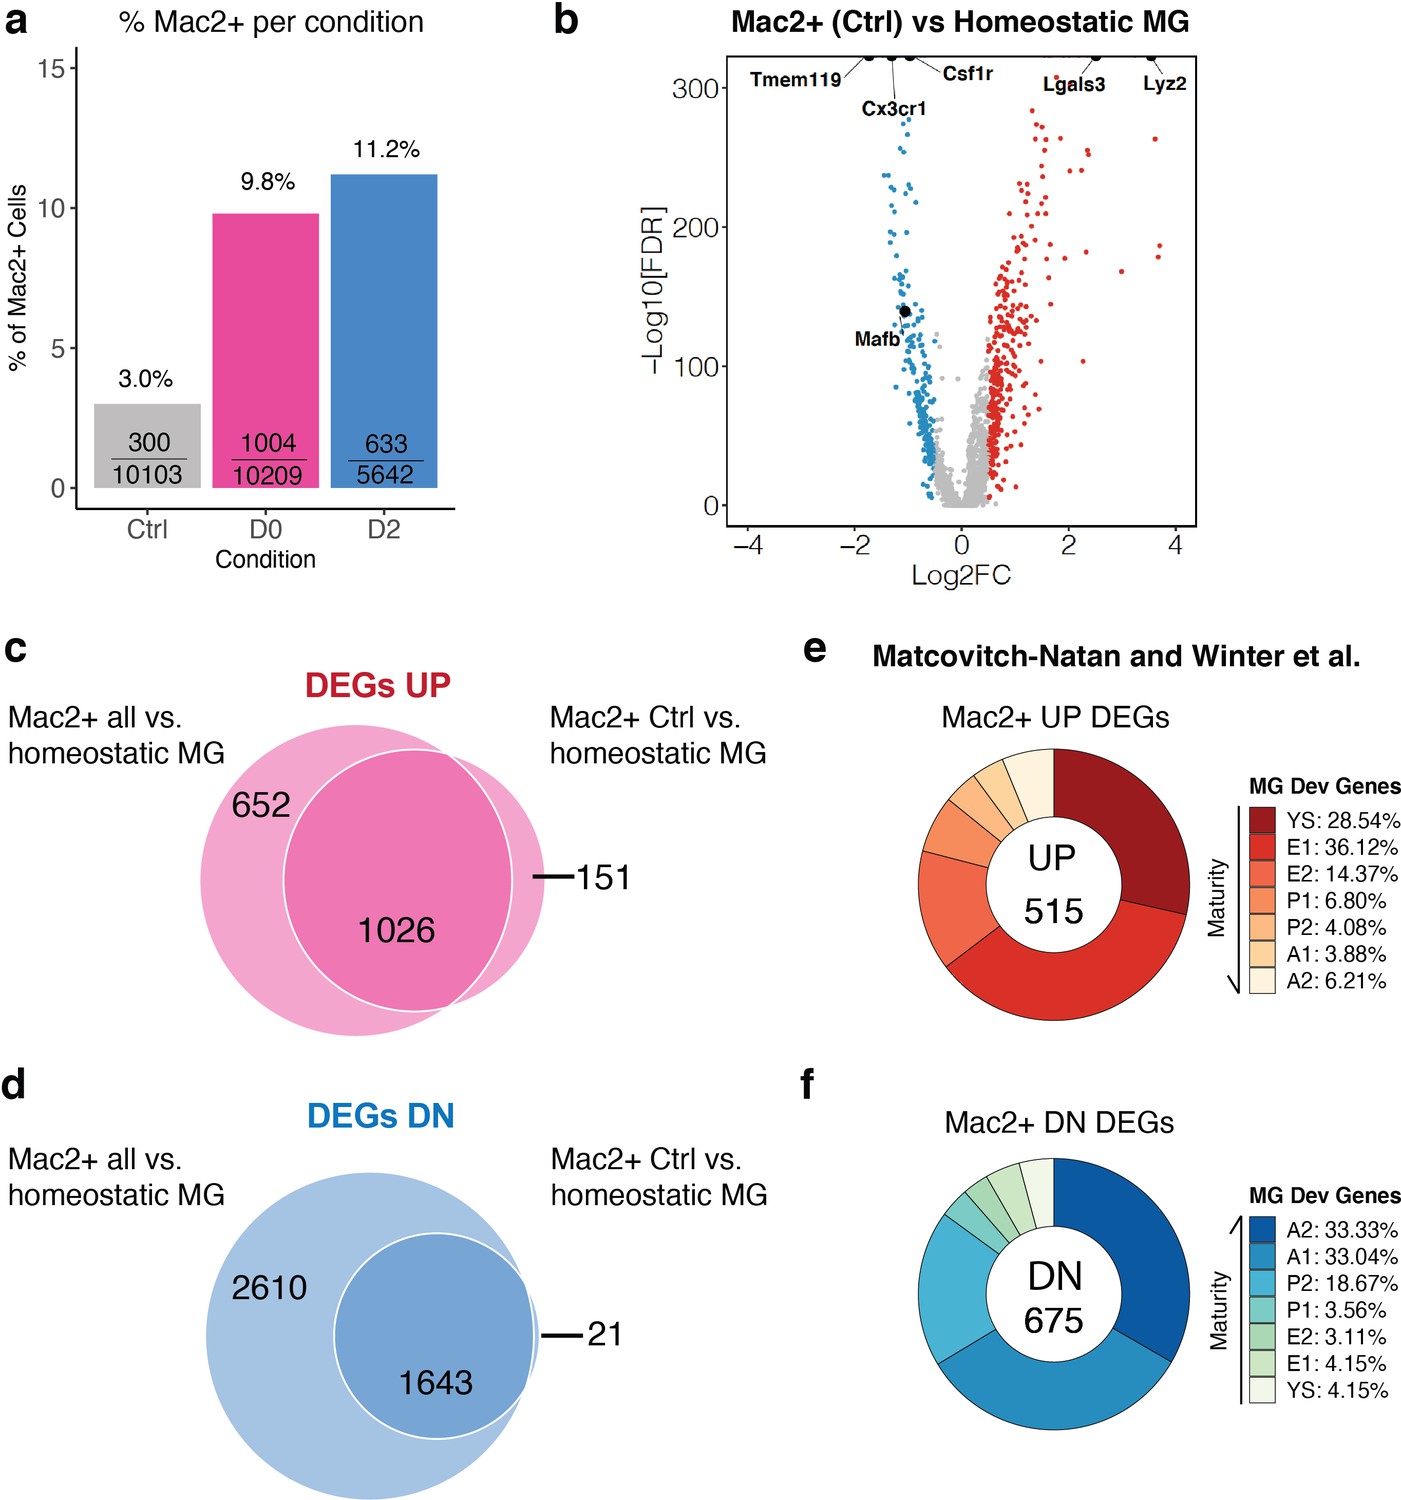
MAC2+ cells are present in naïve adult mouse brains and display immature microglial markers.
(a) Bar graph showing the relative frequency of MAC2+ cells among all cells within each treatment group. The fraction inside each bar shows the number of MAC2+ cells within the treatment group (numerator) over the total number of cells within that treatment group (denominator). (b) Volcano plot showing differentially expressed genes (DEGs) of MAC2+ cells from Ctrl samples in comparison to homeostatic microglia (Cluster-2). Upregulated DEGs are colored in red while downregulated DEGs are colored in blue (log fold change >0.5 or<−0.5). Genes of interest are highlighted in text. (c) Venn diagram showing the common upregulated DEGs found between all MAC2+ cells (left circle) and MAC2+ cells from Ctrl samples (right circle). (d) Venn diagram showing the common downregulated DEGs found between all MAC2+ cells (left circle) and MAC2+ cells from Ctrl samples (right circle). (e,f) Donut chart showing the percentage of upregulated DEGs (e) and downregulated DEGs (f) in MAC2+ cells from Ctrl samples overlapping with developmental marker genes identified in Matcovitch-Natan and Winter et al.
-
Figure 7—source data 1
DEGs for MAC2+ cells from control samples vs homeostatic microglia.
- https://cdn.elifesciences.org/articles/51796/elife-51796-fig7-data1-v2.xlsx
Author response image 1
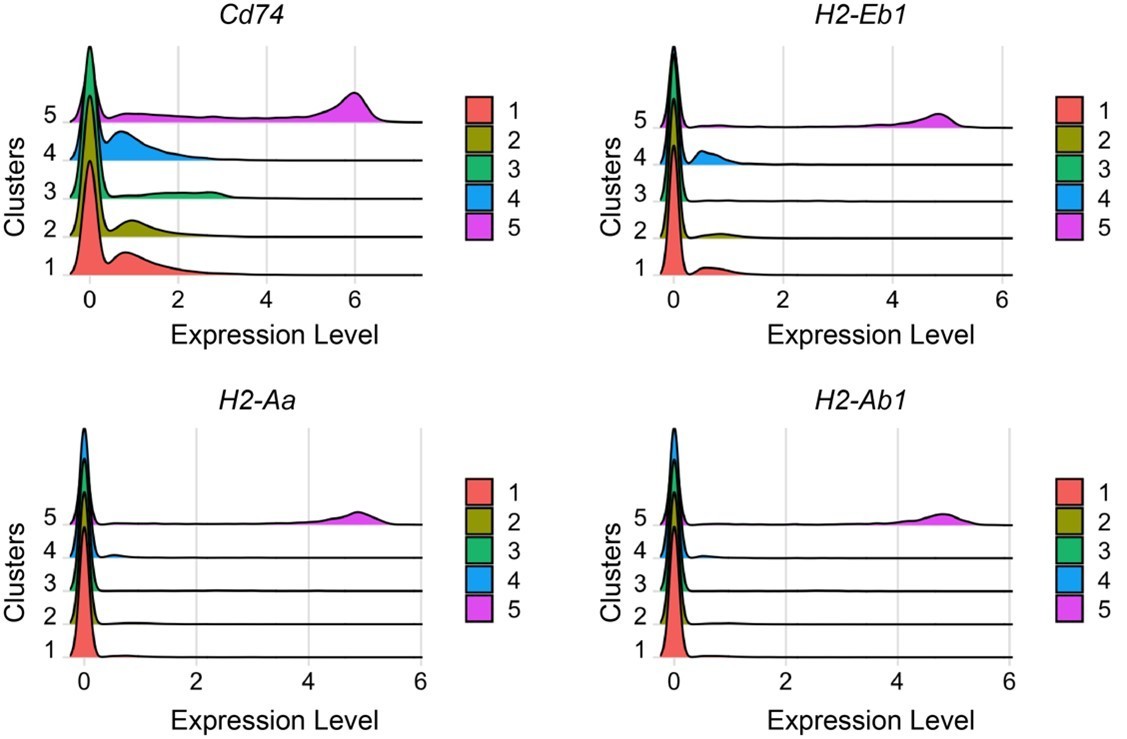
Ridge plot shows Comparison of expression levels of CD74 and MHCs in clusters1–5.
Cells in cluster 5 have the highest levels of CD74, H2-Eb1, H2-Aa and H2-Ab1. Among them, CD74 exhibit the highest level.
Author response image 2
(a) UMAP split by samples showing that D2-3 had fewer cells than the other samples.
(b) Ratio of cells from three treatment groups distributed in each cluster. Ratio of cells was calculated by normalizing to the total number of cells captured in each treatment group. Red dots represent sample D2-3.
Tables
Key resources table
| Reagent type (species) or resource | Designation | Source or reference | Identifiers | Additional information |
|---|---|---|---|---|
| Strain, strain background (M. musculus) | C57BL/6J | The Jackson laboratory | Jax: 000664 | |
| Genetic reagent (M. musculus) | CX3CR1-CreERT2 | The Jackson laboratory | Jax: 021160 | |
| Genetic reagent (M. musculus) | Rosa26-stop-DsRed | doi: 10.1002/eji.200636745 | MGI: 104735 | |
| Antibody | rabbit polyclonal anti-P2RY12 | Dr. David Julius, UCSF | N/A | 1:500 |
| Antibody | Rabbit monoclonal anti-TMEM119 | Abcam | ab209064 | 1:250 |
| Antibody | Goat polyclonal anti-IBA1 | Abcam | ab5076 | 1:500 |
| Antibody | Rat monoclonal anti-MAC2 | Cedarlane | CL8942AP | 1:1000 |
| Antibody | Goat polyclonal anti-RFP | Rockland | 200-101-379 | 1:500 |
| Antibody | Rabbit monoclonal anti-CD74 | Abcam | ab245692 | 1:500 |
| Antibody | Rabbit monoclonal anti-KI67 | Abcam | ab16667 | 1:100 |
| Antibody | Rat monoclonal APC anti-CD11b | Tonbo bioscience | 20–0112 | 1:100 |
| Antibody | Mouse monoclonal TruStain FcX (anti-mouse CD16/32) | BioLegend | 101319 | 1:50 |
| Commercial assay or kit | Chromium Single Cell 3ʹ GEM, Library and Gel Bead Kit v3 | 10x Genomics | PN-1000075 | |
| Chemical compound, drug | SYTOX Blue Dead Cell Stain | Thermofisher | S34857 | 1:1000 |
| Chemical compound, drug | PLX5622 | Plexxikon Inc | D11100404i | 1200 mg/kg |
| Software, algorithm | Graphpad prism | Graphpad, San Diego, CA | RRID:SCR_002798 | |
| Software, algorithm | Fiji | doi: 10.1038/nmeth.2019 | RRID:SCR_002285 | |
| Software, algorithm | Cell Ranger | 10x Genomics | N/A | 3.1.0 |
| Software, algorithm | Seurat | doi: 10.1038/nbt.4096 | N/A | 3.1.2 |
| Software, Algorithm | EdgeR | doi: 10.1093/bioinformatics/btp616 doi: 10.1093/nar/gks042 | N/A | 3.28.1 |
Additional files
Download links
A two-part list of links to download the article, or parts of the article, in various formats.
Downloads (link to download the article as PDF)
Open citations (links to open the citations from this article in various online reference manager services)
Cite this article (links to download the citations from this article in formats compatible with various reference manager tools)
A MAC2-positive progenitor-like microglial population is resistant to CSF1R inhibition in adult mouse brain
eLife 9:e51796.
https://doi.org/10.7554/eLife.51796


