Vangl2 acts at the interface between actin and N-cadherin to modulate mammalian neuronal outgrowth
- INSERM, Neurocentre Magendie, U1215, France
- Univ. Bordeaux, Neurocentre Magendie, U1215, France
- CNRS, Interdisciplinary Institute for Neuroscience, UMR 5297, France
- Univ. Bordeaux, Interdisciplinary Institute for Neuroscience, UMR 5297, France
- Newcastle University, Centre for Life, United Kingdom
Figures
Figure 1 with 1 supplement

Vangl2 affects commissural tracts.
(A) Immunostaining with FluoroMyelin of coronal sections from P21 control (upper panel) and Vangl2 cKO (lower panel) brains in a rostral (left) and more caudal (right) location. Note the absence of the corpus callosum (magenta outline) and hippocampal commissure (cyan outline) caudally in the Vangl2 cKO. Scale bar: 100 µm; n = 3 independent experiments. (B) Cresyl Violet staining of horizontal sections from P31 control (upper panel) and Vangl2 cKO brains (lower panel). Note that the corpus callosum (cc, magenta arrow) and the hippocampal commissure (hc, magenta asterisk) are absent dorsally in Vangl2 cKO brains.Scale bar: 1 mm. (C) Coronal sections from 22‐week‐old control (upper panel) and Vangl2 cKO (lower panel) brains, injected with an AAV‐GFP virus and labeled with DAPI (cyan). Note that hippocampal fibers (in green) cross the cerebral midline in control mice but not in the mice lacking Vangl2. Scale bar: 50 µm. (D) 3D rendering of the hippocampus and the cc covering the hippocampus area. The reconstruction shows the absence of the splenium corpus callosum area in the Vangl2 cKO mouse (white arrow). Abbreviations: hippocampus (hp), corpus callosum (cc), dorso/ventral (D/V), rostrao/caudal (R/C). Scale bars: 800 µm. (E) Cresyl violet staining of 10 week-old control and Vangl2 cKO brains and quantification of cortical thickness of the somato-sensory area. Scale bar: 1 mm; n = 3–5 mice. Data are presented as box-and-whisker plots (min/max) based on three independent experiments. (F) Cux1/DAPI staining of P0 cortices from control and Vangl2 cKO mice. The Cux1 layer is depicted with a dotted magenta line. Scale bar: 100 µm. (G) Quantification analysis show no difference in the number of Cux1 positive cells between P0 control and Vangl2 cKO mice; n = 3 independent experiments. Data are presented as box-and-whisker plots (min/max) based on three independent experiments.
Figure 1—figure supplement 1
Vangl2 affects commissural tracts.
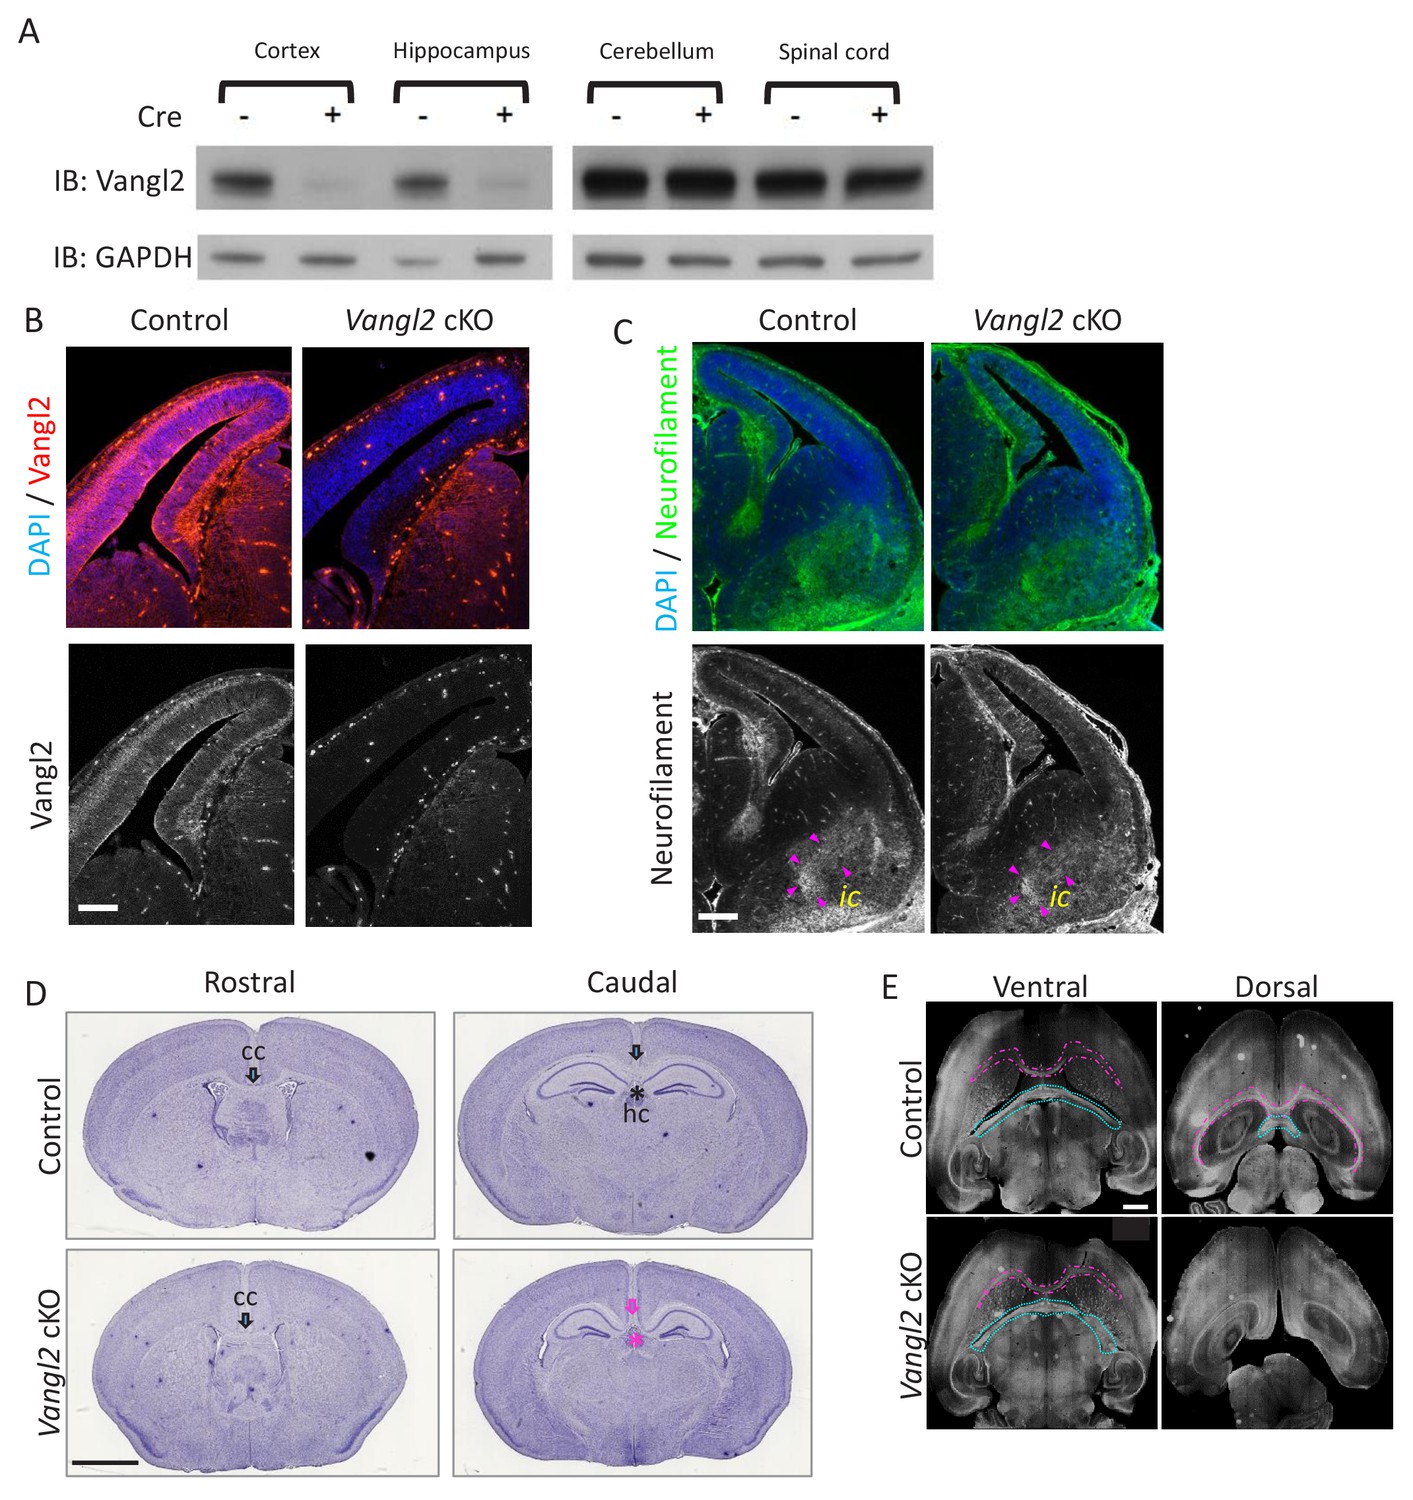
(A) For Western blots, we collected tissues from at least 3 P0/1 mice for each genotype that express Cre in the cortex and hippocampus (left panel), and tissues that do not express Cre as the cerebellum and spinal cord (right panel). GADPH was used as a loading control in these experiments. (B) Vangl2 immunohistochemistry of E13.5 telencephalon sections. Note the decrease in protein in the dorsal region. Scale bar: 200 µm. (C) Neurofilament (green) and DAPI (blue) staining of E13.5 control and Vangl2 cKO brains show that internal capsule (ic, outlined with magenta arrowheads) does not appear affected by Vangl2 deletion. Scale bar: 100 µm. (D) Hematoxylin staining of coronal sections from P21 control (upper panel) and Vangl2 cKO brains (lower panel). Note that the corpus callosum (cc, black arrow) and the hippocampal commissure (hc, black asterisk) are absent caudally in Vangl2 cKO brains (magenta arrow and asterisk). Scale bar, 20 mm, n = 3 independent experiments. (E) Immunolabeling with Neurofilament-H in horizontal sections from P21 control (upper panel) and Vangl2 cKO (lower panel) brains. Note the absence of the cc (magenta outline) and hc (cyan outline) dorsally in the Vangl2 cKO. Scale bar: 1 mm; n = 3 independent experiments.
Figure 2
Vangl2 affects growth cone morphology.
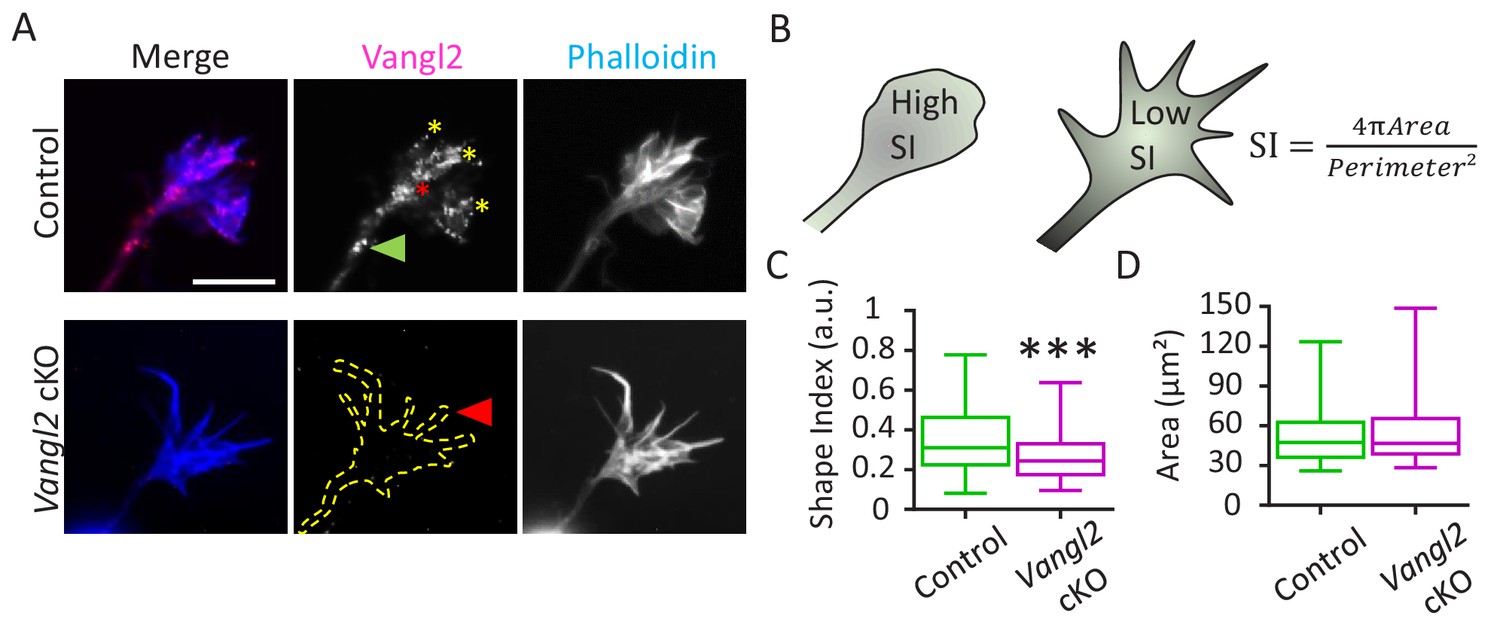
(A) Cultured hippocampal neurons from control and Vangl2 cKO mice at DIV2 on laminin substrate, labeled with an anti-Vangl2 antibody (magenta) and phalloidin (blue). The dotted lines indicate the shape outline. Scale bar: 5 µm. (B) The Shape Index (S.I.) was calculated by dividing the growth cone’s area by its perimeter (see Materials and methods). Growth cones that are more lamellipodia-like tend to present S.I. values larger than growth cones that have more filopodial shape. (C) Shape index (S.I.) analysis of control and Vangl2 cKO growth cones from neurons plated on laminin substrate. The S.I. is defined as 4πArea/Perimeter²; n = 54–60 neurons. (D) Average area of growth cones from control and Vangl2 cKO neurons. Data are presented as box-and-whisker plots (min/max) based on 3 (C, D) independent experiments; ***p<0.001 by the Mann-Whitney test (C).
Figure 3

Deletion of Vangl2 increases growth cone velocity on Ncad-Fc substrate.
(A) Representative images of neurite extension from t = 0 min (cyan asterisk) to t = 45 min (magenta dotted line) at DIV2 in Vangl2 cKO and control neurons cultured on Ncad-Fc-coated substrates. Scale bar, 10 µm. (B) Quantification of the average growth cone velocity in control and Vangl2 cKO neurons; n = 24–28 neurons. (C) Quantification of total time spent in pauses during a 45 min period for Vangl2 cKO and control growth cones. (D) Quantification of the time per pause in Vangl2 cKO neurons and controls. (E) Quantification of growth cone speed (excluding pauses) in Vangl2 cKO and control growth cones. For C, D, E: n = 10–11 neurons. (F) Graph of the cumulative distance covered by four representative individual Vangl2 cKO (purple) and control (green) growth cones over time. A pause was defined as no movement of the centroid of a growth cone for one minute or more (black arrows). (G, H) Average growth cone velocity and total pause duration in control and Vangl2 cKO neurons on laminin substrates. n = 32–40 neurons (for total time paused, n = 16–20 neurons). (I) Bar graph showing the axonal lengths of both control (n = 94) and Vangl2 cKO (n = 84) neurons in the control condition or treated with Netrin-1 or Wnt5a. (J, K) Average growth cone velocity and total pause duration in control and Vangl2 cKO neurons on PLL substrates. PLL at 1 mg*ml−1n = 21–23 neurons; PLL at 10 mg*ml−1: n = 25–27 neurons. Data are presented as box-and-whisker plots (min/max) based on 3 (B–E, I) or 2 (G, H, J, K) independent experiments; *p<0.05, **p<0.01 or ***p<0.001, by Student’s t-test (B, C, G, H, J), the Mann-Whitney test (D, E, K), or 2-way ANOVA followed by Tukey’s multiple-comparisons test (I).
Figure 4 with 2 supplements
Deletion of Vangl2 decreases actin treadmilling.
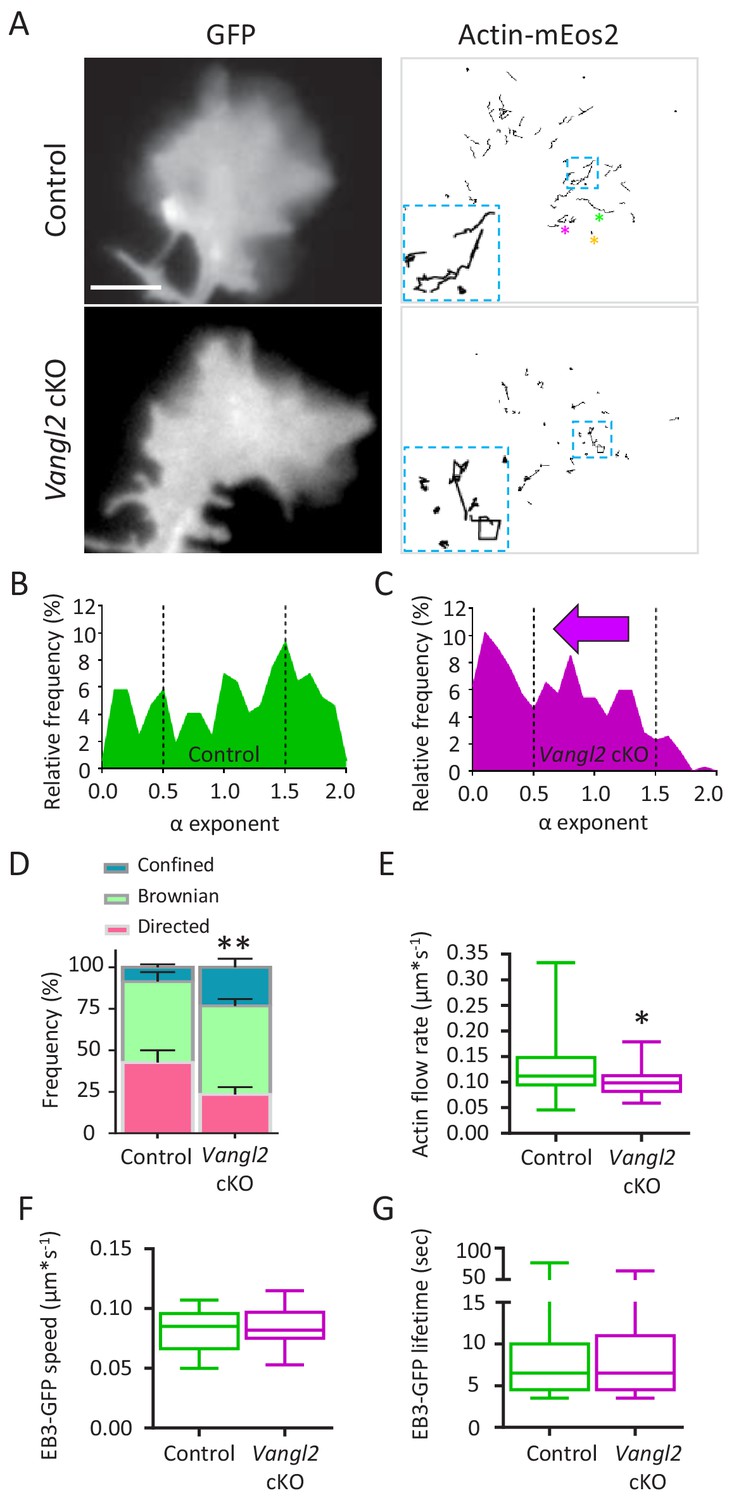
(A) Representative images of growth cones from control and Vangl2 cKO neurons expressing GFP and actin-mEos2. Images show the growth cone filled with GFP (left) and the trajectories of single actin-mEos2 molecules (in black) recorded over a 3 min period at 2 Hz (right). Insets show higher-magnification examples of the variability in individual trajectories. Scale bar, 5 µm. (B, C) Distribution of actin-mEos2 molecules α values in control and Vangl2 cKO neurons. n = 184–440 trajectories, 6–7 neurons. (D) Frequency distribution of directed, Brownian and confined trajectories of actin-mEos2 molecules in control and Vangl2 cKO neurons plated on Ncad-Fc substrates. (E) Speed of retrograde actin flow as extracted from the directed trajectories in controls and Vangl2 cKO neurons. n = 73–79 trajectories, 6–7 neurons. n = 8 sister cultures (DIV3) from eight different mice. (F, G) Quantification of the speed and lifetime of EB3-GFP particles in control and Vangl2 cKO neurons. n = 18–19 neurons. Data are presented as box-and-whisker plots (min/max) based on three independent experiments; *p<0.05, **p<0.01 by the Mann-Whitney test (D, E).
Figure 4—figure supplement 1
SptPALM is an accurate method for the analysis of F-actin flow in growth cones.
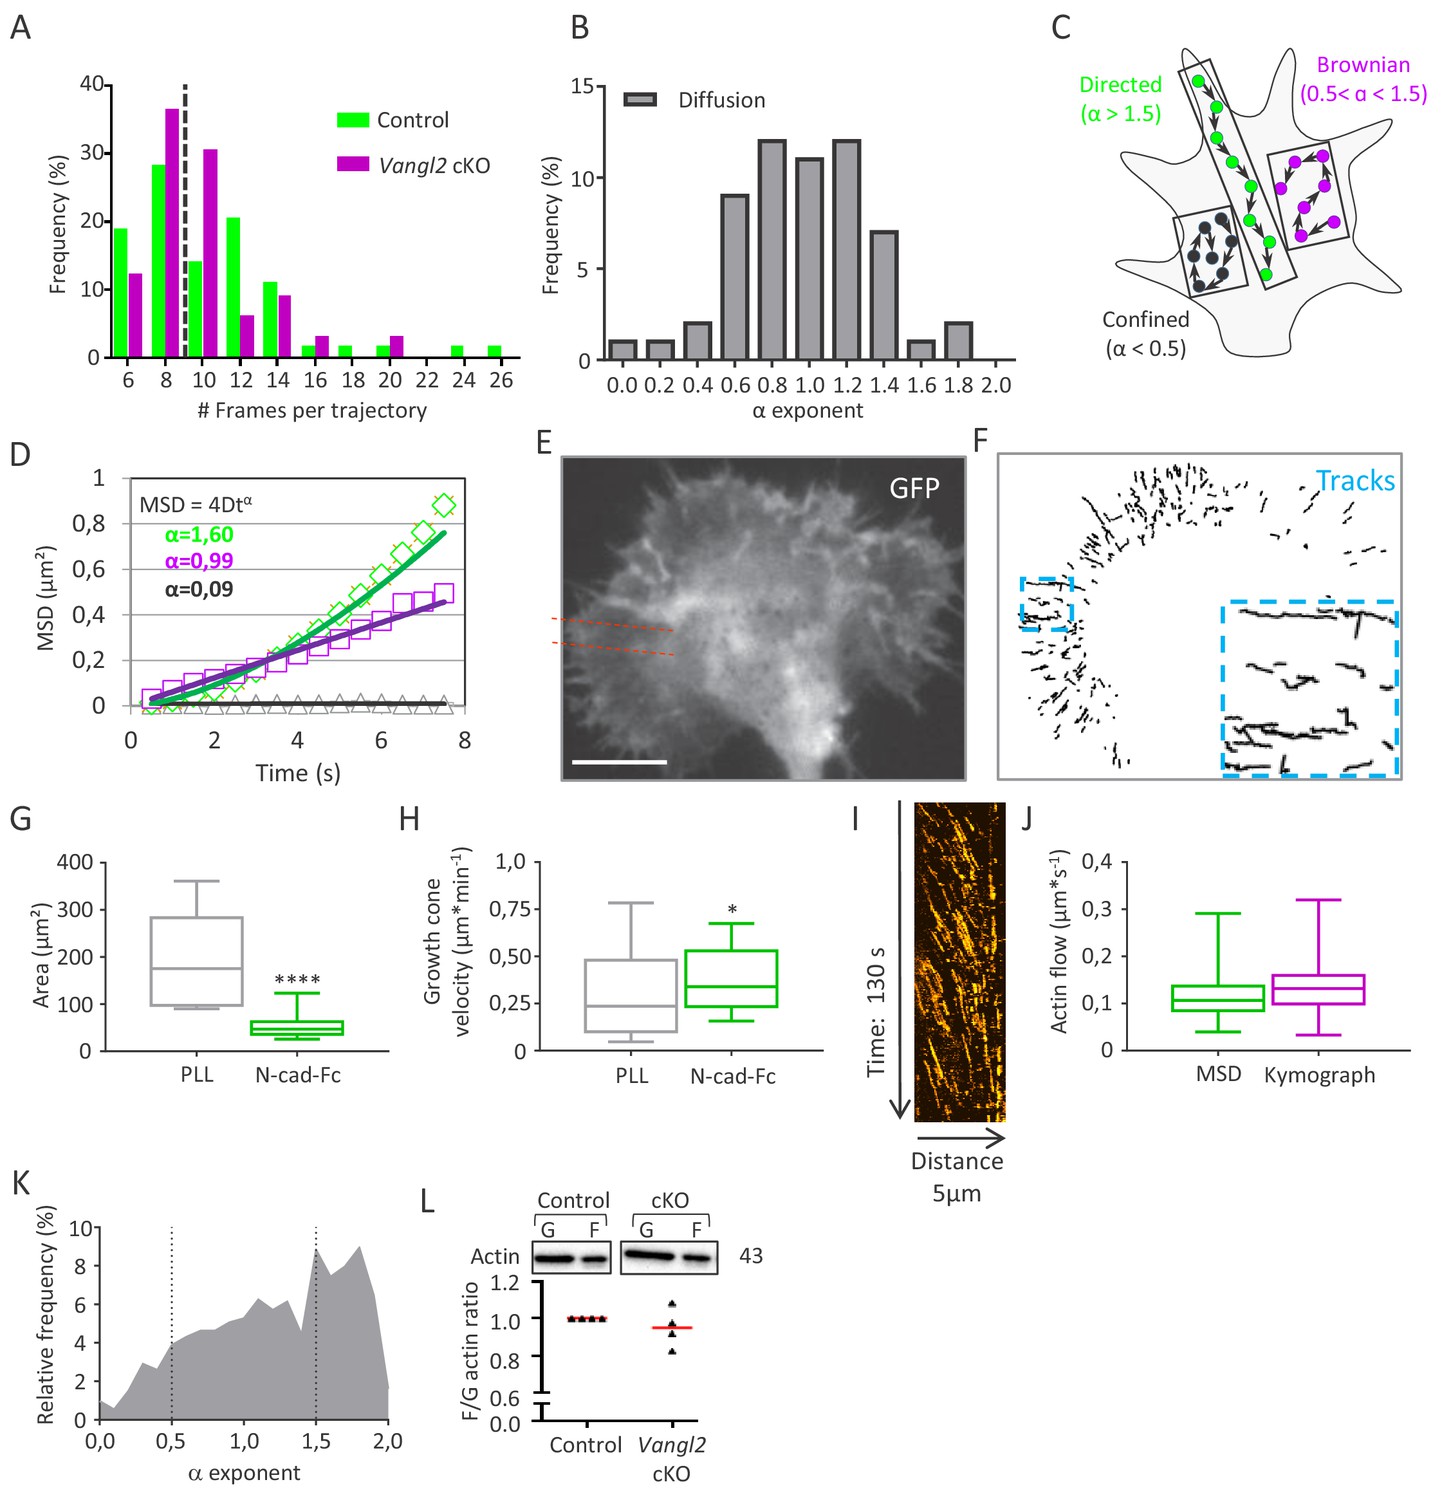
(A) Distribution of the actin-mEos2 trajectory length shows a median trajectory (dotted line) length of 9 frames for both genotypes. (B) Distribution of α exponents obtained by fitting the MSD of purely diffusive simulated actin trajectories (no flow). As expected, the distribution is centered around 1, and 90% of the population lies in the interval 0.5 < α <1.5. According to these results, the thresholds for confined and directed motions were set to α = 0.5 and 1.5, respectively. (C, D) Schematic representations of trajectories according to their α values (C), and representation of typical curves obtained for each trajectory type after fitting the MSD values by the power law 4Dtα (D). (E, F) Representative growth cone from a control neuron expressing GFP and actin-mEos2 and plated on Poly-L-lysine (PLL) coated glass. Images show the GFP signal (left, white) and the trajectories of single actin-mEos2 molecules in the peripheral region recorded over a 3 min period at 2 Hz (right, black). The inset shows directed trajectories at higher magnification. Red dotted lines show a region used for kymograph analysis. Scale bar, 5 µm. (G, H) Average surface area and migration speed of growth cones from control neurons plated on PLL or N-cadherin. (I) Representative kymograph from the peripheral region of a control growth cone plated on PLL, representing actin-mEos2 displacement as a function of time. (J) Speed of retrograde actin flow as extracted from the directed trajectories in control neurons (green, n = 929 trajectories, six growth cones) or by kymograph analysis (purple, n = 277 trajectories, six growth cones). (K) Distribution of the values of the exponent α obtained after fitting the MSD of single actin-mEos2 trajectories, for control neurons plated on PLL (n = 929 trajectories from six neurons). (L) Western blots and quantifications showing the expression of G- and F-actin in both control and Vangl2 cKO mice. N = 8 sister cultures (DIV3) from eight different mice; *p<0.05 and ****p>0.0001 by Student’s t-test (H) or by the Mann-Whitney test (G).
Figure 4—figure supplement 2
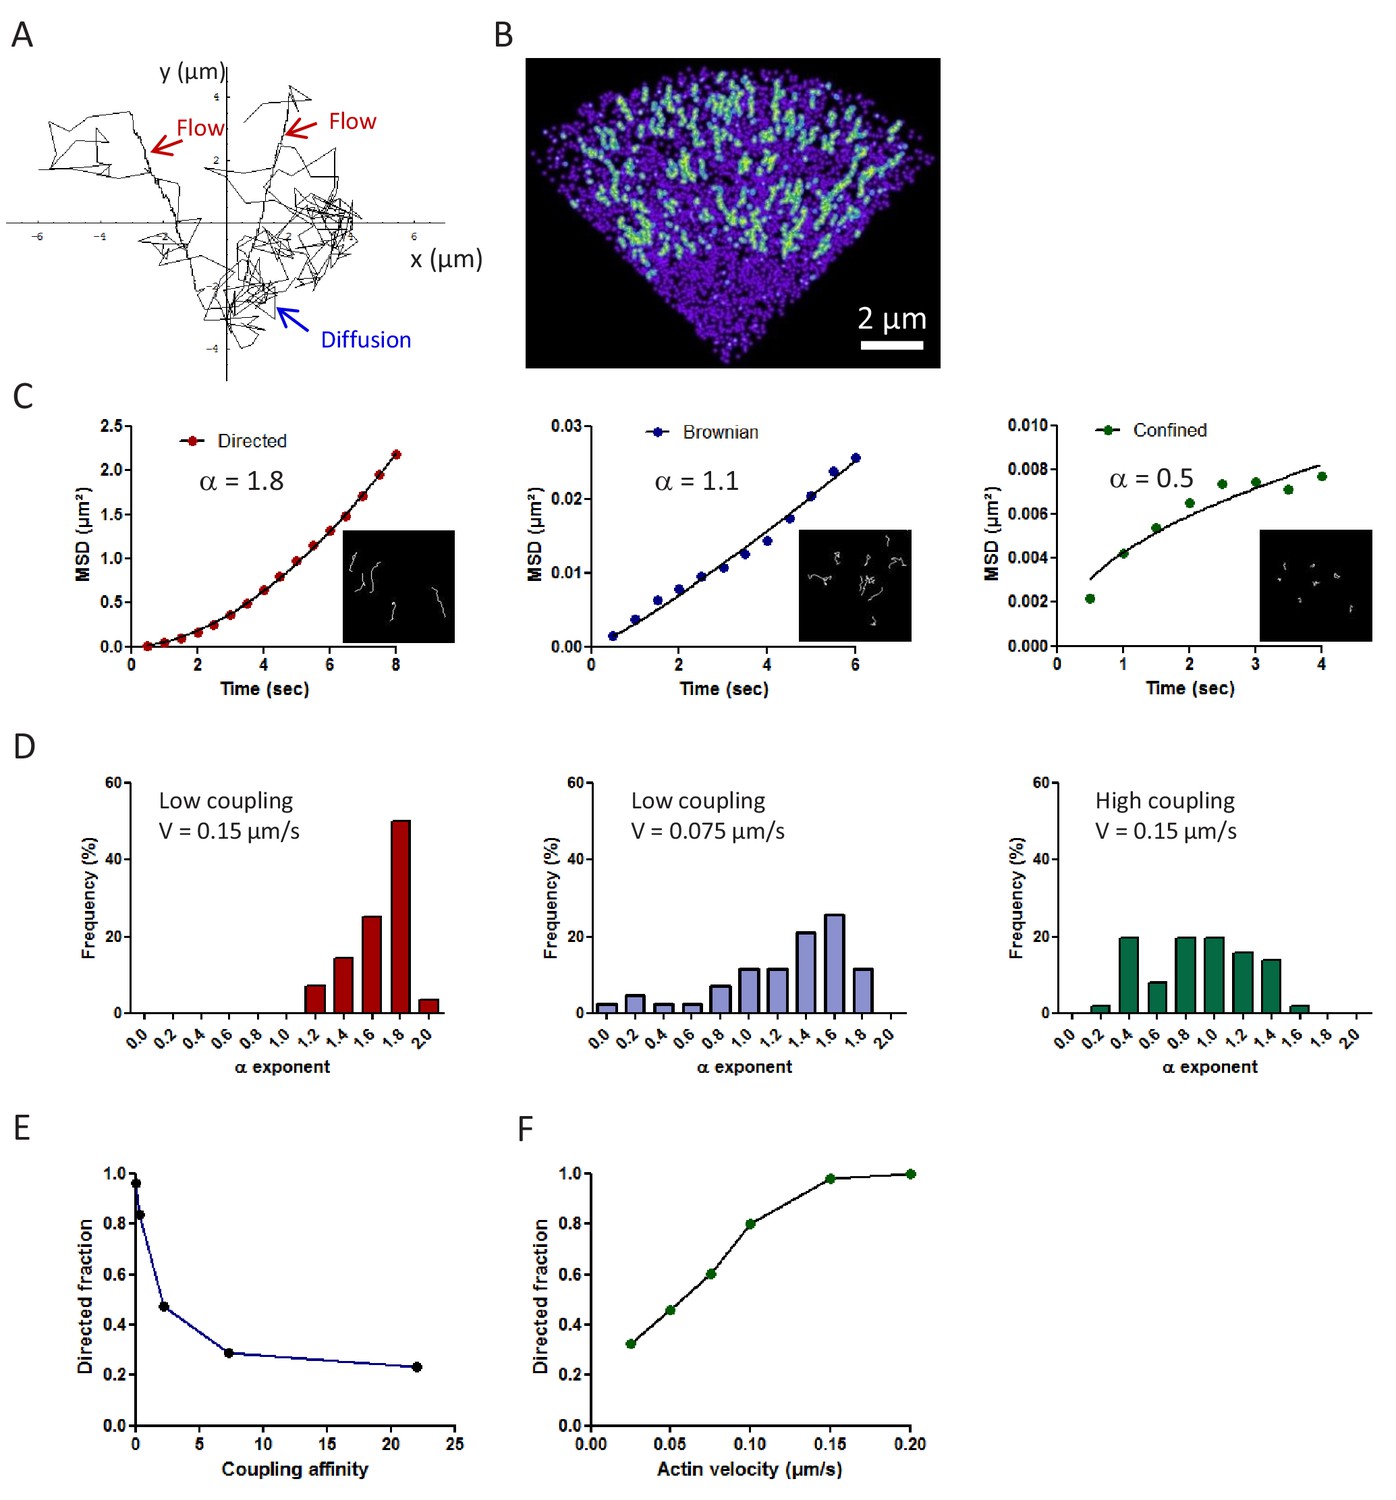
Theoretical prediction of the mechanical coupling between the actin flow and transmembrane adhesion.
(A) Example of a computer simulation showing the trajectory of a single actin molecule in a virtual growth cone (whole duration 160 s, time increment 50 ms). Actin alternates between periods of fast free diffusion when it is monomeric G-actin (blue arrow), and slow rearward flow when it is assembled in the filamentous F-actin network (red arrows). Polymerization occurs preferentially at the peripheral edge of the growth cone, and depolymerization at the base. (B) Color-coded image of a virtual growth cone showing the maximal intensity projection of 400 actin molecules, integrated over time. The fluorescence-like image is generated by representing each molecule as a Gaussian intensity profile, accumulated for 250 ms. Note intense tracks corresponding to the persistent radial motion of actin molecules incorporated in the filamentous fraction (green), and a weak blur corresponding to randomly moving actin monomers (violet). (C) Three examples of the mean square displacement (MSD) over time, for three representative trajectories of each type of motion (directed, Brownian, and confined). Inset images show individual simulated actin trajectories for different values of the coupling strength to transmembrane adhesion. Molecules are made fluorescent for short durations (<a few seconds), tightly corresponding to the experimental values measured for actin-mEos2. Only trajectories lasting more than seven frames are selected. The data were fitted by the power function 4Dtα, where D is a diffusion coefficient, and an α exponent between 0 and 2. The α-values are indicated in the graphs (correlation coefficient r > 0.95 in all cases). (D) Histograms of the distribution of α exponents for different levels of coupling strength (n = 28 and 51 trajectories, respectively) and flow velocity. (E, F) Relationship between the fraction of directed trajectories and the coupling strength or the actin velocity, respectively (n = 28–51 trajectories for each condition).
Figure 5 with 1 supplement
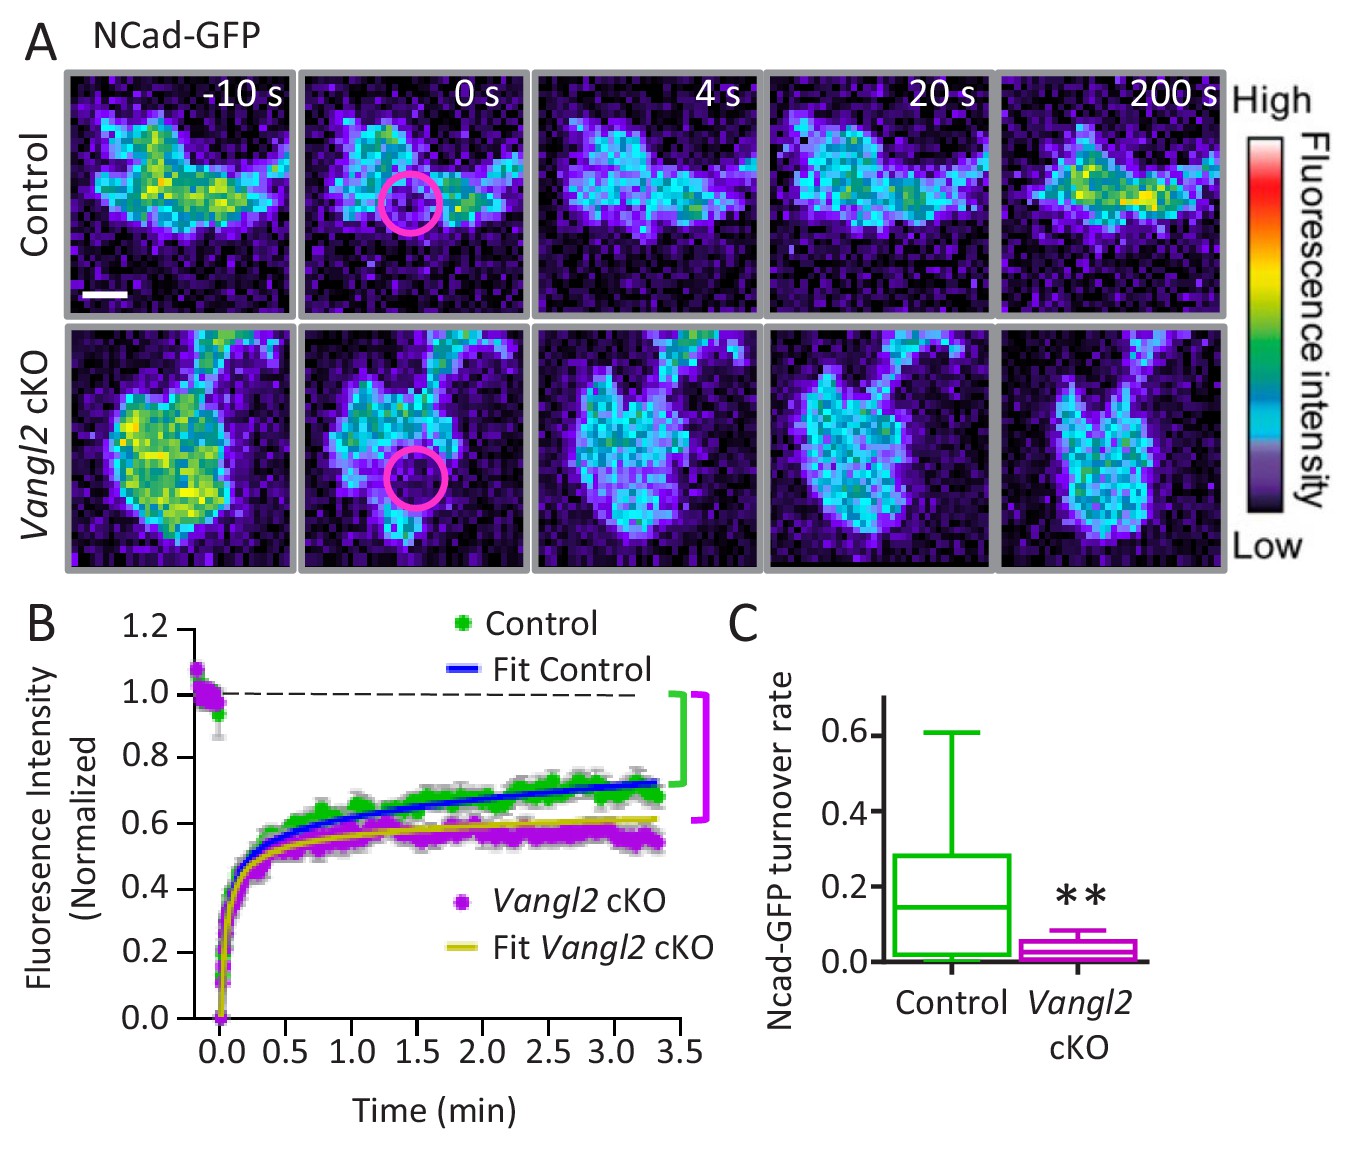
Vangl2 controls Ncad-GFP turnover in growth cones.
(A) Representative images of the recovery of Ncad-GFP after photobleaching, recorded by TIRF illumination in growth cones from controls (upper panels) and Vangl2 cKO (lower panels) neurons plated on Ncad-Fc substrates. Growth cones were photobleached in the selected area (circle, time 0 s) and the fluorescence recovery was recorded for the following 200 s (color coding). Scale bar, 5 µm. (B) Mean FRAP curves of the Ncad-GFP signal over time, containing individual data points ± SEM for each experiment. In the absence of Vangl2, the initial recovery (20 s) is similar to that of the control, but the long-term recovery is significantly lower. Solid lines represent a fitted diffusion-reaction model. (C) Quantification of the turnover rate of Ncad-GFP molecules involved in homophilic bonds at the membrane shows that protein turnover is significantly reduced (83%) in Vangl2 cKO growth cones compared to controls. n = 13–14 neurons, three experiments. Data are presented as box-and-whisker plots (min/max) based on three independent experiments; **p<0.01 by Student’s t-test (C).
Figure 5—figure supplement 1
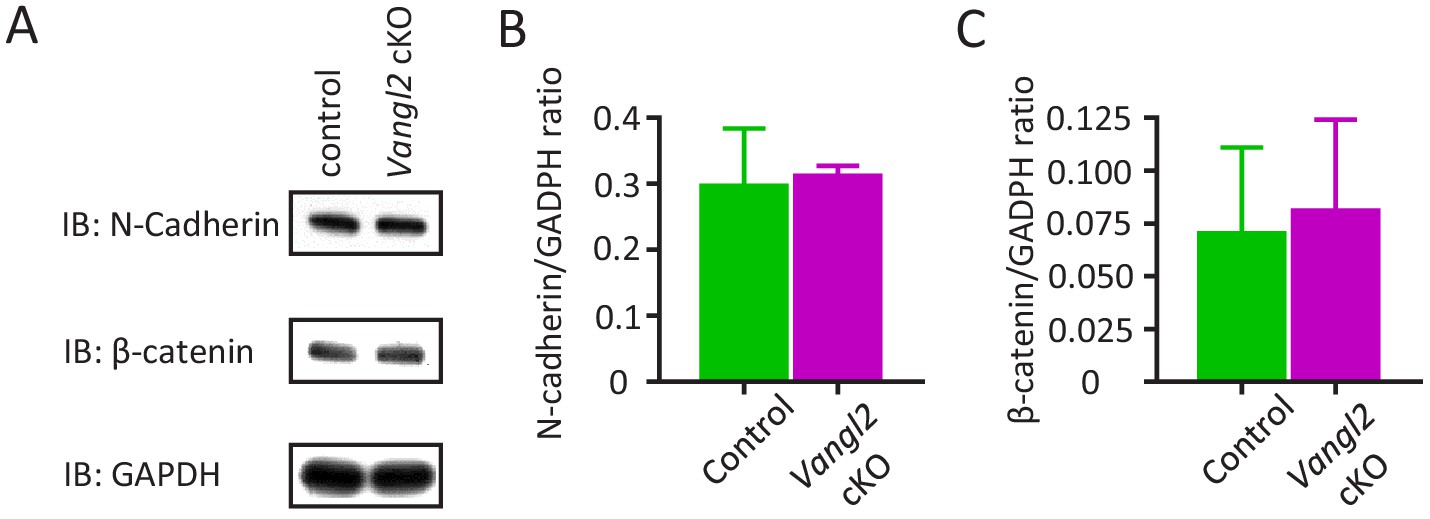
Vangl2 deletion does not affect N-cadherin expression in the hippocampus, nor the proportion of freely diffusing or confined N-cadherin at the membrane.
(A–C) Western Blots and quantifications showing expression of N-cadherin and β-catenin for both control and Vangl2 cKO mice (n = 8–9 mice from two different littermates). GADPH was used as a loading control for these experiments. Data from two independent experiments presented as mean + SEM.
Figure 6 with 1 supplement
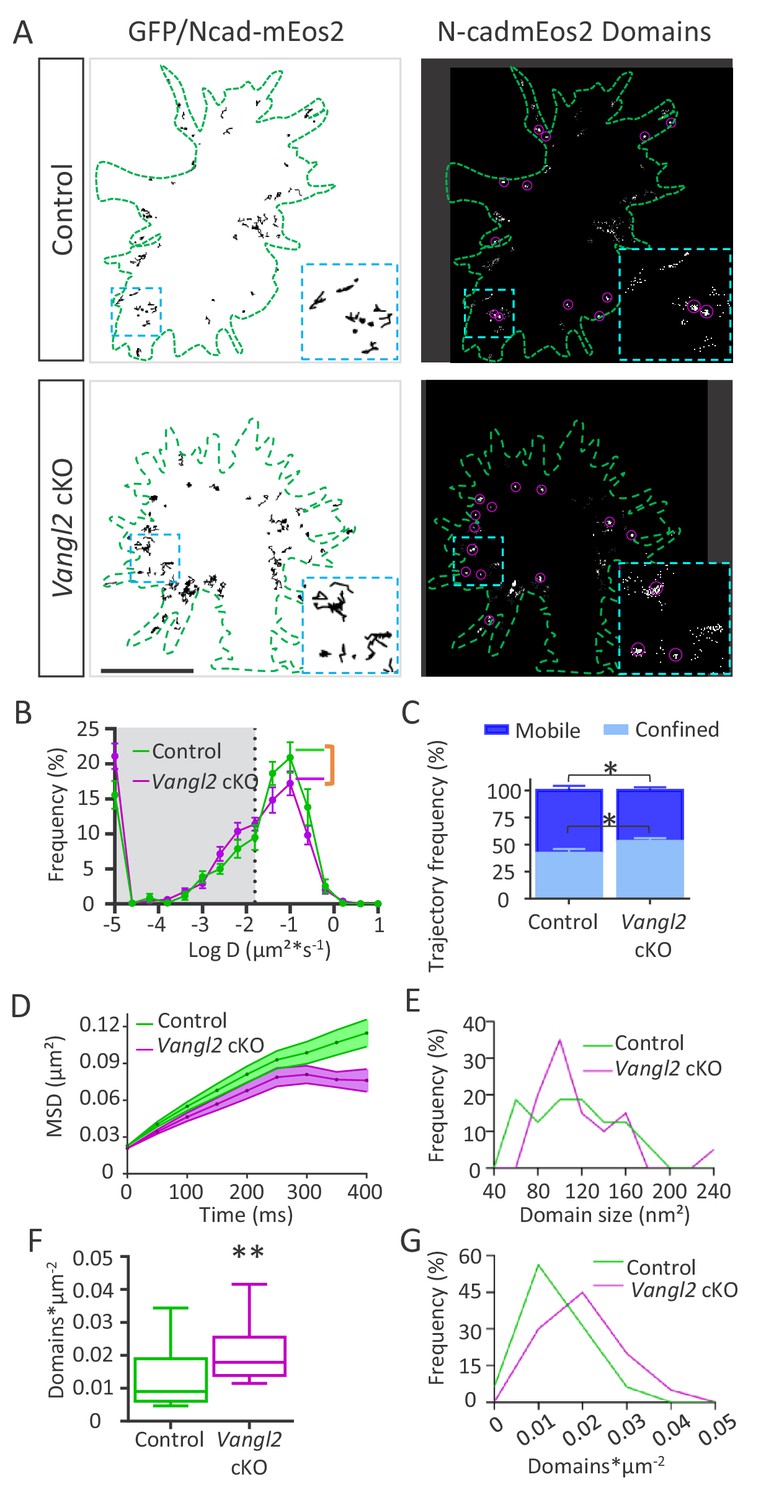
Ncad-mEos2 diffusion and domain density are altered in the absence of Vangl2.
(A) Upper panel: on the left, representative image of single Ncad-mEos2 molecules trajectories (in black) detected over a 100 s period, superimposed on the GFP-based outline of the growth cone (green); on the right, corresponding super-resolution projections of all the single N-cadherin-mEos2 molecules detected. Lower panel: Similar illustrations for Vangl2 cKO neurons expressing GFP and Ncad-mEos2. Scale bar, 2.5 µm. (B) Frequency distribution of diffusion coefficients on a logarithmic scale for control (green) and Vangl2 cKO (magenta) neurons. n = 921–1389 trajectories, 11–19 neurons. (C) Quantification of confined and mobile Ncad-mEos2 particles in control and Vangl2 cKO neurons. (D) Plot of the MSD at the periphery of growth cones as a function of time. (E) The frequency distribution of domain size at the growth cone periphery shows no significant differences between control and Vangl2 cKO neurons. (F) Density of Ncad-mEos2 domains at the growth cone periphery in control and Vangl2 cKO neurons. n = 16–20 neurons. (G) Frequency distribution of domain density at the growth cone periphery. Data are presented as box-and-whisker plots (min/max) from six different mice per genotype and three experiments. *p<0.05 and **p<0.01 by Student’s t-test (C) or the Mann-Whitney test (F).
Figure 6—figure supplement 1
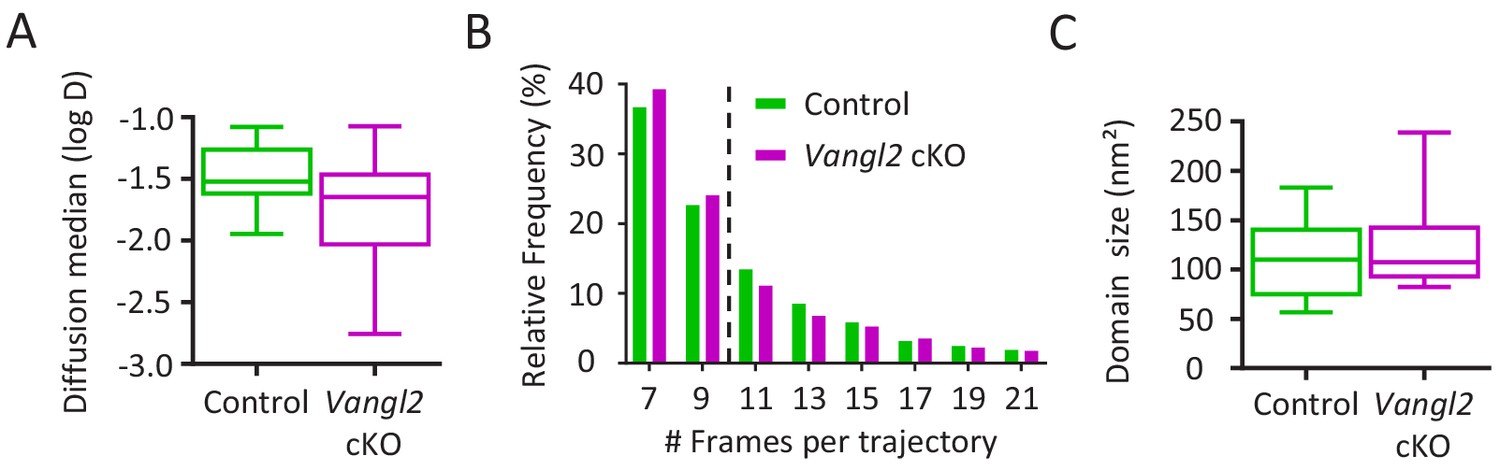
Frequency and cumulative distribution of Ncad-mEos2 molecules in growth cones.
(A) Graphic showing the diffusion median of Ncad-mEos2 molecules for both control and Vangl2 cKO neurons. (B) Distribution of the Ncad-mEos2 trajectory length shows a median trajectory (dotted line) length of 9 frames for both genotypes. (C) Quantification of the average size of Ncad-mEos2 domains. Data are presented as box –and-whisker plots (min/max) from three independent experiments.
Figure 7 with 1 supplement
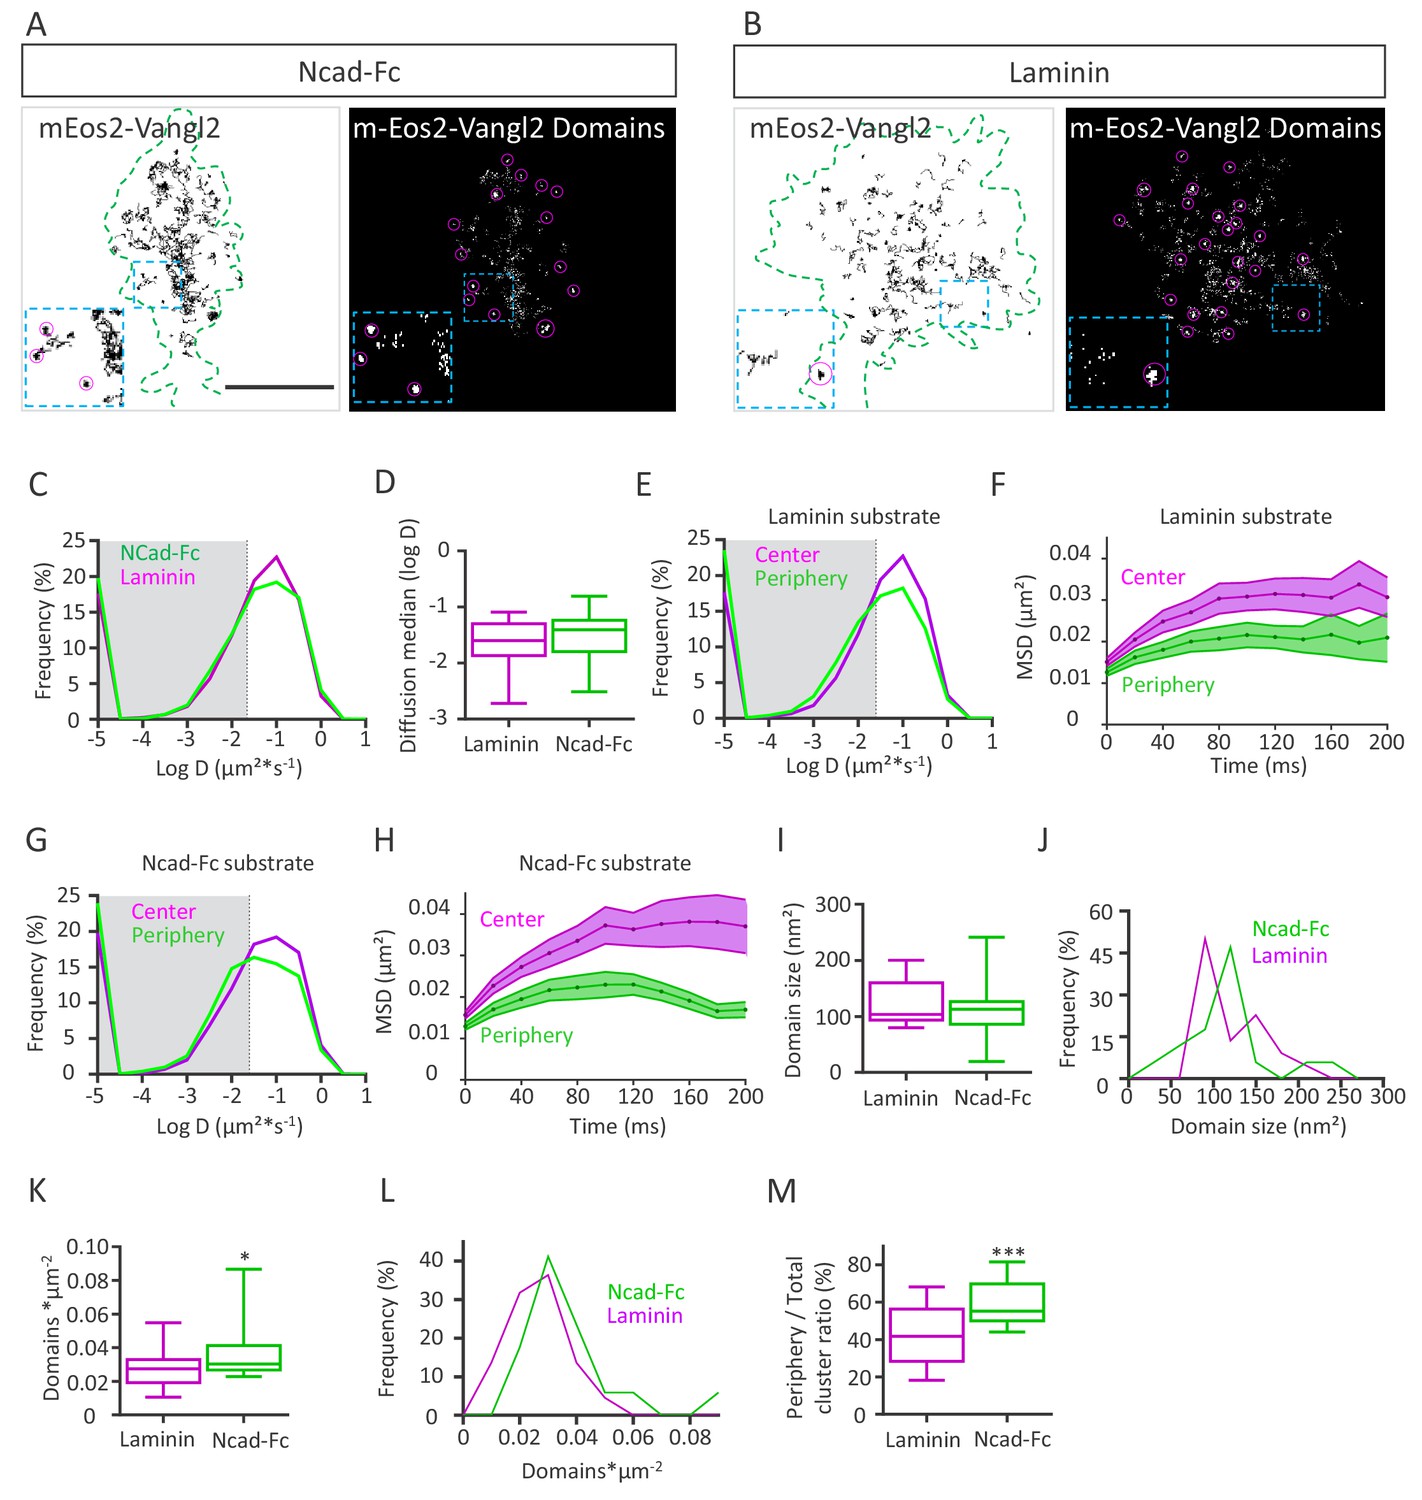
N-cadherin substrate affects Vangl2 distribution.
(A, B) Representative images of growth cones from rat neuronal growth cones (depicted in green) expressing GFP and mEos2-Vangl2 on Ncad-Fc-coated (A) or laminin-coated substrates (B). The images on the left show the trajectories of mEos2-Vangl2 molecules (black); images on the right show the corresponding super-resolution projections of all the single molecules detected. Scale bar, 2.5 µm. (C) Frequency distribution of diffusion coefficients of mEos2-Vangl2 on Ncad-Fc (green) or laminin substrates (magenta) on a logarithmic scale. (D) Median diffusion on both substrates. (E) Frequency distribution of diffusion coefficients of mEos2-Vangl2 on laminin on a logarithmic scale according to their localization at the periphery (magenta) or the center (green) of the growth cone. (F) Plot of the MSD of mEos2-Vangl2 molecules in growth cones plated on laminin substrate as a function of time. (G) Frequency distribution of diffusion coefficients of mEos2-Vangl2 on Ncad-Fc on a logarithmic scale according to their localization at the periphery (magenta) or the center (green) of the growth cone. (H) Plot of the MSD of mEos2-Vangl2 particles in growth cones plated on Ncad-Fc substrates as a function of time. n = 7707–11906 trajectories, 19–22 neurons. (I) Quantification of the average domain size of mEos2-Vangl2 in global growth cones. (J) Frequency distribution of mEos2-Vangl2 confinement domain size on Ncad-Fc or laminin substrate. (K) mEos2-Vangl2 domain density (domains*µm−2) in global growth cones on Ncad-Fc and laminin substrates. (L) Frequency distribution of mEos2-Vangl2 domain density on Ncad-Fc or laminin substrate. (M) Ratio of mEos-Vangl2 domain density at the periphery versus the entire area of the growth cone on Ncad-Fc and laminin substrates. n = 472–962 domains, 17–21 neurons. Data are presented as box-and-whisker plots (min/max) from three experiments; *p<0.05 and ***p<0.001 by the Mann-Whitney test (K) or Student’s t-test (M).
Figure 7—figure supplement 1
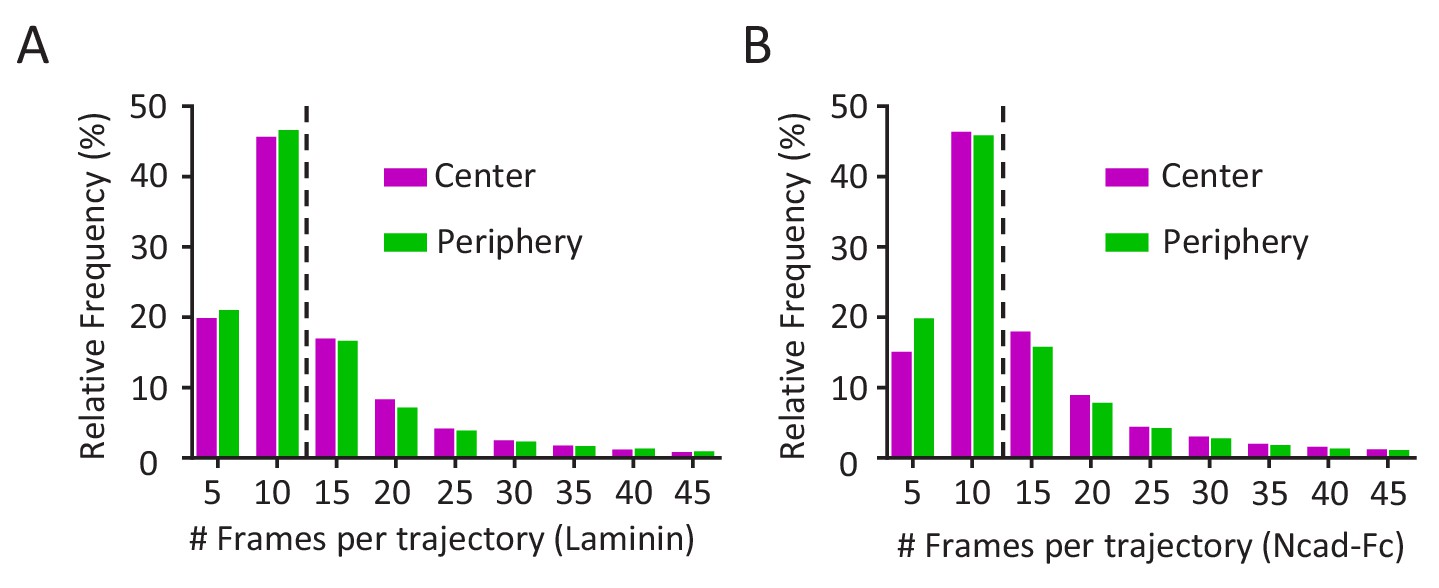
Frequency and cumulative distribution of mEos2-Vangl2 molecules in growth cones.
(A, B) Distribution of the mEos2-Vangl2 trajectory length on laminin (A) or Ncad-Fc (B) substrates show a median trajectory (dotted line) length of 11 frames for both genotypes.
Figure 8

Vangl2 regulates actin-N-cadherin coupling at the growth cone surface.
(A) Latex microspheres (1 µm) coated with either Fc fragment alone (left panel) or Ncad-Fc were placed and restrained for 2 min at the periphery of growth cones using optical tweezers for control or Vangl2 cKO neurons. Scale bar, 2.5 µm. (B) Graph showing the displacement versus time for representative Ncad-Fc coated beads on growth from Vangl2 cKO or control neurons. (C) Bead velocity calculated from the initial slope of the displacement versus time in the peripheral region (from 1 to 4 µm), after the beads have escaped the optical trap. (D) Quantification of the average time needed for the beads to escape from the center of the trap when placed on control or Vangl2 cKO growth cones. (E) Quantification of the escape probability (E.P., calculated over the first 60 s of the recordings) for beads placed on either control or Vangl2 cKO growth cones. n = 54–74 beads (12 for Fc-beads). Data are presented as box-and-whisker plots (min/max) from at least six different mice per genotype and two independent experiments. *p<0.05 by the Mann-Whitney test (D, E).
Figure 9
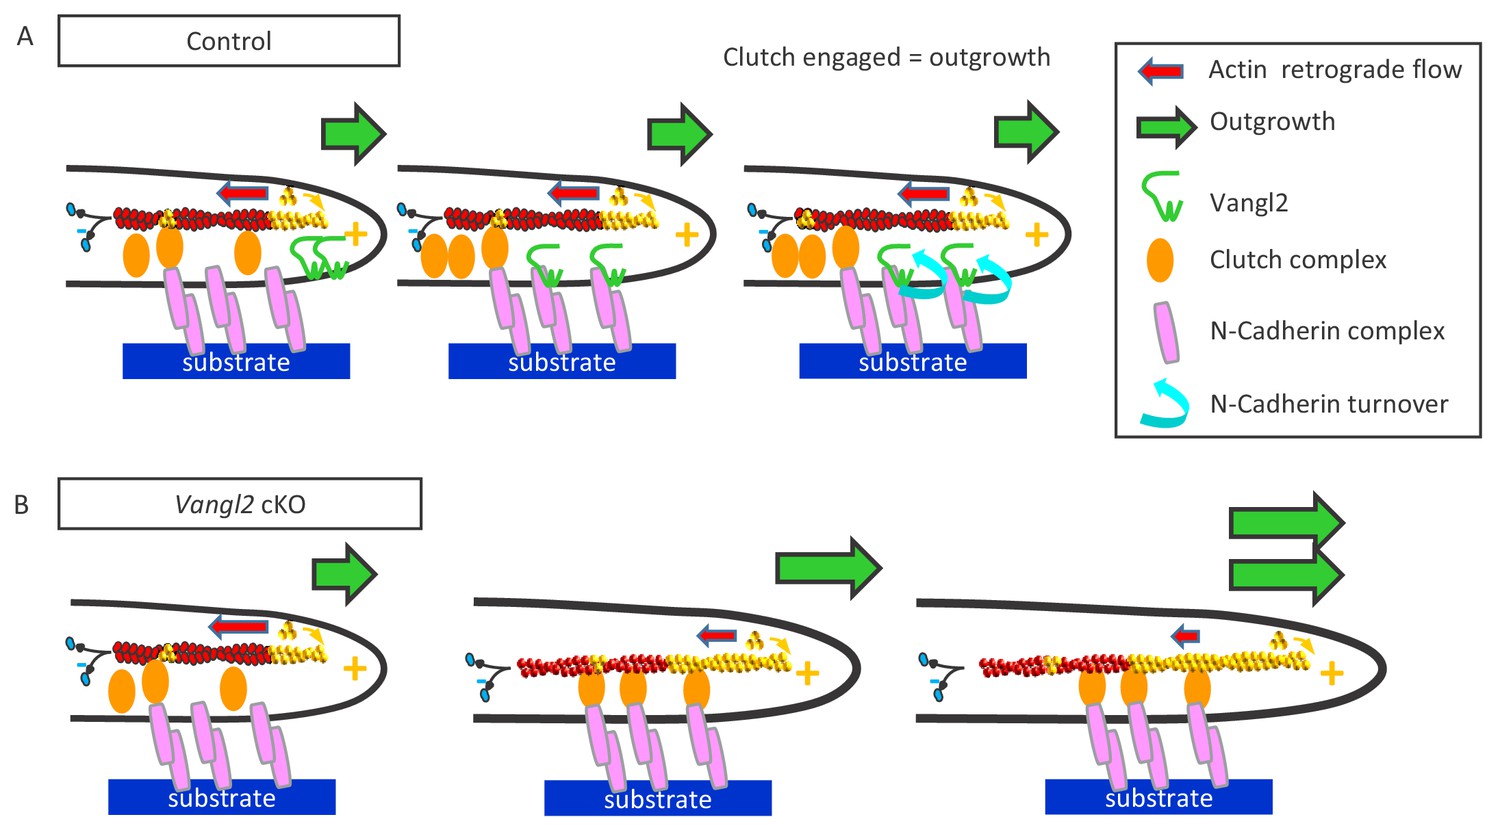
Vangl2 inhibits neuronal outgrowth by regulating N-cadherin engagement in the clutch mechanism.
(A) The retrograde actin flow is generated by constant polymerization (at the tip of filopodia/lamellipodia) and depolymerization (minus end) of actin monomers along a filament (F-actin), and participates to the extension and retraction of filopodia/lamellipodia. When permissive substrates such as N-cadherin or laminin are present in the environment they bind to corresponding cell surface receptors at the plasma membrane, which recruit specific adhesion complexes, creating a molecular link between the adhesion proteins and F-actin filaments within the growth cone. This ‘molecular clutch’ leads to the local engagement of the actin flow, causing a decrease in its speed and a proportional increase in neuronal outgrowth, due to the ongoing actin polymerization. The presence of Vangl2 at the membrane participates in the regulation of this outgrowth by controlling the number of N-cadherin molecules engaged in the clutch. If no permissive substrate is present, the link is absent, and the outgrowth is slow, while the retrograde flow is fast. (B) The absence of Vangl2 leads to an increased presence/stabilization of N-cadherin at the plasma membrane, and the engagement of more N-cadherin molecules which in turn increase the molecular clutch strength. As a result, a decreased actin retrograde flow speed and an increased neuronal outgrowth are observed.
Videos
Video 1
Time lapse video with Differential Interference Contrast (DIC) microscopy of a control growth cone growing on NCad-Fc substrate for 45 min.
Video 2
Time lapse video with DIC microscopy of a Vangl2 cKO growth cone growing on NCad-Fc substrate for 45 min.
Video 3
sptPALM-TIRF acquisition of actin-mEos2 molecules in a control growth cone plated on NCad-Fc substrate.
Video 4
sptPALM-TIRF acquisition of actin-mEos2 molecules in a Vangl2 cKO growth cone plated on NCad-Fc substrate.
Video 5
sptPALM-TIRF acquisition of actin-mEos2 molecules in a control growth cone plated on PLL substrate.
Video 6
Time lapse acquisition of EB3-GFP comets in a control growth cone plated on NCad-Fc substrate.
Video 7
Time lapse acquisition of EB3-GFP comets particles in a Vangl2 cKO growth cone plated on NCad-Fc substrate.
Video 8
sptPALM-TIRF acquisition of Ncad-mEos2 molecules in a control growth cone plated on NCad-Fc substrate.
Video 9
sptPALM-TIRF acquisition of Ncad-mEos2 molecules in a Vangl2 cKO growth cone plated on NCad-Fc substrate.
Video 10
Optical trapping and escaping of a Ncad-Fc coated bead placed on the dorsal surface of a control growth cone.
Video 11
Optical trapping and escaping of a Ncad-Fc coated bead placed on the dorsal surface of a Vangl2 cKO growth cone.
Tables
Key resources table
| Reagent type (species) or resource | Designation | Source or reference | Identifiers | Additional information |
|---|---|---|---|---|
| Strain, strain background (M. musculus) | Emx1-Cre | Jackson Laboratory (Bar Harbor, ME). | Emx1B6.129S2-Emx1tm1(cre)Krj/J | RRID:IMSR_JAX:005628 |
| Strain, strain background (M. musculus) | Vangl2 flox/flox | Ramsbottom et al., 2014 | ||
| Recombinant DNA reagent | actin-mEos2 | Garcia et al., 2015 | ||
| Recombinant DNA reagent | N-cadherin-mEos2 | Garcia et al., 2015 | Uniprot : X07277 | |
| Recombinant DNA reagent | N-cadherin-GFP | Thoumine et al., 2006 | Uniprot : X07277 | |
| Recombinant DNA reagent | EB3-eGFP | Leterrier et al., 2011 | ||
| Recombinant DNA reagent | pEGFP-C3 | Clontech | ||
| Recombinant DNA reagent | mEos2-Vangl2 | This paper | Uniprot : Q91ZD4 | |
| Transfected construct | AAV9-hSyn1-GFP-2A-GFP-f | Given by Dr G Feng; Zhang et al J Neurosci. 2016; PMID: 26888934 | Adeno-associated virus construct to transfect and express GFP. Titer: 2.4 × 10¹³ gcp/ml | |
| Other | Latex microspheres | Polysciences, | ref: 19404 | |
| Peptide, recombinant protein | ChromPure Human IgG, Fc fragment | Jackson Immuno Research | ref: 009-000-008 | 0.04 mg/mL |
| Peptide, recombinant protein | Recombinant human N-cadherin Fc chimera Protein, CF | R and D Systems | Ref 1388-NC-050 | 0.04 mg/mL |
| Antibody | AffiniPure Goat anti-human IgG, Fcγ Fragment specific | Jackson Immunoresearch | Ref 109-005-098 | 0.023 mg/mL |
| Antibody | Rabbit polyclonal anti-Vangl2 | Montcouquiol et al., 2006 | 1/500 | |
| Antibody | guinea pig polyclonalanti-Doublecortin-X | Millipore | Ref AB2253 | 1/2000 |
| Antibody | Mouse monoclonal anti-β-catenin | BD Biosciences | clone 14 | 1/200 |
| Antibody | Mouse monoclonal anti-GAPDH | Millipore | Ref AB 2302 | 1/5000 |
| Antibody | Amersham ECL Mouse IgG, HRP-linked whole Ab (from sheep) | GE Healthcare UK | Ref NA931 | 1/5000 |
| Antibody | Amersham ECL Rabbit IgG, HRP-linked whole Ab (from donkey) | GE Healthcare UK | Ref NA934 | 1/5000 |
| Antibody | Rabbit polyclonal anti-pan actin | Cytoskeleton | Ref AANO1 | 1/500 |
| Antibody | Mouse monoclonal anti-N-cadherin | BD Biosciences | clone 32 | 1/200 |
| Antibody | Mouse monoclonal Anti-Neurofilament-H | Hybridoma Bank | 2H3 | 1/100 |
| Antibody | Rabbit polyclonal anti-Cux1 | Santa Cruz | Ref Sc13024 | 1/200 |
| Other | Fluoromyelin | Thermo Fisher Scientific | BrainStain Imaging kit, Ref B34650 | 1/300 |
| Other | Phalloidin Coumarin | Sigma | Ref P2495 | 1/500 |
| Software | MetaMorph | Molecular Devices | ||
| Algorithm | PALM Tracer | Kechkar et al., 2013 | JB Sibarita | Custom made algorithm |
| Software, algorithm | Mathematica 4.1 version, Wolfram Research | Czöndör et al., 2012; Garcia et al., 2015 | O Thoumine | Custom made algorithm |
| Software | Prism 6.0 | Graphpad software | ||
| Software | Hamamatsu NDP viewer | Hamamatsu |
Additional files
-
Source code 1
Mathematica code used for the modelisation model.
- https://cdn.elifesciences.org/articles/51822/elife-51822-code1-v1.txt
-
Transparent reporting form
- https://cdn.elifesciences.org/articles/51822/elife-51822-transrepform-v1.docx
Download links
A two-part list of links to download the article, or parts of the article, in various formats.
Downloads (link to download the article as PDF)
Open citations (links to open the citations from this article in various online reference manager services)
Cite this article (links to download the citations from this article in formats compatible with various reference manager tools)
Vangl2 acts at the interface between actin and N-cadherin to modulate mammalian neuronal outgrowth
eLife 9:e51822.
https://doi.org/10.7554/eLife.51822


