Modeling the metabolic interplay between a parasitic worm and its bacterial endosymbiont allows the identification of novel drug targets
- Program in Molecular Medicine, Hospital for Sick Children, Canada
- Department of Biology, Center for Genomics and Systems Biology, New York University, United States
- Department of Computer Science, University of Toronto, Canada
- New York Blood Center, United States
- Department of Biochemistry and Molecular Pharmacology, New York University School of Medicine, United States
- Department of Epidemiology, School of Global Public Health, New York University, United States
- Department of Biochemistry, University of Toronto, Canada
- Department of Molecular Genetics, University of Toronto, Canada
Figures
Figure 1
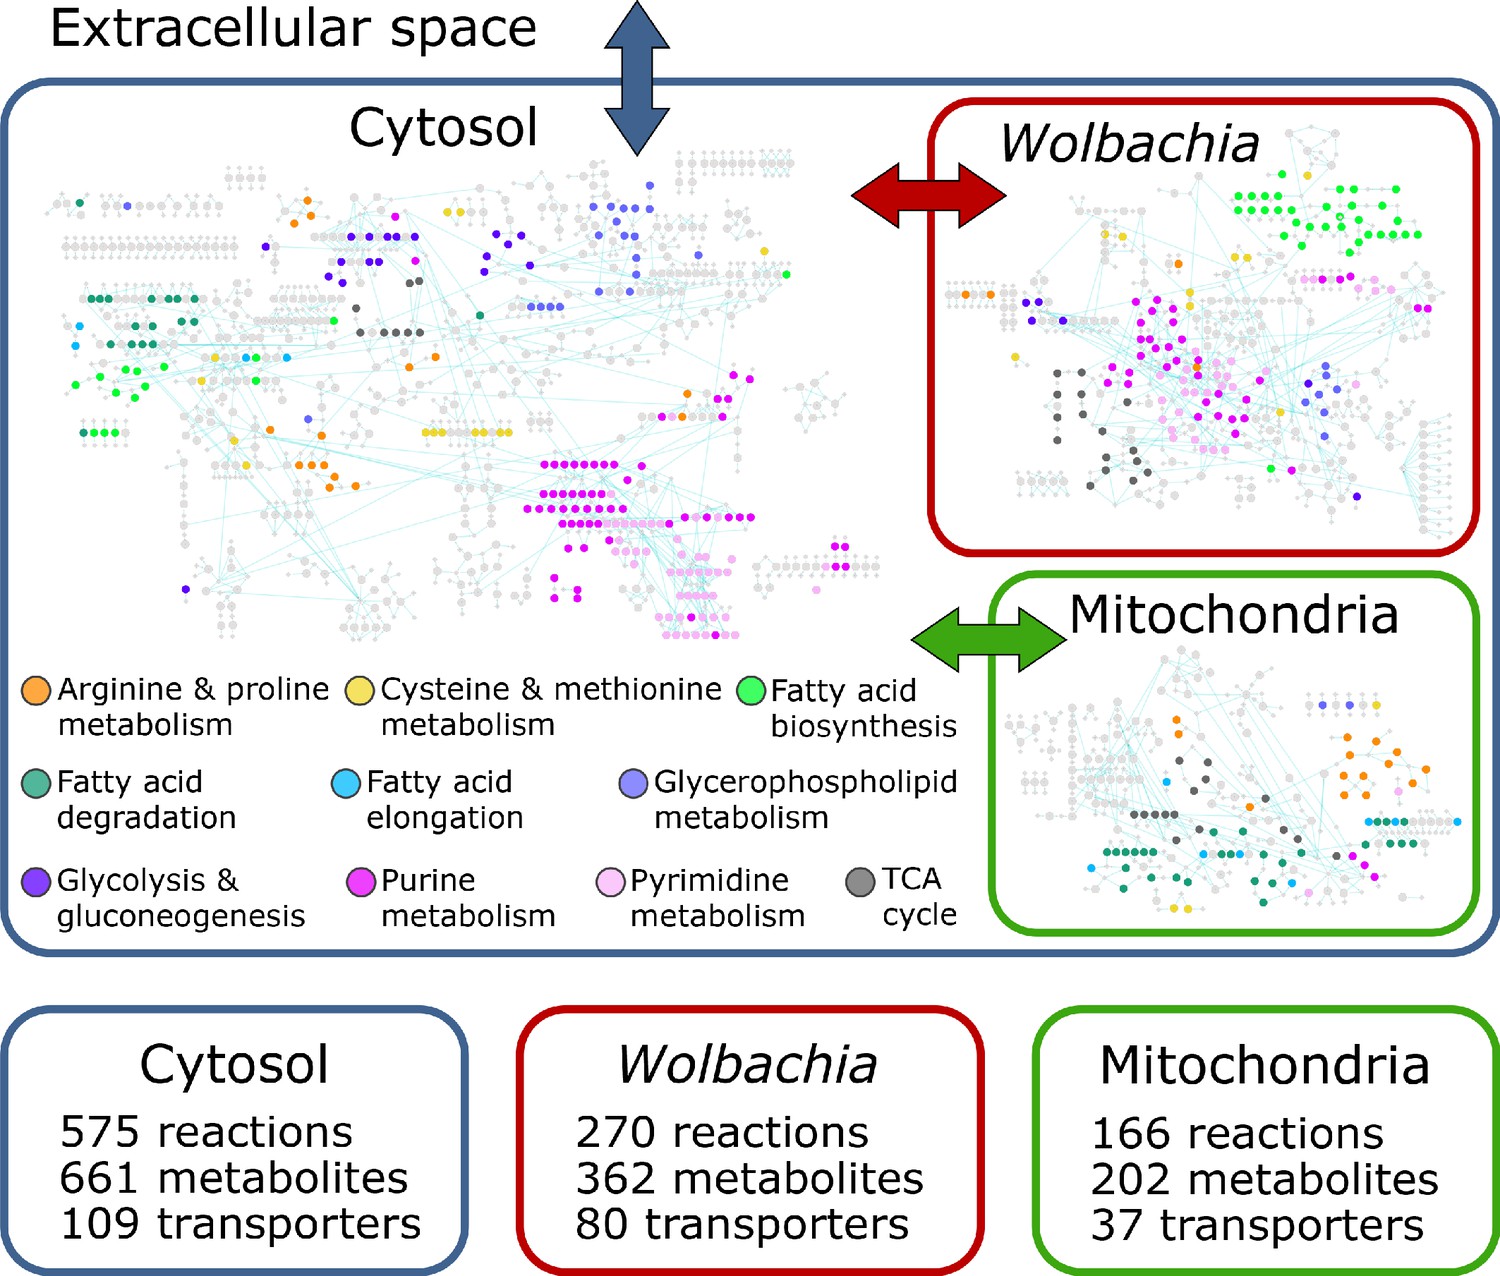
The iDC625 genome scale metabolic model.
Network representation of our metabolic reconstruction, where the large colored circles represent reactions that are connected by metabolites in light grey.
Figure 2 with 1 supplement
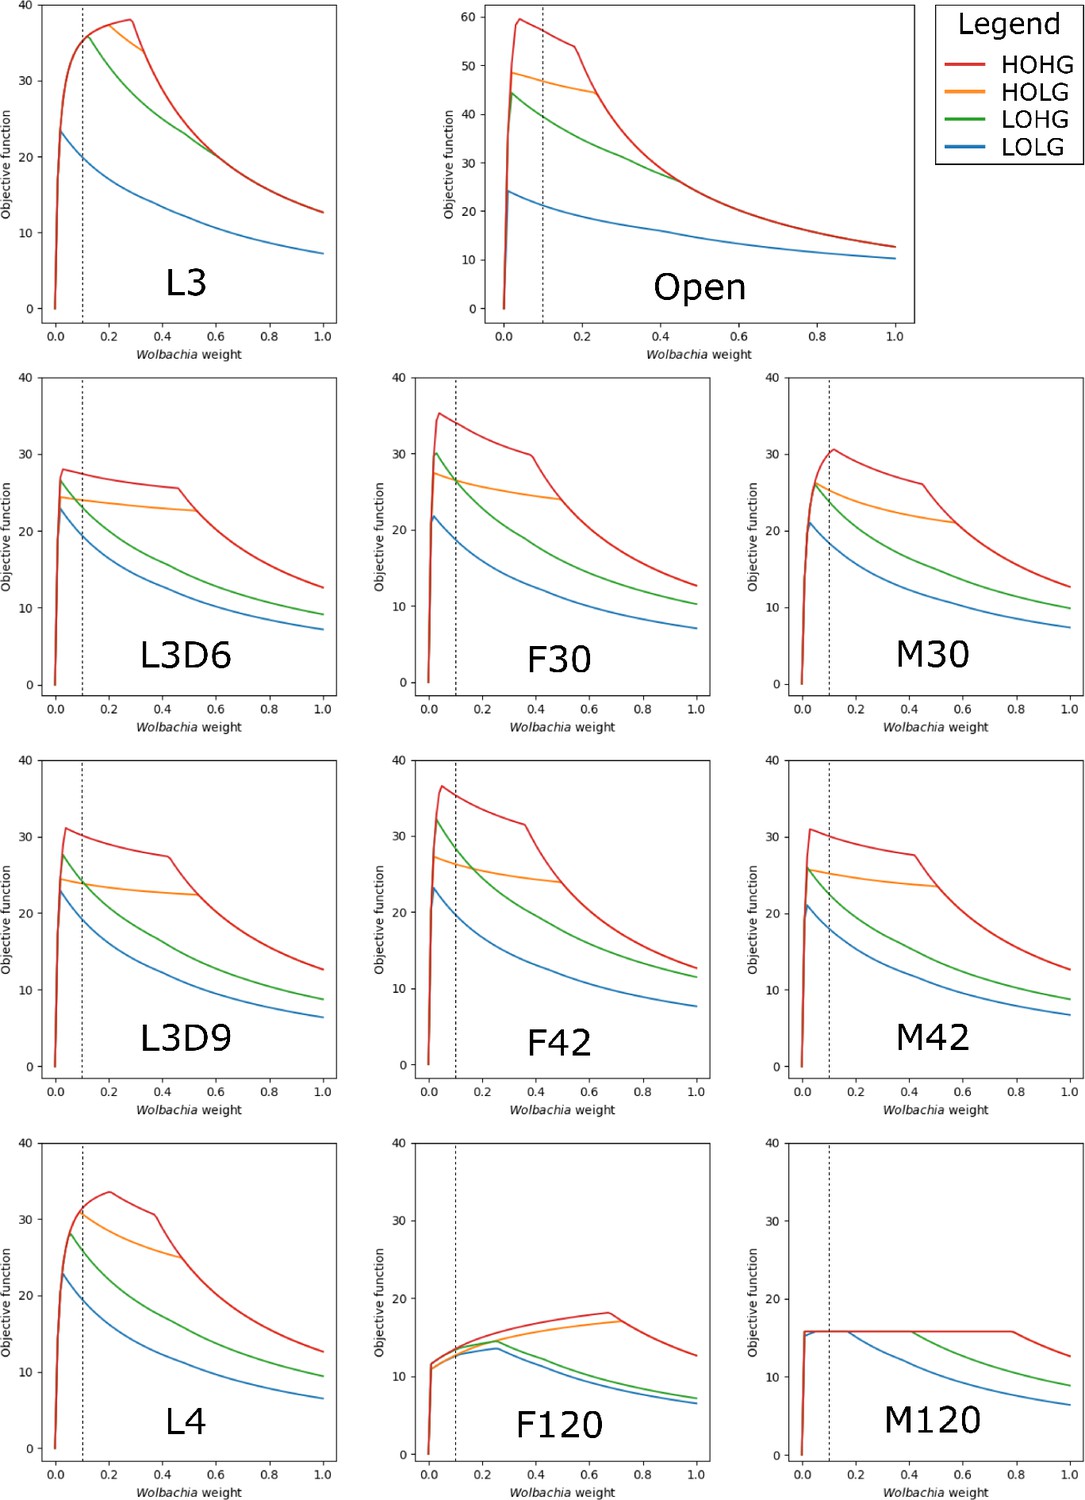
The effect of the Wolbachia weight on the maximum objective function flux under different nutrient conditions and life stages.
The life stage models were generated by mapping different stage-specific expression data on the unconstrained (Open) model: larval stage 3 (L3), L3 6 days post-infection (L3D6), L3 9 days post-infection (L3D9), L4, adult female 30 days post-infection (F30), adult female 42 days post-infection (F42), adult female 120 days post-infection (F120), adult male 30 days post-infection (M30), adult male 42 days post-infection (M42), and adult male 120 days post-infection (M120). The dashed line indicates the Wolbachia weight of 0.1, which is used in all subsequent experiments.
Figure 2—figure supplement 1
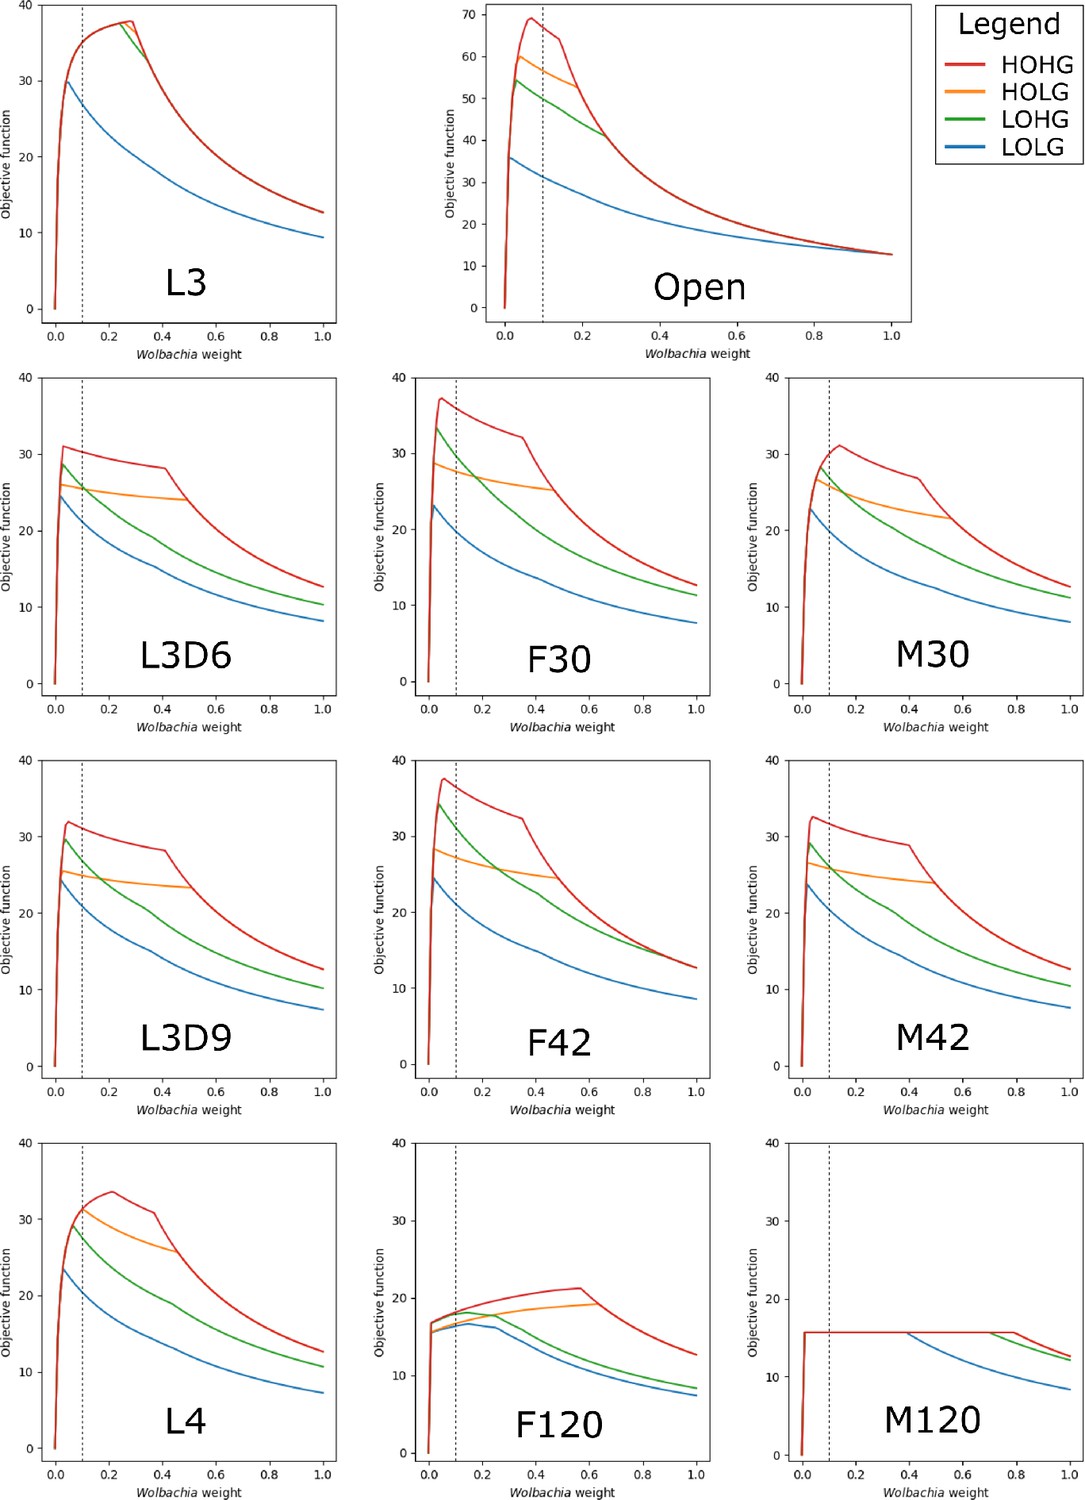
The effect of the Wolbachia weight on the maximum objective function flux when supplemented with excess pyruvate.
The life stage models were generated by mapping different stage-specific expression data on the unconstrained (Open) model: larval stage 3 (L3), L3 6 days post-infection (L3D6), L3 9 days post-infection (L3D9), L4, adult female 30 days post-infection (F30), adult female 42 days post-infection (F42), adult female 120 days post-infection (F120), adult male 30 days post-infection (M30), adult male 42 days post-infection (M42), and adult male 120 days post-infection (M120). As compared to Figure 2, the models here were provided with excess pyruvate.
Figure 3

Reaction fluxes when varying oxygen and glucose.
The activities of the objective function and five other reactions are shown for a range of 25 oxygen and 25 glucose availabilities for each life stage model. The life stage data were generated by mapping different stage-specific expression data on the unconstrained (Open) model: larval stage 3 (L3), L3 6 days post-infection (L3D6), L3 9 days post-infection (L3D9), L4, adult female 30 days post-infection (F30), adult female 42 days post-infection (F42), adult female 120 days post-infection (F120), adult male 30 days post-infection (M30), adult male 42 days post-infection (M42), and adult male 120 days post-infection (M120). For each, pFBA was performed for all 625 combinations of oxygen and glucose; the color of each pixel in the heatmap indicates the activity of the reaction at that nutrient availability, with white, dark blue, and dark red indicating no activity, maximum forward, and maximum reverse, respectively. As each reaction has a different activity profile, each has its own color legend. The four black boxes on each graph indicate what we discuss as low and high concentrations of oxygen (90 and 580 units) and glucose (45 and 250 units), and the vertical dashed line indicates the anaerobic-aerobic threshold at 205 units of oxygen.
Figure 4
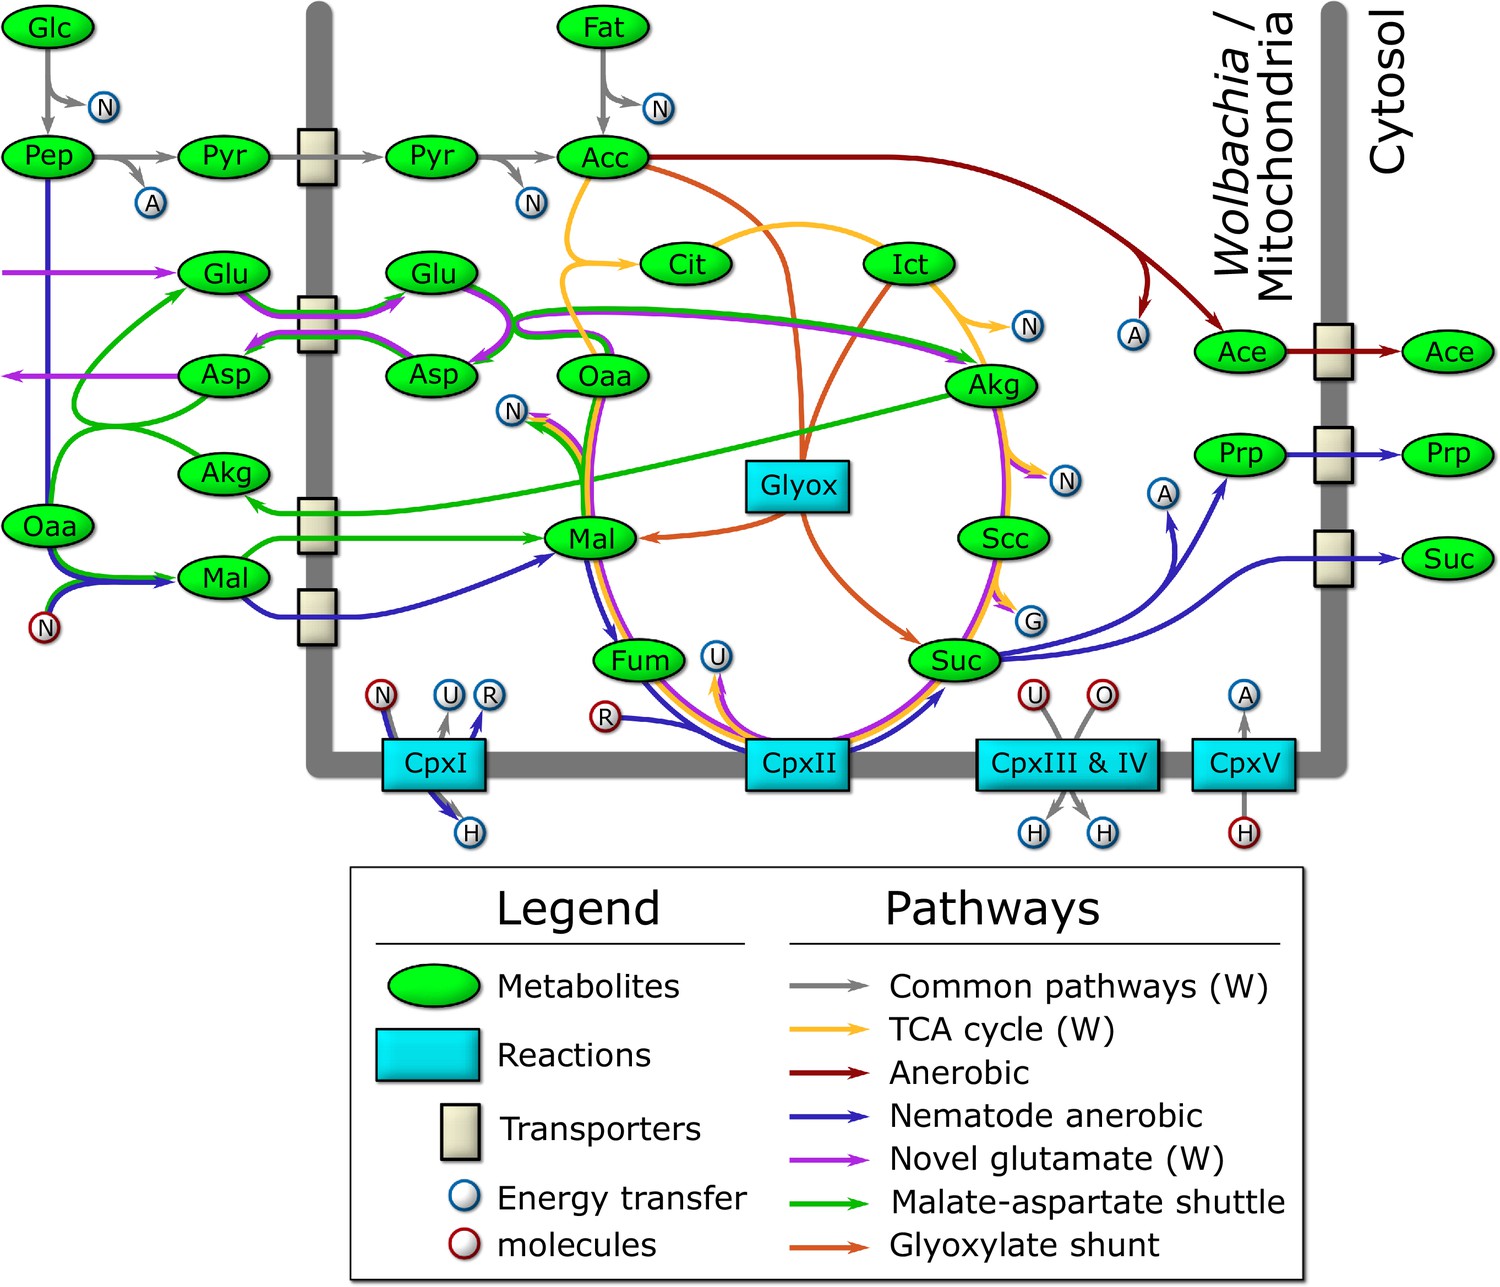
Schematic diagram of the major catabolic pathways observed in the model.
Metabolites were manually tracked in the model under many different nutrient conditions and life stage expression constraints, and the major catabolic pathways are diagrammed here. The thick dark line indicates the mitochondrial/Wolbachia membrane, and those pathways present in the Wolbachia compartment are indicated by (W). The labeled metabolites are Glc: glucose; Pep: phosphoenolpyruvate; Pyr: pyruvate; Acc: acetyl-coenzyme A; Fat: fatty acids; Cit: citrate; Ict: isocitrate; Akg: alpha-ketoglutarate; Scc: succinyl-coenzyme A; Suc: succinate; Fum: fumarate; Mal: malate; Oaa: oxaloacetate; Glu: glutamate; Asp: aspartate; Ace: acetate; Prp: propanoate. The labeled reactions are CpxI: Complex 1; CpxII: Complex 2; CpxIII: Complex 3; CpxIV: Complex 4; CpxV: Complex 5; Glyox: glyoxylate. The energy transfer molecules are common metabolites, where a blue border indicates that the molecule was produced, and a red border indicates that it was consumed. The labeled energy transfer molecules are A: ATP; G: GTP; N: NADH; U: ubiquinol; R: rhodoquinol; H: proton-motive force; O: oxygen.
Figure 5
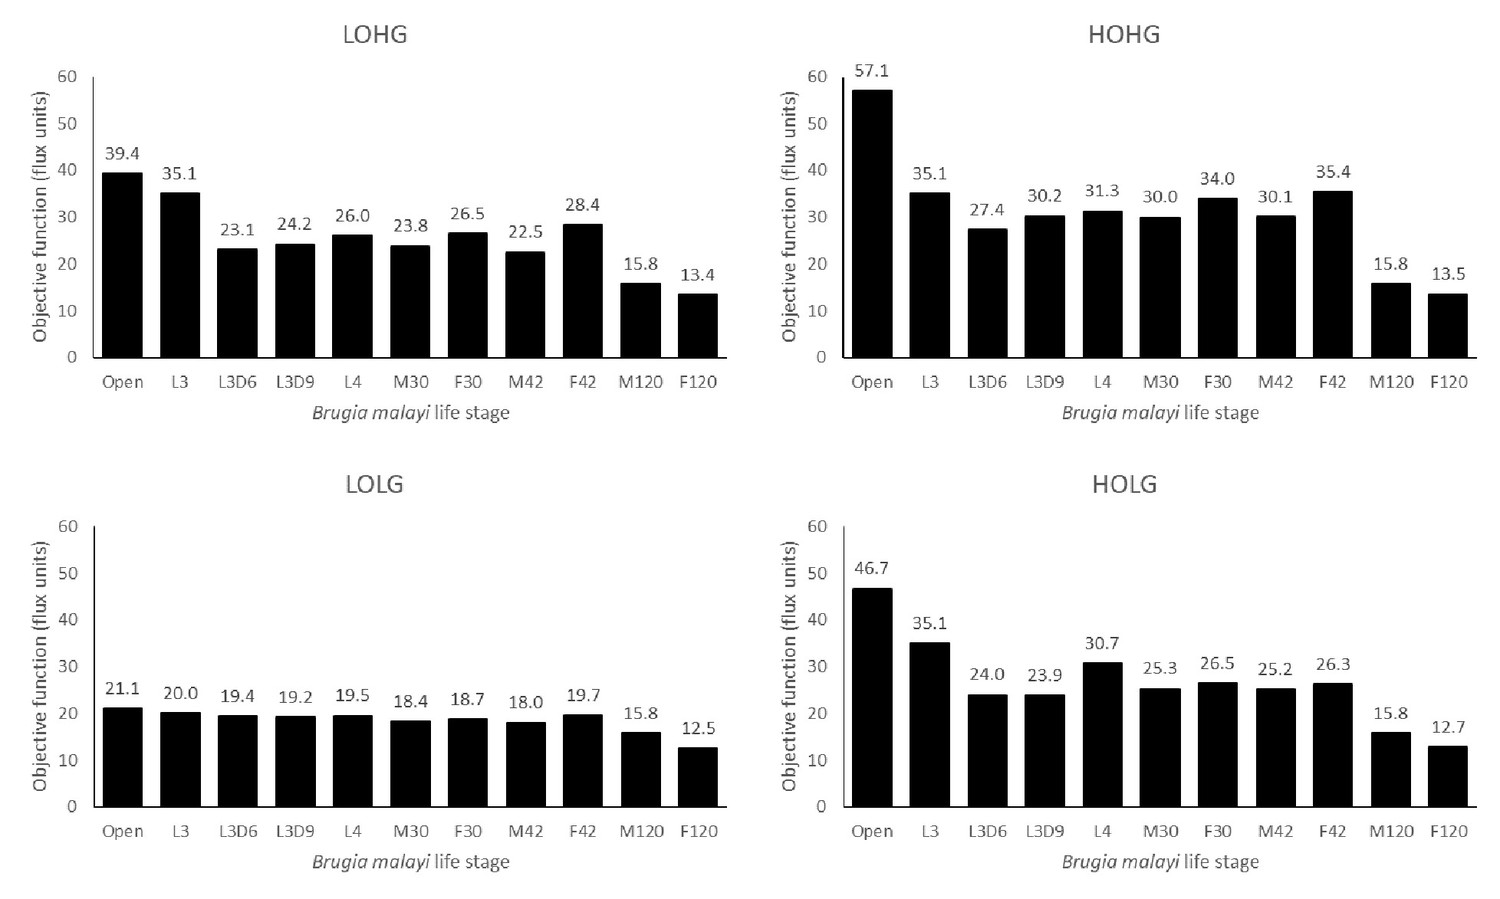
Biomass production across life stages under different nutrient conditions.
The maximum biomass produced by each life stage model under LOLG, LOHG, HOLG, and HOHG conditions.
Figure 6
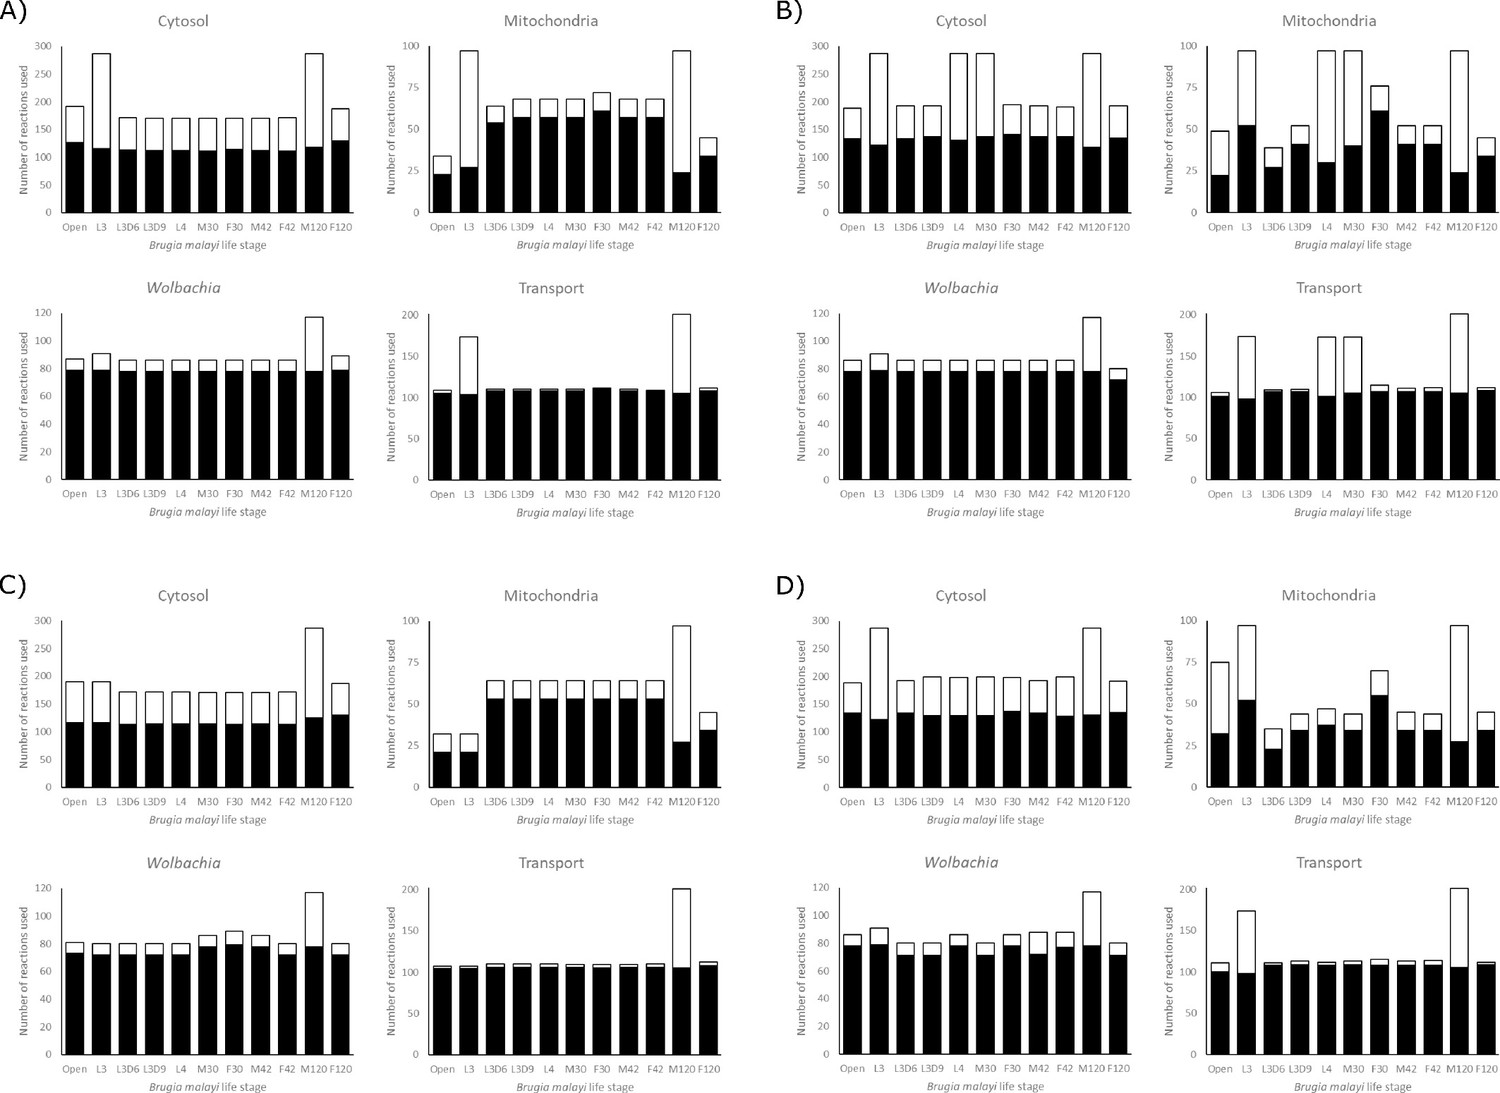
Reaction utilization across life stages.
The number of reactions used by each model in each compartment to achieve its maximum objective function flux, under A) LOHG, B) HOHG, C) LOLG, and D) HOLG conditions. The black bars indicate the number of reactions used in the most parsimonious solution, while the stacked white bars indicate the number of reactions used in all possible solutions that yield the same value for the objective function. The larger the height discrepancy between the two bars, the more redundant pathways the model has available to achieve the same objective function flux.
Figure 7
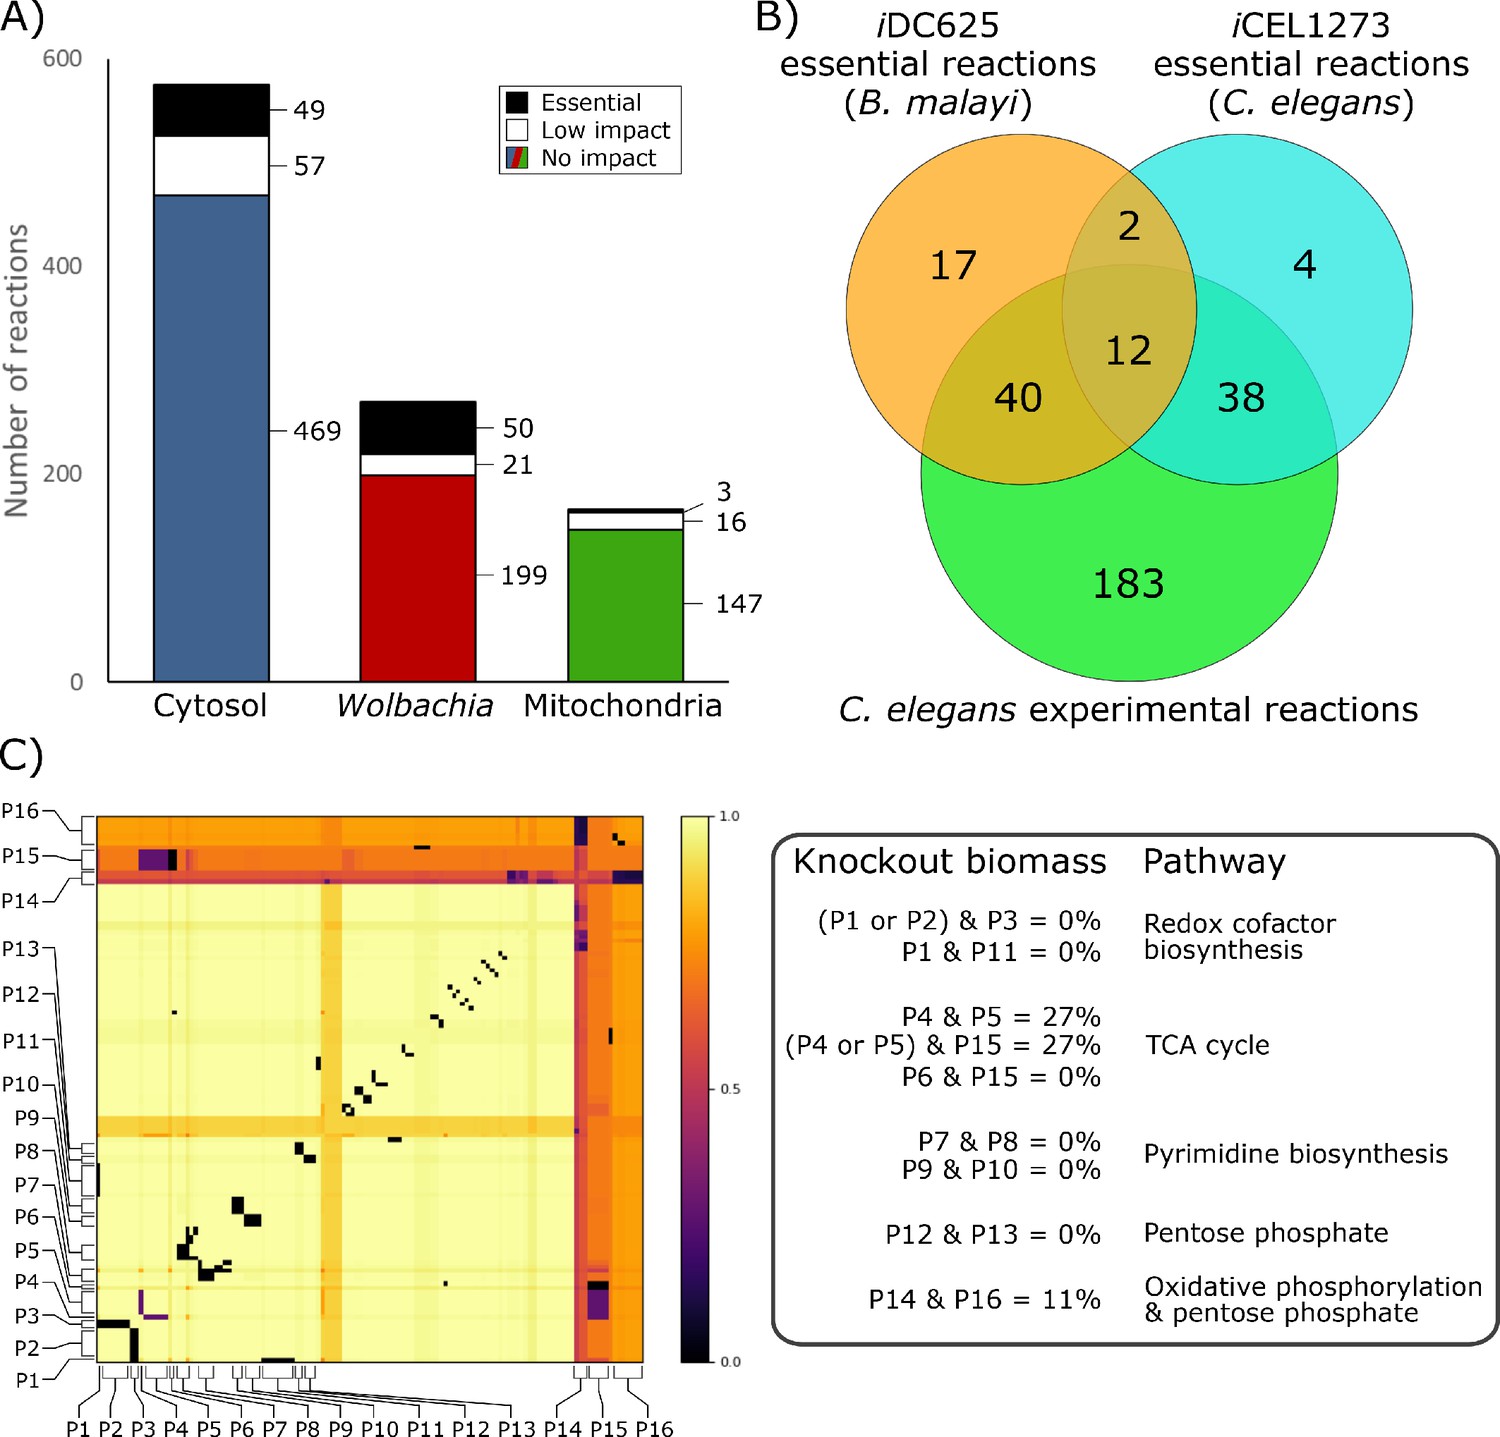
Essential reactions in the model.
(A) Breakdown of the essentiality of the model reactions by their compartment. No impact indicates the model’s optimized biomass objective function was unaffected, low impact indicates biomass was ≥50% of baseline, and essential indicates that biomass was <50% of baseline. (B) A Venn diagram of the overlap in predicted essential reactions between our model, the previously published iCEL1273 C. elegans metabolic reconstruction, and experimentally determined essential reactions in C. elegans. All three sets of reactions represent only those that are present in both iDC625 and iCEL1273. (C) A heatmap showing the effects of double knockout combinations of 129 reactions that resulted in biomass <50% of baseline. A value of 1.0 (light yellow) indicates that there was no effect from the knockout, while a value of 0.0 (black) indicates that the model was unable to produce any biomass. Pathways are defined as containing one or more reactions, and 16 of the major pathways are labeled on the heatmap (P1 – P16). The legend on the right describes the interactions observed between the pathways, and their general functions.
Figure 8

Anthelmintic activity against adult B. malayi worms.
(A) Shows the number of Wolbachia detected per worm, normalized against the control group and (B) shows the number of microfilariae produced per worm, normalized against the control group. In both data sets significance was detected using a single factor ANOVA, followed by 2-tailed t-tests between each drug and the control with a Bonferroni correction. Error bars indicate the standard deviations; * indicates p<0.05; ** indicates p<0.01; *** indicates p<0.001.
Tables
Table 1
Details about the three drugs tested for anti-filarial activity against B. malayi adult worms.
| Drug | Predicted target pathway | Developed for | Concentration (µM) |
|---|---|---|---|
| Fosmidomycin | Isoprenoid precursor biosynthesis | Antibiotic/antimalarial | 12.5 |
| MDL-29951 | Gluconeogenesis | Epilepsy | 12.5 |
| Tenofovir | Purine metabolism | Hepatitis B | 12.5 |
Table 2
Expression of the predicted drug target genes across B. malayi life stages.
| Target gene | Life stage expression (FPKM) | ||||||||||
|---|---|---|---|---|---|---|---|---|---|---|---|
| L3 | L3D6 | L3D9 | L4 | F30 | F42 | F120 | M30 | M42 | M120 | ||
| Fosmidomycin | Wbm0179 | 12 | 17 | 18 | 11 | 27 | 11 | 16 | 37 | 31 | 3 |
| MDL-29951 | Bm13850 | 45 | 21 | 22 | 30 | 22 | 24 | 6 | 31 | 17 | 14 |
| Wbm0158 | 68 | 66 | 69 | 49 | 27 | 40 | 80 | 29 | 40 | 95 | |
| Tenofovir | Bm9070 | 0 | 0 | 0 | 0 | 0 | 1 | 1 | 1 | 4 | 26 |
| Wbm0321 | 34 | 13 | 14 | 4 | 5 | 3 | 15 | 0 | 18 | 6 | |
| Tenofovir-associated | Bm3965 | 18 | 19 | 20 | 11 | 57 | 33 | 14 | 15 | 19 | 17 |
| Bm14014 | 419 | 101 | 119 | 105 | 76 | 93 | 21 | 75 | 49 | 32 | |
Additional files
-
Supplementary file 1
Supplemental information.
- https://cdn.elifesciences.org/articles/51850/elife-51850-supp1-v1.docx
-
Supplementary file 2
Metabolomics.
- https://cdn.elifesciences.org/articles/51850/elife-51850-supp2-v1.xlsx
-
Supplementary file 3
Drug target hits.
- https://cdn.elifesciences.org/articles/51850/elife-51850-supp3-v1.xlsx
-
Transparent reporting form
- https://cdn.elifesciences.org/articles/51850/elife-51850-transrepform-v1.docx
Download links
A two-part list of links to download the article, or parts of the article, in various formats.
Downloads (link to download the article as PDF)
Open citations (links to open the citations from this article in various online reference manager services)
Cite this article (links to download the citations from this article in formats compatible with various reference manager tools)
Modeling the metabolic interplay between a parasitic worm and its bacterial endosymbiont allows the identification of novel drug targets
eLife 9:e51850.
https://doi.org/10.7554/eLife.51850


