Collective forces of tumor spheroids in three-dimensional biopolymer networks
- Department of Physics, Friedrich-Alexander University Erlangen-Nürnberg, Germany
- Children's Cancer Research Unit, The Children's Hospital at Westmead, Australia
- School of Medical Sciences and Children’s Hospital at Westmead Clinical School, University of Sydney, Australia
- Department of Gynecology and Obstetrics, Laboratory for Molecular Medicine, University Hospital Erlangen, Friedrich-Alexander University Erlangen-Nürnberg, Germany
- Institute of Pathology, University Hospital Erlangen, Germany
Figures
Figure 1 with 3 supplements
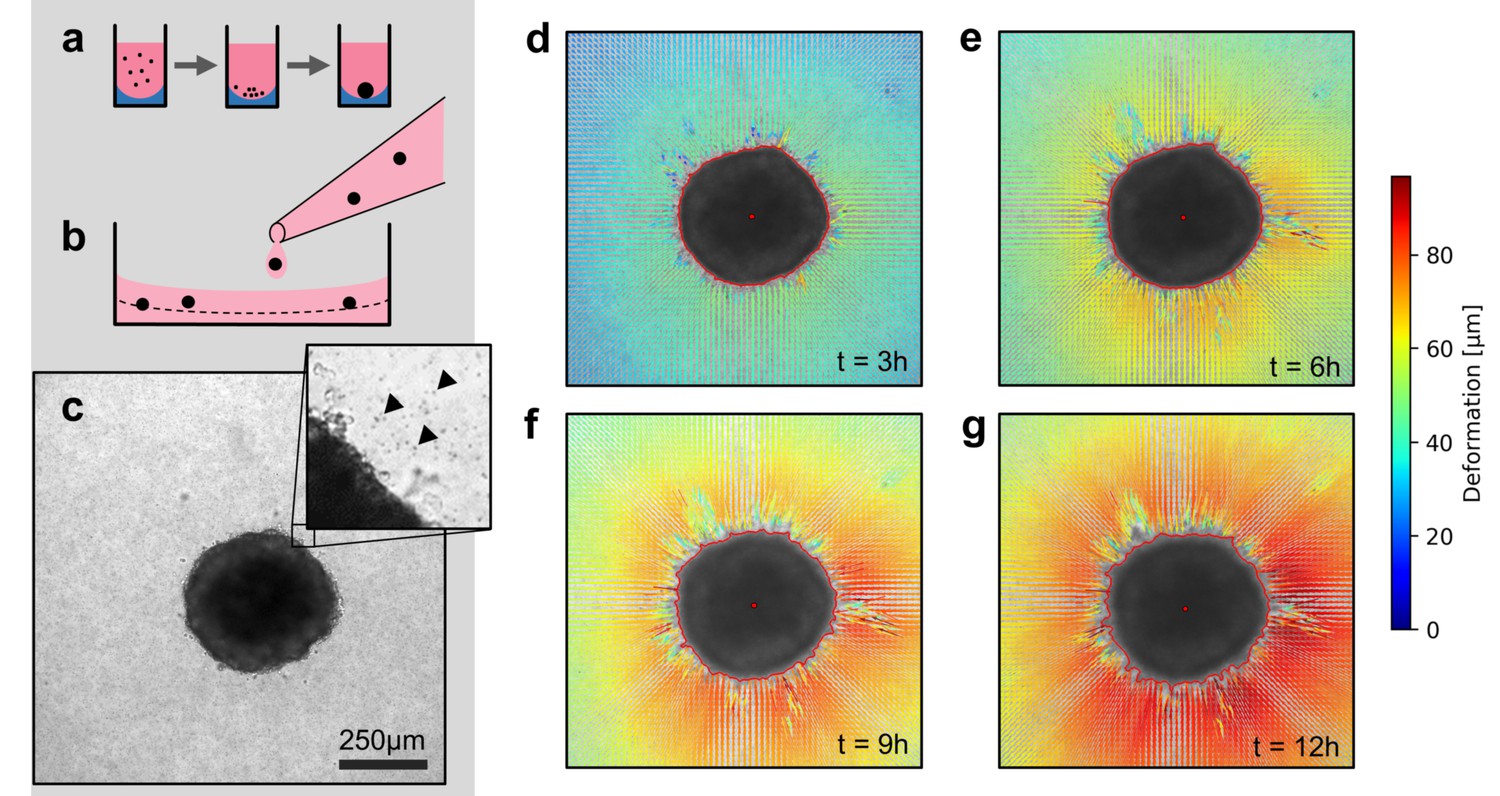
Spheroid formation and collagen contractility assay.
(a) Spheroid generation process within non-adhesive U-shaped wells. (b) Spheroid embedding process in collagen gels. The spheroids are suspended in a collagen solution and subsequently pipetted onto a pre-poured layer of collagen (indicated by the dashed line). (c) Exemplary brightfield image of the equatorial plane of a U87 spheroid containing 7,500 cells. The inset shows the edge of the tumor spheroid and the micron-sized fiducial markers (arrows) that are added to the collagen solution. (d-g) Deformation field obtained by particle image velocimetry, 3 h, 6 h, 9 h and 12 h after the collagen gel has polymerized. The spheroid outline is determined by image segmentation and indicated by the red line.
Figure 1—figure supplement 1
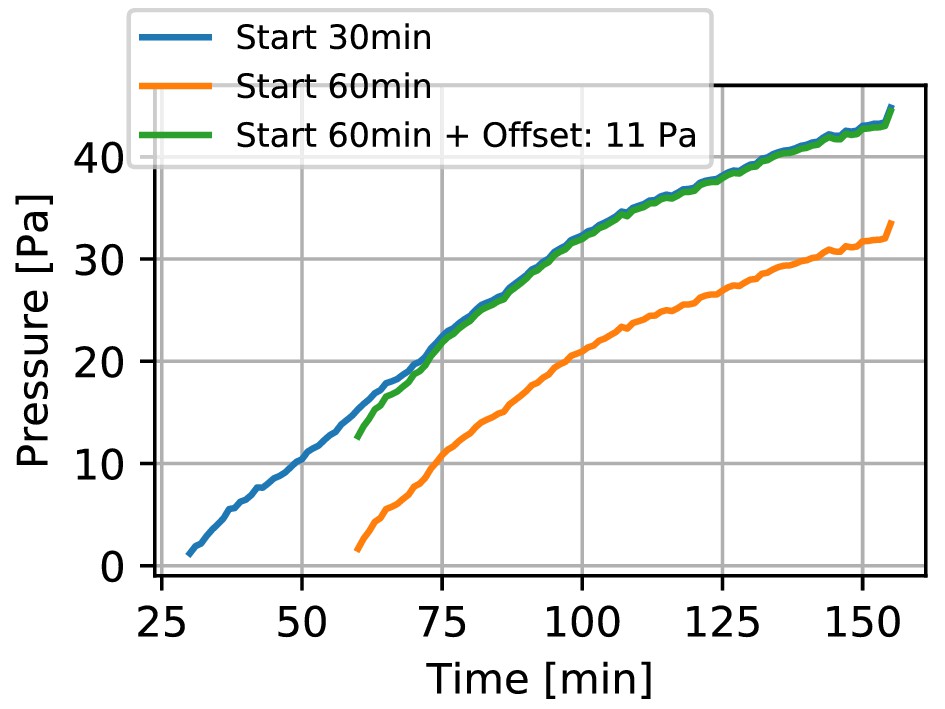
Displacement during collagen polymerization.
Contractile pressure of a spheroid generated from 4000 primary Luminal B breast cancer cells versus time after collagen gel polymerization has been initiated (by increasing the pH of the collagen solution to 10). The orange line indicates the contractile pressure as measured in a regular experiment that starts 60 min after the gel polymerization has been initiated. This waiting time ensures that gel polymerization is complete. As the spheroid may start to contract the surrounding matrix earlier (resulting in displacements that we do not capture in our measurement), our method generally underestimates the spheroid contractility. In an exemplary experiment, we started to record time lapse images of a spheroid using confocal reflection microscopy as soon as the collagen fibers became visible in the reflection channel (30 min after the pH of the collagen solution was increased to 10). From the collagen fiber displacements over the following 30 min of the experiment (60 min after initiation of polymerization), we find a contractile pressure (blue line) of 11 Pa. Given that these spheroids typically reach a contractile pressure of several hundred Pa within 24 h, this systematic error from neglecting the fiber displacements during the first 60 min is small. See also Video 1.
Figure 1—figure supplement 2
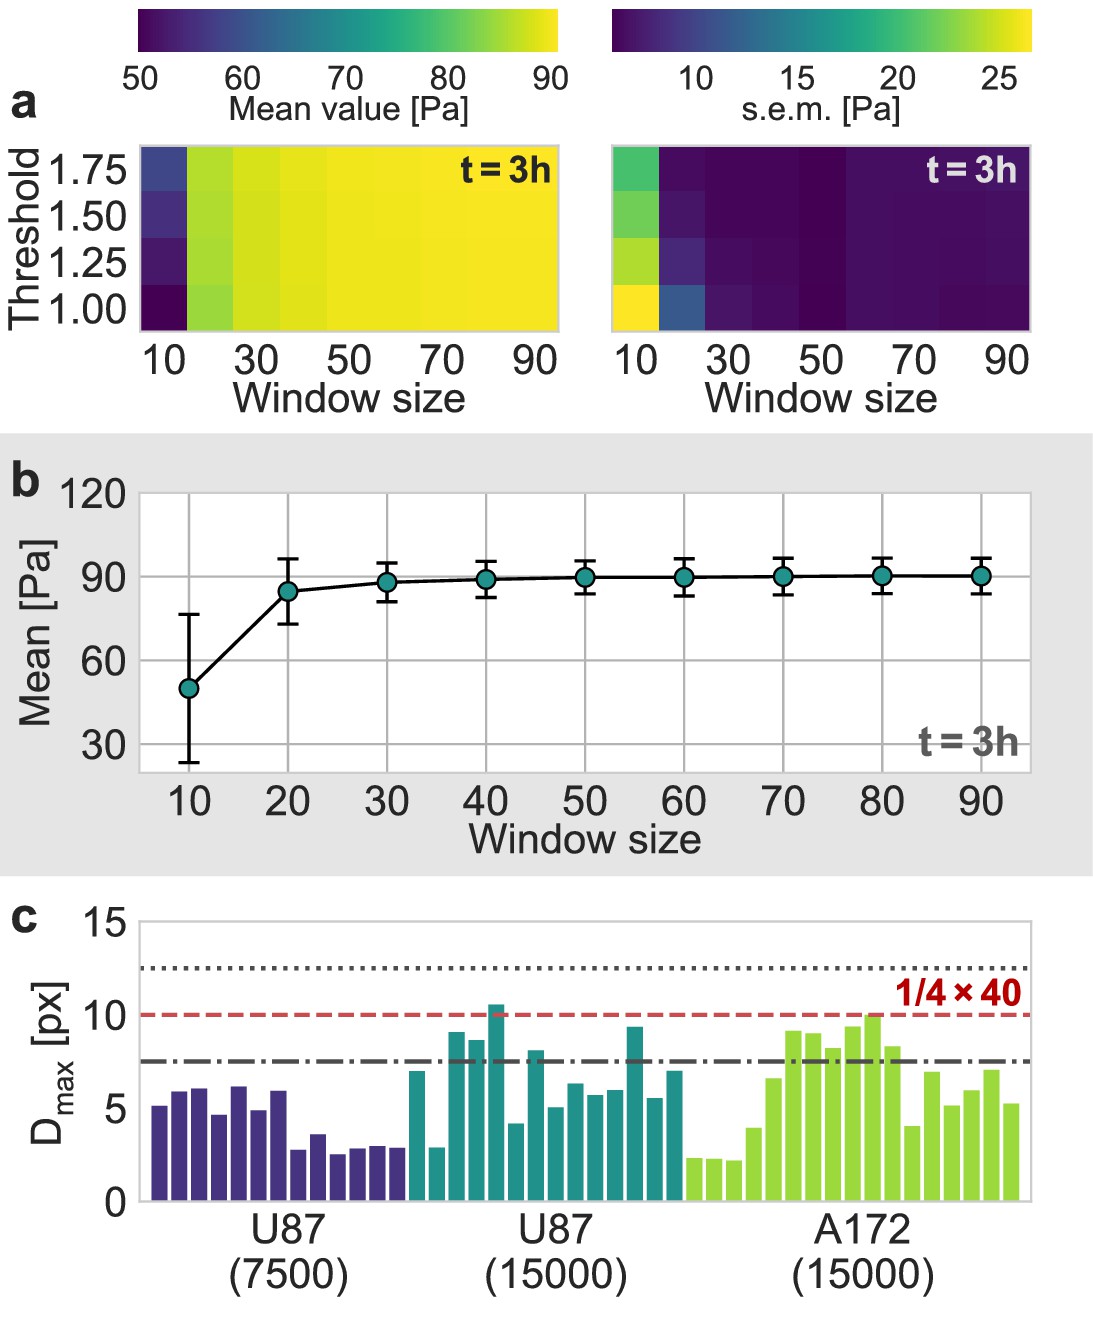
Evaluation of Particle Image Velocimetry.
(a) Estimated mean pressure value (left) and the corresponding standard error (right) of an exemplary U87 spheroid, 3 h after the experiment started, as a function of the window size and the signal-to-noise threshold used in the PIV-analysis. (b) Mean estimated pressure as a function of the window size, for a signal-to-noise threshold of 1.0, that is without any filtering of the estimated deformations. (c) The 99th percentile of all measured absolute displacements during the first two hours of the experiment, , for all individual spheroids. The dashed red line represents the upper boundary of for a window size of 40 px, according to the one-quarter-rule. The dot-dashed line and the dotted line correspond to the upper boundary for a window size of 30 px and 50 px, respectively.
Figure 1—figure supplement 3
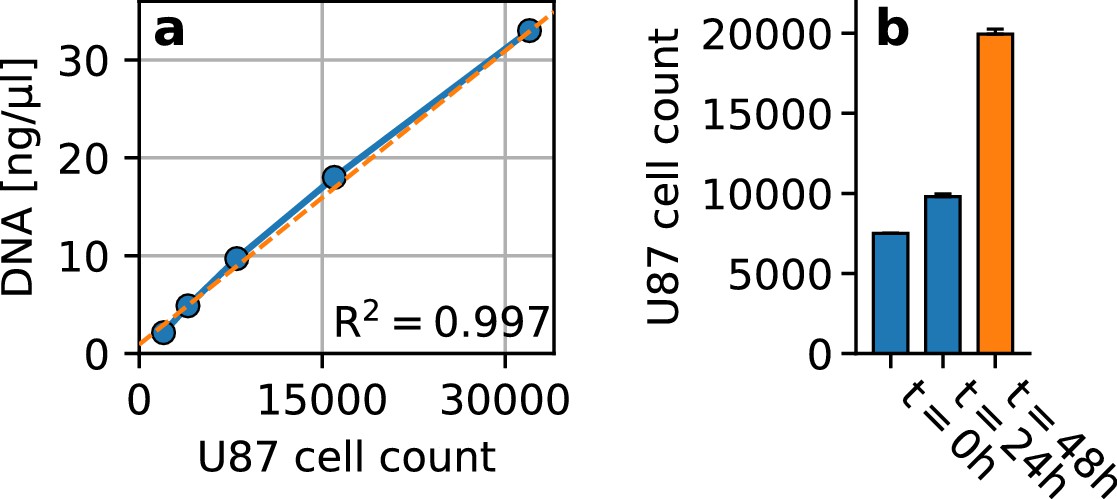
Cell proliferation in embedded spheroids.
(a) Standard curve for cell number quantification (blue), showing the amount of DNA extracted from different numbers (2000, 4000, 16000, 32000) of U87 glioblastoma cells (n = 3 repeats). We find a linear relationship () between the number of cells and the amount of DNA. The best fit linear function is displayed in orange. (b) U87 glioblastoma cell count at the start of the 24 h spheroid cultivation period within non-adhesive wells (; we use 7500 cells per spheroid), after 24 h of cultivation (; estimated from DNA quantification), and after another 24 h embedded in collagen (; estimated from DNA quantification). We find that during the 24 h cultivation period in non-adhesive wells, the cell count increases by 31%. Within the 24 h period in the collagen matrix, the cell count increases by another 104%. Error bars denote 1 se.
Figure 2
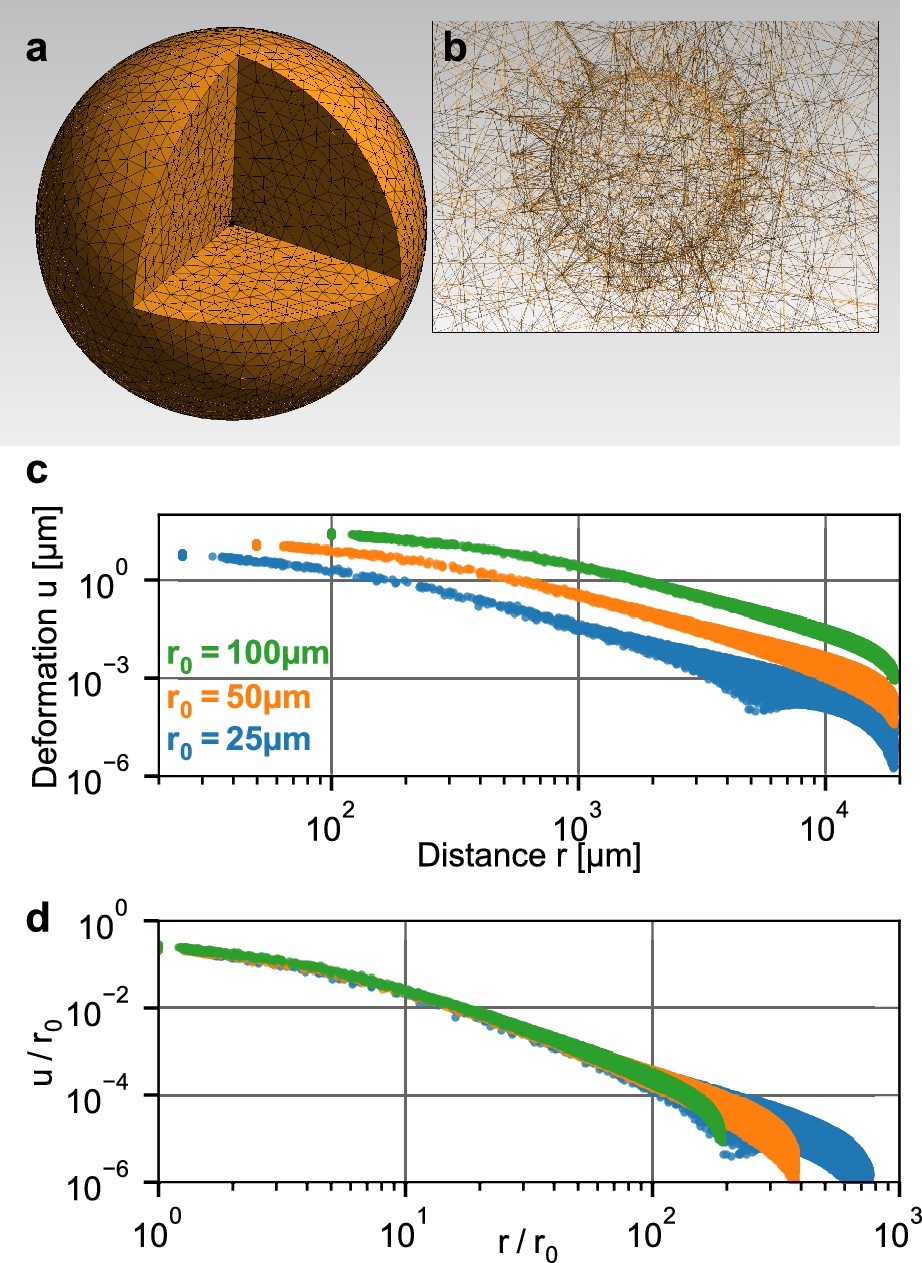
Simulation of a spherical inclusion in collagen.
(a) Illustration of the tetrahedral mesh used for the material simulation. The spherical volume has a radius of 2 cm, with a spherical inclusion in the center. (b) Enlarged section of the tetrahedral mesh around the spherical inclusion with a radius of = 100 µm. c: Simulated absolute deformations as a function of the distance from the center of the volume, for an inward-directed pressure of 100 Pa acting on the surface of the inclusion. Different colors indicate different radii of the spherical inclusion. d: Same as in (c), but with deformations and distances normalized by . For a given inbound pressure, all curves collapse onto a single relationship.
Figure 3 with 1 supplement
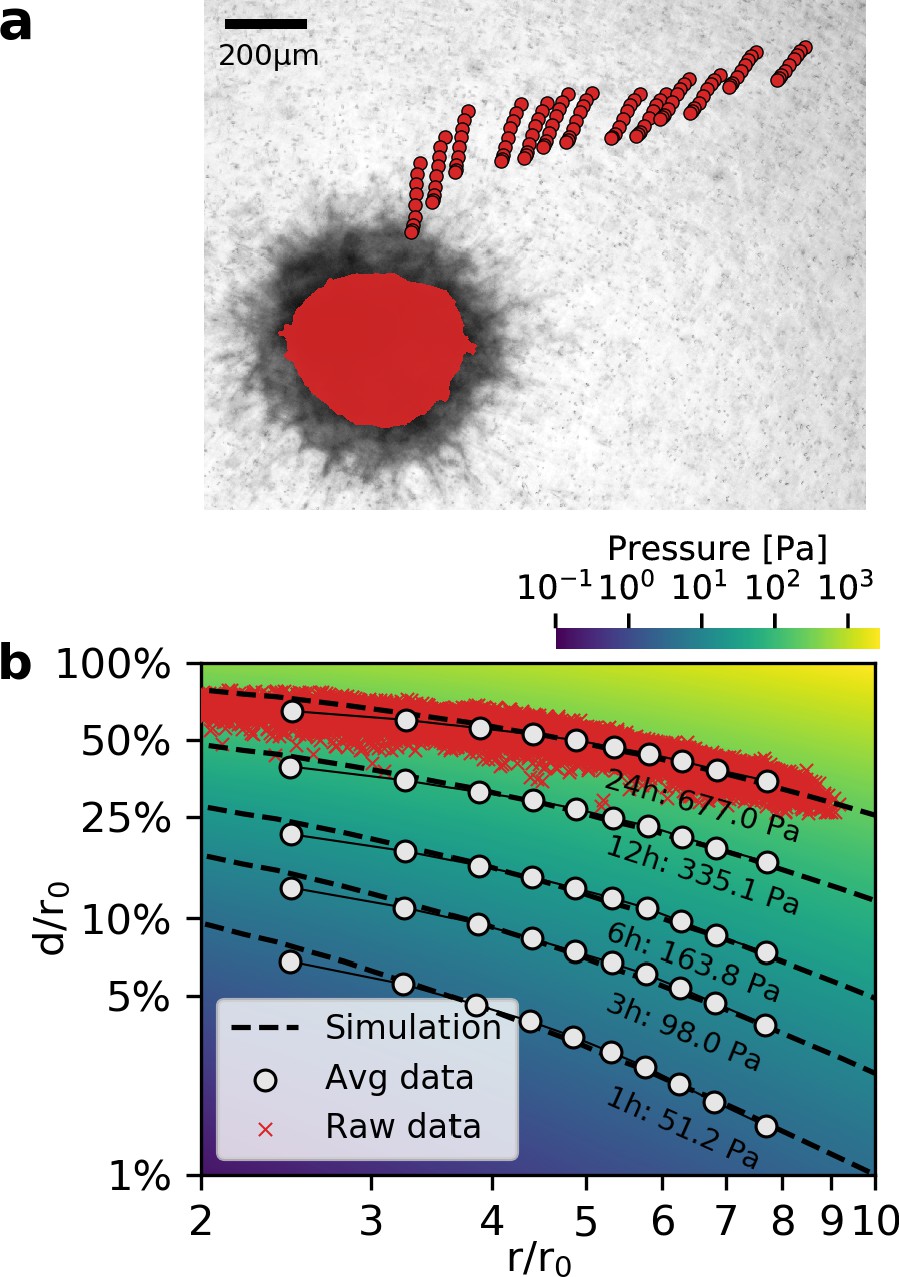
Deformation fields in non-linear biopolymer networks.
(a) Brightfield image of a tumor spheroid grown from 4000 primary, triple-negative breast cancer cells, 24 hr after embedding in a 3D collagen gel together with fiducial markers. The initial shape of the spheroid at the beginning of the experiment is indicated by the red shading. Red circles show the trajectory of exemplary fiducial markers over the course of 24 hr measurement time to illustrate the material strain arising within the matrix due to the contractile force of the spheroid. b: Normalized deformations as a function of the normalized distance for material simulations of varying pressure (color coding). Each red marker corresponds to the normalized deformation within an individual image tile analyzed with particle image velocimetry, after 24 hr measurement time. White circles indicate averaged normalized deformations for different time points during the measurement (times and inferred pressure values are noted below each curve). Dashed black lines indicate the corresponding best-fit simulated deformation field.
Figure 3—figure supplement 1
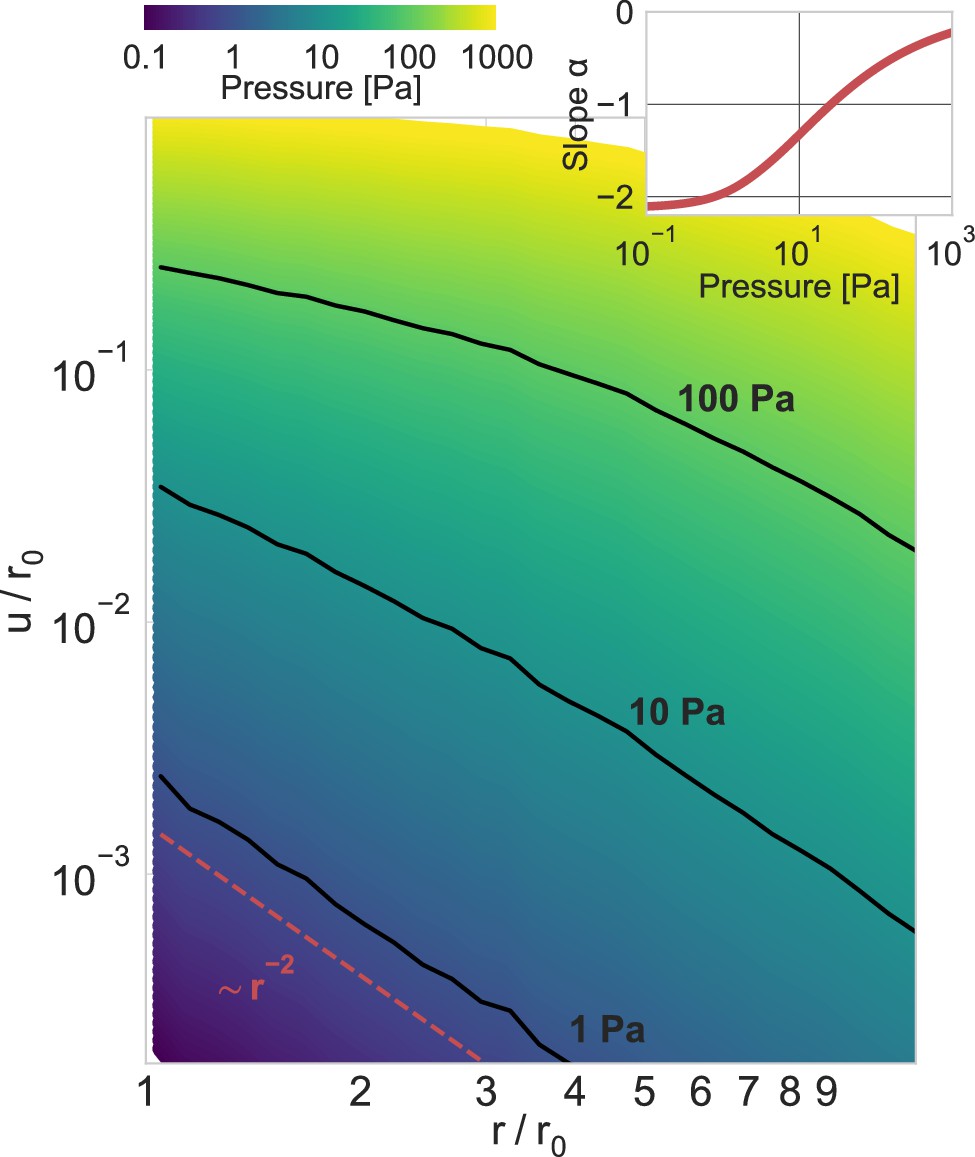
Power-law scaling of deformation fields.
Normalized absolute deformations as a function of the normalized distance, for material simulations with an inbound pressure on the surface of a spherical inclusion ranging from 0.1 Pa to 1000 Pa. The inset shows the power-law exponent of the deformation field as a function of the inbound pressure (for the near field, ), illustrating the long-range force transmission in collagen due to strain stiffening.
Figure 4 with 1 supplement
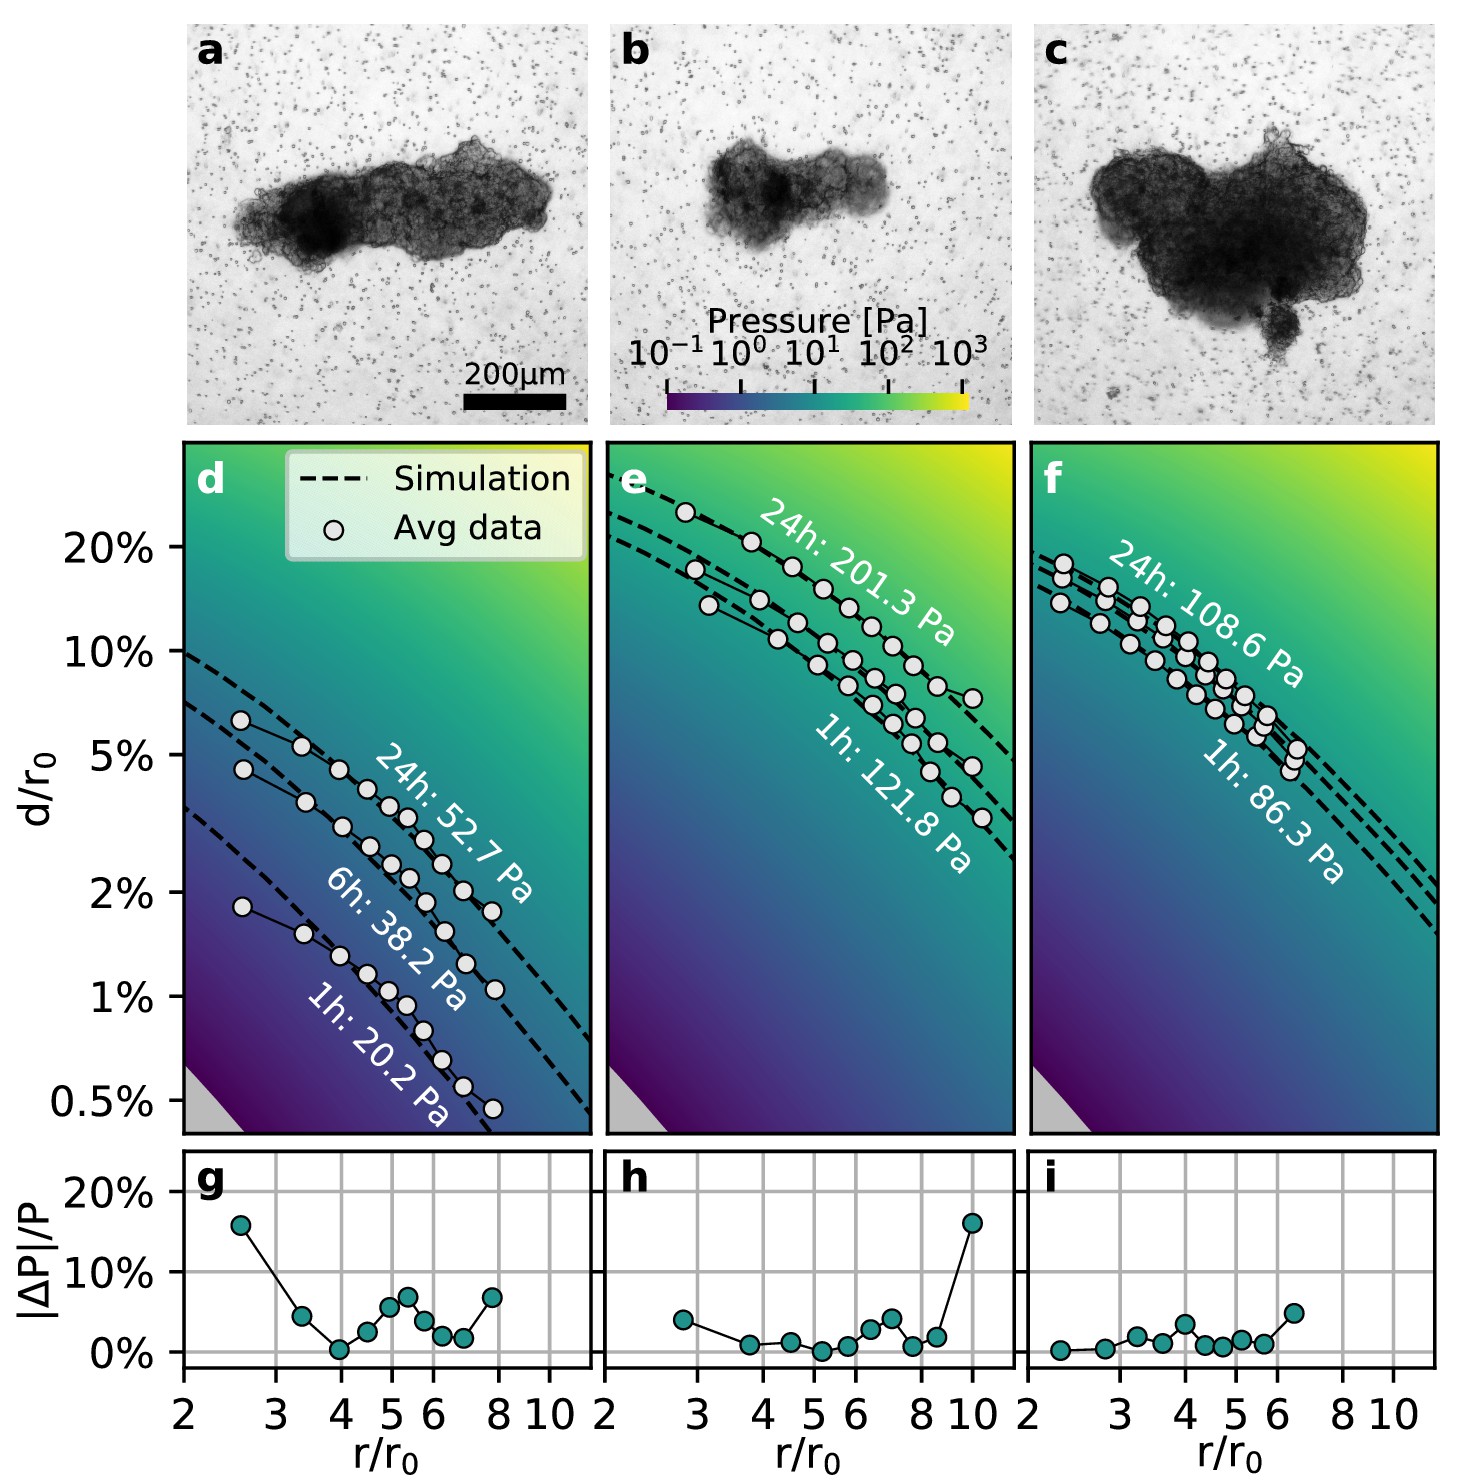
Collective contractility of Luminal B breast tumoroids.
(a-c) Brightfield images of three exemplary tumoroids embedded in a 3D collagen matrix, together with fiducial markers. (d-f) Normalized averaged measured matrix deformations (white circles) of the corresponding tumoroids (a–c) for three time points (1 h, 6 h, and 24 h) after the beginning of the experiment. The dashed lines indicate the corresponding best-fit deformation field from the material simulations. The color-coded background indicates simulated deformations for a range of pressures. g-i: Local relative deviation of the inferred pressure from the best-fit pressure value. Larger values indicate that the measured displacement field deviates stronger from the simulated displacement field.
Figure 4—figure supplement 1
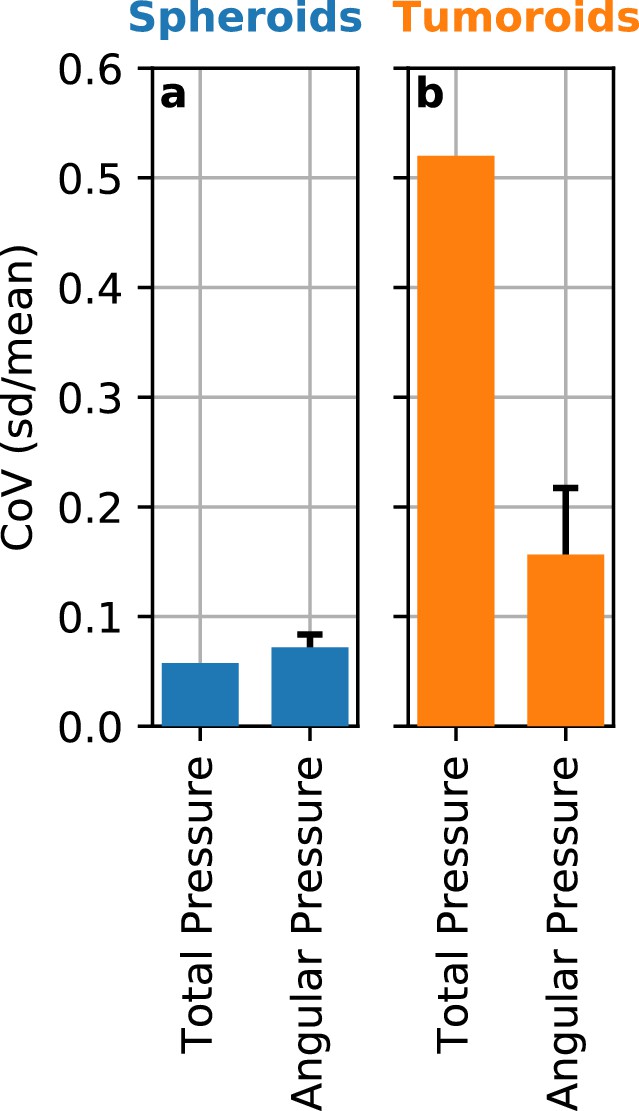
Angle-dependent variation of reconstructed pressure values.
While we assume spherical geometry of the deformations in the matrix surrounding a spheroid or tumoroid, the measured deformation fields can show deviations from spherical symmetry (see e.g. Figure 1d–g). We evaluate the variations in the reconstructed contractile pressure due to an asymmetric deformation field by subdividing the deformation field around spheroids and tumoroids into narrow 5° angular segments. We then compute the contractile pressure for each segment for a set of Luminal B breast cancer spheroids (n = 5) and Luminal B breast cancer tumoroids (n = 14) after 12 h measurement time. a: In the case of spheroids, the directional heterogeneity of the deformation field results in a directional variability (coefficient of variation, mean/st.dev.) for 5° angular segments of 7% on average. For comparison, the variability between individual spheroids is 6%. b: Despite the very large directional heterogeneity of the deformation field around the usually non-spherical tumoroids, we find that the resulting directional variability (coefficient of variation, mean/st.dev.) in contractile pressure is only 16% on average, compared to 52% variability between individual tumoroids. Thus, the pronounced asymmetry in the deformation field around some spheroids and most tumoroids does not lead to substantial errors.
Figure 5 with 2 supplements
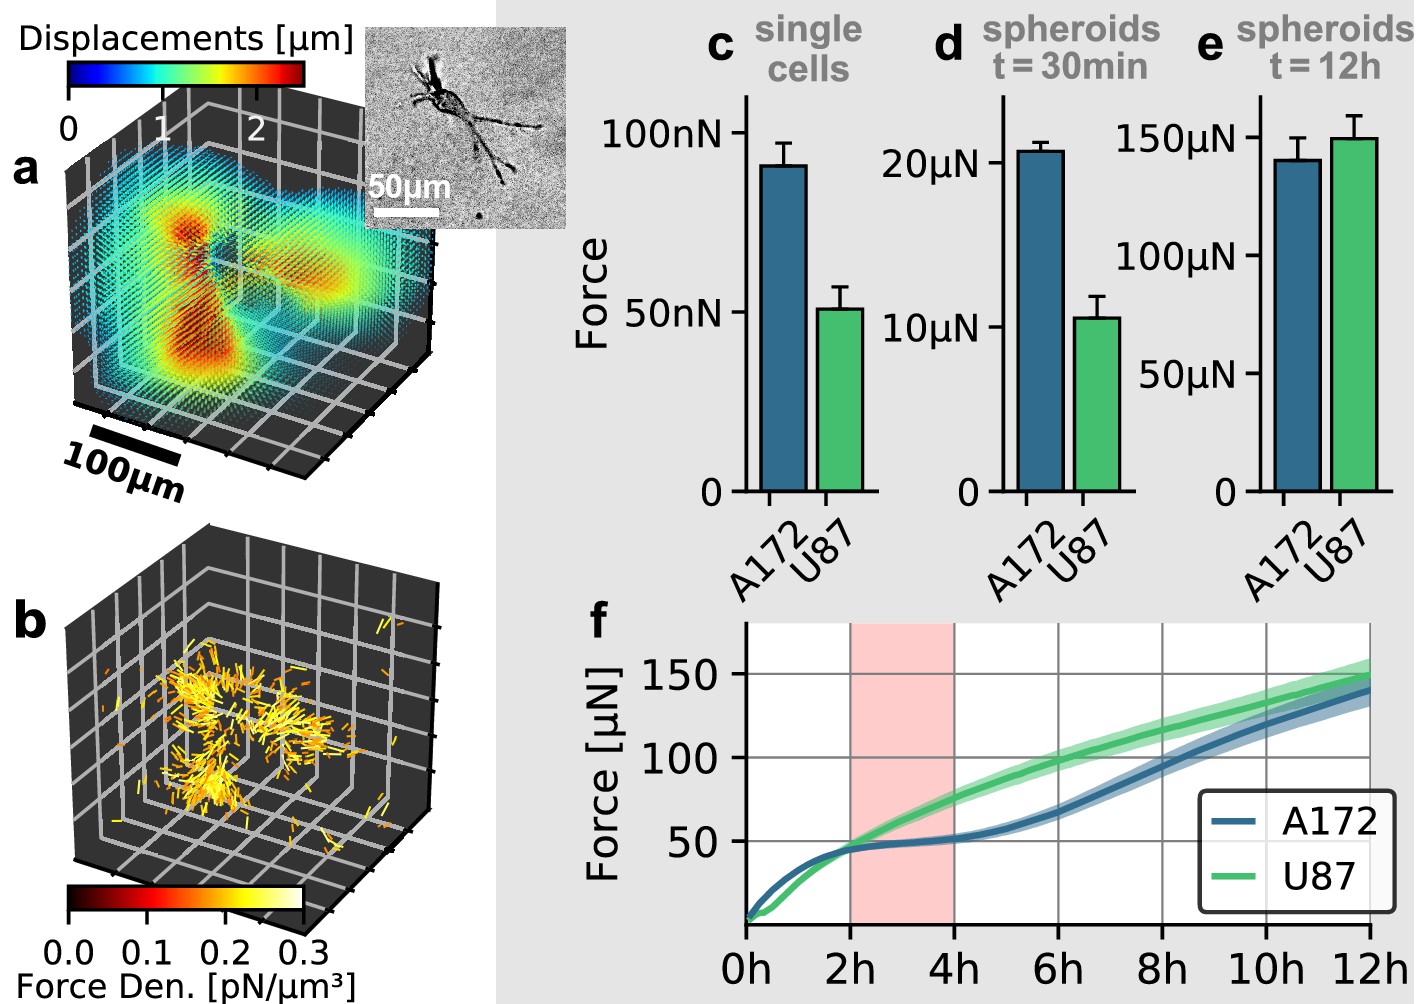
Individual and collective contractility of glioblastoma cells.
(a) Matrix deformations exerted by an exemplary A172 cell (inset) embedded in a 3D collagen gel. (b) Reconstructed force density field surrounding the A172 cell shown in (a). (c) Median cell contractility as measured by single-cell 3D traction force microscopy (A172: n = 90; U87: n = 86). (d) Mean collective cell contractility of tumor spheroids after 30 min measurement time (A172: n = 17; U87: n = 13). e: Mean collective cell contractility of tumor spheroids after 12 h measurement time (A172: n = 17; U87: n = 13). f: Time course of the mean contractility and corresponding standard error (shaded) for A172 (blue) and U87 (green) spheroids. The 2 h-resting period of the A172 spheroids is marked in red. Error bars denote 1 standard error.
Figure 5—figure supplement 1
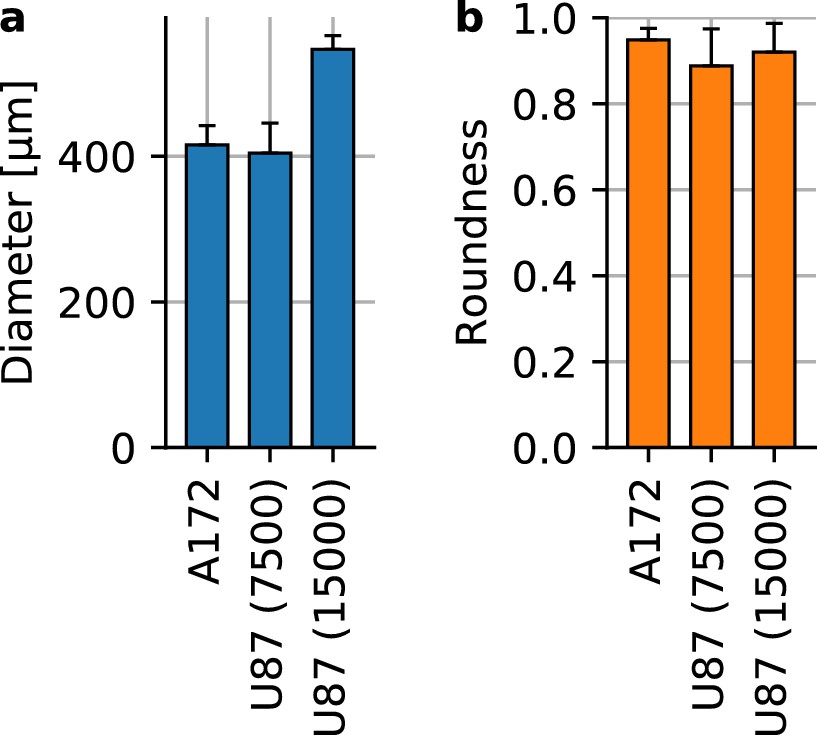
Glioblastoma spheroid shape and size.
(a) Spheroid diameter for A172 containing 15,000 cells at the time of seeding (n = 16) and U87 spheroids with 7,500 cells (n = 17) and with 15,000 cells (n = 15). (b) Spheroid roundness measured as . Error bars denote 1 st.dev.
Figure 5—figure supplement 2
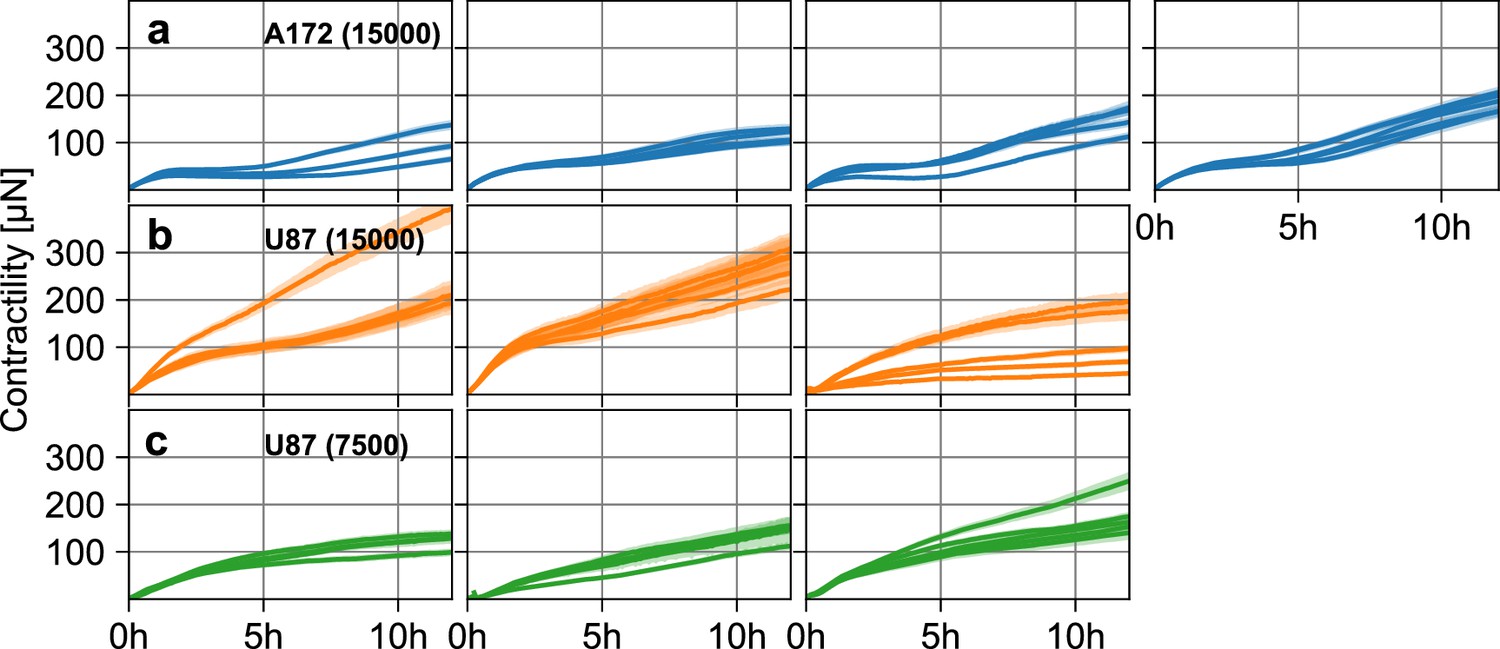
Glioblastoma spheroid contractility.
(a) Estimated pressure (blue lines) and corresponding standard error (blue shading) of individual A172 tumor spheroids containing 15,000 cells as a function of time, for four separate experiments (left to right). (b) Same as in (a), for three experiments with U87 tumor spheroids containing 15,000 cells. (c) Same as in (a), for three experiments with U87 tumor spheroids containing 7,500 cells.
Figure 6

Collective pulsing in Luminal B breast cancer spheroids.
(a) Median contractility (blue line) and the corresponding standard deviation (blue shading) of an exemplary spheroid grown from 4000 primary Luminal B breast cancer cells. The red box marks the contractility values displayed in the inset, illustrating a single twitch starting at 15:35 hr after the beginning of the measurement. (b) Changes in matrix deformations during the contraction phase of a single twitch that lasts for 15 min and is marked in green in (a). Inward-directed arrows indicate increasing contractility. The spheroid outline and its centroid are marked in red. (c) Changes in matrix deformations during the relaxation phase of a single twitch that lasts for 5 min and is marked in red in (a). Outward-directed arrows indicate decreasing contractility.
Videos
Video 1
Local matrix deformations around a Luminal B breast cancer spheroid.
Left: Series of confocal reflection microscopy images of collagen fibers at the equatorial plane around a Luminal B breast cancer spheroid embedded in 1.2 mg/ml collagen gel. Time is indicated on the top left and measures time after initiation of collagen polymerization (by increasing the pH of the collagen solution to 10). The video starts once collagen fibers are becoming visible in the reflection channel (∼30 min after initiation of polymerization). The default starting point of a traction force experiment is 60 min after polymerization started. Right: Measured deformation field surrounding the embedded spheroid as indicated by the color-coded arrows. The confocal reflection microscopy images are shown in gray-scale in the background. See Figure 1—figure supplement 1 for a quantitative evaluation of this image series.
Video 2
Time-lapse brightfield images of an A172 glioblastoma spheroid generated from 15,000 cells embedded in a collagen gel over the time course of 12 h.
Time is indicated in the upper-left corner (HH:MM:SS).
Video 3
Time-lapse brightfield images of an U87 glioblastoma spheroid generated from 7,500 cells embedded in a collagen gel over the time course of 12 h.
Time is indicated in the upper-left corner (HH:MM:SS).
Video 4
Time-lapse brightfield images of a spheroid generated from 4000 primary triple-negative breast cancer cells embedded in a collagen gel over the time course of 24 h.
Time is indicated in the upper-left corner (HH:MM:SS).
Video 5
Local matrix stiffness in the vicinity of a triple-negative breast cancer spheroid.
Left: Time-lapse brightfield images of a spheroid generated from 4000 primary triple-negative breast cancer cells embedded in a collagen gel over the time course of 24 h. Time is indicated in the upper-left corner (HH:MM:SS). Right: Local stiffness map of the collagen matrix surrounding the spheroid. Stiffness is displayed on a logarithmic scale and calculated in radial direction relative to the spheroid center. At zero strain, the 1.2 mg/ml collagen gel has a stiffness of 316 Pa. After 24 h measurement time, the maximum local stiffness is 7585 Pa.
Video 6
Time-lapse brightfield images of a Luminal B tumoroid embedded in a collagen gel over the time course of 24 h.
Time is indicated in the upper-left corner (HH:MM:SS).
Video 7
Local matrix stiffness in the vicinity of a triple-negative breast cancer spheroid.
Left: Time-lapse brightfield images of a Luminal B tumoroid embedded in a collagen gel over the time course of 24 h. Time is indicated in the upper-left corner (HH:MM:SS). Right: Local stiffness map of the collagen matrix surrounding the tumoroid. Stiffness is displayed on a linear scale and calculated in radial direction relative to the spheroid center. At zero strain, the 1.2 mg/ml collagen gel has a stiffness of 316 Pa. After 24 h measurement time, the maximum local stiffness is 516 Pa.
Video 8
Angular contractile pressure of a glioblastoma spheroid.
Left: Angular dependence of contractile pressure of the glioblastoma spheroid shown in Figure 1 d–g. Each point represents the reconstructed contractile pressure from a 5°-segment of the deformation field surrounding the spheroid. The coefficient of variation is defined as mean/st.dev. and denotes the variation of the reconstructed contractile pressure between different directions. Right: Time-lapse images of the equatorial plane of the spheroid. Matrix deformations are shown as arrows, the initial spheroid outline is indicated in red. Images are synchronized to the pressure values shown on the left.
Video 9
Angular contractile pressure of a Luminal B breast cancer spheroid.
Left: Angular dependence of contractile pressure of an exemplary Luminal B breast cancer spheroid. Each point represents the reconstructed contractile pressure from a 5°-segment of the deformation field surrounding the spheroid. The coefficient of variation is defined as mean/st.dev. and denotes the variation of the reconstructed contractile pressure between different directions. Right: Time-lapse images of the equatorial plane of the spheroid. Matrix deformations are shown as arrows, the initial spheroid outline is indicated in red. Images are synchronized to the pressure values shown on the left.
Video 10
Angular contractile pressure of a Luminal B tumoroid.
Left: Angular dependence of contractile pressure of an exemplary Luminal B tumoroid. Each point represents the reconstructed contractile pressure from a 5°-segment of the deformation field surrounding the tumoroid. The coefficient of variation is defined as mean/st.dev. and denotes the variation of the reconstructed contractile pressure between different directions. Right: Time-lapse images of the equatorial plane of the tumoroid. Matrix deformations are shown as arrows, the initial spheroid outline is indicated in red. Images are synchronized to the pressure values shown on the left.
Video 11
Angular dependence of contractile pressure of Luminal B breast cancer spheroids (top row) and tumoroids (bottom row) over the course of 22 h.
Each point represents the reconstructed contractile pressure from a 5°-segment of the deformation field surrounding the spheroid/tumoroid.
Video 12
Time-lapse brightfield images of a spheroid generated from 4000 primary Luminal B breast cancer cells embedded in a collagen gel over the time course of 24 h.
Time is indicated in the upper-left corner (HH:MM:SS).
Additional files
Download links
A two-part list of links to download the article, or parts of the article, in various formats.
Downloads (link to download the article as PDF)
Open citations (links to open the citations from this article in various online reference manager services)
Cite this article (links to download the citations from this article in formats compatible with various reference manager tools)
Collective forces of tumor spheroids in three-dimensional biopolymer networks
eLife 9:e51912.
https://doi.org/10.7554/eLife.51912


