Natural ITD statistics predict human auditory spatial perception
- Dominick P. Purpura Department of Neuroscience - Albert Einstein College of Medicine, United States
- Centro de Matemática, Computação e Cognição - Universidade Federal do ABC, Brazil
- Department of Mathematics - Seattle University, United States
Figures
Figure 1 with 1 supplement

ITD statistics of natural stimulus.
(A) Estimation of ITD mean and standard deviation over time in broadband signals filtered by human head-related impulse responses (HRIRs) and modeled cochlear filters. (1) Example HRIRs from sound emitted from speakers located at −15 degrees and recorded with microphones positioned in each ear (obtained from a publicly available LISTEN dataset). Traces show example impulse responses in the right (red) and left (blue). (2) A broadband signal was convolved with HRIRs from right (red) and left (blue) ears for each direction. (3) Convolved signals were then filtered using parameters analogous to human cochlear filters. Example of signal passed through a cochlear filter with a frequency band centered on 1000 Hz for the left (blue) and right (red) ears. (4) The instantaneous phase of the resulting signals on the left and right ears was computed. Top, instantaneous phase over time for the left (blue) and right (red) signals shown in 3. Bottom, instantaneous phase differences (IPD, in radians) and instantaneous time differences (ITD, in microseconds) between left and right signals. (5) Histogram of instantaneous IPD and ITD, illustrating their variability over time for the example signal shown in 3. (B) ITD mean (left) and standard deviation (right) over time, as a function of frequency and azimuth. Plots represent median values across subjects (N = 51), fit by spline curves, and color coded for each frequency. The derivative of the curves on the left was used to calculate ITD rate of change (ITDrc) across azimuth. The ITD variability (ITDv) was computed as the standard deviation of the ITD distribution over time. (C) Left, information of ITD cues as a function of frequency and azimuth, quantified by the median square root of ITD Fisher information (√FIITD) across subjects (azimuth was converted to ITD to obtain the estimate of the ITD statistics as a function of frequency and ITD, matching the stimulus metrics and model parameters used in our study). √FIITD statistic closely approximates ITDrc/ITDv. Right, the interquartile range of √FIITD across subjects shows low inter-individual variability. Black lines on each panel indicate the π-limit across frequency, beyond which ITD cues become ambiguous for narrowband sounds. (D) This study tests the hypothesis that over evolutionary and/or ontogenetic time scales the human brain became adapted to natural ITD statistics, such that stimuli that are more informative about sound source location would be distinctively encoded.
Figure 1—figure supplement 1
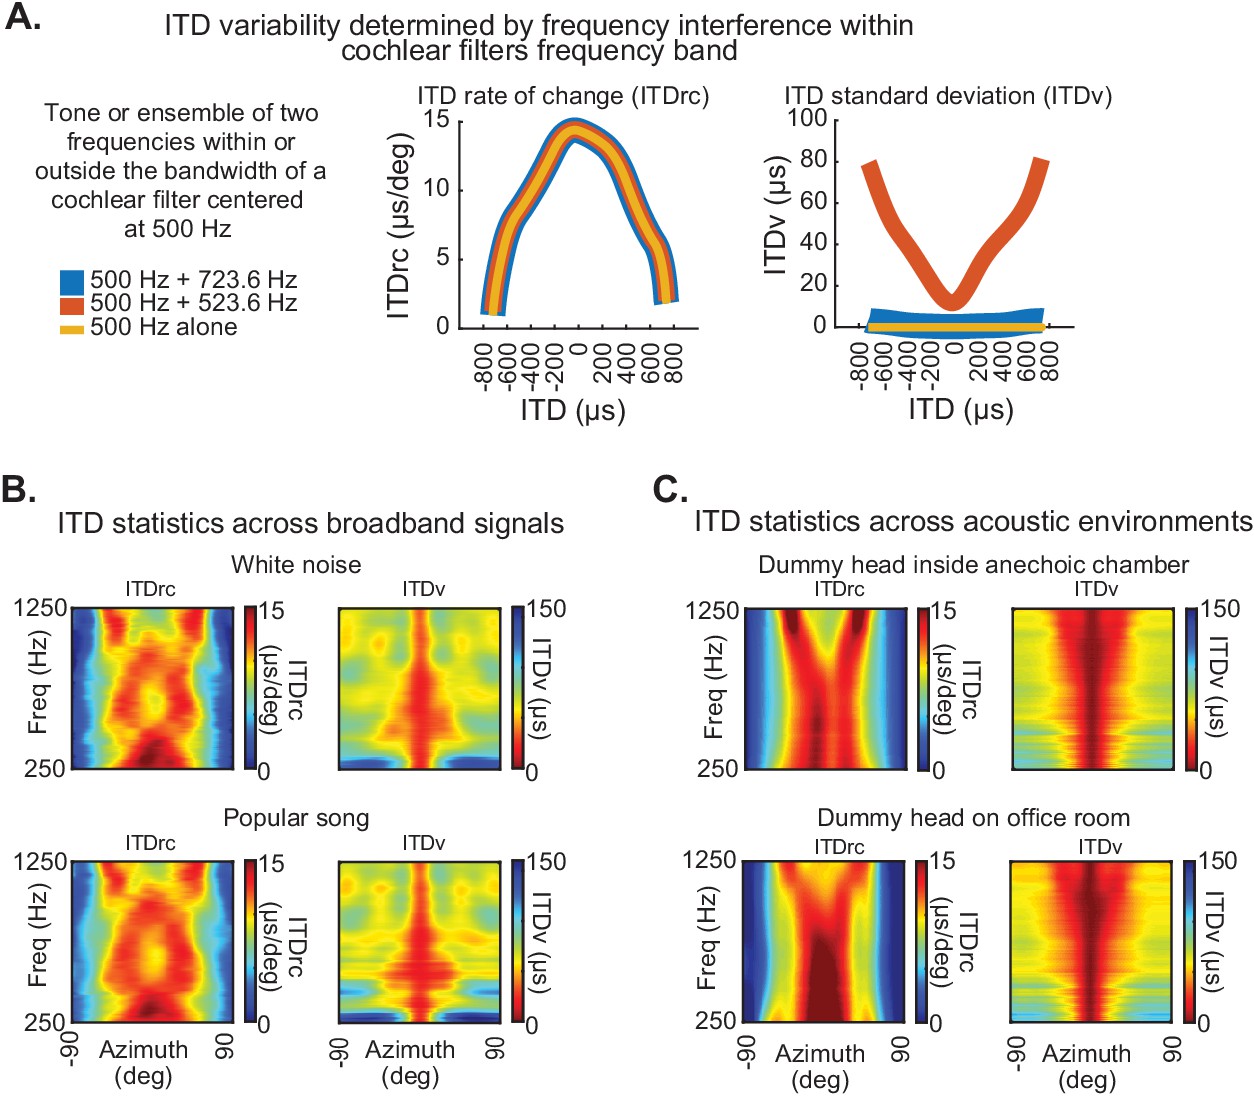
Basis of ITD statistics and consistency across conditions.
(A) ITDrc (left) and ITDv (right) as a function of ITDs corresponding to azimuth locations from −90° to 90°, averaged across subjects, for three example signals: a 500 Hz tone (yellow) and two signals combining 500 Hz and 523 Hz (red), and 500 Hz and 723 Hz (blue). 523 Hz and 723 Hz were chosen to demonstrate the effect of combining signals lying, respectively, within and outside the bandwidth of a cochlear filter with a center frequency of 500 Hz. The ITD statistics were estimated using the same method described in Figure 1, by convolving each of these signals with impulse responses from the left and right ears, then filtering using parameters analogous to human cochlear at 500 Hz center frequency. This procedure was applied across all other locations and subjects in the reported dataset. Note that ITDrc is similar for the three signals, indicating no significant effect of frequency interference on this statistic. However, while ITDv is near zero across azimuth locations for 500 Hz alone (yellow) and 500 + 723 Hz (blue), it increases from front to periphery when neighboring frequencies within a single cochlear filter are combined (500 + 523 Hz; red). Hence, unlike ITDrc, ITDv depends on interference between neighboring frequencies within cochlear filter ranges. (B) ITD statistics are consistent across broadband signals. ITDrc (left) and ITDv (right) computed using white noise (the broadband noise used to estimate ITD statistics in Figure 1) and a distinct broadband signal (first second of the chorus section of the popular song Alive, by Pearl Jam; bottom) displayed similar patterns. (C) ITD statistics are consistent across acoustic environments. ITDrc (left) and ITDv (right) computed from impulse responses recorded in human-head shaped manikins inside two different types of environment - anechoic chambers (top) and reverberant office spaces (bottom). We used the first 2.5 ms of impulse responses (corresponding mostly to the direct click reaching the ears, avoiding echo components in the reverberant office).
Figure 2
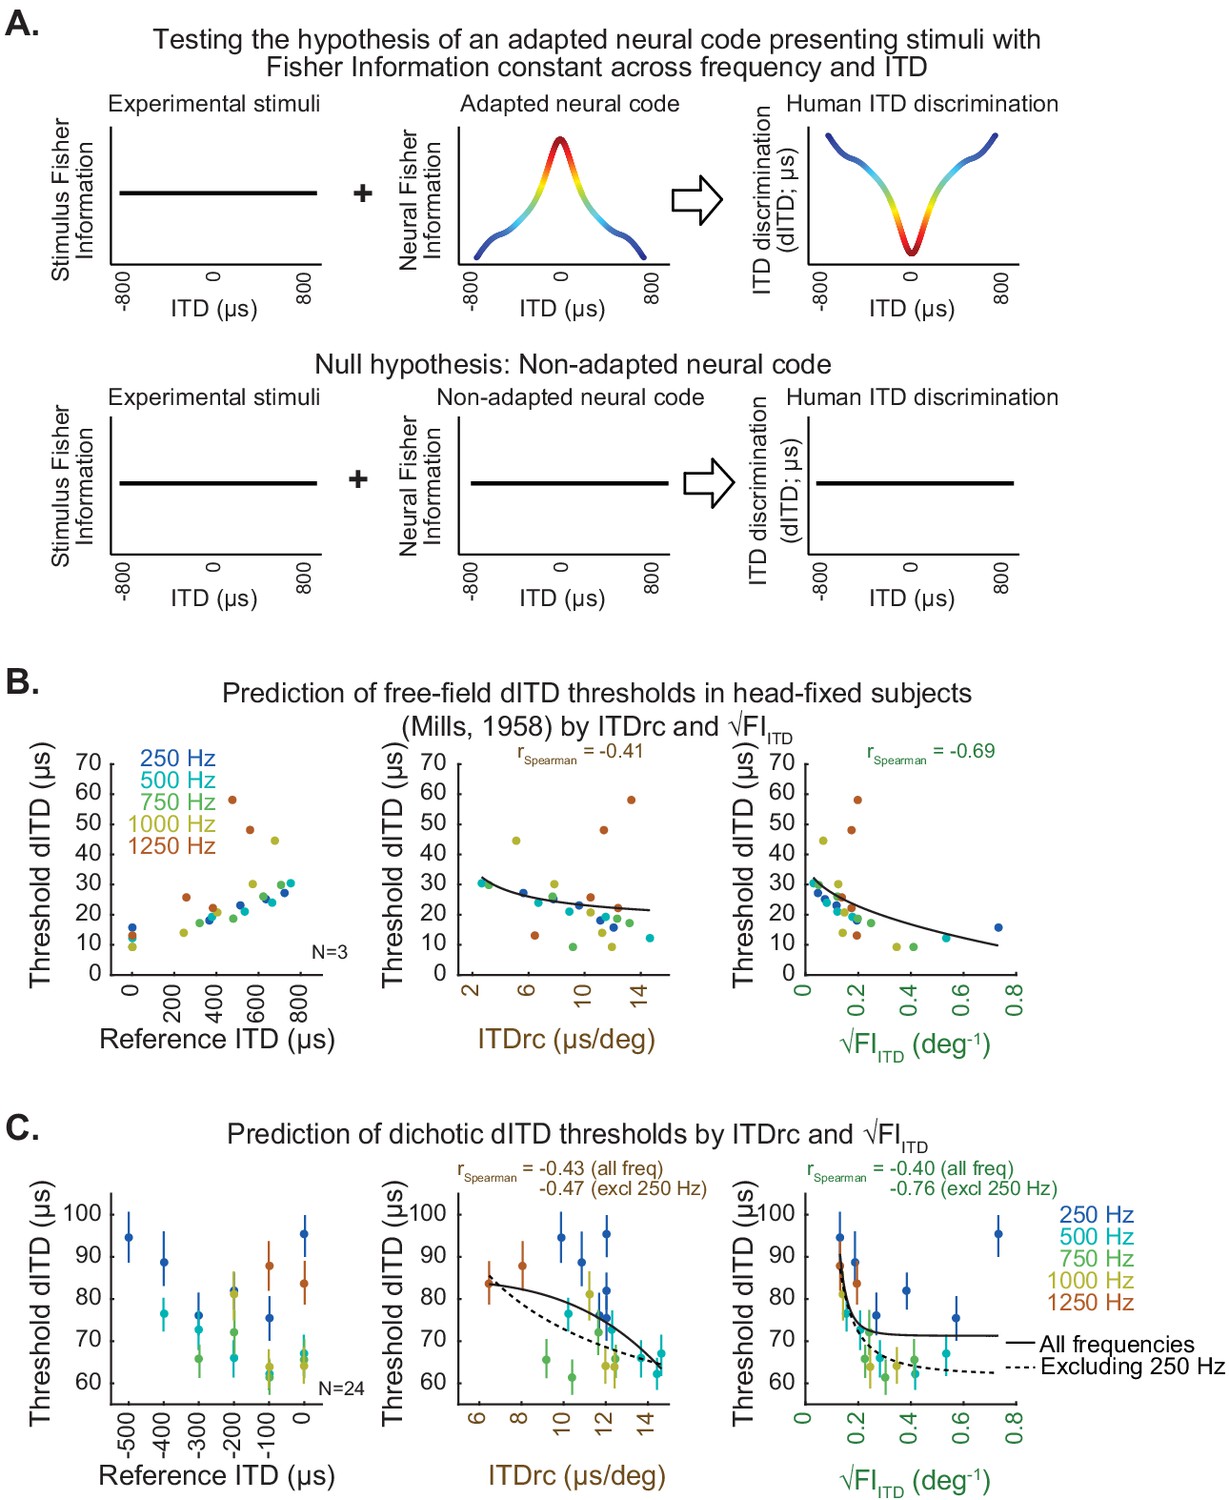
ITD statistics predict human ITD-change detection thresholds.
(A) Hypothesis (top) and null hypothesis (bottom) of an adapted neural code underlying human ITD discrimination. (B) Classic study by Mills, 1958 estimated the minimum azimuth change detection across frequency and locations for sounds in free-field averaged across subjects; these measures were converted to threshold dITD as a function of reference ITD (left). Scatter plots on the middle and right show free-field dITD thresholds as a function of ITDrc and √FIITD. (C) Test conducted in the present study to specifically assess dITD thresholds for tonal sounds delivered through headphones (dichotic stimulation). Left, mean dichotic dITD thresholds over subjects as a function of reference ITD across frequency. Middle, dichotic dITD thresholds as a function of ITDrc. Right, dichotic dITD thresholds as a function of √FIITD. Bars indicate 50% confidence intervals of mean dITD thresholds. Black lines represent power functions fit to all the analyzed frequencies (solid) and excluding 250 Hz frequency from the analysis (dotted).
Figure 3
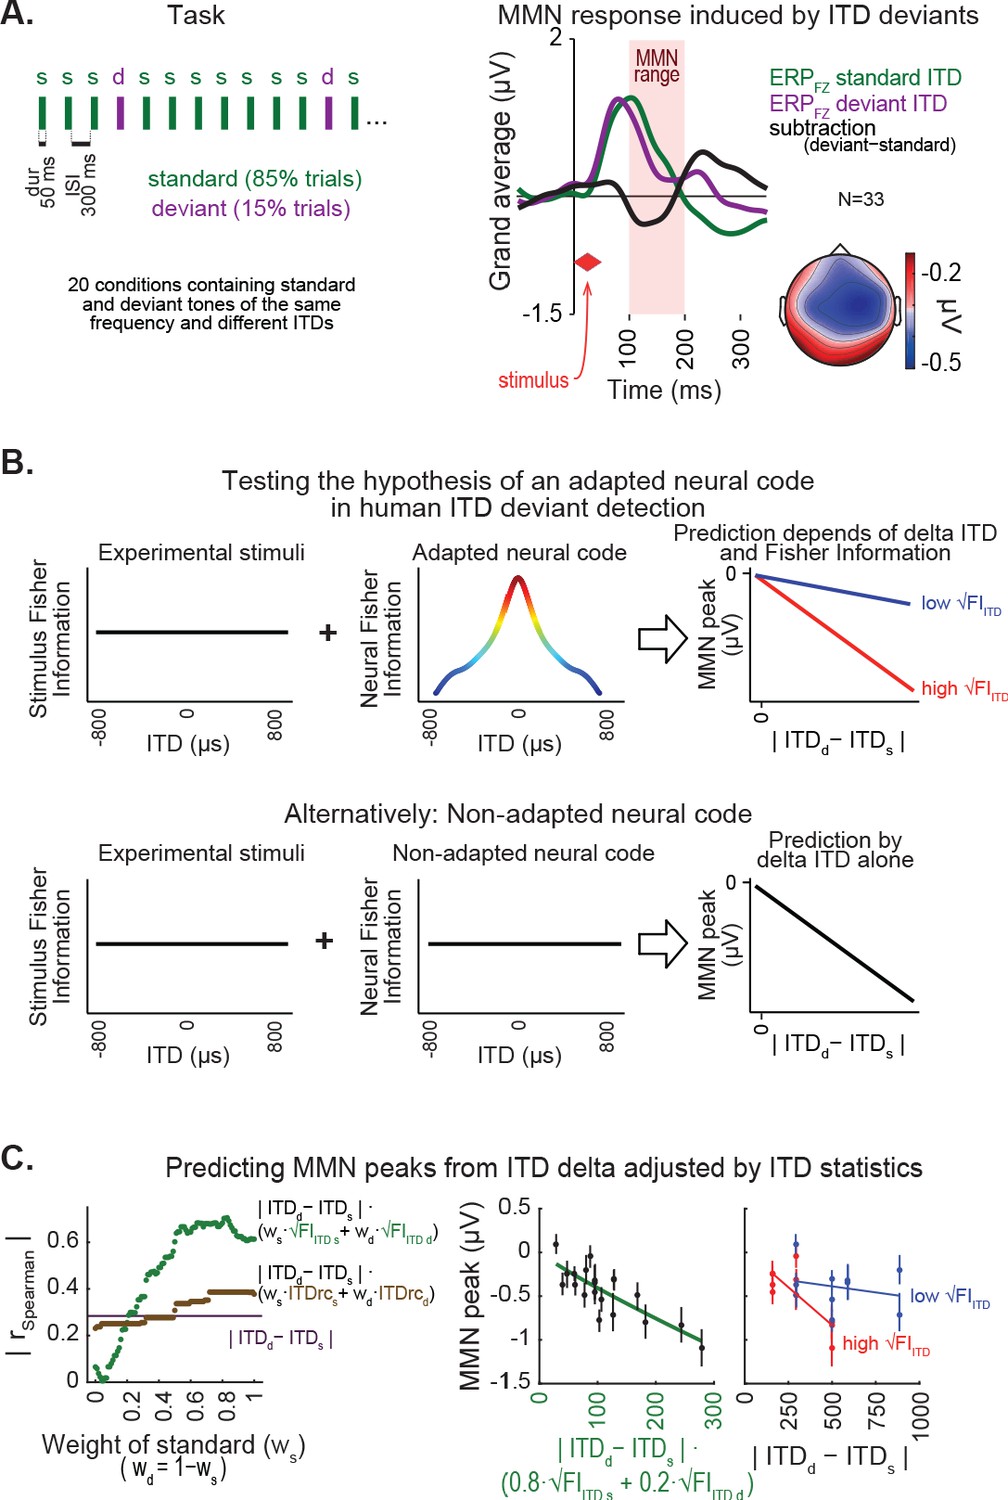
ITD statistics predict discriminability of spatial deviants indexed by MMN responses.
(A) Left, passive oddball sequence protocol, in which subjects listened to frequent ‘standard’ stimuli embedded with rare spatial ‘deviants’. In each condition, two tones were presented with the same frequency and distinct ITDs. Right, MMN response within the 100–200 ms latency range of the deviant-minus-standard trace (black line) is shown for the midline frontal electrode (FZ) along with standard (green) and deviant (purple) event related potential traces, averaged across conditions and subjects. Inset on the bottom-right shows the topography of the MMN response. (B) Hypothesis (top) and null hypothesis (bottom) of an adapted neural code underlying MMN responses to spatial deviants tested in this study. Under a neural code relying on natural ITD statistics, the correlation between amplitude of MMN responses and difference between deviant and standard ITD is expected to show a synergistic effect of ITD statistics. (C) Left, coefficients of correlations between MMN amplitude and different predictor equations adjusting ITD difference between standard and deviant by ITD statistics, as a function of the relative weight of the standard stimulus (ws), relative to the weight of the deviant (wd). Middle, best prediction of MMN amplitude in the model relying on √FIITD, weighting standard more than deviant (80%:20%). Right panel, changes in MMN peak amplitude as a function of the difference between ITD of deviant and standard show stronger negative linear slopes for conditions where the weighted average of √FIITD was higher, compared to conditions with lower √FIITD.
Figure 4
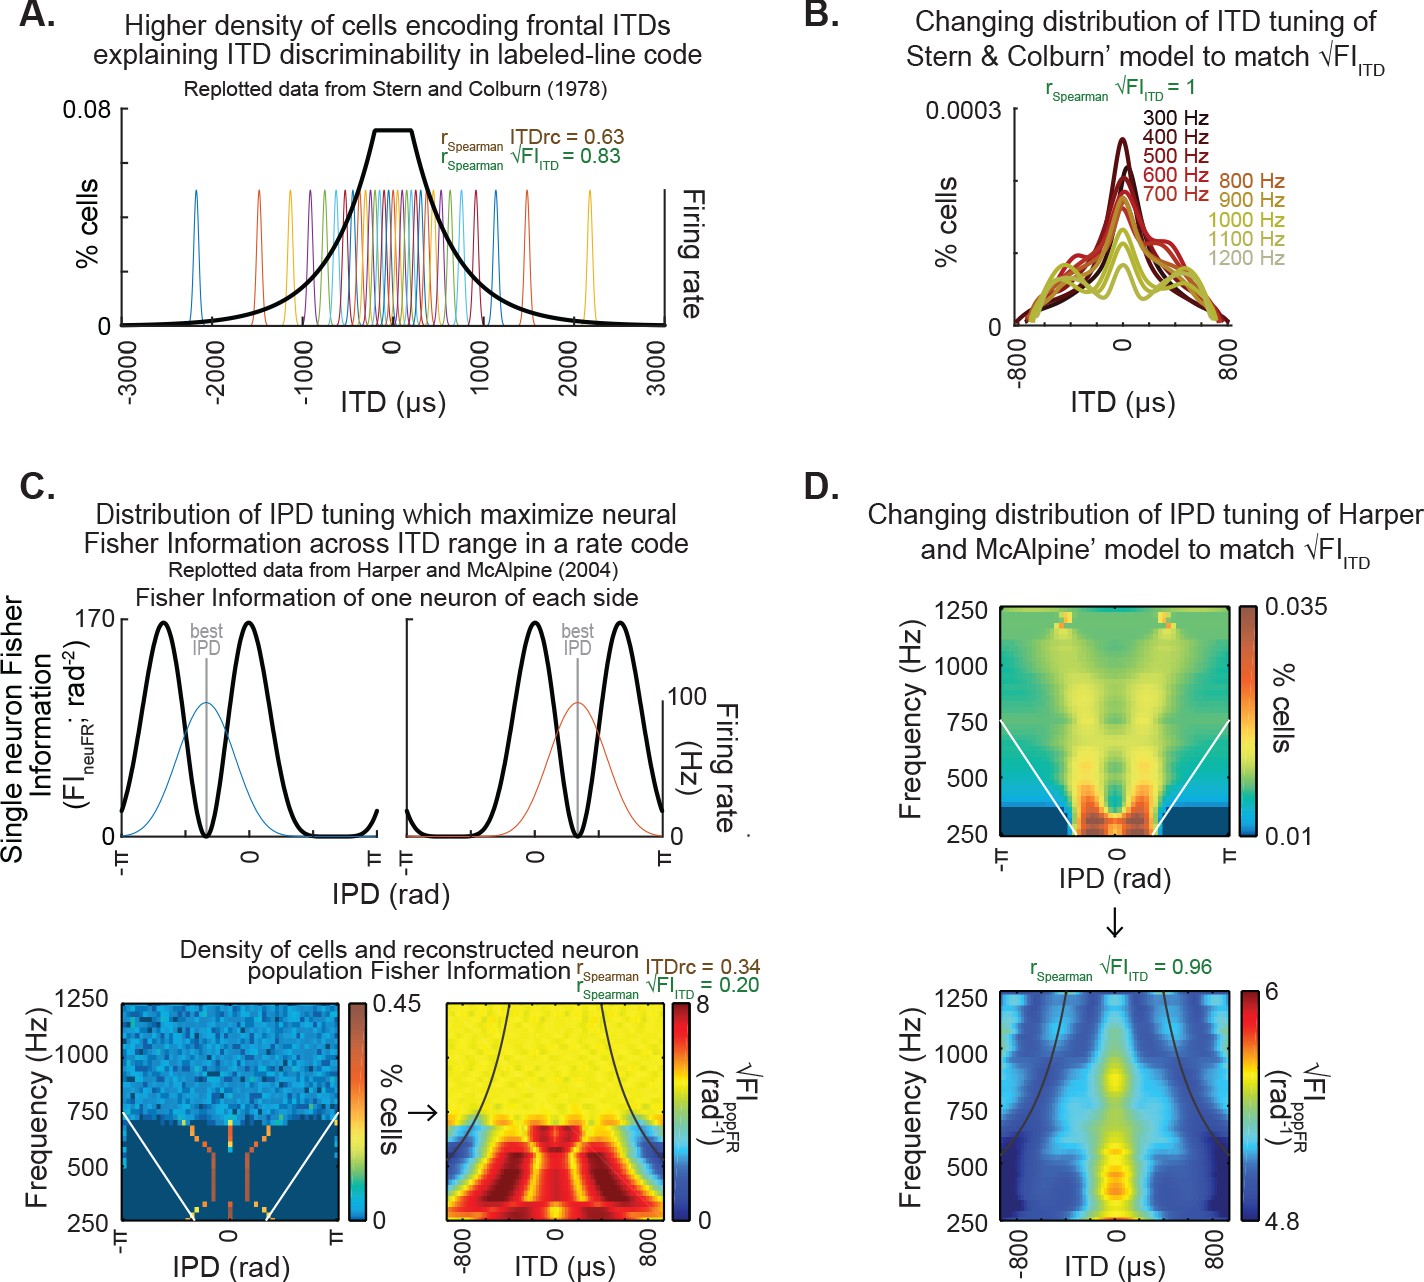
Classic models of neural properties underlying ITD discriminability and their potential for explaining encoding of ITD statistics.
(A) Distribution of internal delays replotted from Stern and Colburn, 1978, Figure 2b, which proposes a higher density of pairs of fibers encoding frontal ITDs. (B) The density of pairs of fibers proposed by Stern and Colburn, 1978 as the mechanism underlying ITD discriminability could effectively achieve the representation of ITD statistics: the density was adjusted to match the pattern of √FIITD. Note that the adjusted distribution largely preserves the shape of the distribution of the original model. (C) Distribution of IPD-tuning maximizing coding across the physiological range of ITD, as proposed by Harper and McAlpine, 2004. Top, single-neuron Fisher information as a function of IPD. Bottom-left, distribution of best IPDs brain across frequency expected for humans under the framework proposed by the authors; white straight lines indicate physiological range determined by the distance between ears. Bottom-right, reconstructed neuron population Fisher information, converted from IPD to ITD for each frequency for obtaining the predicted ITD discriminability; black curved lines indicate the π-limit, beyond which ITD cues become ambiguous within narrow frequency bands. Spearman correlation coefficients for the relationship between population Fisher information and ITDrc and √FIITD outlined above. (D) The IPD-tuning distribution proposed by Harper and McAlpine, 2004 as a mechanism underlying ITD discriminability was adjusted for matching the neuron population Fisher information to ITDfi. Top, the neuron distributions matching ITD statistics depict best IPDs away from midline across frequency, consistent with a coding strategy based on two clustered subpopulations tuned to IPDs away from the front (McAlpine et al., 2001; Harper and McAlpine, 2004; Hancock and Delgutte, 2004; Pecka et al., 2008). Bottom, the neuron population Fisher information highly correlated with the ITD statistics.
Additional files
Download links
A two-part list of links to download the article, or parts of the article, in various formats.
Downloads (link to download the article as PDF)
Open citations (links to open the citations from this article in various online reference manager services)
Cite this article (links to download the citations from this article in formats compatible with various reference manager tools)
Natural ITD statistics predict human auditory spatial perception
eLife 9:e51927.
https://doi.org/10.7554/eLife.51927


