Movement-related coupling of human subthalamic nucleus spikes to cortical gamma
- Medical Research Council Brain Network Dynamics Unit, University of Oxford, United Kingdom
- Nuffield Department of Clinical Neurosciences, John Radcliffe Hospital, University of Oxford, United Kingdom
- Neurological Surgery, University of Pittsburgh School of Medicine, United States
- Department of Neurology, Campus Mitte, Charite - Universitaetsmedizin Berlin, Germany
- Department of Neurobiology, University of Pittsburgh, United States
- Center for the Neural Basis of Cognition, University of Pittsburgh, United States
- Ernst Strüngmann Institute (ESI) for Neuroscience in Cooperation with Max Planck Society, Germany
- Donders Institute for Brain, Cognition and Behaviour, Netherlands
- Department of Neurosurgery, Massachusetts General Hospital, United States
- Harvard Medical School, United States
Figures
Figure 1
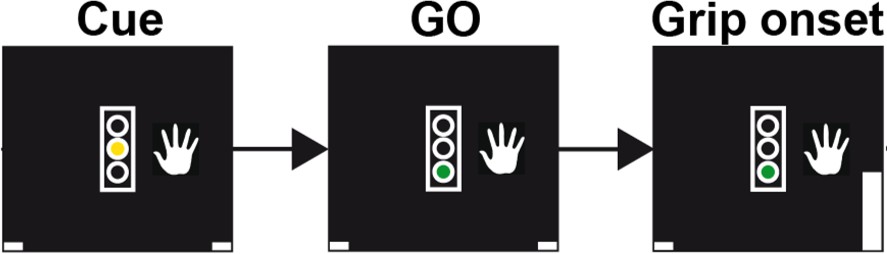
Schematic of the trial events for a grip trial with the right hand.
In trials requesting gripping with the left hand, the image of the hand would be displayed to the left of the traffic light. The initial cue was displayed as yellow traffic light, which served as GO cue when it turned green, on average 1.5 ± 0.4 s after its onset. The gripping movement had to occur within two seconds of the GO cue onset to count as valid trial. Upon gripping, a white bar representing the grip force would move up (see bottom right corner in the rightmost plot). Visual feedback was presented according to whether the movement was performed at least for 100 ms and within the correct window. Trial onsets were on average separated by 4.7s ± 1.2s.
Figure 2 with 1 supplement

Cortical topography of STN spike-to-cortical gamma coupling and power changes.
(A) ECoG strips were distributed mainly over precentral and parietal areas. ECoG coordinates from recordings performed in the left hemisphere were flipped in the x-axis to allow averaging across recordings performed in the left and right hemisphere. The maximum number of overlapping recordings was 18 (dark areas). (B) A magnetoencephalography study in healthy participants showed independently from our study that gamma oscillations at the onset of finger movements are focal to lateral motor cortex (Cheyne et al., 2008). (C) Gamma power increased most strongly over motor and somatosensory cortical areas during contralateral gripping. (D) Beta power decreased in spatially more widespread areas. (E) The left and right plots show the two sets of sites that showed the highest 60–80 Hz STN spike-to-cortical gamma coupling during contralateral and ipsilateral gripping, respectively. Each set includes one single site per recorded hemisphere (n = 28). These sites were chosen for further analyses. (F) As (E) but reduced to the sites showing significant gamma coupling −0.1–0.4 s around movement onset (α = 0.1 to show the location of a larger number of contacts). If several channels of one recording were significant, only the channel with the highest PLV was included. The contacts that showed significant gamma PLV during contralateral gripping were concentrated over precentral cortex. This hotspot corresponds well with the 60–90 Hz gamma source localized in MEG studies (Cheyne et al., 2008) shown in B). The significant contacts for ipsilateral gripping were scattered over a wider area. See also Figure 2—figure supplement 1.
© 2008 Elsevier. Figure 2B is reprinted with permission from Cheyne et al. (2008) . It is not covered by the CC-BY 4.0 licence and further reproduction of this panel would need permission from the copyright holder.
Figure 2—figure supplement 1
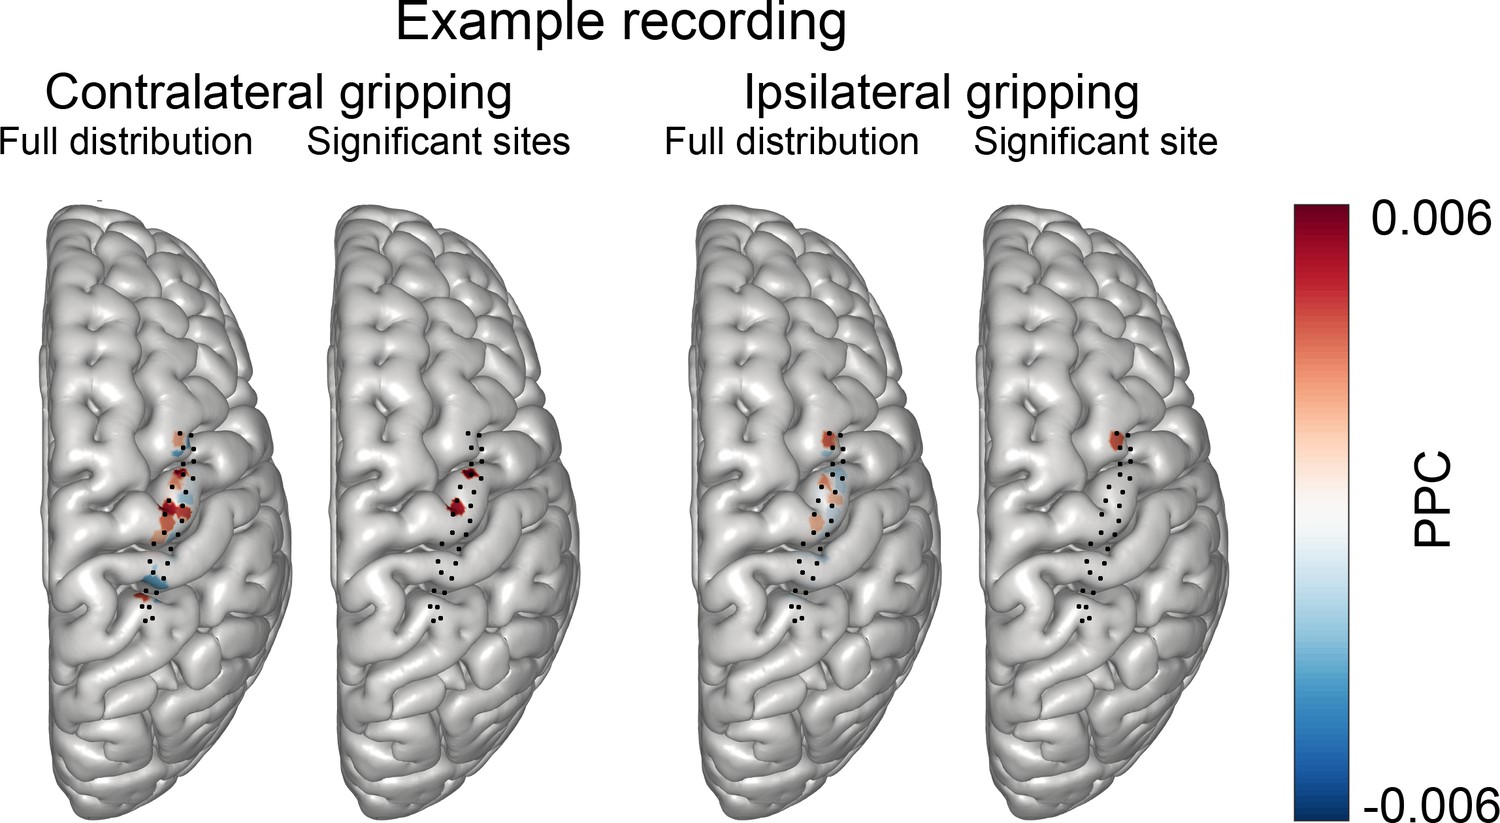
Distribution of coupling strength across all ECoG sites in one example subject recorded with a grid that had 28 contacts.
The black dots show the positions of all ECoG electrodes (axially projected). The red blobs are centred around the mean of the position of the two contacts used to compute the bipolar ECoG signal, colouring the cortical mesh within a 3 mm radius from this midpoint. Red indicates high coupling, blue (values below zero) indicates no coupling. During contralateral gripping (1st plot) coupling was highest over precentral gyrus, particularly around the region that is known to show high gamma synchrony during hand movements. Two sites showed significant coupling (2nd plot) during contralateral gripping. During ipsilateral gripping, coupling was weaker (3rd plot) and the only significant site was located over the middle frontal gyrus. PPC = pairwise phase consistency.
Figure 3 with 5 supplements
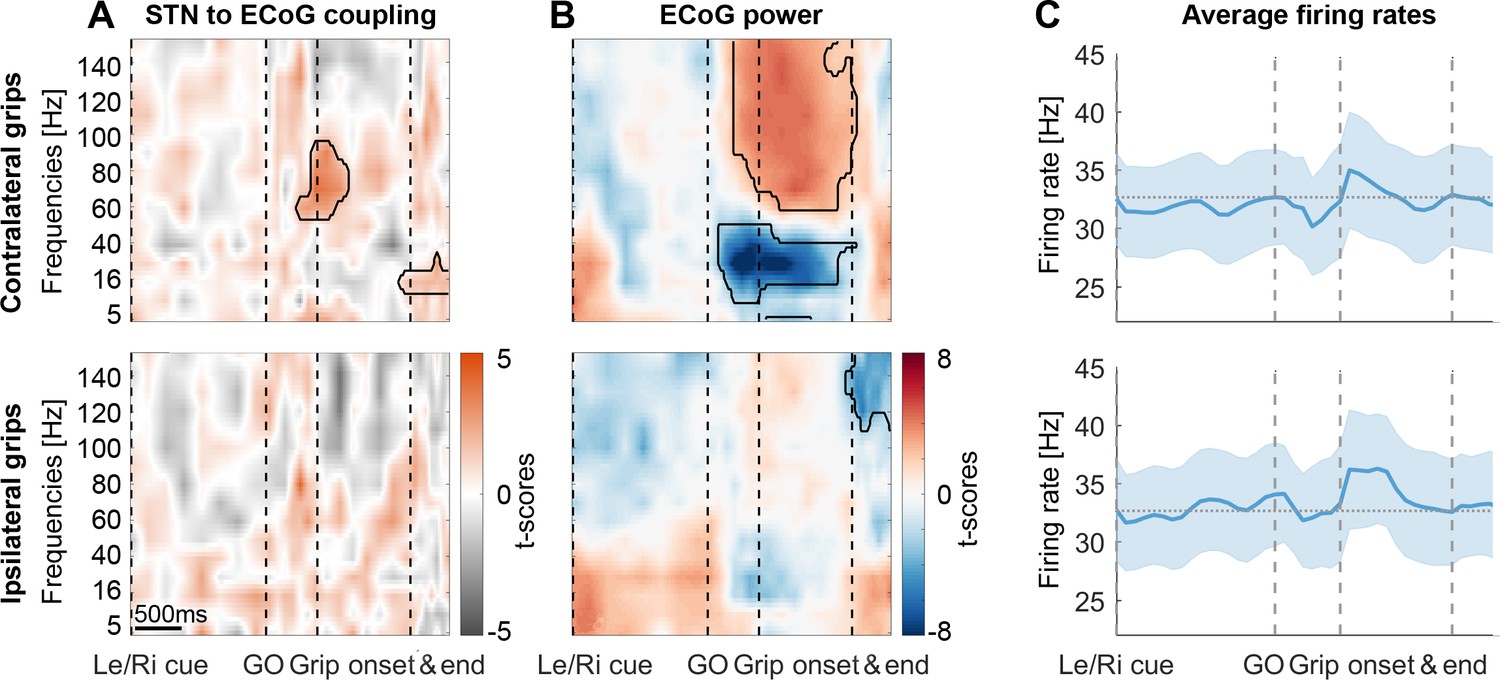
STN spike-to-ECoG phase coupling and ECoG power during visually cued gripping.
The top and bottom row show contra- and ipsilateral grip trials, respectively. To get comparable estimates of the coupling strength around each of the key trial events, we implemented an event-locked variable-window width PLV estimation procedure: Each interval between neighbouring task events was subdivided into equidistant points, which served as centre for a window within which the PLV was computed. The windows varied in width to encompass the same number of spikes for all time points for one recording. (A) The black outlines show significant clusters obtained with a cluster-based permutation procedure for multiple comparison correction (n = 28, p<0.05). Significant 60–80 Hz spike-to-cortical gamma phase coupling occurred at contralateral grip onset. The same cells also locked to beta after movement offset when cortical beta power rebounded. During ipsilateral gripping (bottom row), no significant clusters were found. (B) During contralateral gripping, cortical gamma power increased while beta power was significantly suppressed relative to the median power obtained from the whole recording. Ipsilateral gripping resulted in relatively reduced >120 Hz power after the grip was released. (C) Average firing rates across the 28 recordings showed no significant modulation to any of the task events. Error bars display standard errors. See also Figure 3—figure supplements 1–5.
-
Figure 3—source data 1
Source data for Figure 3 showing contralateral grip trials.
- https://cdn.elifesciences.org/articles/51956/elife-51956-fig3-data1-v2.mat
-
Figure 3—source data 2
Source data for Figure 3 showing ipsilateral grip trials.
- https://cdn.elifesciences.org/articles/51956/elife-51956-fig3-data2-v2.mat
Figure 3—figure supplement 1
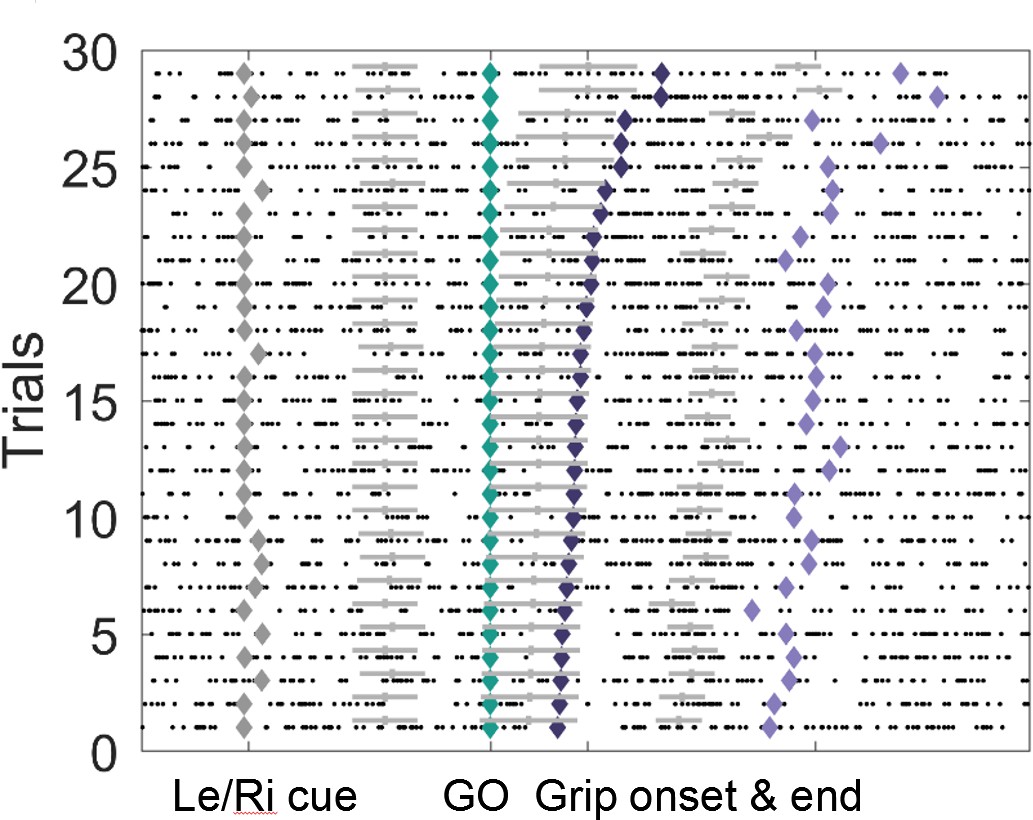
Example of the event-locked variable-window width sliding procedure.
Intervals between neighbouring events (♦) were subdivided into eight equidistant points for each trial, which served as centres for overlapping bins within which PLVs were calculated. Window widths were set depending on the total number of spikes surrounding each bin centre across all trials. The grey horizontal bars denote the window widths, which were the same for all trials of one individual bin centre. Windows between the Go signal and Grip onset were relatively wide because the average spike number around this point was relatively low. Conversely, windows between Grip onset and end were relatively narrow as spikes were more frequent. For any recording, a minimum number of 50 spikes (across all trials for one bin) was included, or more, if the average number of spikes within an average 0.3 s window was higher.
Figure 3—figure supplement 2
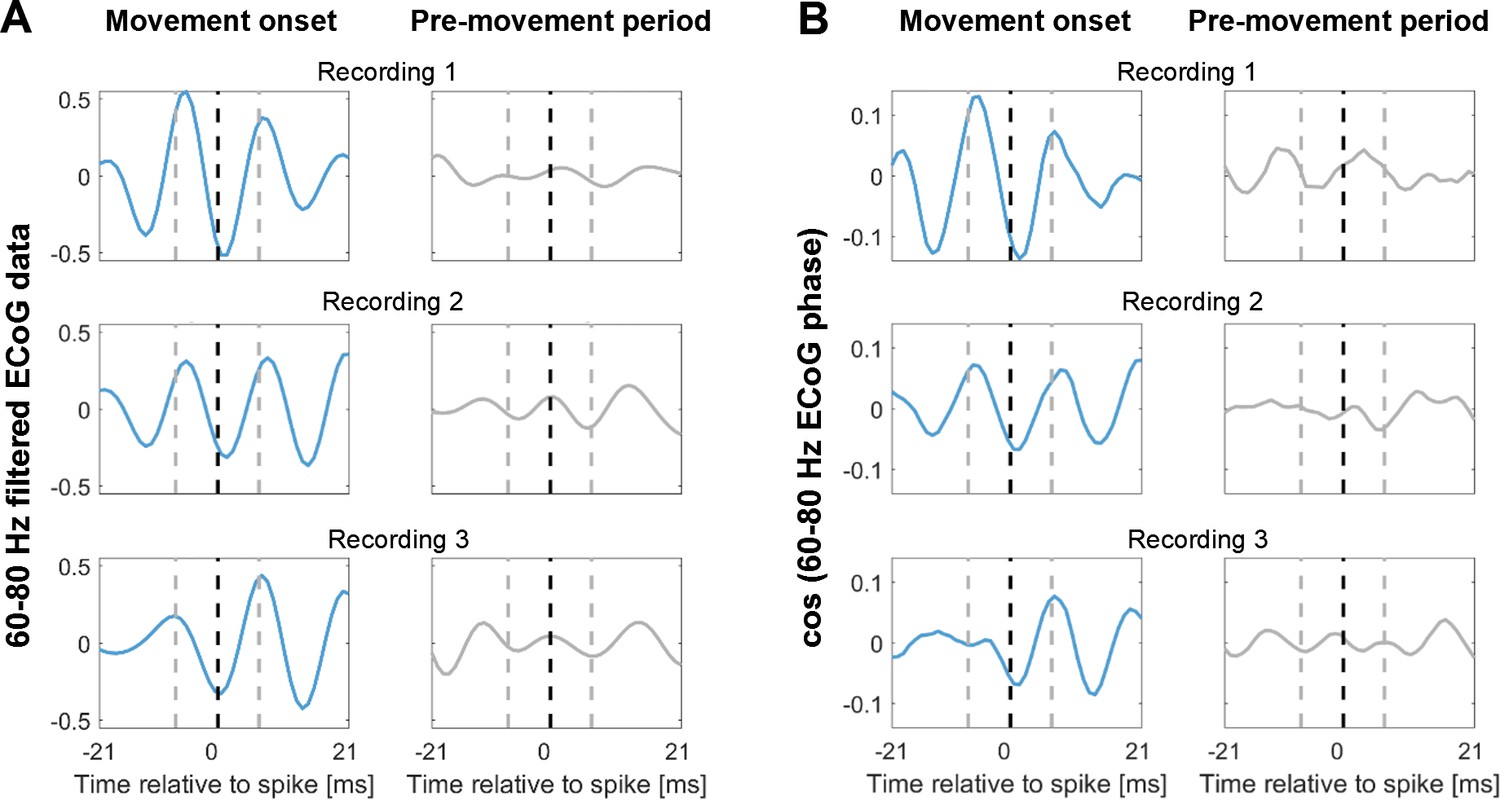
Spike-triggered average (STA) of the 60–80 Hz filtered ECoG signal during contralateral gripping of three example recordings.
The ECoG signal was taken from the sites with highest 60–80 Hz coupling during gripping. The blue lines show the STA based on spikes within −0.1–0.4 s around movement onset. The grey lines show the STA based on spikes within a pre-movement period starting −3 s before movement onset. For the latter, the same number of spikes as found around movement onset was included. The window shows 42 ms around the time of the spikes (black dashed line), which includes three gamma cycles, each lasting 14 ms. The beginning and end of the central gamma cycle is marked by grey-dashed lines. The gamma oscillation in the spike-triggered average was only clearly visible at movement onset (blue lines). Note also that the timing of the spikes relative to the gamma cycle was similar across the three recordings – spikes tended to occur close to the trough. One possible confound in (A) may be that periods of strong gamma oscillations around movement onset had a higher amplitude. Here, the signal only was filtered. However, in (B) the amplitude of the signal was the same in both periods as the phase was extracted with a Hilbert-transform of the filtered signal and then back-transformed into an oscillation with a constant amplitude by computing the cosine of the phase. Thus, (B) shows that despite removing the amplitude confound, the STAs looked very similar.
Figure 3—figure supplement 3
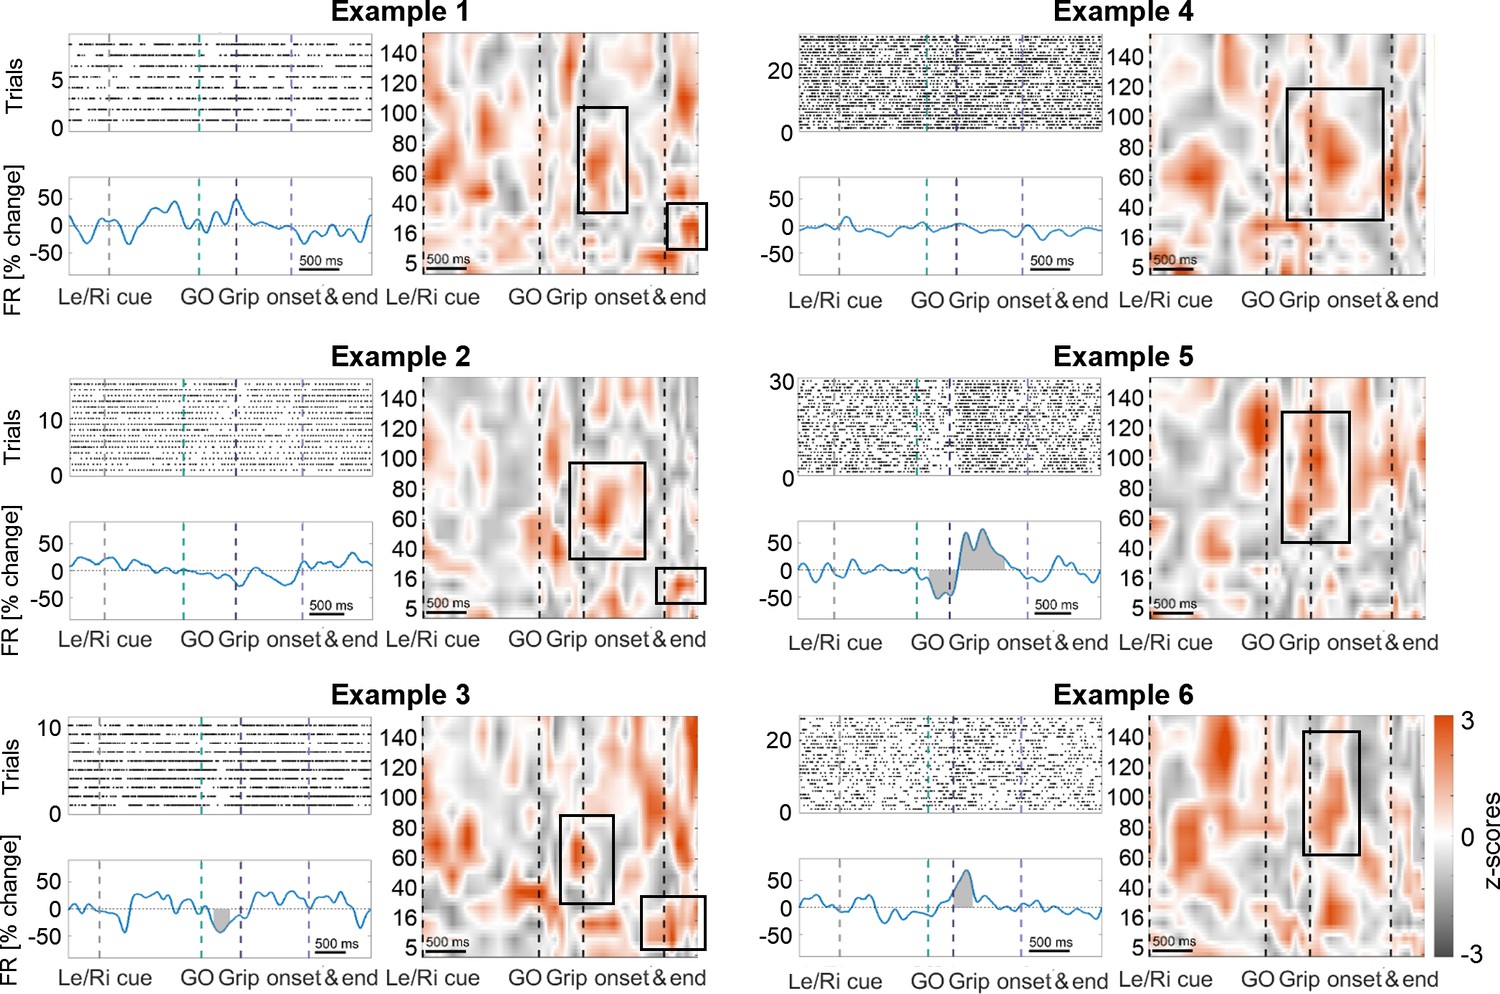
Examples of cells that are coupled to cortical gamma at contralateral movement onset and either maintain stable firing rates (top row), show a mixed response (middle right), increase (bottom right) or decrease (bottom left) their firing rates.
In 64% of all recordings, the firing behaviour did not differ between contralateral and ipsilateral gripping. Grey-shaded areas indicate multiple-comparison corrected significant deviations from the baseline firing rate obtained from the whole recording using a cluster-based permutation procedure (p<0.05). Peri-stimulus time histograms were obtained by convolving the spike train with a 200 ms wide gaussian kernel (SD = 50 ms). Note that the frequency span of the gamma coupling, highlighted by black boxes, slightly varied across cells. The cells shown to the left also coupled to beta after movement offset. Also note that the remaining red areas suggest coupling in response to other task-events, for example immediately after the Left/Right cue, which, however, was less consistent across cells as it did not appear as feature in Figure 3A.
Figure 3—figure supplement 4
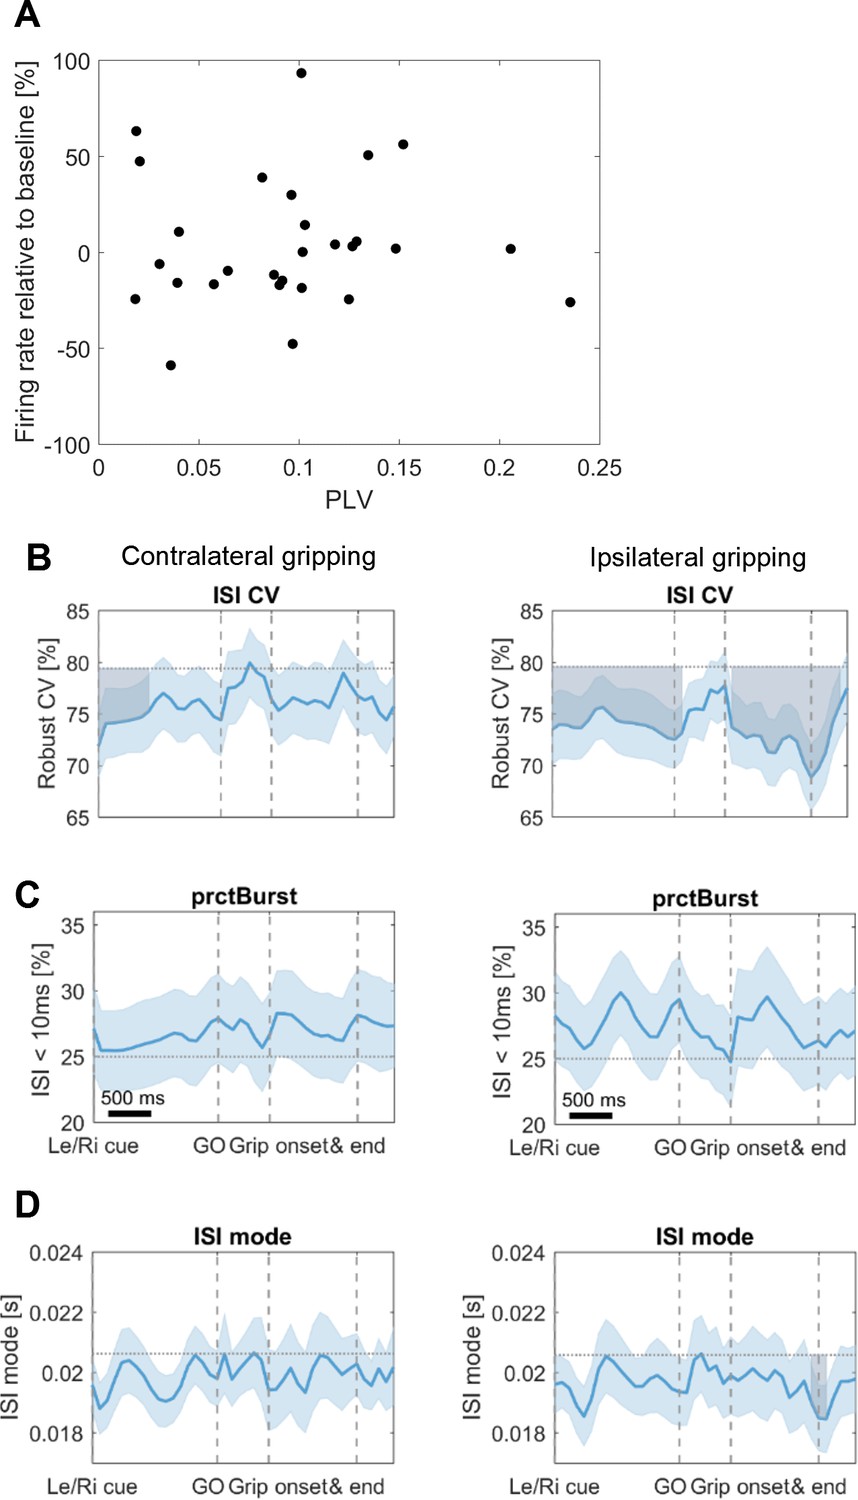
Additional firing rate analysse.
(A) Scatter plot of STN spike-to-cortical gamma phase coupling (PLV) and firing rate changes. No relationship was found between firing rate changes at movement onset and coupling strength (mean R = 0.01, p=0.969). Both measurements were computed based on 100 spikes occurring around movement onset (in a symmetrical window centred around 0.15 s after movement onset, which is the centre of the −0.1:0.4 s window used for other analyses). The number of spikes had to be held constant for all recordings to ensure that phase locking values were unbiased. If a constant window length would have been chosen instead, the phase locking values would have been biased towards higher values for firing rate decreases, resulting in a spurious relationship. (B) Firing characteristics were computed similar as in Rule et al. (2017). After the Le/Ri cue the coefficient of variation of interspike intervals (ISI CV) was reduced for contra- and ipsilateral gripping. Values were compared against the baseline activity obtained from the whole recording (horizontal dotted line) using a cluster-based permutation procedure to correct for multiple comparisons similar as for the time-frequency plots. Significant deviations from baseline are shown as shaded areas in grey. (C) No significant changes were found for the percentage of bursting (prctBurst, defined as ISI < 10 ms). (D) A drop in ISI mode (=mode of the interspike interval distribution) was observed at ipsilateral grip offset. Error bars show standard errors.
Figure 3—figure supplement 5
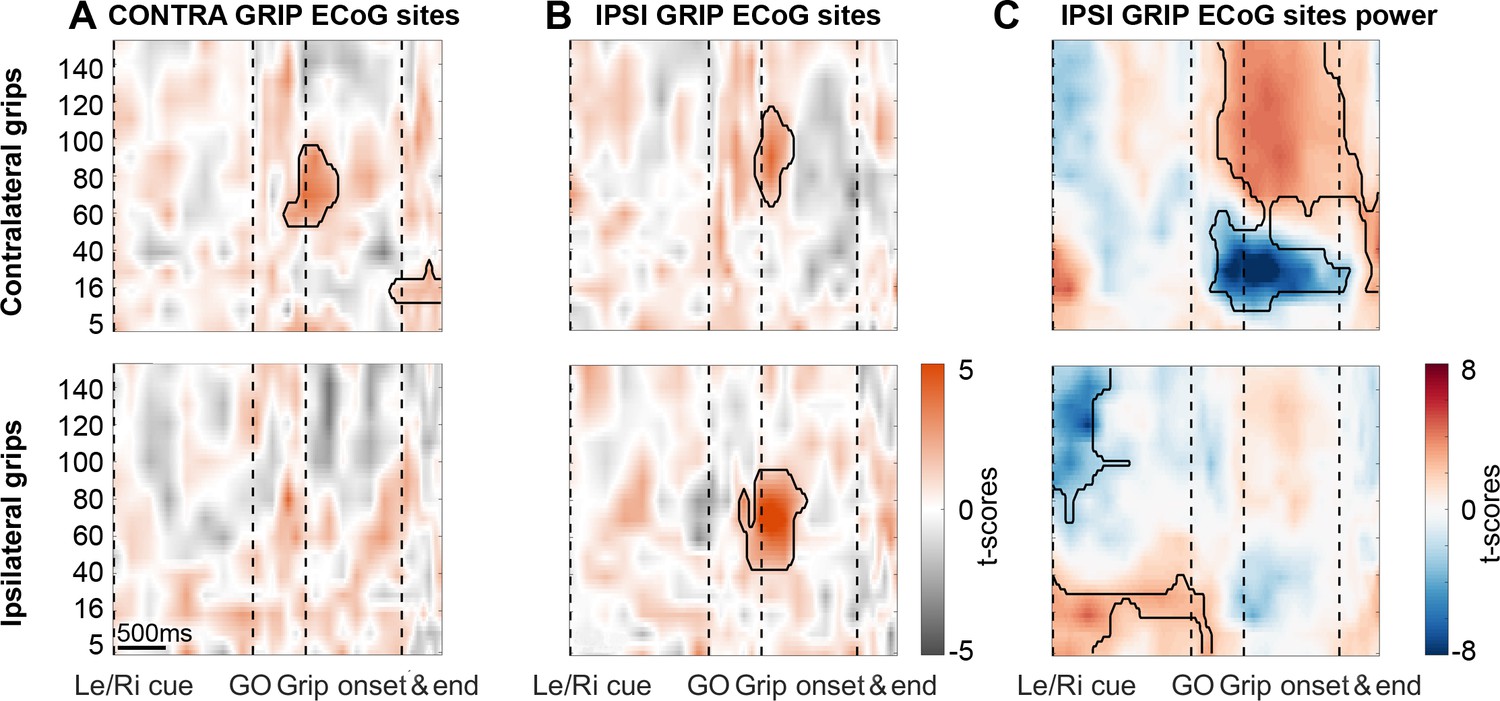
During ipsilateral gripping, STN spikes can be locked to gamma recorded from different cortical sites.
Coupling strength is presented for two different sets of ECoG sites: One set of contacts with highest gamma PLV during contra- (A) and the other one with highest gamma PLV during ipsilateral gripping (B). The leftmost column displays the same plots as shown in Figure 2 to enable a direct comparison. (B) Significant coupling between STN spikes and cortical sites with the highest 60–80 Hz PLV during ipsilateral gripping (bottom row). Note that in these sites, coupling also occurs for contralateral grips (top row) although the gamma frequency is slightly higher as when calculated for the other set of ECoG sites shown in (A). (C) In IPSI GRIP ECoG sites, gamma power increased again significantly only during contralateral gripping relative to the median power obtained from the whole recording. Note that in response to the Left/Right cue, which announced an ipsilateral movement, beta power was significantly elevated up until the Go signal while > 60 Hz power was relatively suppressed. Significant clusters (encircled in black) were obtained with a cluster-based permutation procedure to correct for multiple comparisons (p<0.05).
-
Figure 3—figure supplement 5—source data 1
Source data to Figure 3—figure supplement 5 showing coupling with IPSI GRIP ECoG sites during contralateral grip trials.
- https://cdn.elifesciences.org/articles/51956/elife-51956-fig3-figsupp5-data1-v2.mat
-
Figure 3—figure supplement 5—source data 2
Source data to Figure 3—figure supplement 5 showing coupling with IPSI GRIP ECoG sites during ipsilateral grip trials.
- https://cdn.elifesciences.org/articles/51956/elife-51956-fig3-figsupp5-data2-v2.mat
Figure 4 with 2 supplements
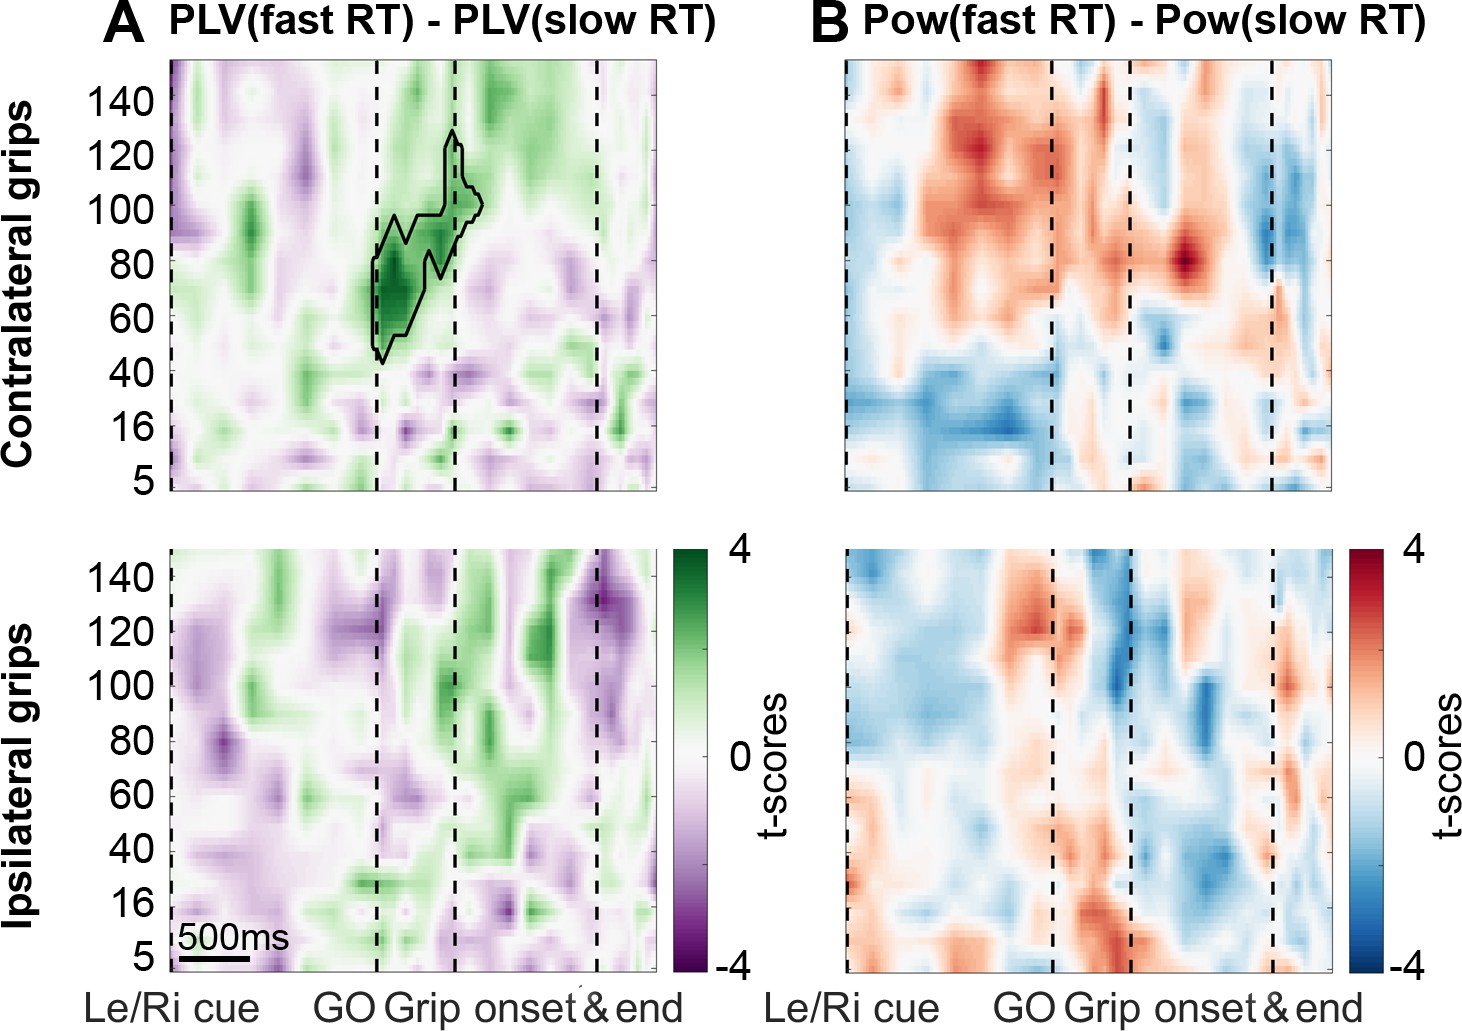
Coupling was significantly higher when reaction times were faster.
(A) The green cluster shows that in those trials, in which RTs were fast as defined by a median split, gamma coupling in the contralateral hemisphere was already significantly higher immediately after the Go signal, about 500 ms before movement onset. (B) Average cortical gamma power tended to be higher and pre-Go signal beta power lower in contralateral grip trials with faster reaction times, however, these differences did not survive cluster-based multiple comparison correction. See also Figure 4—figure supplements 1 and 2.
Figure 4—figure supplement 1
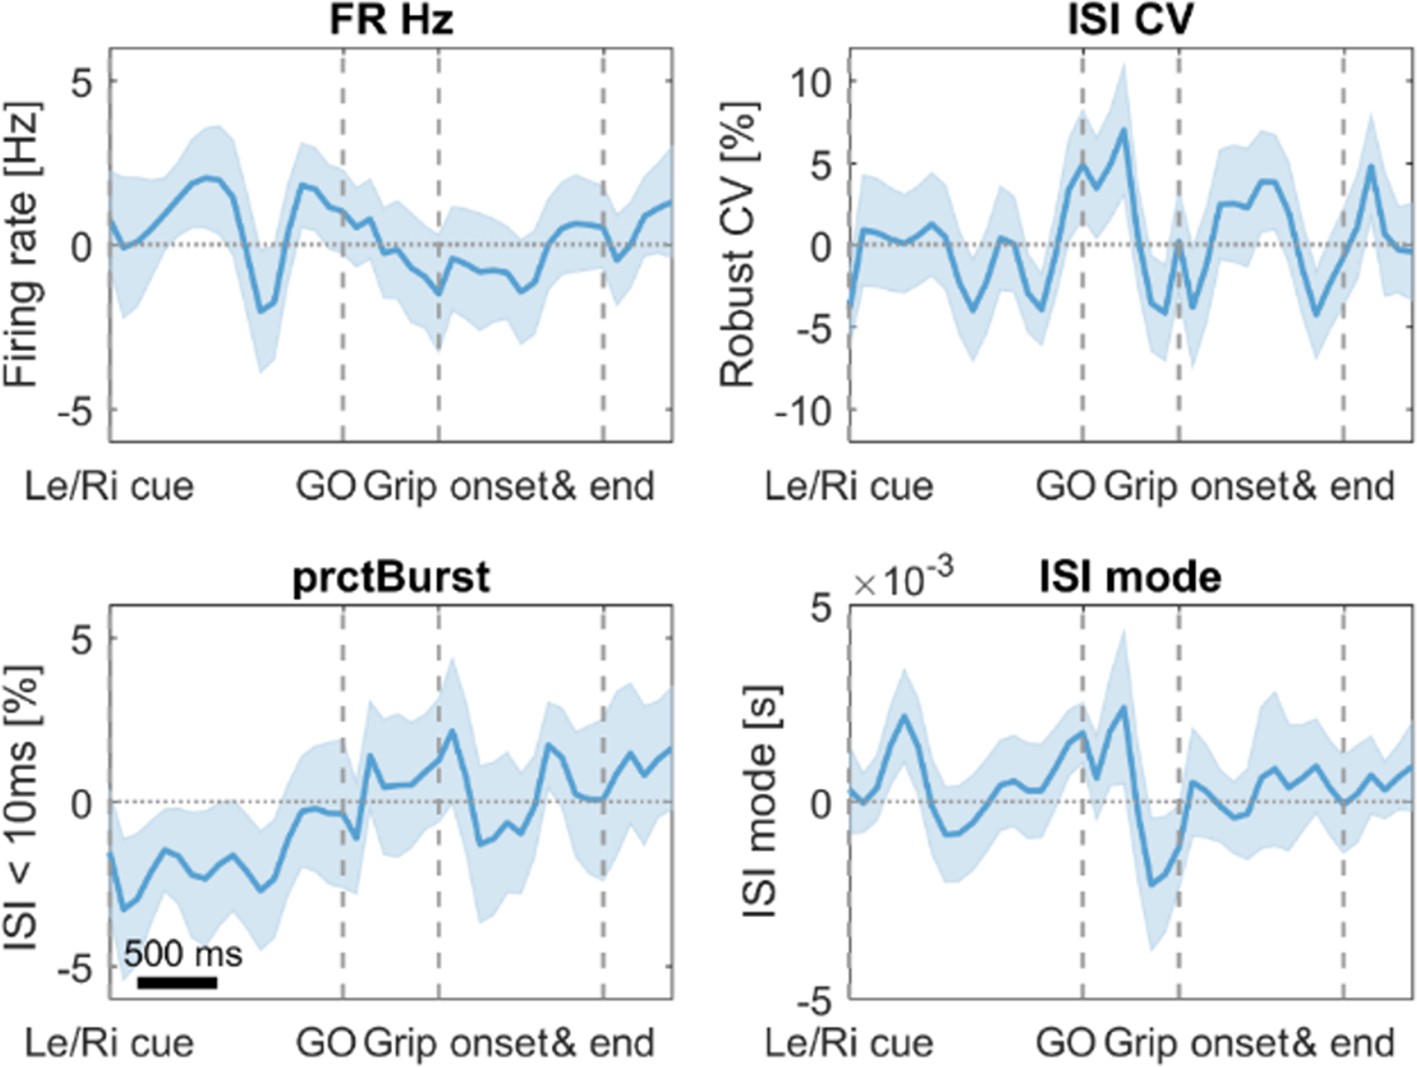
No significant differences in firing characteristics were found when comparing trials with fast vs. slow RTs.
Error bars show standard errors. FR = firing rate in Hertz, ISI CV = Coefficient of variation of interspike intervals, prctBurst = percentage of bursting (defined as ISI < 10 ms), ISI mode = mode of the interspike interval distribution.
Figure 4—figure supplement 2
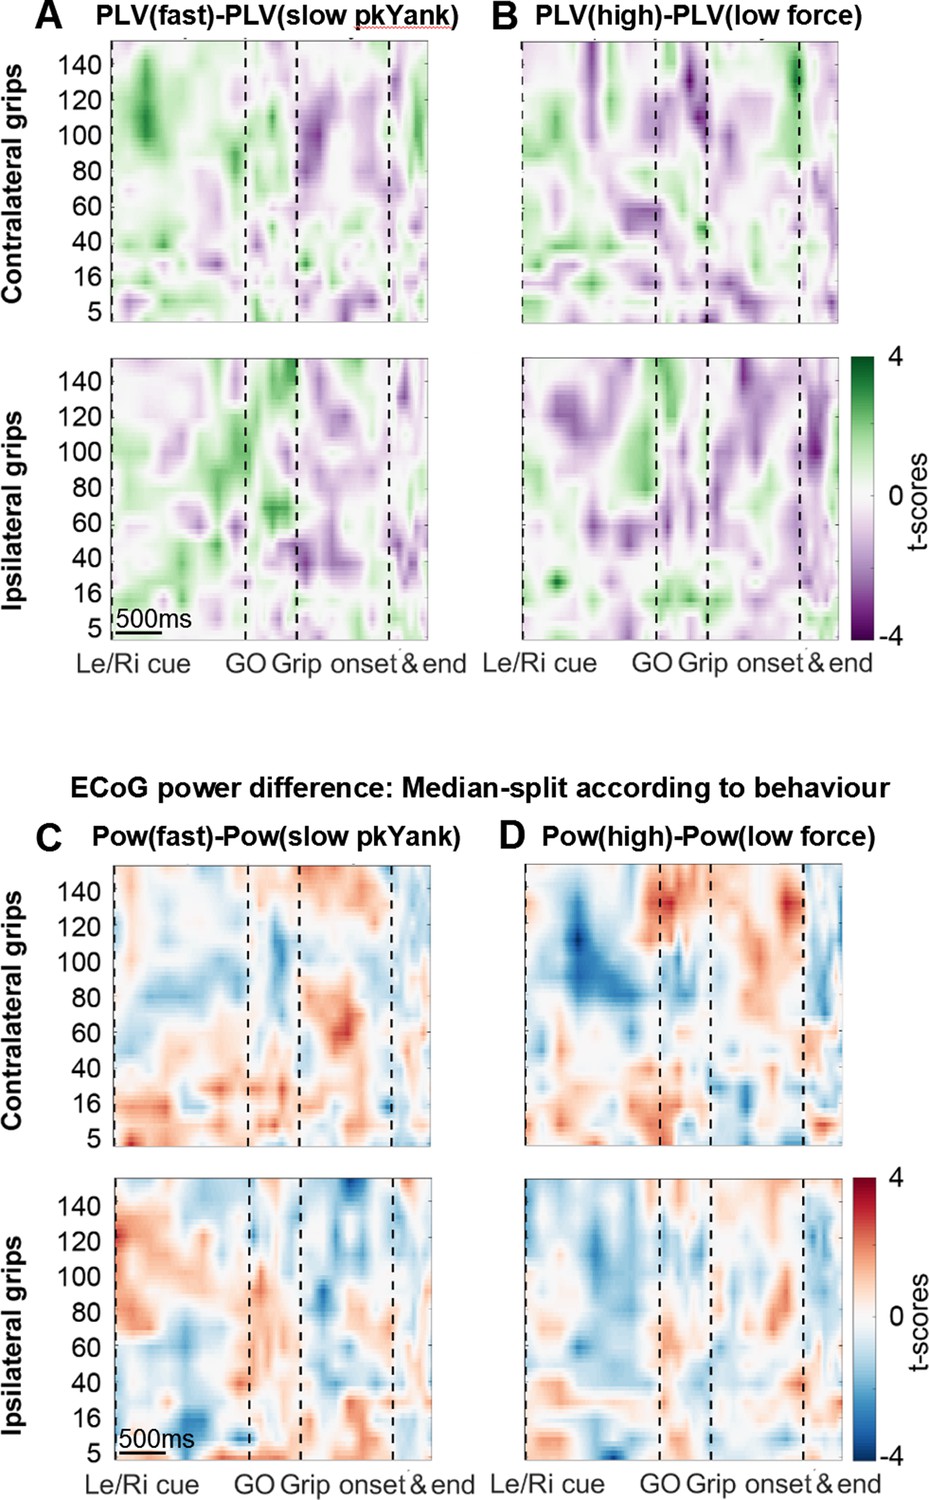
Analyses related to yank and force.
(A+B) Differences in coupling of STN spikes between trials that were median-split according to peak yank (A) and peak force (B). In contrast to the difference in coupling between fast and slow reaction times trials (shown in Figure 4 in the main text), no significant clusters were found. (C+D) Differences in ECoG power when trials were median-split according to peak yank (C) and peak force (D). No significant clusters were present.
Figure 5 with 4 supplements
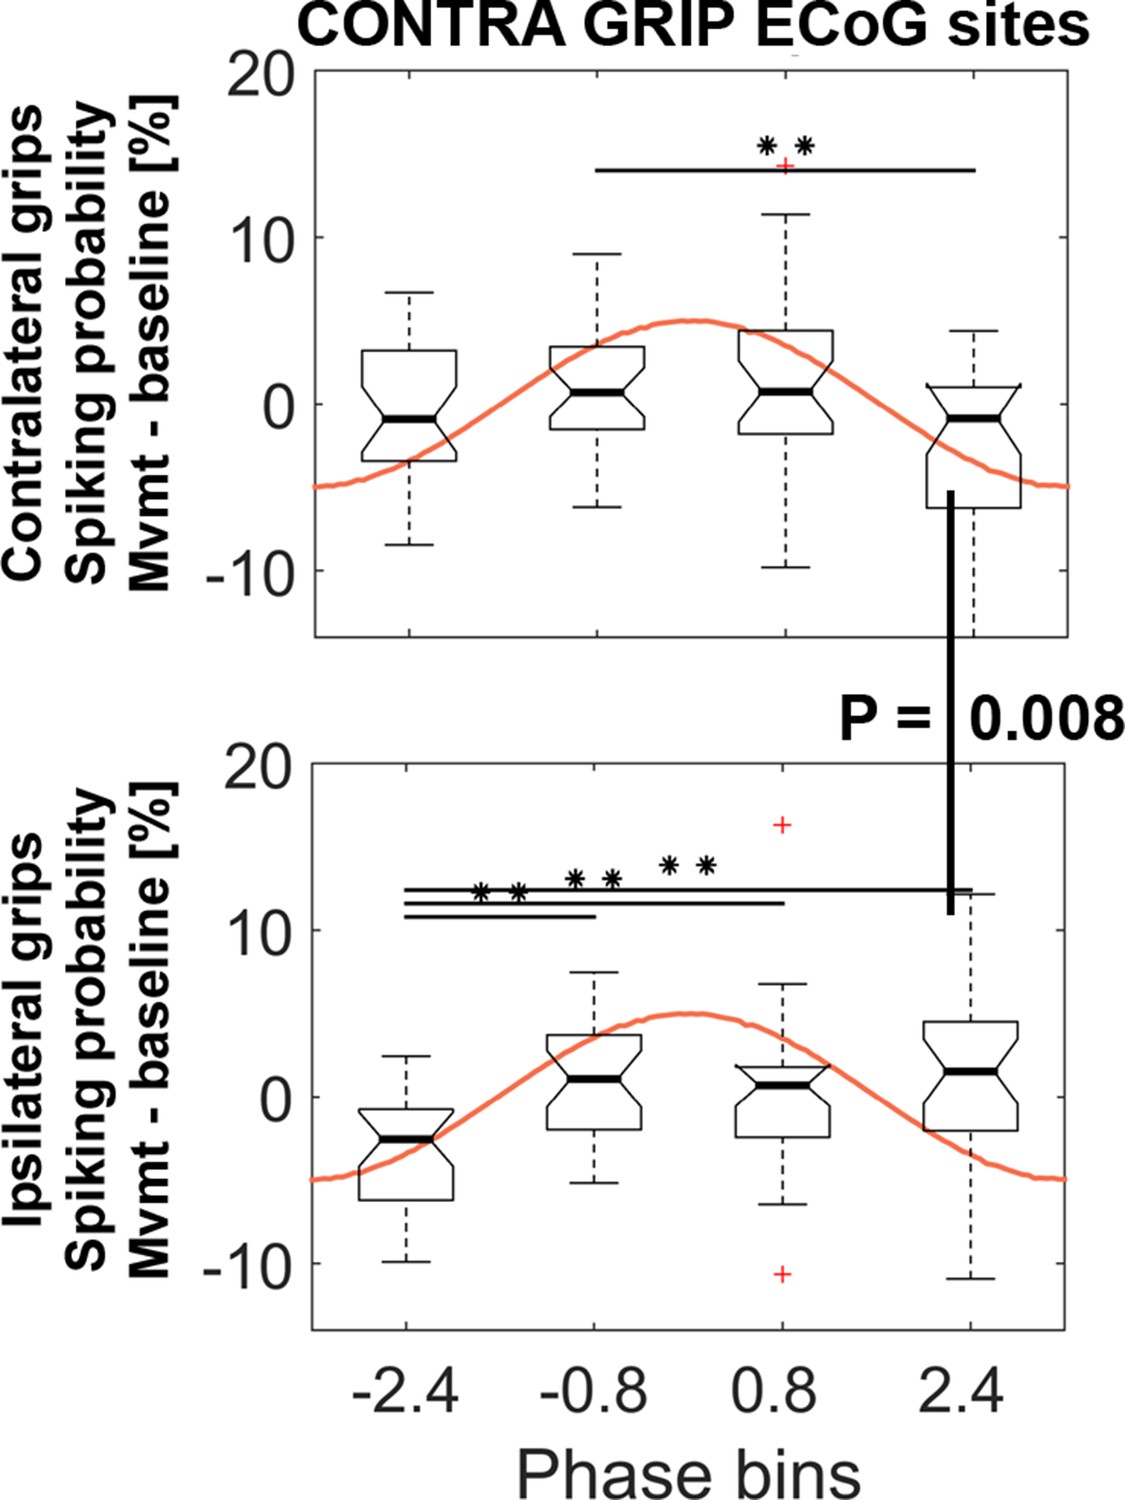
STN spiking probability is modulated relative to the phase of cortical gamma.
The top plot shows how spiking probabilities during contralateral grip onset co-modulate with the gamma phase. * show FDR-corrected significant differences between phase bins. Spiking was relatively reduced in BIN4 during contralateral gripping. It was significantly lower than during ipsilateral gripping (bottom plot, Wilcoxon signed-rank test, p=0.008). The central mark of the box plots displays the median and edges show the 25th and 75th percentile. Whiskers show the 1.5*interquartile range and outliers (red crosses) are data points beyond this range. See also Figure 5—figure supplements 1–4.
Figure 5—figure supplement 1
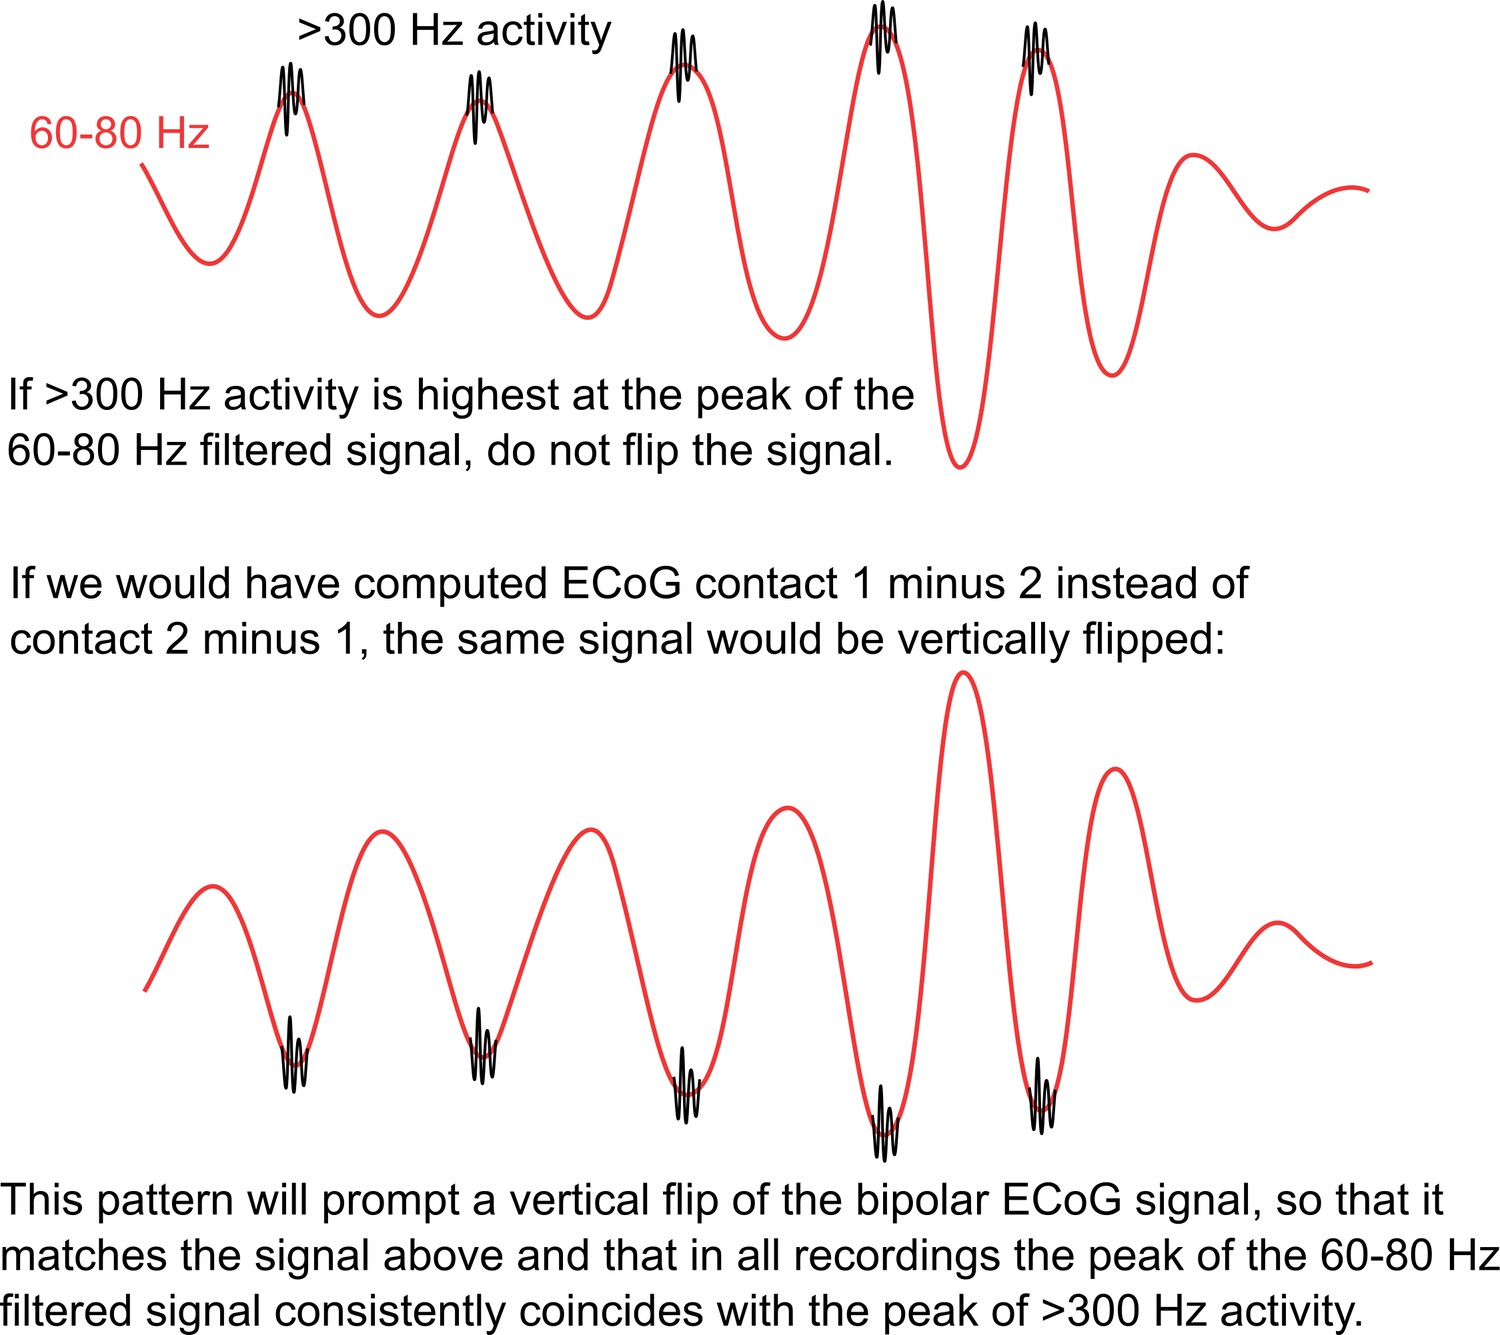
Description of the rationale behind the polarity flipping procedure.
Figure 5—figure supplement 2
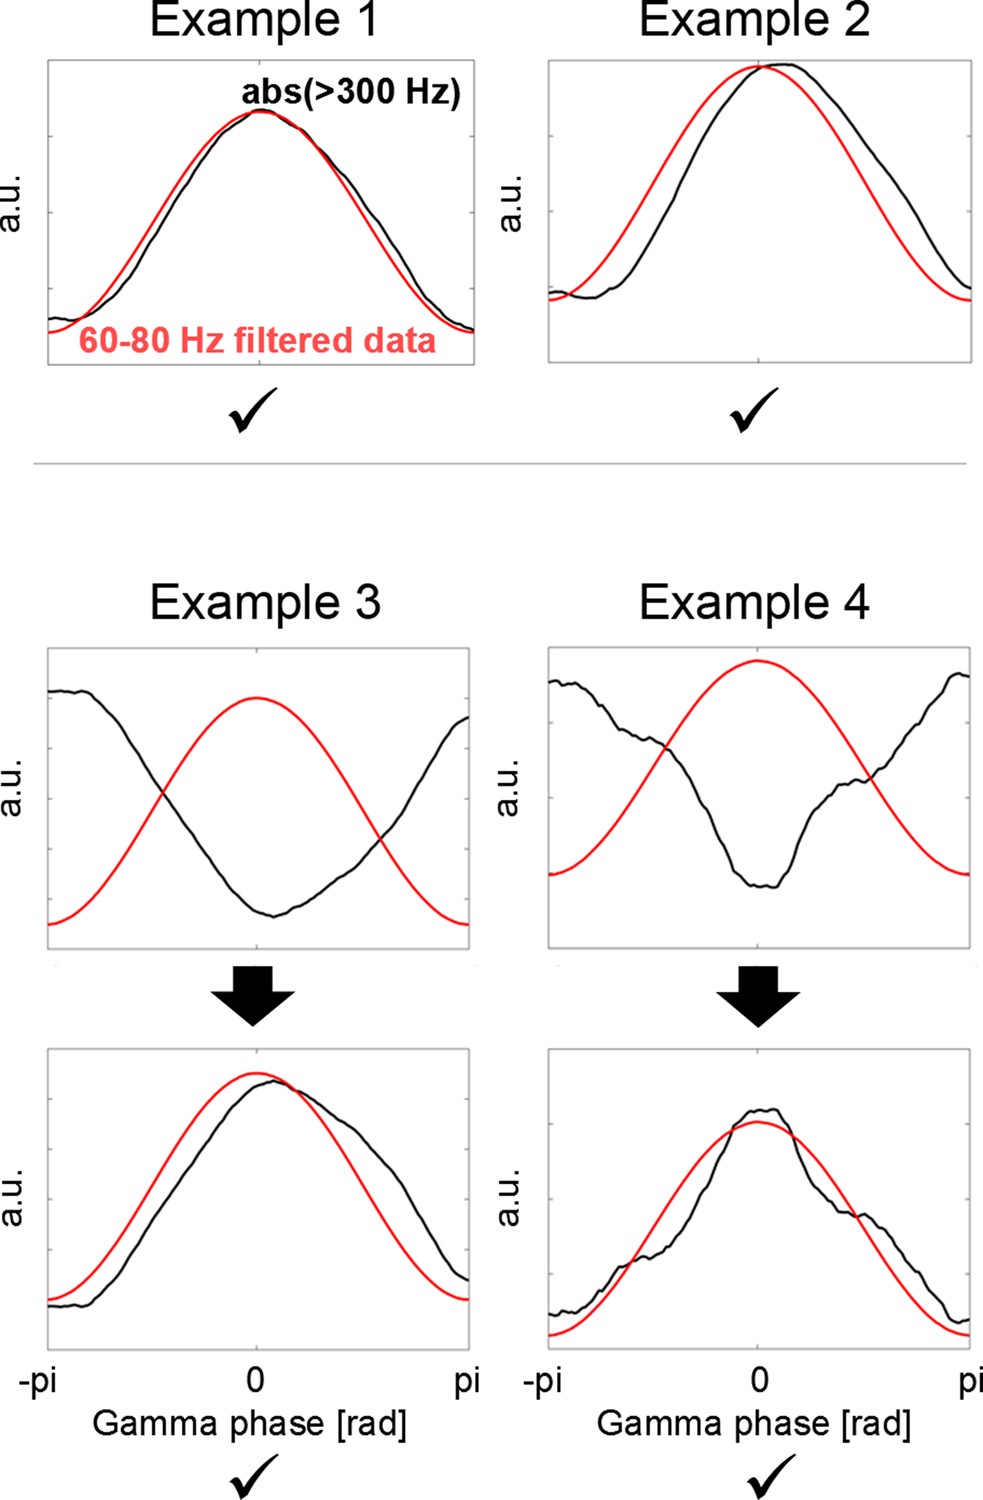
Polarity standardization procedure.
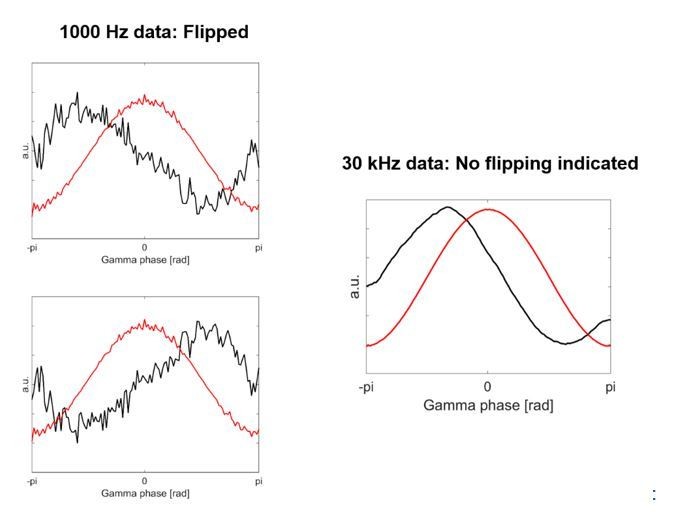
Whether we see a trough or instead a peak in the gamma signal depends on the order of subtraction of two neighbouring contacts when calculating the bipolar configuration. To ensure that the polarity is consistent across all recordings, cortical high-frequency activity (HFA = rectified > 300 Hz, black line) was used as flipping criterion, as this signal is independent of the order of subtraction and relative location of the source. If the HFA close to the borders of the plot (close to –pi and pi) was higher than in the HFA in the centre (Example 3 + 4), the phase was flipped.
Figure 5—figure supplement 3
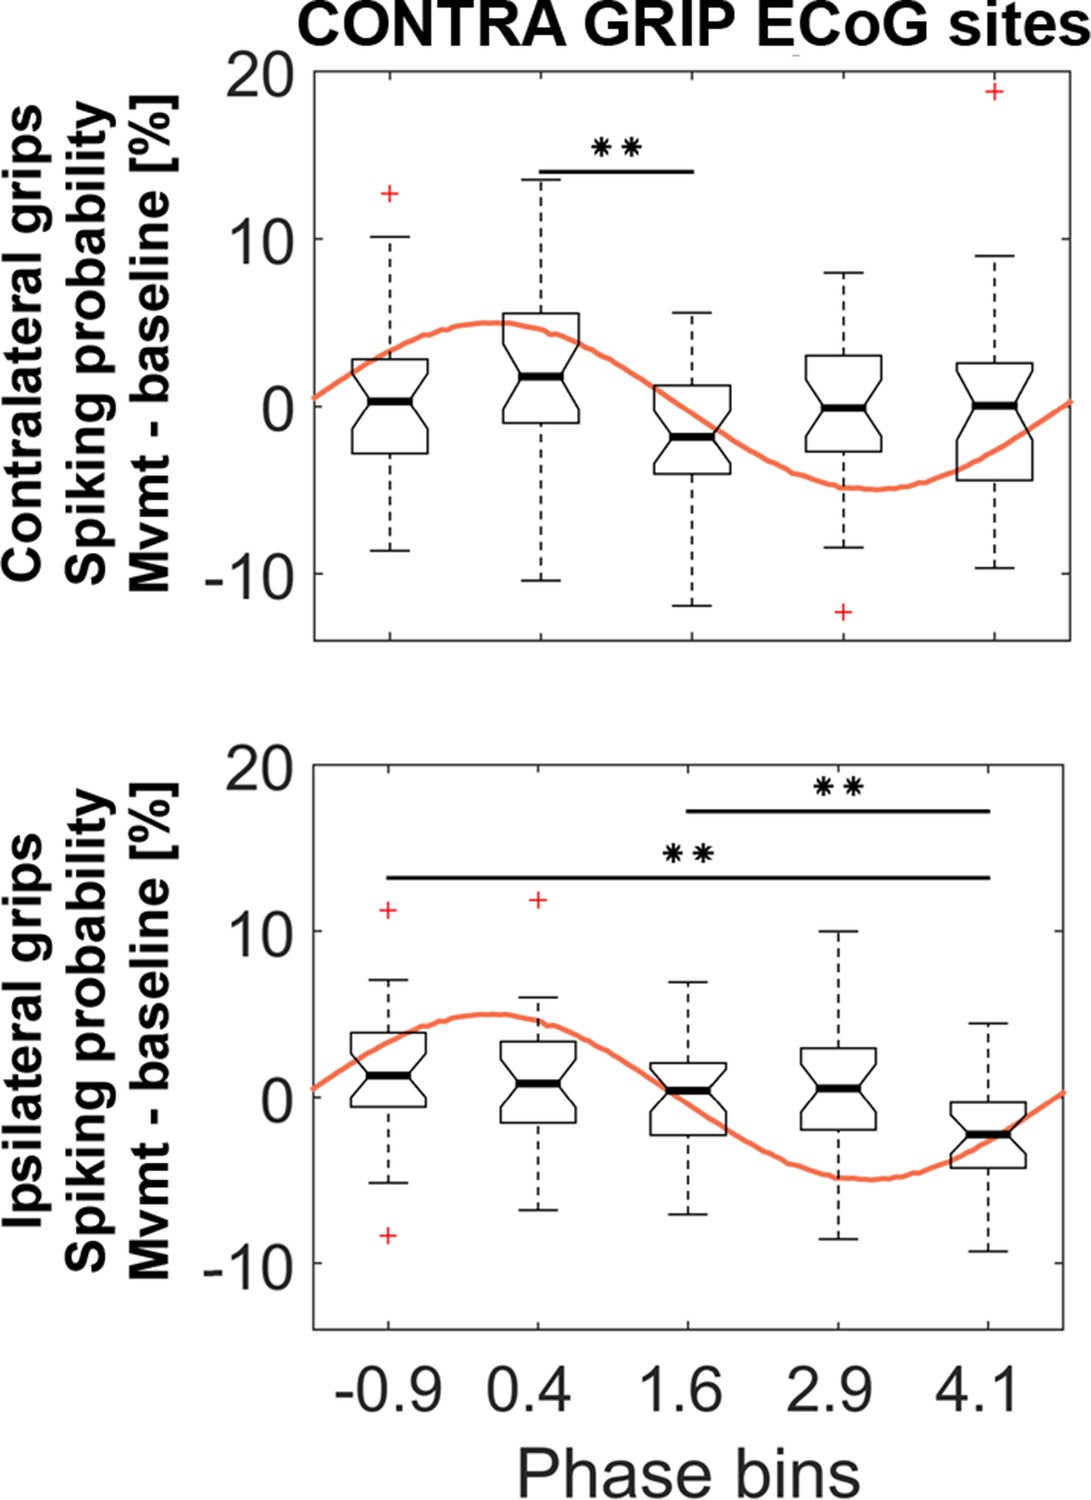
Similar analyses as in Figure 5 based on the same ECoG sites but with five instead of four phase bins.
The 5 (bins) x 2 (contra- and ipsilateral gripping) ANOVA showed a significant main effect of bin (F3.8, 102 = 3.5, p=0.012). * show FDR-corrected significant differences between phase bins within contralateral (top) and ipsilateral (bottom) grip trials. The ANOVA showed no significant main effect of effector side (F1, 27 = 12.6, p=0.374) or interaction (F3.5, 95.6 = 1.7, p=0.162). The central mark of the box plots displays the median and edges show the 25th and 75th percentile. Whiskers show the 1.5*interquartile range and outliers (red crosses) are data points beyond this range.
Figure 5—figure supplement 4
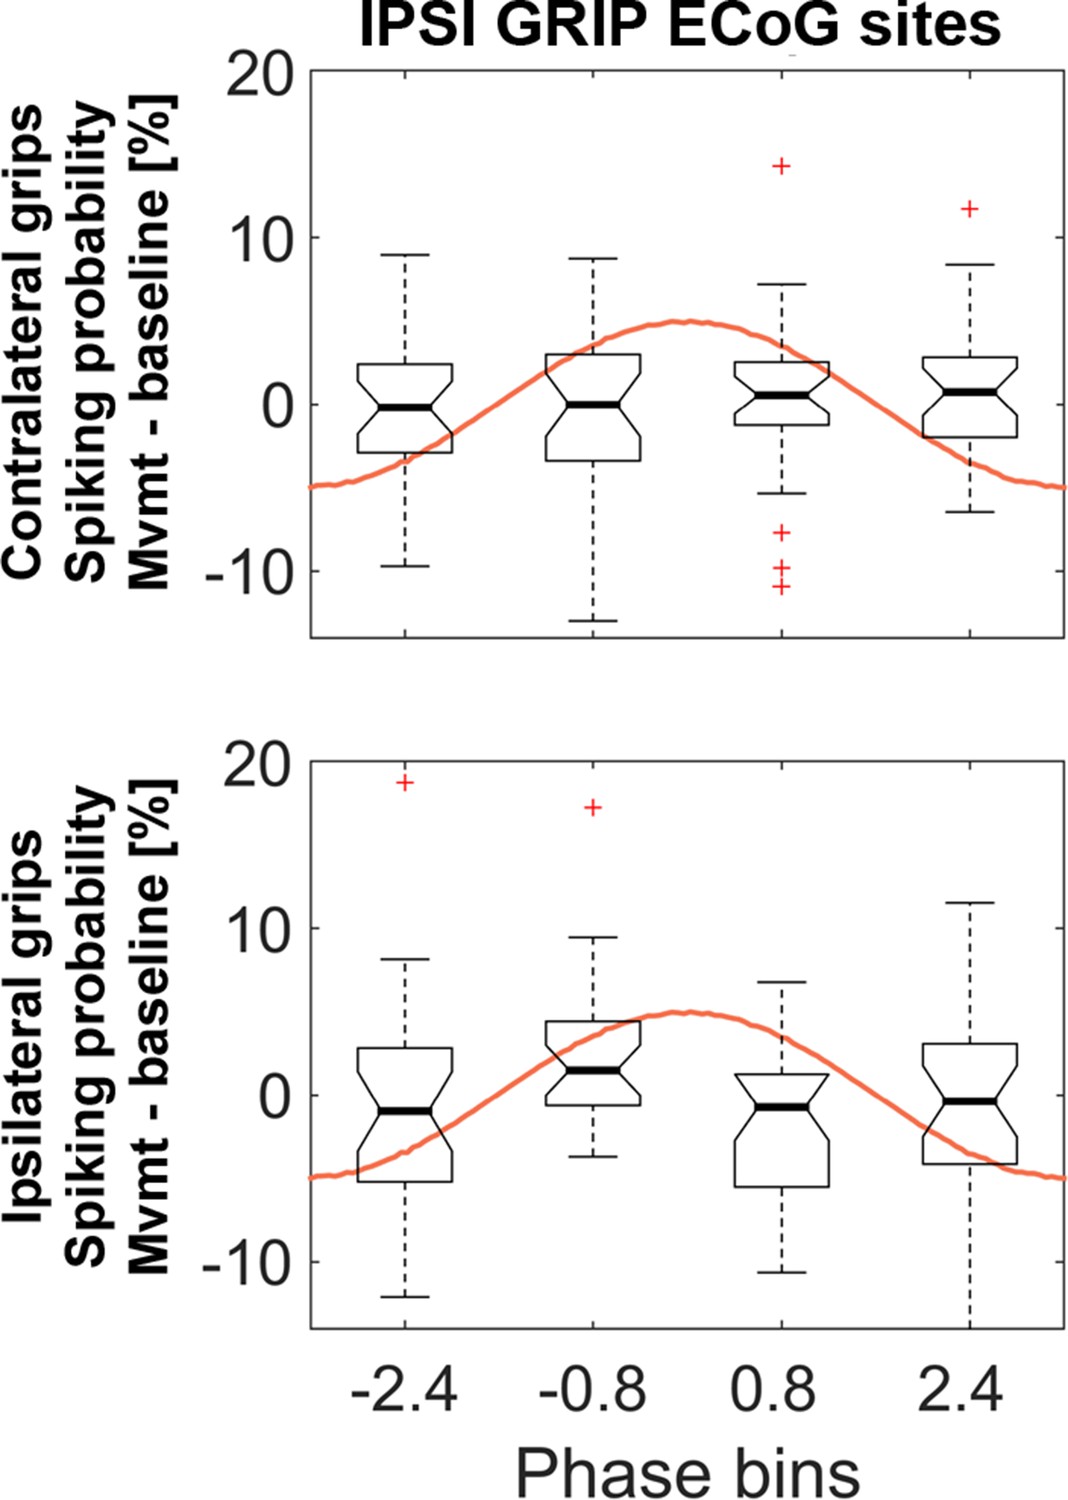
Similar analyses as in Figure 5 but based on gamma obtained from the set of ECoG sites that showed the strongest coupling during ipsilateral gripping.
The 4 (bins) x 2 (contra- and ipsilateral gripping) ANOVA was not significant (main effect bins: F3, 81 = 0.6, p=0.586; main effect effector side: F1, 27 = 0.1, p=0.787, interaction: F3, 81 = 1.2, p=0.330). The central mark of the box plots displays the median and edges show the 25th and 75th percentile. Whiskers show the 1.5*interquartile range and outliers (red crosses) are data points beyond this range.
Figure 6
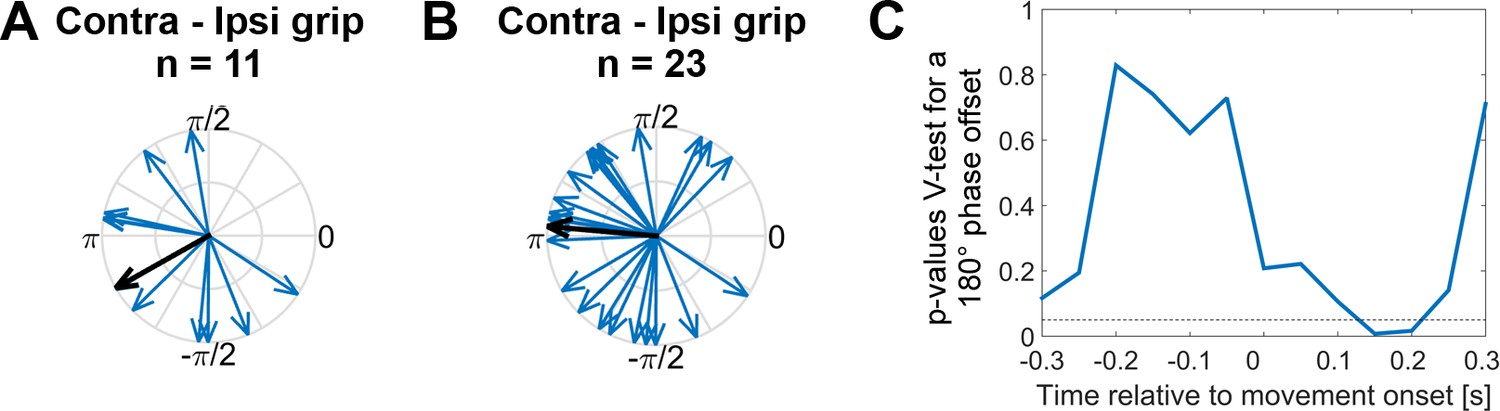
Systematic offset of STN spike timing relative to cortical gamma between contra- and ipsilateral gripping.
(A) STN spikes of recordings with significant gamma coupling (n = 11 units from seven patients [n = 6: one unit, n = 1: five units]) coincided with cortical gamma phases that were on average nearly opposite when comparing contra- and ipsilateral gripping (mean offset = −2.6 rad, 95% CI = [−3.9,–1.4]). (B) When including more recordings (all recordings where PPC > 0, n = 23 from 12 patients [n = 7: one unit, n = 1: two units, n = 3: three units, n = 1: five units]), the offset was very close to 180° (mean offset = 3.1 rad, 95% CI = [2.1, 4.0]). The gamma phase was extracted from ECoG sites that showed the highest coupling during contralateral gripping, as also used for Figures 3–5. (C) P-values derived from a V-test assessing directionality towards an offset of 180° (n = 23) show that the effect of the offset is strongest in a 500 ms sliding window centred around 0.15 s after movement onset, i.e. in a window −0.1–0.4 s around movement onset.
Author response image 1
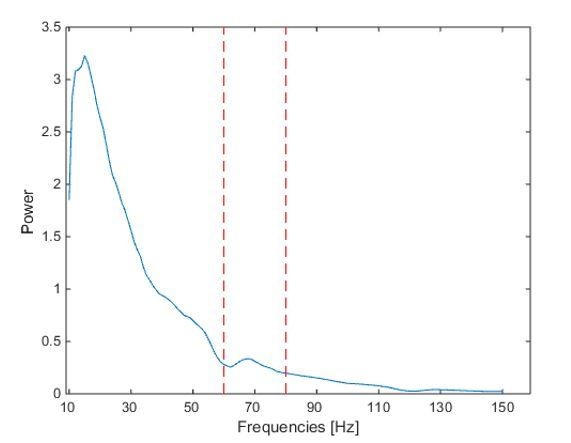
Power spectrum based on the -0.1:0.4s window around movement onset.
Author response image 2

Low-pass filter effect.
Author response image 3
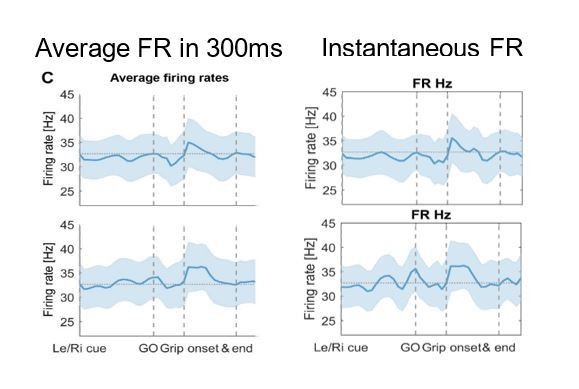
Comparison of analyses using 300ms average versus instanteous firing rate.
Author response image 4
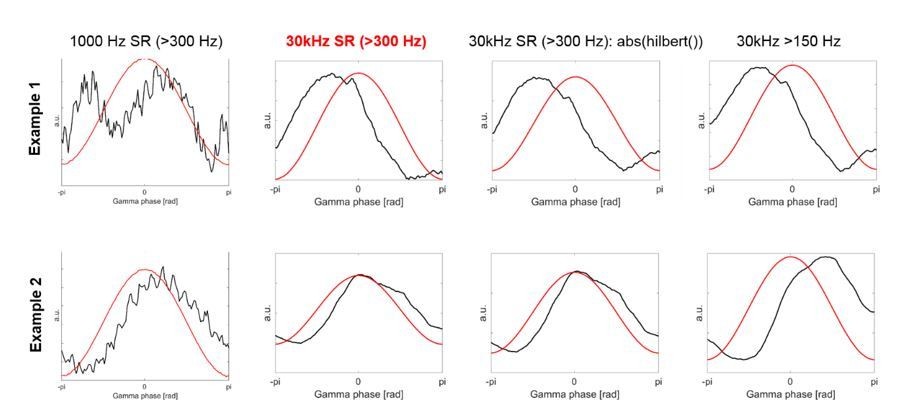
The first column shows two examples of the HFA based on the 1000 Hz data, which was used in the previous version of our article.
The second column shows HFA based on the 30 kHz data, which is what we have used now for the revised version.
Author response image 5
Comparison of analysis using data sampled at 1000Hz versus 30kHz.
Author response image 6
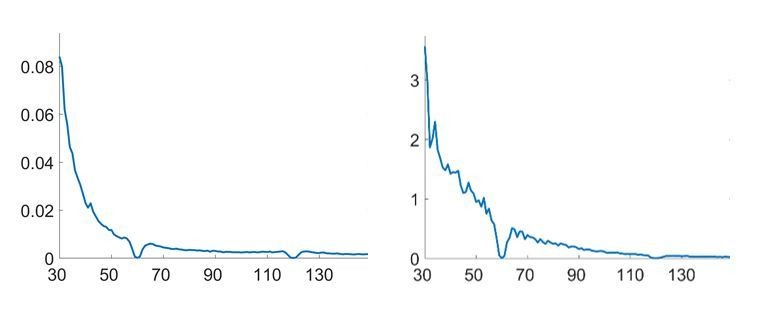
Line-noise attenuation.
Tables
Table 1
Questions addressed by STN spike-to-cortical gamma phase coupling analyses.
| Figure | Question | Finding |
|---|---|---|
| Figure 2: | Is it most pronounced over motor cortex? | Yes |
| Figure 3A: | Is it frequency- and time-specific? | Yes |
| Figure 3C: | Is the average firing rate across all units significantly modulated? | No |
| Figure 4: | Are faster reaction times linked to stronger coupling? | Yes |
| Figure 5: | Is the probability of spikes significantly modulated relative to the cortical gamma phase | |
| during contra- and ipsilateral gripping? | Yes | |
| Figure 6: | Do we find a systematic phase offset of the average timing of STN spikes relative | |
| to the cortical gamma phase between contra- and ipsilateral gripping? | Yes |
Table 2
Clinical details.
Age is given in years, M/F = male/female, MMSE = Mini Mental State Exam for neurocognition, UPDRS = Unified Parkinson’s Disease Rating Scale, contra = contralateral, ipsi = ipsilateral, RAM = rapid alternating movements of the hands, Recorded HS = Recorded Hemisphere, NR = value was not recorded in the medical record.
| MMSE | Tremor | Rest tremor | Postural tremor of hands | Finger tapping | Hand movement | RAM | Total | Nr. of units: contralateral + | ||||||||||
|---|---|---|---|---|---|---|---|---|---|---|---|---|---|---|---|---|---|---|
| Age | Sex | Score | Dominant | R | L | R | L | R | L | R | L | R | L | UPDRS | Handedness | Recorded HS | Higher UPDRS | Ipsilateral grip trials |
| 69 | F | 29 | No | 0 | 2 | 0 | 0 | 1 | 1 | 1 | 1 | 1 | 1 | 31 | left | left+right | contra+ipsi | n = 2: 31, 27 |
| 54 | F | 29 | NR | NR | NR | NR | NR | NR | NR | NR | NR | NR | NR | NR | right | left+right | NR | n = 3: 43, 42 |
| 68 | M | 29 | No | 0 | 1 | 0 | 1 | 2 | 3 | 2 | 3 | 1 | 3 | 42 | right | left | ipsi | n = 1: 10, 16 |
| 66 | M | 30 | Yes | 3 | 3 | 2 | 3 | 3 | 3 | 3 | 3 | 3 | 2 | 62 | right | left+right | equal | n = 3, 68, 81 |
| 71 | M | 30 | No | 2 | 0 | 0 | 0 | 3 | 2 | 3 | 3 | 3 | 3 | 55 | right | left+right | contra+ipsi | n = 3: 61, 58 |
| 65 | F | 26 | No | 0 | 1 | 1 | 1 | 2 | 4 | 2 | 3 | 2 | 2 | 54 | NR | left | ipsi | n = 5: 96, 63 |
| 45 | M | 29 | Yes | 3 | 3 | 4 | 4 | 0 | 1 | 0 | 1 | 0 | 1 | 31 | right | left | ipsi | n = 1: 12, 12 |
| 60 | M | 29 | No | 2 | 3 | 1 | 1 | 2 | 3 | 2 | 2 | 2 | 2 | 52 | right | left | ipsi | n = 2: 42, 50 |
| 54 | M | 39 | No | 1 | 0 | 0 | 0 | 2 | 2 | 2 | 2 | 3 | 3 | 33 | right | left | contra | n = 1: 15, 13 |
| 68 | M | NR | No | 0 | 0 | 2 | 2 | 2 | 3 | 2 | 2 | 2 | 3 | 48 | right | left | ipsi | n = 1: 12, 11 |
| 52 | M | NR | No | 0 | 0 | 0 | 0 | 1 | 1 | 1 | 1 | 1 | 1 | 27 | right | left+right | equal | n = 5: 113, 112 |
| 60 | M | 30 | Yes | 2 | 2 | 1 | 2 | 1 | 1 | 1 | 1 | 1 | 1 | 28 | right | right | contra | n = 1: 16, 16 |
Additional files
-
Source code 1
Code to generate the time-frequency figures in the main manuscript and in the supplementary figures including the functions to run the cluster-based permutation statistics.
- https://cdn.elifesciences.org/articles/51956/elife-51956-code1-v2.zip
-
Transparent reporting form
- https://cdn.elifesciences.org/articles/51956/elife-51956-transrepform-v2.pdf
Download links
A two-part list of links to download the article, or parts of the article, in various formats.
Downloads (link to download the article as PDF)
Open citations (links to open the citations from this article in various online reference manager services)
Cite this article (links to download the citations from this article in formats compatible with various reference manager tools)
Movement-related coupling of human subthalamic nucleus spikes to cortical gamma
eLife 9:e51956.
https://doi.org/10.7554/eLife.51956


