Symptom evolution following the emergence of maize streak virus
- Norwegian Veterinary Institute, Norway
- Swedish University of Agricultural Sciences, Sweden
- KU Leuven - University of Leuven, Belgium
- Université Libre de Bruxelles, Belgium
- University of Cape Town, Observatory, South Africa
- Makerere University, Uganda
- University of Cape Town, South Africa
- CIRAD, UMR PVBMT, France
- Institut de recherche pour le développement (IRD), UMR 5290, Maladie Infectieuses & Vecteurs: Écologie, Génétique Évolution & Contrôle” (MIVEGEC), France
- CIRAD, BGPI, France
- BGPI, INRA, CIRAD, SupAgro, Univ Montpellier, France
- University of the Western Cape, South Africa
- David Geffen School of Medicine, University of California, Los Angeles, United States
- Arizona State University, United States
Figures
Figure 1
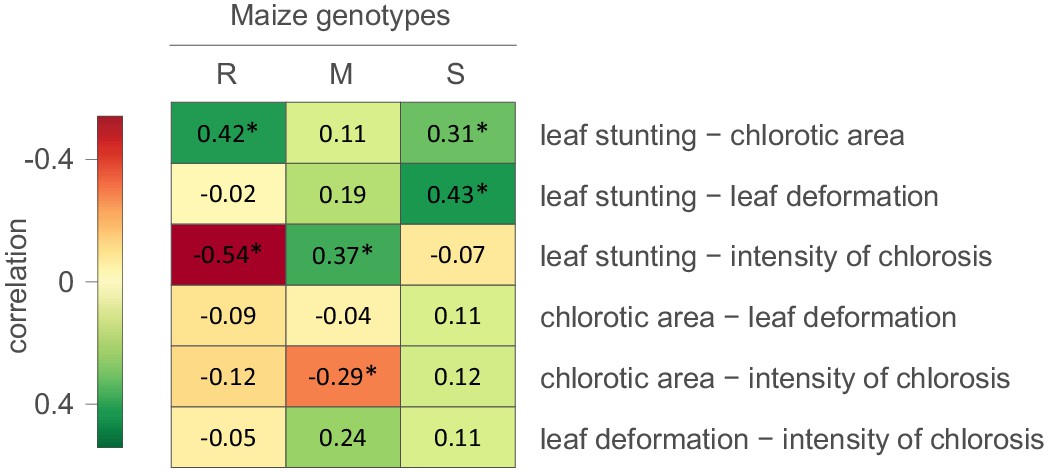
Correlations between MSV-A symptom measurements.
For each specific maize genotype and pair of traits, correlation estimates accounting for the phylogenetic relatedness of viral isolates are indicated by the colour gradient. A correlation estimate was considered significant (indicated by an asterisk) if the 95% HPD interval of the posterior distribution of the estimate excluded zero.
Figure 2 with 4 supplements
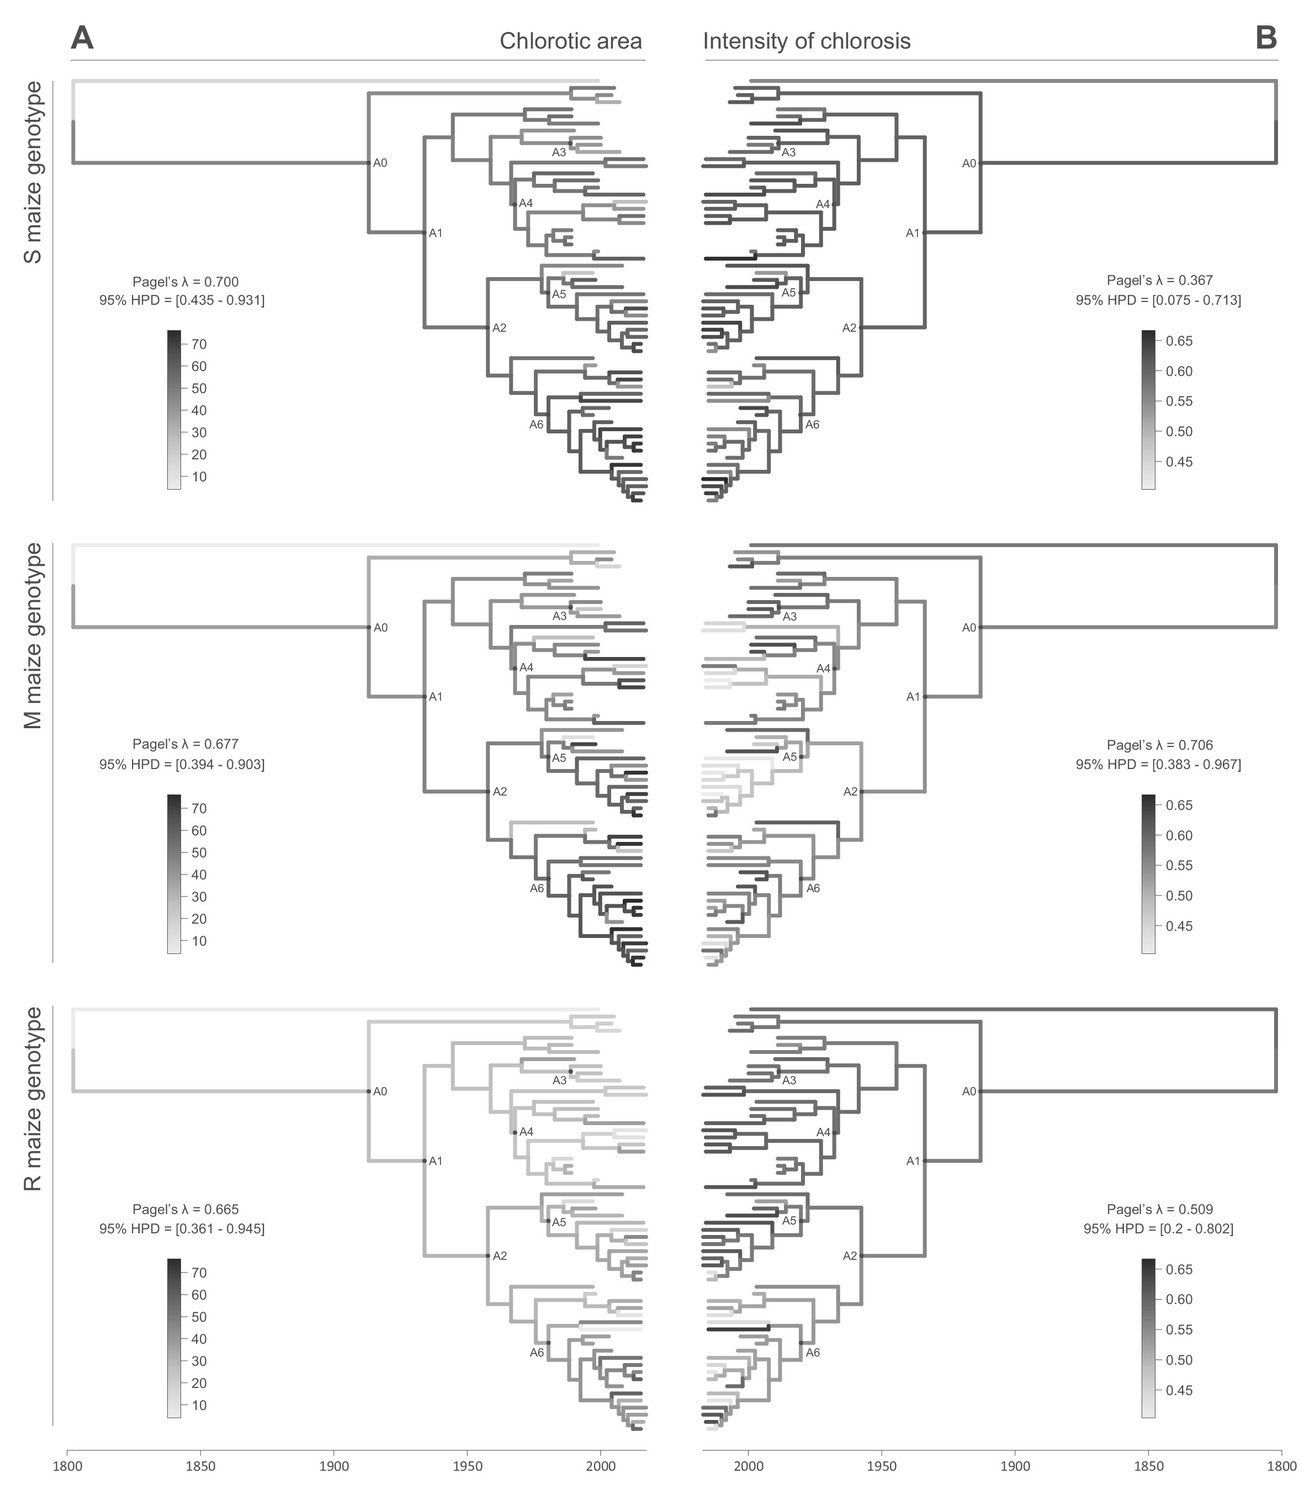
Continuous character mapping of symptom intensities, chlorotic area (A) and intensity of chlorosis (B), onto the MSV-A maximum clade credibility tree.
Symptom intensities of ancestral viruses were phylogenetically inferred based on those observed in sensitive (S), moderately resistant (M) and resistant (R) maize genotypes infected by 59 MSV-A isolates and one MSV-B isolate (the outgroup), sampled between 1979 and 2007. The intensities of symptoms are represented by coloured branches on a grey-scale. ‘A0-A6’ indicate the ancestral nodes of the constrained clades for which MRCA sequences were inferred, synthesised and used to verify symptom intensity estimates. For each maximum clade credibility tree, we also report Pagel’s λ values (Pagel, 1999), which indicate the degree of phylogenetic signal associated with the various symptom measurements. A version of the tree with taxon labels is given in Figure 2—figure supplement 1.
Figure 2—figure supplement 1
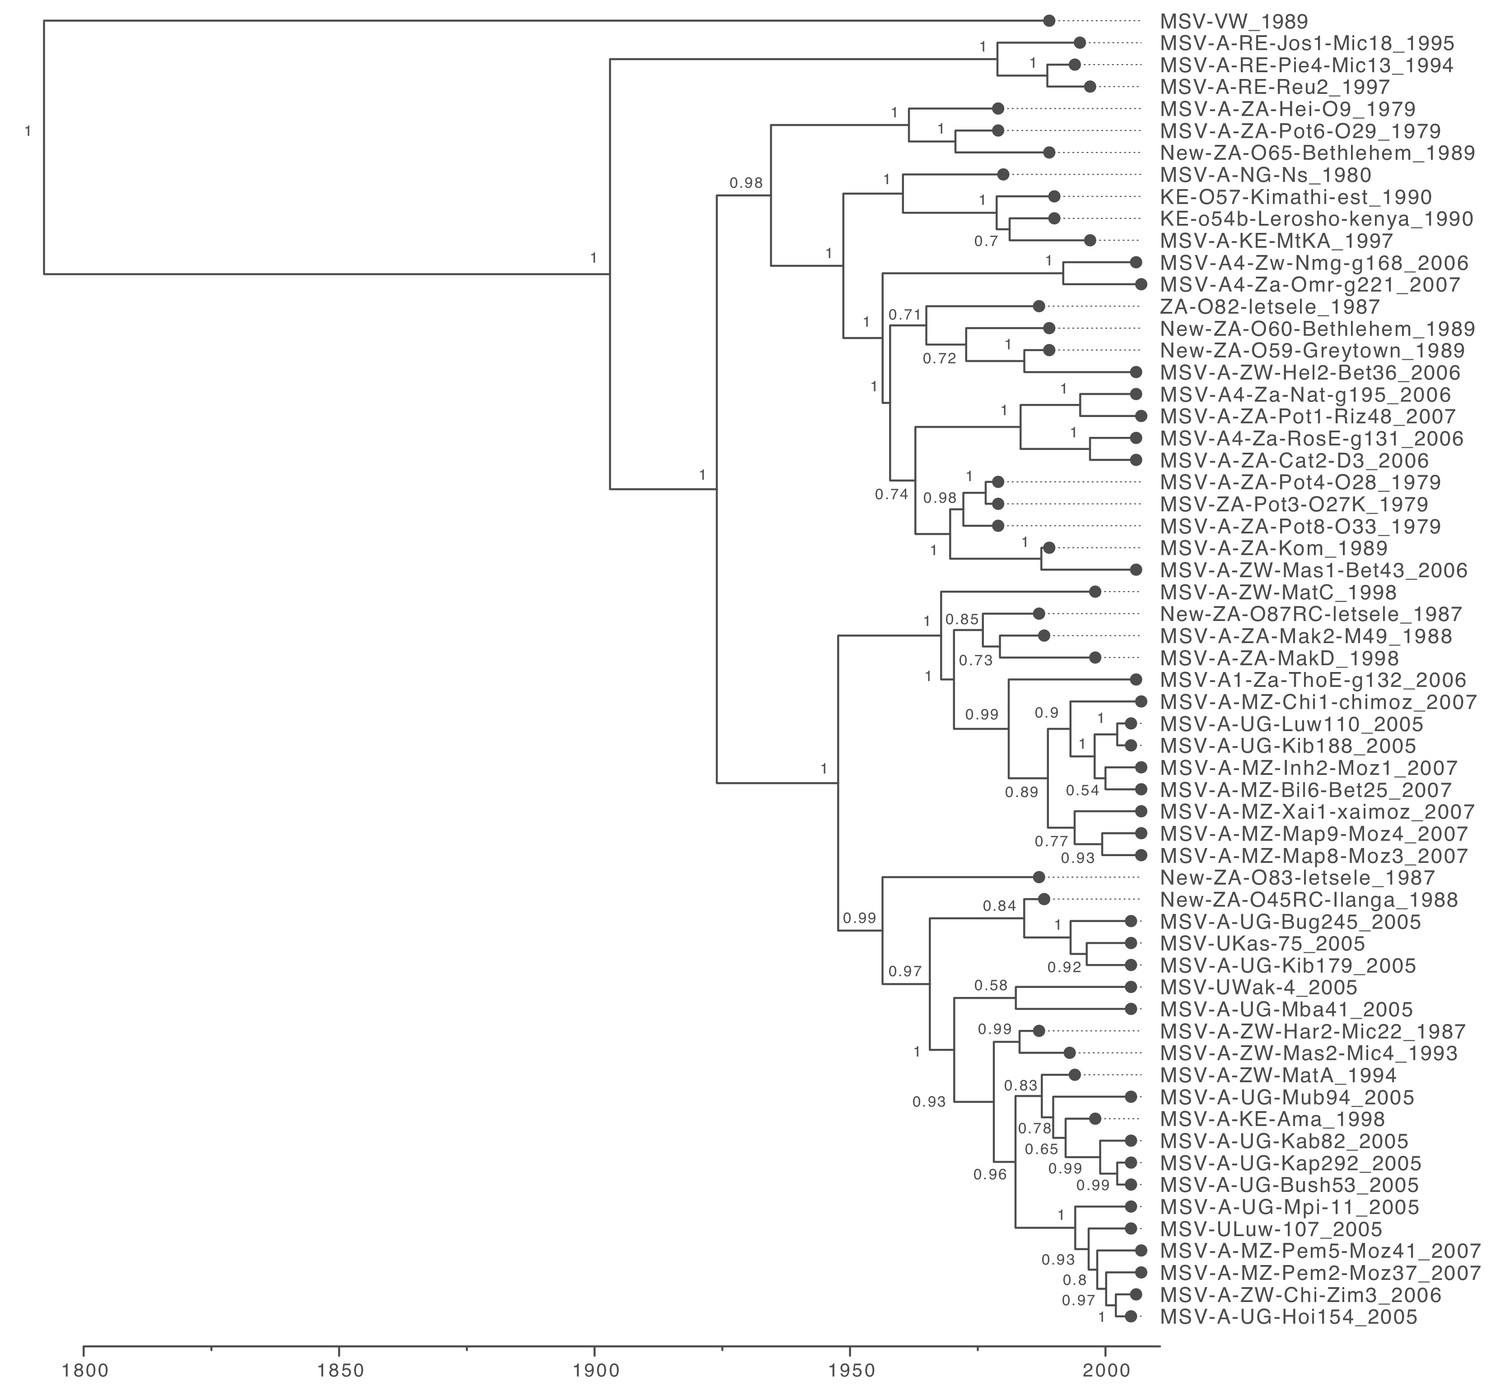
Maximum clade credibility tree (from Figure 2) with taxon labels and posterior probabilities displayed at internal nodes.
Figure 2—figure supplement 2
Maximum clade credibility tree (from Figure 2) with taxon labels and 95% highest probability density (HPD) intervals reflecting the uncertainty of inferred node ages (green bars).
Figure 2—figure supplement 3
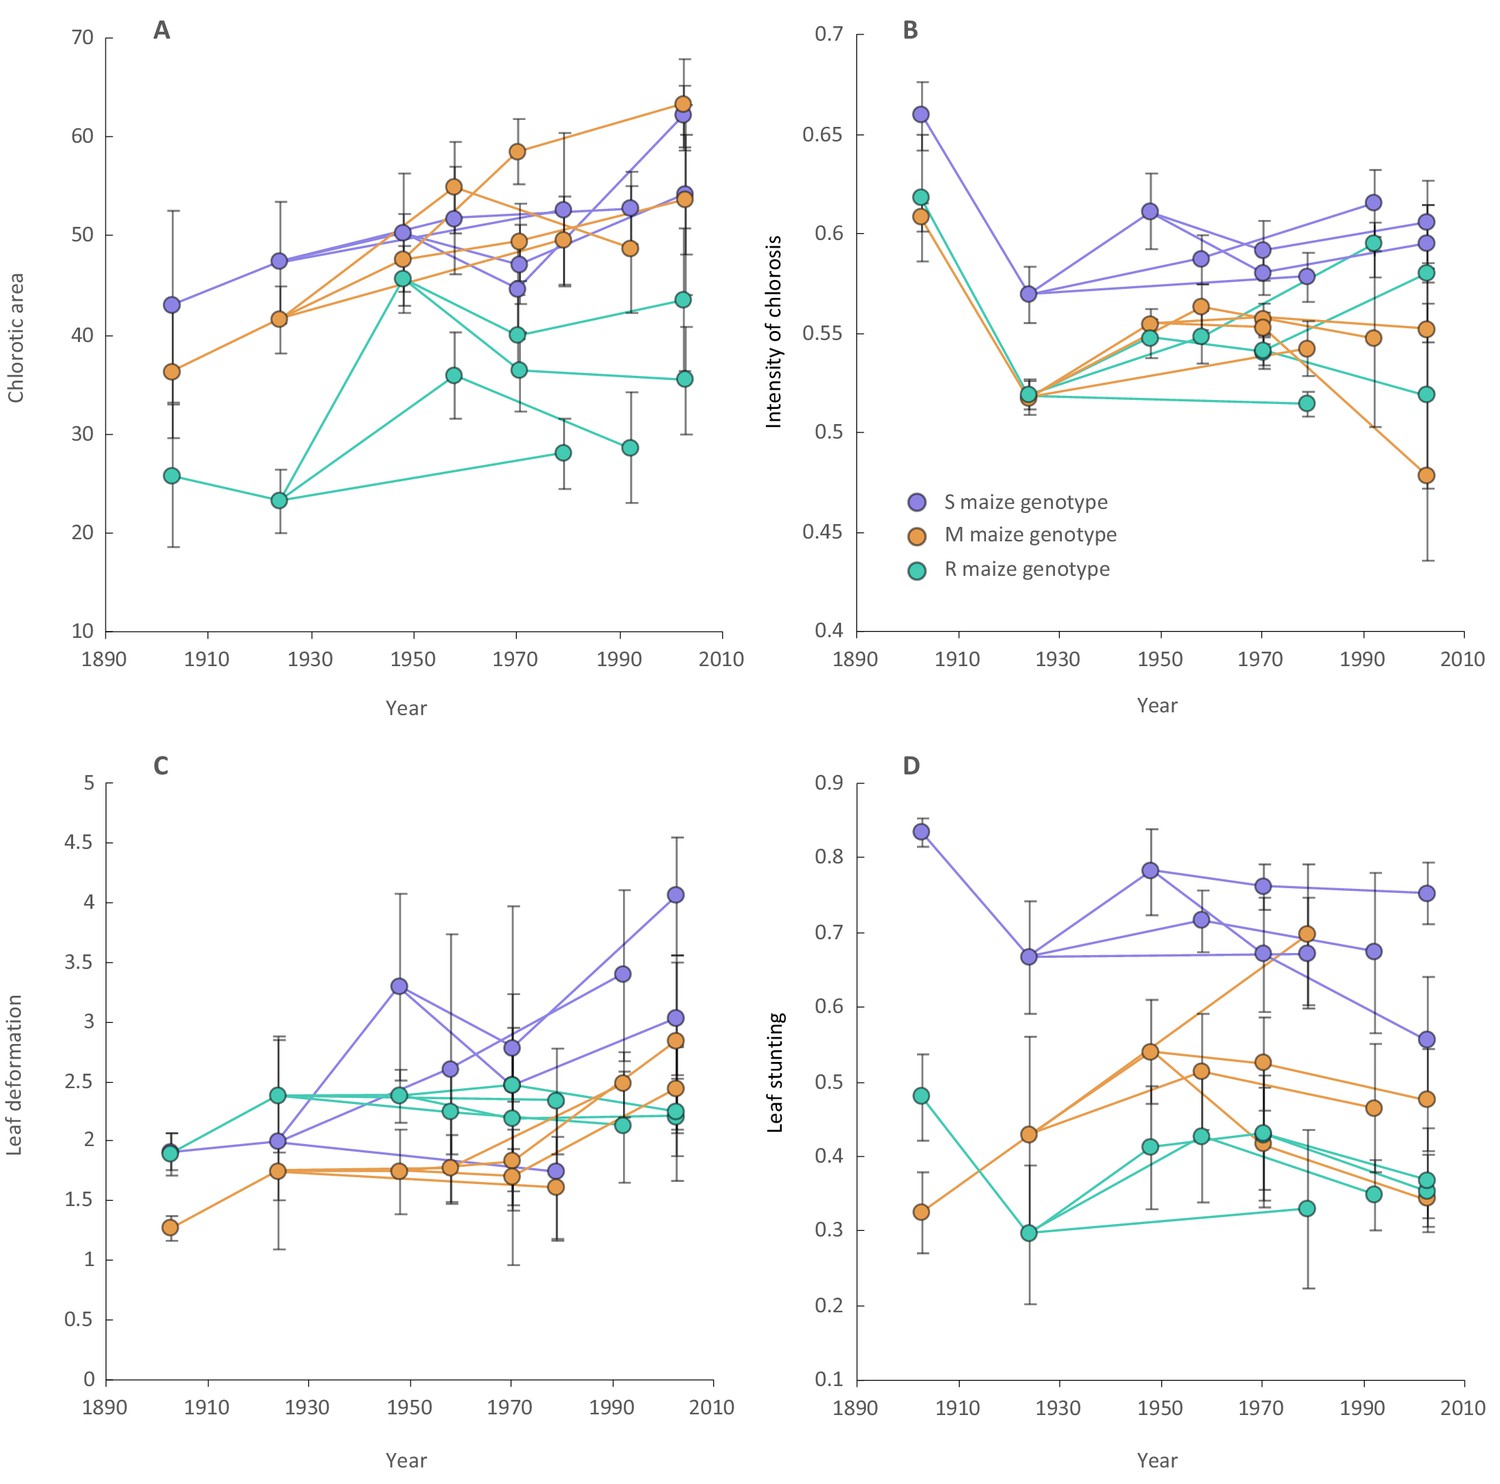
Changes in MSV-A symptom intensities over time across viral lineages descending from the most recent common ancestor of all known MSV-A isolates.
Included here are mean symptom measurements for individual synthesised approximations of ancestral MSV-A isolates (all of which existed prior to 1975) and means of symptom measurements of different viruses descending from these ancestral sequences (all of which were sampled between 1979 and 2007). Symptom measurements were made in sensitive (S; in purple), moderately resistant (M; in orange) and resistant (R; in green) maize genotypes. Lines link ancestral sequences (on the left) with direct descendants (on the right). Error bars on each point falling before 1980 are the 95% confidence intervals of the mean of repeated symptom measurements made for an individual ancestral virus in a single maize genotype. Error bars on each point falling after 1980 are the 95% confidence intervals of the mean of averaged symptom measurements in a single maize genotype made for multiple sampled viruses that all descended from a single ancestral virus.
Figure 2—figure supplement 4
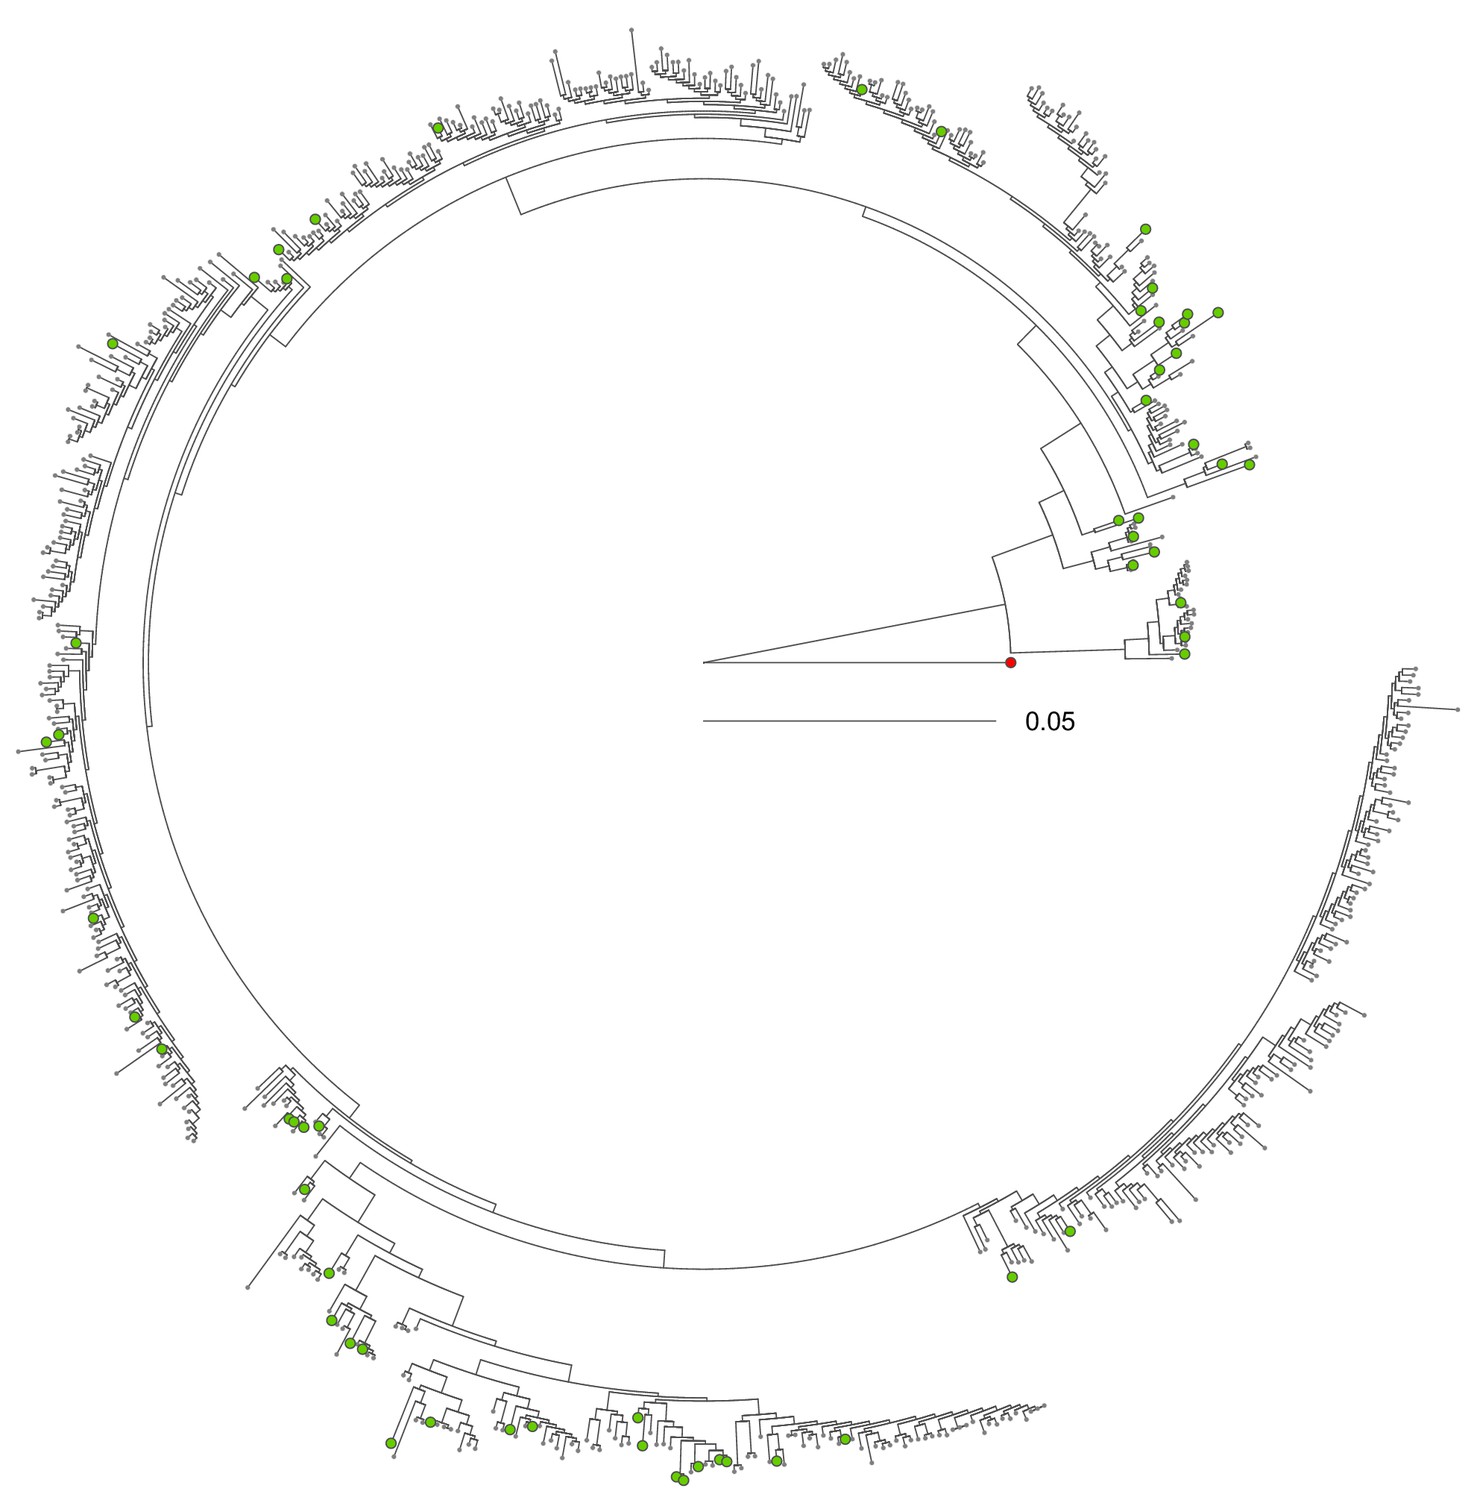
Maximum likelihood phylogenetic tree indicating the evolutionary relationships between the 59 MSV-A isolates selected in this study and all other available MSV-A isolates.
Selected MSV-A isolates are highlighted with green tip circles and the MSV-B outgroup is represented with a red tip circle.
Figure 3
Continuous character mapping of symptom intensities, leaf deformation (A) and leaf stunting (B), onto the MSV-A maximum clade credibility tree.
Symptom intensities of ancestral viruses were phylogenetically inferred based on those observed in sensitive (S), moderately resistant (M) and resistant (R) maize genotypes infected by 59 MSV-A isolates and one MSV-B isolate (the outgroup), sampled between 1979 and 2007. The intensities of symptoms are represented by coloured branches on a grey-scale. ‘A0-A6’ indicate the ancestral nodes of the constrained clades for which MRCA sequences were inferred, synthesised and used to verify symptom intensity estimates. For each maximum clade credibility tree, we also report Pagel’s λ values (Pagel, 1999), which indicate the degree of phylogenetic signal associated with the various symptom measurements.
Figure 4

Inferred changes in MSV-A symptom intensities since 1900.
The solid lines indicate the median values across the tree through time, and the shaded polygons represent the 80% highest posterior density (HPD) credible intervals: purple for the sensitive maize genotype (S), orange for the moderately resistant maize genotype (M) and green for the resistant maize genotype (R). Symptom intensities were here obtained from the phylogenetic analysis performed without including the MSV-B outgroup.
Figure 5

Regression analysis of the inferred and observed symptom intensities of synthesised ancestral MSV-A variants.
Dots are coloured according to the maize genotype in which symptom intensities were inferred: purple for the sensitive maize genotype (S), orange for the moderately resistant maize genotype (M) and green for the resistant maize genotype (R). Vertical error bars reflect 95% credibility intervals of symptom intensity inferences for ancestral MSV-A variants, horizontal error bars represent 95% confidence intervals of the mean of observed symptom intensity measurements for synthesised versions of the ancestral MSV variants. The grey line has a slope = 1.0 and a y-intercept = 0: whereas points centred on this line would represent perfectly accurate inferences (i.e. instances where inferred symptom intensities = measured symptom intensities), those with associated error bars that intersect this line have credibility/confidence intervals that include coordinates where the inferred and observed symptom intensities are equal. Fitted regression lines are given in orange with slope parameters, Y-intercept parameters and Pearson’s R2 values given on the bottom right of each graph.
Author response image 1
Tables
Author response table 1
| Genotype | Analysis | Chlorotic area | Intensity of chlorosis | Leaf deformation | Leaf shunting |
|---|---|---|---|---|---|
| S | with outgroup | 0.545 [0228-0.847] | 0.289 [0.026-0.582] | 0.456 [0.113-0.799] | 0.608 [0.300-0.900] |
| without outgroup | 0.547 [0.228-0.852] | 0.293 [0.029-0.590] | 0.460 [0.117-0.803] | 0.609 [0.288-0.895] | |
| M | with outgroup | 0.503 [0.185-0.818] | 0.658 [0.347-0.928] | 0.217 [0.006-0.506] | 0.549 [0.214-0.870] |
| without outgroup | 0.501 [0.182-0.805] | 0.661 [0.352-0.927] | 0.215 [0.006-0.492] | 0.549 [0.222-0.880] | |
| R | with outgroup | 0.561 [0.216-0.892] | 0.428 [0.138-0.718] | 0.400 [0.031-0.782] | 0.403 [0.042-0.774] |
| without outgroup | 0.557 [0.214-0.886] | 0.426 [0.141-0.727] | 0.399 [0.036-0.790] | 0.405 [0.057-0.783] |
Author response table 2
| Genotype | Analysis | Chlorotic area | Intensity of chlorosis | Leaf deformation | Leaf shunting |
|---|---|---|---|---|---|
| S | with outgroup | 46.9 [35.9, 58.0] | 0.604 [0.578, 0.623] | 2.459 [2.064, 2.950] | 0.784 [0.629, 0.872] |
| without outgroup | 50.4 [40.3, 60.3] | 0.604 [0.579, 0.627] | 2.512 [2.038, 3.189] | 0.800 [0.636, 0.887] | |
| M | with outgroup | 37.9 [21.3, 54.9] | 0.557 [0.492, 0.621] | 1.789 [1.616, 1.968] | 0.526 [0.440, 0.603] |
| without outgroup | 42.3 [27.0, 58.1] | 0.558 [0.485, 0.628] | 1.801 [1.620, 2.018] | 0.522 [0.421, 0.608] | |
| R | with outgroup | 24.3 [12.3, 38.3] | 0.573 [0.525, 0.625] | 1.640 [1.449, 1.934] | 0.362 [0.240, 0.449] |
| without outgroup | 26.4 [14.7, 40.9] | 0.573 [0.519, 0.627] | 1.732 [1.433, 2.100] | 0.386 [0.280, 0.462] |
Additional files
-
Supplementary file 1
Regression analysis of mean inferred vs observed symptom trait values.
- https://cdn.elifesciences.org/articles/51984/elife-51984-supp1-v2.docx
-
Supplementary file 2
Sites within ancestral sequences that could not be determined with a high degree of confidence (sites with a posterior probability of <0.8 in all attempted ancestral sequence inferences).
- https://cdn.elifesciences.org/articles/51984/elife-51984-supp2-v2.docx
-
Supplementary file 3
MSV isolates for which symptoms were quantified.
- https://cdn.elifesciences.org/articles/51984/elife-51984-supp3-v2.docx
-
Supplementary file 4
Dataset properties, numbers of generations used and standard deviations (SD) of split frequencies achieved during Bayesian inference of ancestral sequences.
- https://cdn.elifesciences.org/articles/51984/elife-51984-supp4-v2.docx
-
Transparent reporting form
- https://cdn.elifesciences.org/articles/51984/elife-51984-transrepform-v2.pdf
Download links
A two-part list of links to download the article, or parts of the article, in various formats.
Downloads (link to download the article as PDF)
Open citations (links to open the citations from this article in various online reference manager services)
Cite this article (links to download the citations from this article in formats compatible with various reference manager tools)
Symptom evolution following the emergence of maize streak virus
eLife 9:e51984.
https://doi.org/10.7554/eLife.51984


